DOI:10.32604/jbd.2022.021744
| Journal on Big Data DOI:10.32604/jbd.2022.021744 | |
| Article |
A Survey on Methods and Applications of Intelligent Market Basket Analysis Based on Association Rule
King Abdulaziz University, Jeddah, 21589, The Kingdome of Saudi Arabia
*Corresponding Author: Monerah M. Alawadh. Email: malawadh1@ksu.edu.sa
Received: 18 October 2021; Accepted: 23 November 2021
Abstract: The market trends rapidly changed over the last two decades. The primary reason is the newly created opportunities and the increased number of competitors competing to grasp market share using business analysis techniques. Market Basket Analysis has a tangible effect in facilitating current change in the market. Market Basket Analysis is one of the famous fields that deal with Big Data and Data Mining applications. MBA initially uses Association Rule Learning (ARL) as a mean for realization. ARL has a beneficial effect in providing a plenty benefit in analyzing the market data and understanding customers’ behavior. An important motive of using such techniques is maximizing the business profit as well as matching the exact customer needs as closely as possible. In this survey paper, we discussed several applications and methods of MBA based on ARL. Also, we reviewed some association rule learning measurements including trust, lift, leverage, and others. Furthermore, we discuss some open issues and future topics in the area of market basket analysis and association rule learning.
Keywords: Intelligent market basket analysis; association rule learning; market basket analysis; apriori algorithm; association rule measurements
From the growing corner stores of the 1900 s to modern superstores the shopping experience has changed. The transition led to a new age of international competition and business opportunities. Consumers currently have a broad variety of options, in virtually every sector simultaneously. Also, Consumers can choose from a wide variety of items in the same sector irrespective to the season and other obligations [1,2]. All these options provide the businesses to have an unlimited set of possibilities for enhancing sales and services. However, these possibilities also open up the path for the new competitors entering the market. This leads to a more tough competition than before [1,3,4]. Therefore, to cope up with such scenarios, the retailers are adopting progressive marketing strategies at a rapid pace to have a chance to retain their market share [5].
Market Basket Analysis (MBA) has shown remarkable adoption in both developed and developing countries. In the current time, many multinational retailers’ stores are using different techniques of MBA to achieve higher profits [6]. Furthermore, it is not possible to accomplish a MBA without knowing your customers, demands of the market, individual behavioral attributes, and changing environment. For all this, the key element is obtaining the data about the customers’ purchases, choices, and demands based on their behavior [2,7]. The growth of the amount of data has grown exponentially in the past few decades [2]. There are loads of data generated daily that may appear irrelevant and thus are ignored by the customers, however, as for enterprises that seek to tap more profit they should utilize such data to turn it into relevant and meaningful information. The terminology used for such a process in which an irrelevant stream of data is transformed to generate relevant information is Data Mining (DM) or Knowledge Discovery and Data (KDD) [8]. DM has the capability of retrieving meaningful information from large volumes of repositories of data. DM has covered almost every aspect of life, from education, manufacturing, business to weather forecasting, in recent times [9].
Association Rule Mining is one of the conventional data mining techniques as well as Neural Networks, Classification Models, Clustering, Sequence Discovery and many more. For the MBA, the researchers commonly prefer ARL and clustering techniques, as these have shown better results over the period. However, recent studies are also influenced by hybrid approaches such as Swarm Intelligence (SI), Genetic Algorithms (GA), and Evolutionary Computation (EC) [10–13].
In this survey, we aimed to show the importance of association rule mining in the area of market basket analysis through presenting difference applications in various field. We tried to highlight some methods and techniques used for association rule mining and visualizing. This paper divided into five major sections. First, a background about data mining, association rule mining, and market basket analysis is presented in Section II, where we explain some relevant parameters. Then, Section III constitutes a literature study in the field of market basket analysis applications based on association rule mining. The study of twenty quartiles or ISI journal papers from the last five years is presented in Tab. 1 as a summary of the literature. Sections IV, and V consist of discussion and open research areas respectively. Lastly, Section VI is the conclusion of the paper.
In this section we will give an overview on data mining and market basket analysis as well as explaining some relevant parameters.
Data mining methods have been used successfully in different fields so far. For instance, in the marketing world, fraud detection, health insurance,…etc. Data mining techniques can also go further and continue to prevent fraud and maltreatment in different field. In the health care sector, pharmaceutical providers may take better actions on consumer service, doctors recognize appropriate procedures and best practices, and consumers are given safer and affordable medical services [11,14,15].
Recently, data mining is very helpful in the marketing field epically in basket analysis and consumer segmentation. Consumer segmentation includes the separation into smaller consumer segments with the total client pool, comprising with identical customers in each particular segment. This technique of segmentation is useful for identifying and grouping customers based on their attributes and qualities [16].
Moreover, the analysis of transactional data is one of the most impactful applications for data mining, known as “Association Rule Mining”.
2.2 Association Rule Learning (ARL)
Association rule mining or Association analyzes, which are widely used for the market basket analysis, is also known as the affiliation analysis or the association rule extraction [12]. At present, ARL is the most convenient approach to analyze market basket dataset, where there is a considerable number of sales transactions. Each transaction is a list of objects in a documented transaction ledger. Transaction, in general terms, is an arrangement, agreement, or small portion of sale. A traditional purchase in the field of marketing consists of a collection of items bought at a sales shop. Usually, all the information of a particular transaction is entered in the database for storage. Including item’s prices, quantities, some user information,.…etc. [17].
Association Rule is the relationship between items in one sale shop or supermarket. Before introducing support and confidence values, let discuss some terms. Let I be a set of n attributes called items, I = {i1, i2, …, in}. Let D = {t1, t2, …, tm} which is a set of m transactions (the database). Each transaction in D contains a subset of the items in I and has a unique transaction ID. A rule is defined as a connotation of the form A → B where A, B
2.3 Quality Measures of Association Rule
The association rule learning resulting matrix typically ends up being big and scattered (this differs from one ARL algorithm and another), however, this led to the need of some evaluation measures of the resulting matrix. The existence, purpose, and power of an association rule are generally described in two indices: presence or nature and strength of a rule [12].
The most knowing quality measures of association rule are support and confidence [11]. Association rules are usually extracted based on these two measures:
Support
The item or itemset is assisted by the proportion of transactions comprising the item or itemset in the dataset. Some rules may have low support value under circumstance. A rule with low support may also has little commercial value, as marketing of products “seldom bought together” would not be lucrative [8]. Eq. (1) shows the support value indicating the ratio of receipts contains A and B between sales slips in database D.
The support value can be calculated as the probability of having A (can be an individual item or a sets of items) and B A (can be an individual item or a sets of items) together in same transaction in the database, divided by the total number of transaction. Moreover, the support value of individual item is usually greater than the support of this item aggregated with another item: ex: supp (A) ≥ supp (AB) [18].
Confidence
Confidence value indicates the strength of the rule. It is characterized as the conditions that indicate that the left-hand side transaction contains right hand side as well. Causality does not automatically mean the assumption made by an interaction statute. Instead, it indicates a clear co-occurrence between the preceding and consequent objects [19]. Eq. (2) shows the formula of calculating the confidence vale.
The confidence value can be calculated as the probability of having A (can be an individual item or a sets of items) and B A (can be an individual item or a sets of items) together in same transaction in the database, divided by the probability of having A in in any transaction (occurrence of A in D). Moreover, if the supp (A) ≥ supp (B) then definitely the conf (A → B) ≤ conf. (B.→ A) [18].
The effectiveness of an association rule is determined by confidence and support. Since the repository of data is enormous, there is an increased probability that too many unimportant rules have no benefit to the cause of marketing. To avoid these errors, the author in [9] establish a support and confidence level after evaluation, such that only useful and relevant rules are generated [9].
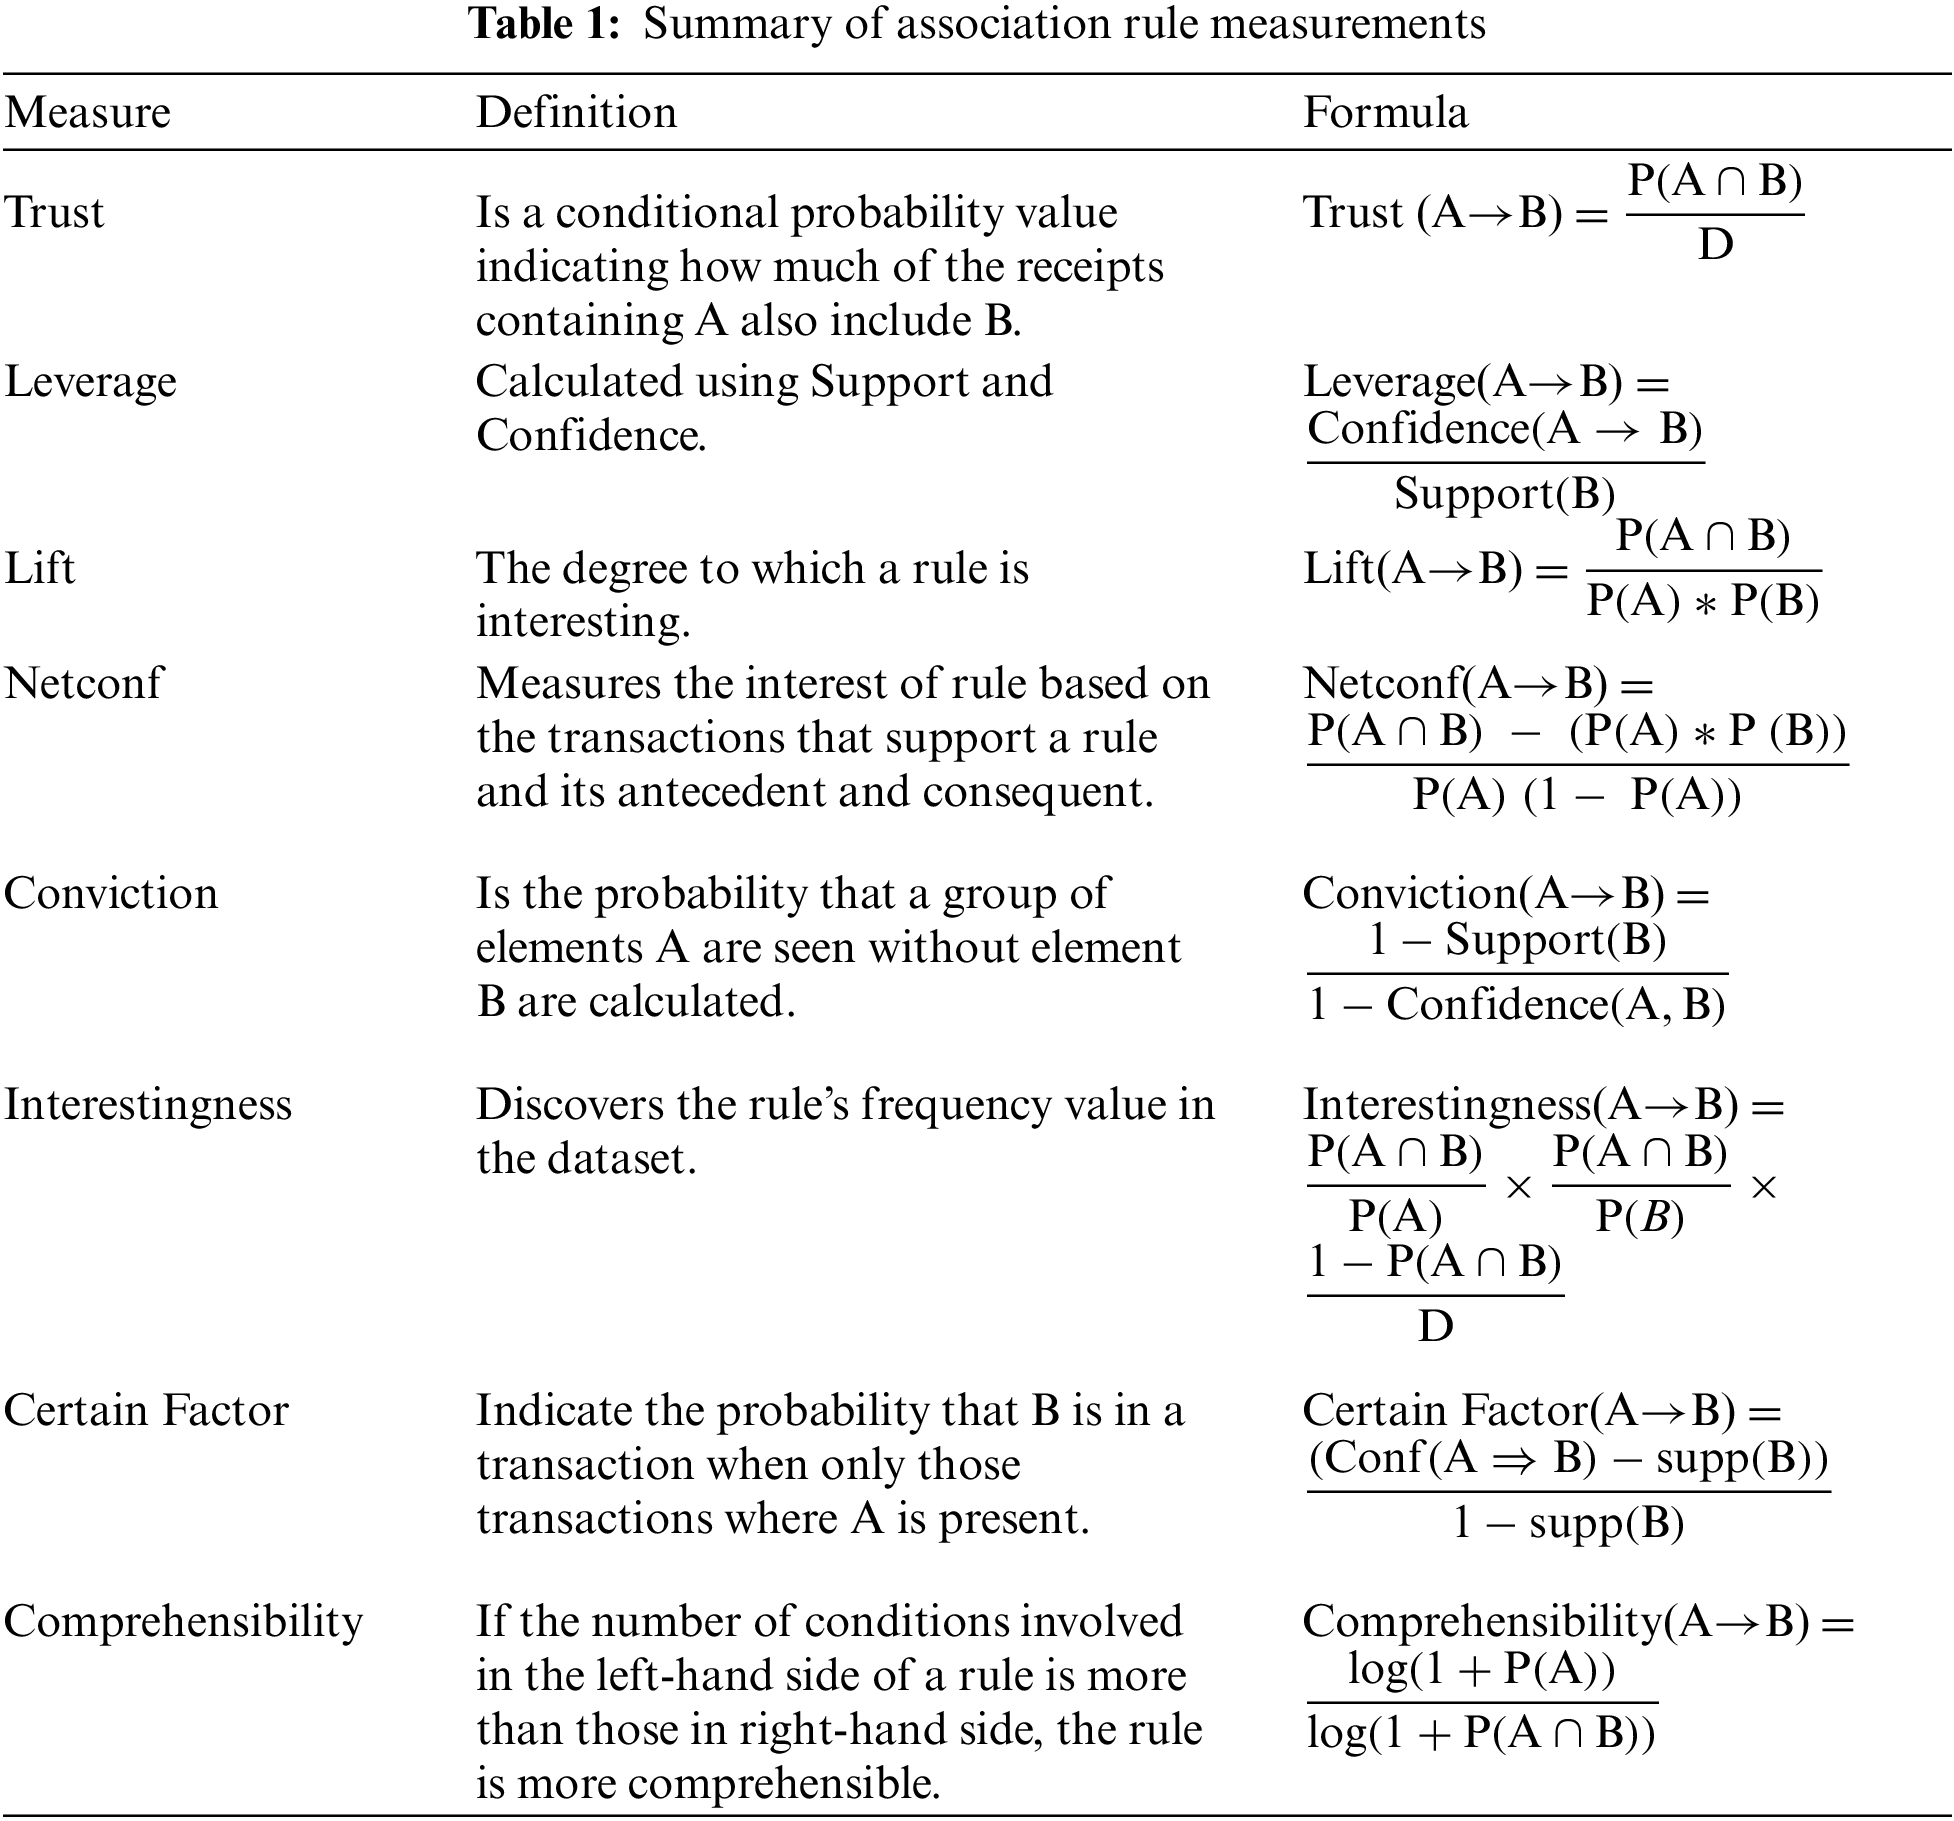
There are other quality measures for association rule identifying the interesting level of a rules. They are trust, leverage, lift, Net confidence, conviction, Interestingness, and Comprehensibility. These extra measures give more insight about the rule generated by any algorithm. Tab. 1 summarizes these measures.
Below is some explanation of each measure [11, 20–23] and [18].
Trust: This value measures the extent to which a rule is good at guessing which item will show on its right-hand side. But if the item on the right-hand side are common item, the rule might not be interesting for analyst.
Levereg: For the Levereg value, if it is greater than 1 this mean there is a positive association between those products (A and B appear more together than expected). So, the rule is interesting, for example: if a leverage value is greater than 1 in a two-product rule, the sale of one product may increase the sale of the other product.
On the other hand, if the Levereg value less than 1, this mean a negative correlation between A and B products. Usually, rules with leverage less than 1 are ignored. Finally, if the Levereg value = 1, that mean there is no correlation totally (independence).
Lift: This value is first gathered when knowledge is given on the presence or not of interaction between A and B or whether the relationship is positive or negative. If the Lift value is less than 1 OR greater than 1 then that means, there is an interest on the corresponding association rule. If the Lift value equal 1 then this indicate that there is no interest.
Netconf: This measure takes value between −1 and 1. It tests the importance of ARs on the basis of transactions that support the rule and its antecedent and consequential. Netconf has the ability to recognize and prevent misleading rules which are not recognized by confidence value.
Conviction: Conviction tests the dependency between A and the absence of B (¬B OR Not B). The problem of this measurement is determining the Conviction levels (threshold value) for rules is a difficult task due to its infinity domain. If the Conviction value is equal to 1 then A and B are independent of each other. And if the Conviction value is less than 1, then the related rule can be established.
Interestingness: This measure takes value between 0 and 1. The actual method of calculating the Interestingness value is to divide the dataset based on the existence of each attribute in the left-hand side of the rule. A rule consequent (right-hand side of the rule) Can contain different number of attributes that are not predefined. But this method could be impossible for ARL. So, this value being measured using the support values of the antecedent and consequent as presented in the table.
Certain Factor: Certain Factor is indicated as a measure of the probability that B is in a transaction when only those transactions where A is present are considered. It is calculated using the support and confidence formula. Certain Factor has the ability to recognize and prevent misleading rules which are not recognized by confidence value.
Comprehensibility: Comprehensibility test the clarity of a rule. If the number of conditions involved in the following part of a rule is greater than those in antecedent part, the rule is more comprehensible. Comprehensibility usually takes value between 0 and 1.
2.4 Market Basket Analysis (MBA)
Market basket described as a collection of products that a customer buys together during a single shop visit. On our visit to a supermarket, we sometimes purchase and bring several different items in a single basket from individual categories. This known as one unique purchase [24]. Market Basket Analysis (MBA) is the best technology for analyzing and finding relationships and trends among the supermarket products. Moreover, the study of the market basket involves numerous analytical methods to discern similarities and correlations between individual products, to uncover client attitudes and ties between items. Moreover, market basket analysis is used for marketing purposes based on the principle that once a buyer purchases a collection of products, he or she may purchase a further category of items more (sometimes less). For instance, it is understood that, in most situations a client often selects bread while buying milk. The firms that market their goods are involved in specific patterns that are made in purchasing. To implement innovative marketing or sales approaches to enhance the value of the companies around the world and consumer interactions, retailers or warehouses would like to examine the products being bought collectively [25]. Several shopping sectors focus more on what their buyers purchase. However, when a customer purchases it, they disregard the reality of behavior. That is indeed a significant influence on consumers’ shopping behavior [8]. The key emphasis of the MBA is not only “what”, but also “where” the consumer buys. According to magazine marketers, it’s currently the top phenomenon in which time plays a significant role in seeking and anticipate the upcoming global change and data-driven marketing [2]. This will help us foresee a prosperous future for the retail business.
The ARL is a primary method in MBA for applying stock management techniques for upstream transactions and cross-selling. ARL is a preference study used to explain the actions of customers concerning the sorts of transactions that they generate [12]. It has been a data mining methodology that has initially been utilized for marketing intent by collecting correlations and co-occurrences from a sales repository to acquire an awareness of consumer buying behaviors. For instance, consumers hardly purchase a single item when shopping in a supermarket and often more likely to buy a whole food package, mostly from various product categories. This helps us identify unnoticeable, hidden and trigger-intuitive correlations between items or categories. It is possible to distinguish goods and types of items that are acquired collectively, so the specific items can be described as association rules. This organization guidelines require administrators to implement strategic techniques such as the development of initiatives and promotion of different types of products that ultimately leads to more money being invested by consumers based on two separate concepts [9]. A promotional bundle that consists of the purchasing of a significant quantity of the same product or the introduction of new features and the cross-selling of additional items in subcategories [8].
Fig. 1. Classify different approaches for the association rule learning in the market basket analysis field. For the evolutionary algorithmic (EA) approach, genetic algorithms-based and Swarm-based approaches are the most widely used approaches. Recently, there is a wide use of multi-objective evolutionary algorithms too [26]. The association rule learning process considered as a multi-objective problem when the rule evaluation measures have different objectives.
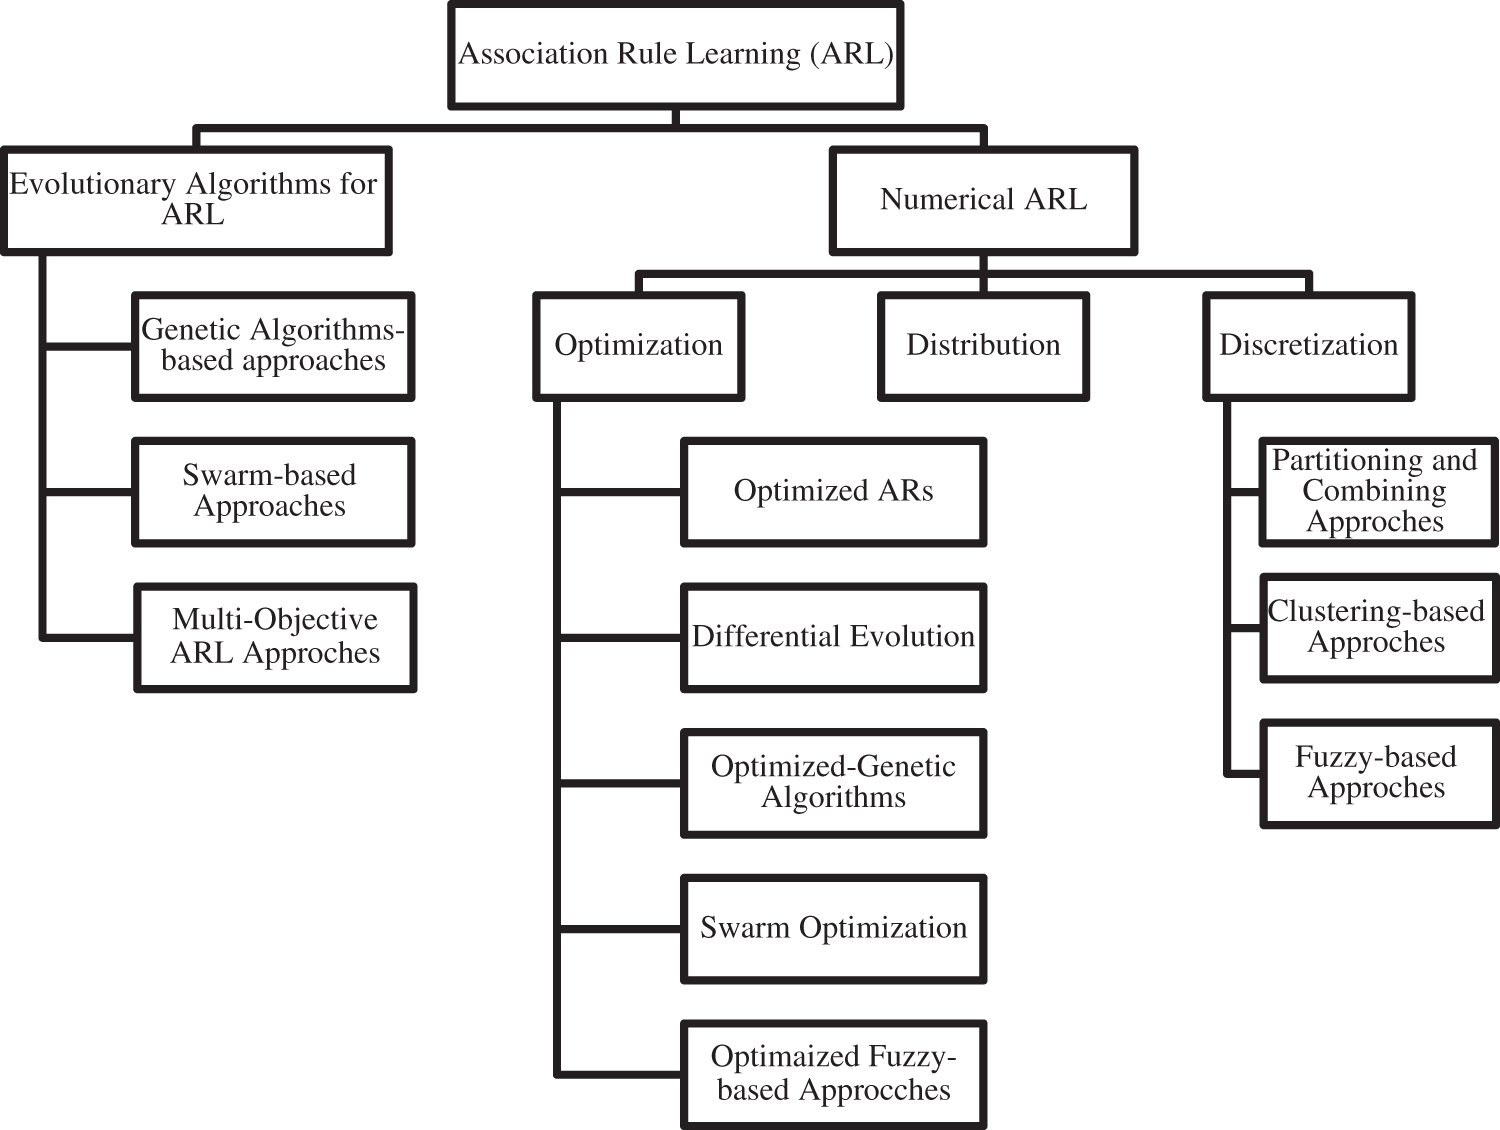
Figure 1: ARL approaches for MBA
Partitioning and Combining is the easiest discretization numerical ARL approach. It is easier to understand as well as to implement but is produced redundant association rules. An effective and alternative approach to find meaningful regions for the discovery of association rules is the clustering-based approaches. Clustering approaches primarily focus on the generation of appropriate intervals using the concept of density variance or dense regions. An efficient hierarchical clustering and visualization algorithm for the association rules is discussed in the literature. For the fuzzy-based approaches, the classical fuzzy techniques for association rule learning used the linguistic terminologies as a bases for defining partitions. Partition points are used to divide neighboring fuzzy sets. But there is an optimization problem in the selection of partition points caused a higher exec-time as the dataset size increases. This problem was solved by modern optimized fuzzy-based approaches [11].
The generic approach for market basket analysis using ARL is illustrated in Fig. 2. The generic approach starts with the combination process -if needed- where the data is combined in one dataset from multi business data sources. Then, if there is any predefined steps or proposed framework for domain knowledge or feature selection method and pruning will be applied. Then, the analysis and rule generation step (list of association rules).
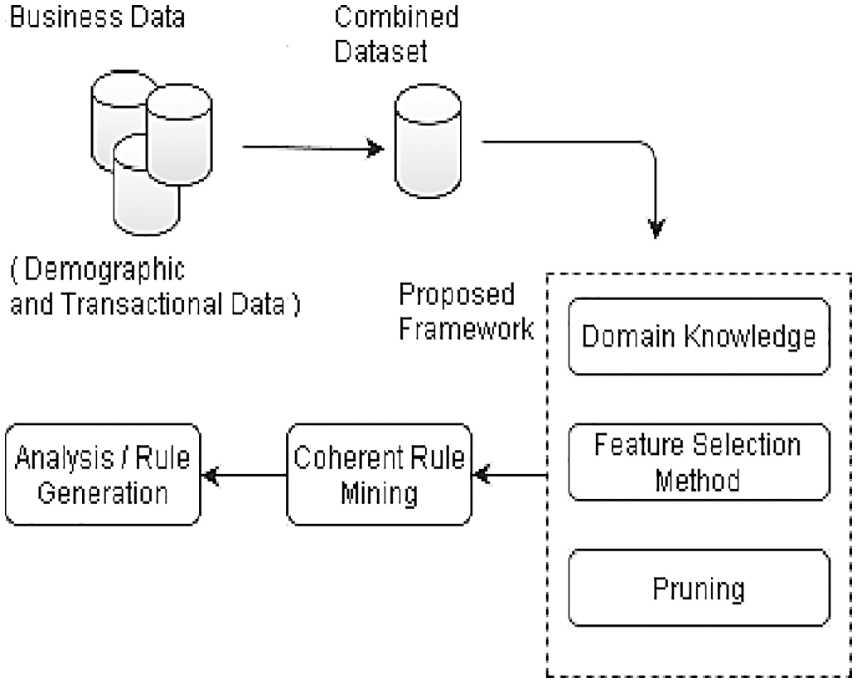
Figure 2: Generic approach for market basket analysis using ARL [3]
The concept of an MBA is not only limited to the supermarket or utility stores. It can also be applied in sports, [19] where MBA is used for the analysis of tactical patterns in Elite Beach Volleyball game. The author proposes a data mining approach combined with Sequential Association Rule Mining (SARM). The dataset was collected from the 400 games played at FIVB between 2013 and 2016. The huge amount of data is distributed into small rallies consisting of three touchpoints by a single team. The clustering technique is used in the post-processing of SARM, producing ordered rules data for each defined rally. More work is still required to reduce the complexity of the model because more post-processing steps refine the rules in better form with complexity overload [19].
The authors in [21] used MBA with ARL techniques in the healthcare field. This research was to identify the metabolic profiling of a human-based on the diet intake. The authors claim that this is the first use of MBA in metabolomics field. The researchers used Nuclear Magnetic Resonance (NMR) to obtain transaction data of the diet intake. They measured the chemical data using NMR and plasma optical emission spectrometer. Based on the diet analysis and MBA, the software suggests the calories intake and burn habits, thus avoiding disease procurement at initial stage. Moreover, in this study, the data were divided into three classes of high, low, and null. In addition to that more than 5 million rules were identified with approximately 4000 selected by applying a threshold value of high confidence. Based on these rules, humans can plan their dietary routines [21]. The work in [22] also is related to healthcare, it discusses the dietary habits of children in schools in the USA. The MBA analysis is performed to generate clusters of variant categories. These clusters can be utilized to plan a dietary routine for different categorize of the children depending on their habits and obesity category [22].
To further strengthen the case of MBA applications, the author in [27] dealt with the sales and promotions in the hospitality sector that could be arguably similar to the supermarket structure. The author proposed the use of a MBA for a prestigious hotel in Australia to enhance sales and promotions other than just marketing the room related services. It is claimed that the MBA produces an upward graph in the sales of the hotel [27]. The methodology reveals the information of the customer relating the nature of the room, the food utilized, time spends, and services attain. All these attributes for a single customer generate one row of a record stored in the database, and ARL can be used on these sets of records to correlate the various services. The retrieved information is also helpful for future promotion plans and services [27].
3.2 Association Rules Representation and Visualization
The visualization enhances the decision-making of a sales manager or analyst by providing deep insight into the correlated products, as discussed by [25,28]. The author in [25] uses MST for the visualization purpose as well for the association rules learning. MST technique which is complementary Association Rules with Minimum spanning tree (MST). This technique complements the search for significant association rules among the set of rules as well as defining the correlation between the products of the same category [25]. This deep insight into the correlation between products of the same category enhances the decision-making of a sales manager or analyst.
Fig. 3. shows the proposed methodology of [25]. The most importance idea in the first step of data pre-processing, is eliminate items with very low appearance. As the author mentioned, it could be not convenient to work with products at a very disaggregated level. Moreover, it is wasting time more than improving the accuracy. In this methodology, edges and nodes distance is calculated while constructing the MST. Nodes importance value is calculated in the step of finding key products. Conclusively, this proposed method has shown its worth in the increase in the sales and the effectiveness of promotional events.
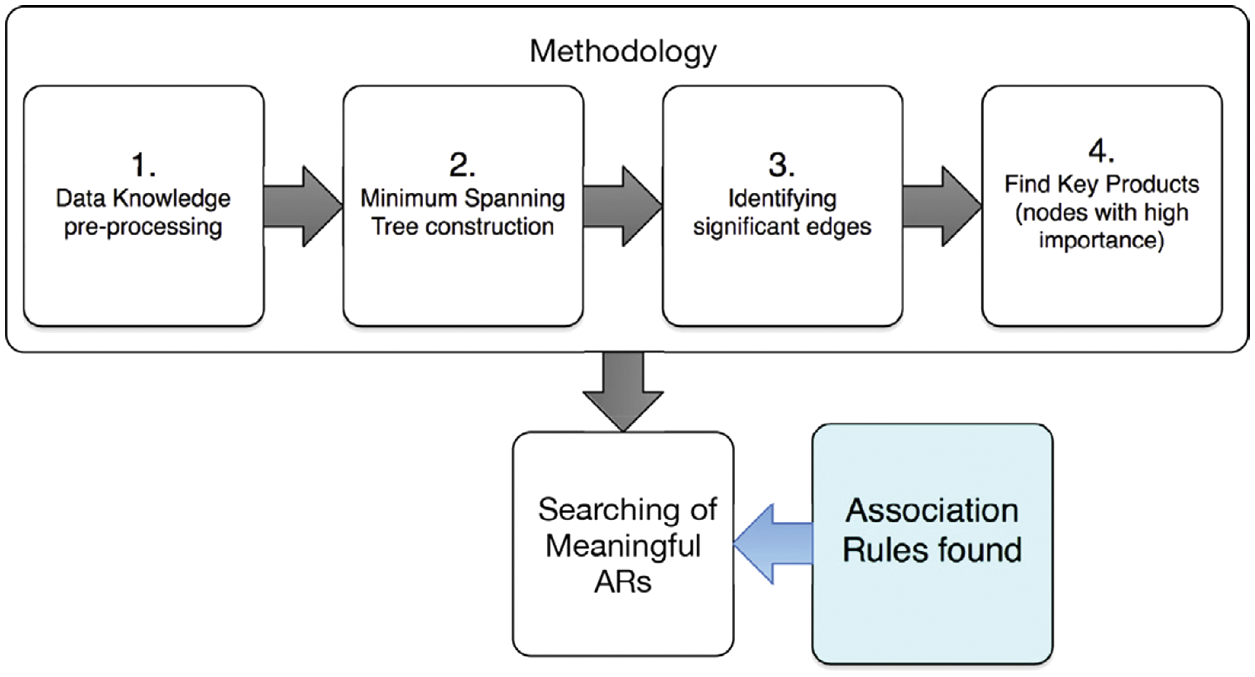
Figure 3: The proposed methodology of [25]
In [28], R language is used to visualize the data gathered by IoT in sales market. The experiment shows a satisfactory accuracy level and a better performance in aspect of visualization data.
Furthermore, [25] proposes a method for the post-processing of association rules. The rules defined in ARL are generally large in numbers, and there is no method to combine complementary rules. Therefore, an expert is always needed to perform and refine the rules in the post-processing of ARL. The author in [23] suggested a group matrix-based visualization method to refine the generated rules with the capability of combining the complementary rules set of items. Thus, creating small to large clusters to organize data according to rules. The R software is used for implementation purposes. The confidence level is scattered between 0.54–0.63 that shows the removal of outliers and a lift of 18.99 at peak max value [23].
Fig. 4. shows an example of the proposed method with k = 20 (number of clusters). In this method of visualization, a balloon plot chart is used. The antecedent groups or the left-hand side of the association rule are represented as columns, while the consequences or the right-hand side of the association rule are represented as rows. The size of the balloon represents the support value, and the darkness represents the lift value of each referenced rule. The cluster containing the most interesting lift rules in Fig. 4 is shown in the top left-most column. For example, the following two rules are belonging to that cluster: {Instant food products, soda} → {hamburger meat}, this rule has a support value of 0.00122, confidence value of 0.631 and a lift value of 18.995. Another rule in the same row and column is {whole milk, Instant food products} → {hamburger meat}, this rule has a support value of 0.00152, confidence value of 0.5000, and a lift value of 15.03823. Another cluster in the same column has only one rule which is: {whole milk, Instant food products} → {other vegetables}, this rule has a support value of 0.001525, and confidence value of 0.5000, and a lift value of 2.58408.
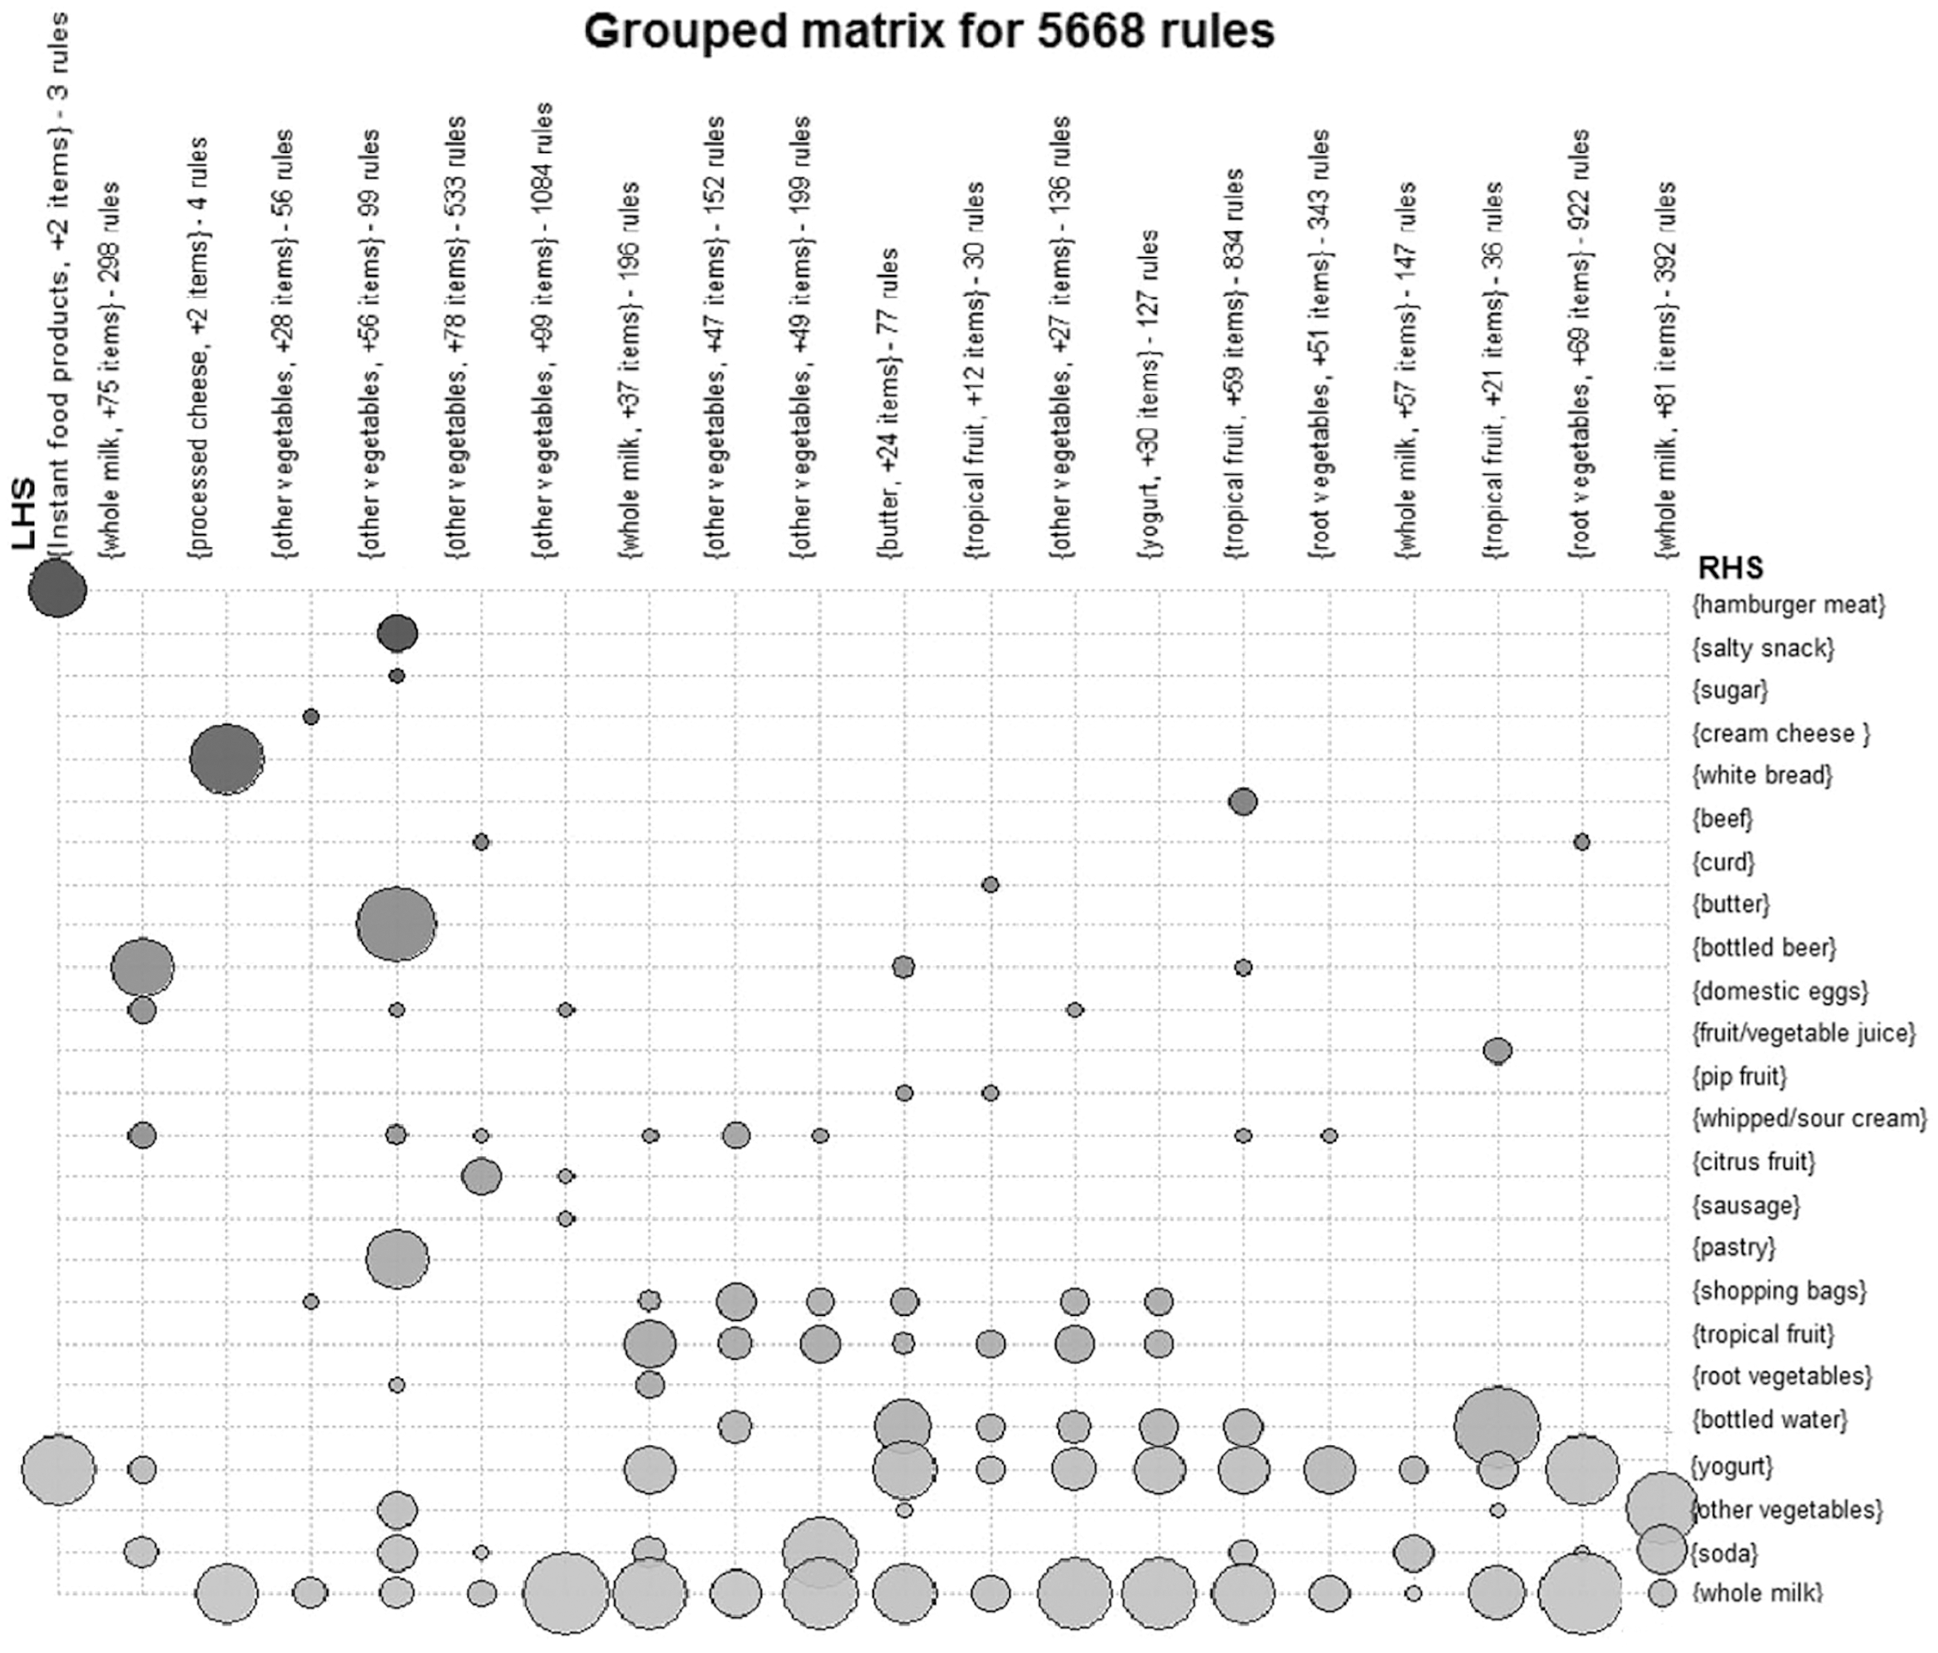
Figure 4: Visualization of grouped matrix provided by [23]
The generated rules are nested as a group in each cluster. This form a hierarchy structure of subgroups to allow the user to drill down for another grouped matrix for any specific cluster and explore the entire set of rules. Fig. 5. Illustrates the concept further.
Similar nature of the task is done by [24] for the visualization of ARL. The visualization is a cumbersome task when it comes to a large amount of transaction data. The two major problems in the visualization of ARL are the cardinality of the set of rules and the proportion of rules complementing each other as antecedent [24]. To address the issue author proposed a visualization technique for simple association rules extraction called Structured Association Map (SAM). SAM follows the clustering structure of the heat map, but the ordering mechanism makes SAM unique for the easy identification of association rules and related information. Moreover, a testing index is also proposed to evaluate the SAM results called S2C. This technique is applied to a data set of a mass health test result. The results of the experiment show that SAM with a high S2C value greatly reduces the difficulty of the association rule analysis through avoiding the irrelevant association rules. The limitation of S2C is its working with 2x2 association rules set [24].
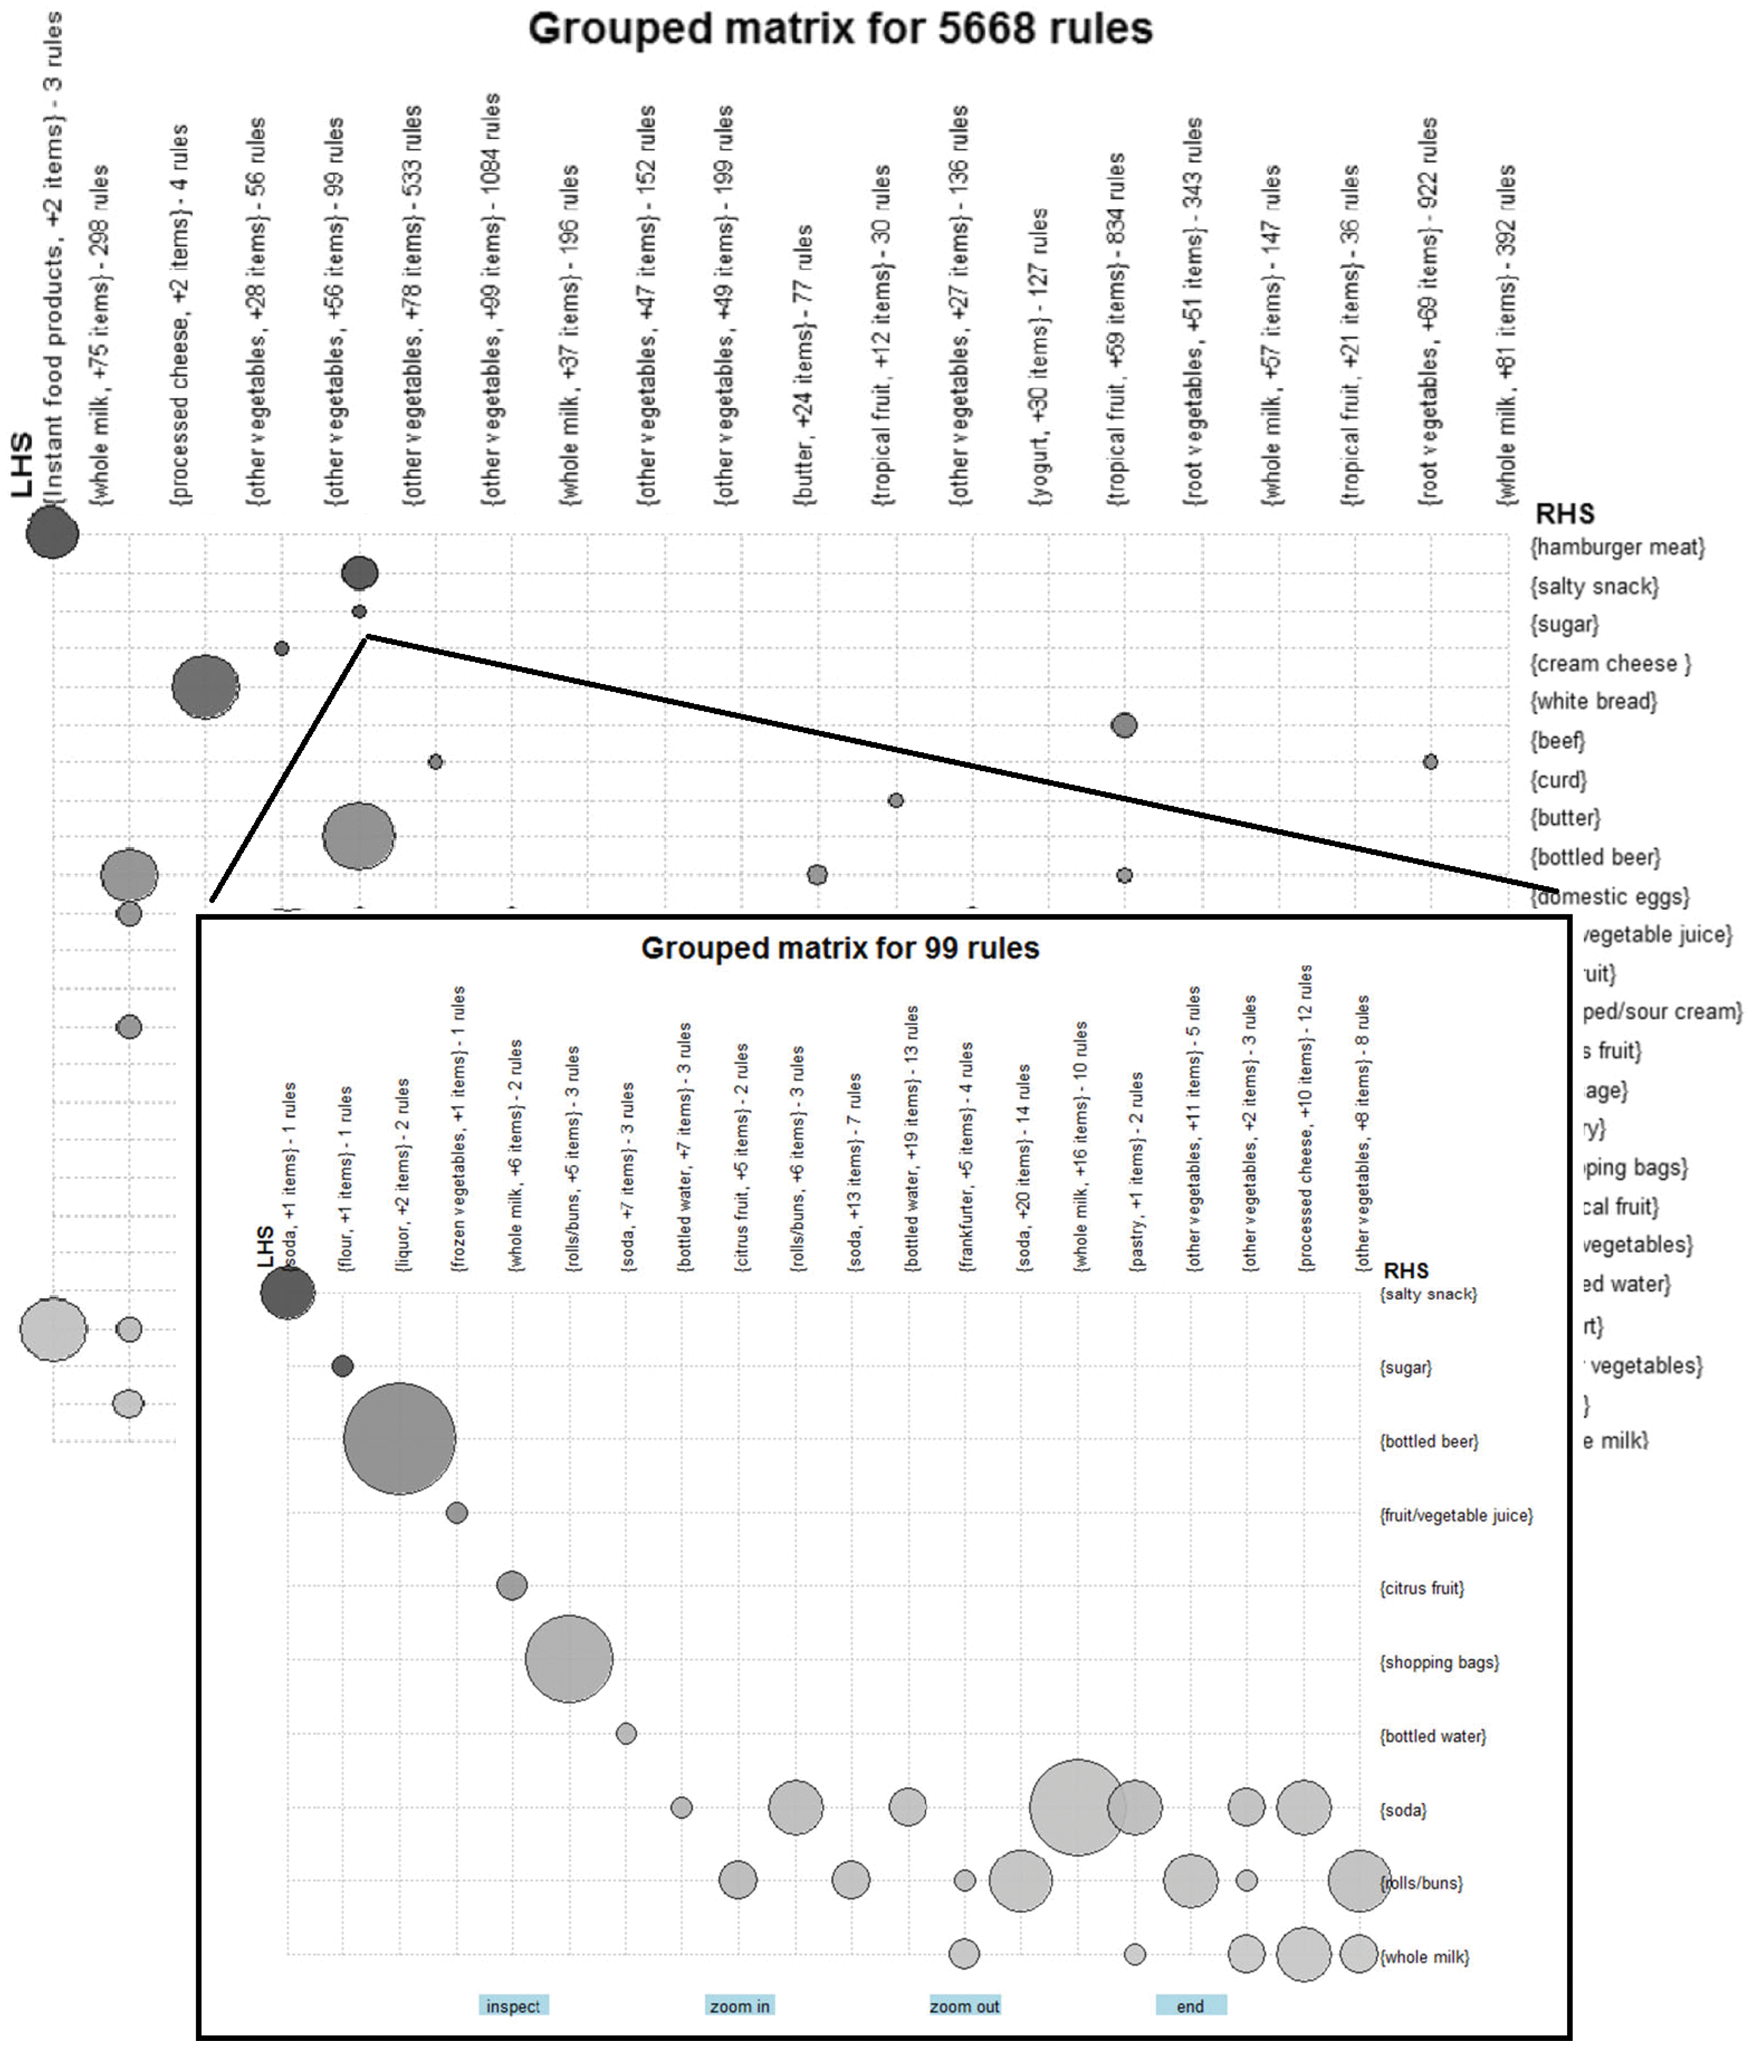
Figure 5: Visualization of sub-grouped matrix provided by [23]
3.3 ARL Implementation, Methods, and Algorithms
Association rule learning was initially implemented using Apriori algorithm. In [20], market basket analysis was done through Apriori and FP-growth algorithms. The authors compared those two algorithms using data of supermarket from Vancouver Island University website. Apriori fails at first level due the categorized nature of data. Therefore, an advancement of Apriori, FP-growth algorithm is used and implemented in Weka tool. There are total of 225 products in the dataset to form the rules. Out of set of rules only 10 are considered passed and assigned with conviction values. It is shown that the Rule 1 is tested in the real scenario and gained confidence level equal to 1 (100% confidence level). Similarly, other rules also proved to be correct and hence the overall activity shows positive figures in sales and profits of the supermarket [20]. A recent study in 2019 [29], also compared these two algorithms (Apriori and FP-growth) with a French Bakery Retail Store and confirms that FP-growth performs better than Apriori in terms of the execution time. Both produced similar association rules. In this study, Transaction Encoder was used to map the dataset into binary item list or NumericToNominal dataset. Here, NumericToNominal is a binary dataset having values either 0 (not purchased) or 1 (purchased). The comparison between those two algorithms were conducted under a minimum support of 0.01 and a minimum confidence of 0.05. The results show that if we use reduction with top 50%-55% selling products, then: the time required for both algorithms decrease, and it gives same rules and almost same frequent item sets for various support levels. So, it is beneficial to use reduction for less computation efforts [29].
A similar type of work is produced by [30] suggesting FP-Tree as a novel data structure to avoid the Apriori bottleneck problem. The frequent pattern mining has nodes representing the most frequent and less frequent items in hierarchical tree order. The model is implemented in python and produced 10% better results as compared to the previous methods [30]. Authors also discuss different fields of MBA and ARL, such as web click data, log files, and questionnaires.
Similar work is proposed by [31] for the frequent itemset data based on time series transactions. The author proposed a modified Apriori algorithm with Time constraint properties of the ARL approach. The modified Apriori algorithm outperformed traditional Apriori in terms of storge space for the time series frequent dataset as shown in Fig. 6.
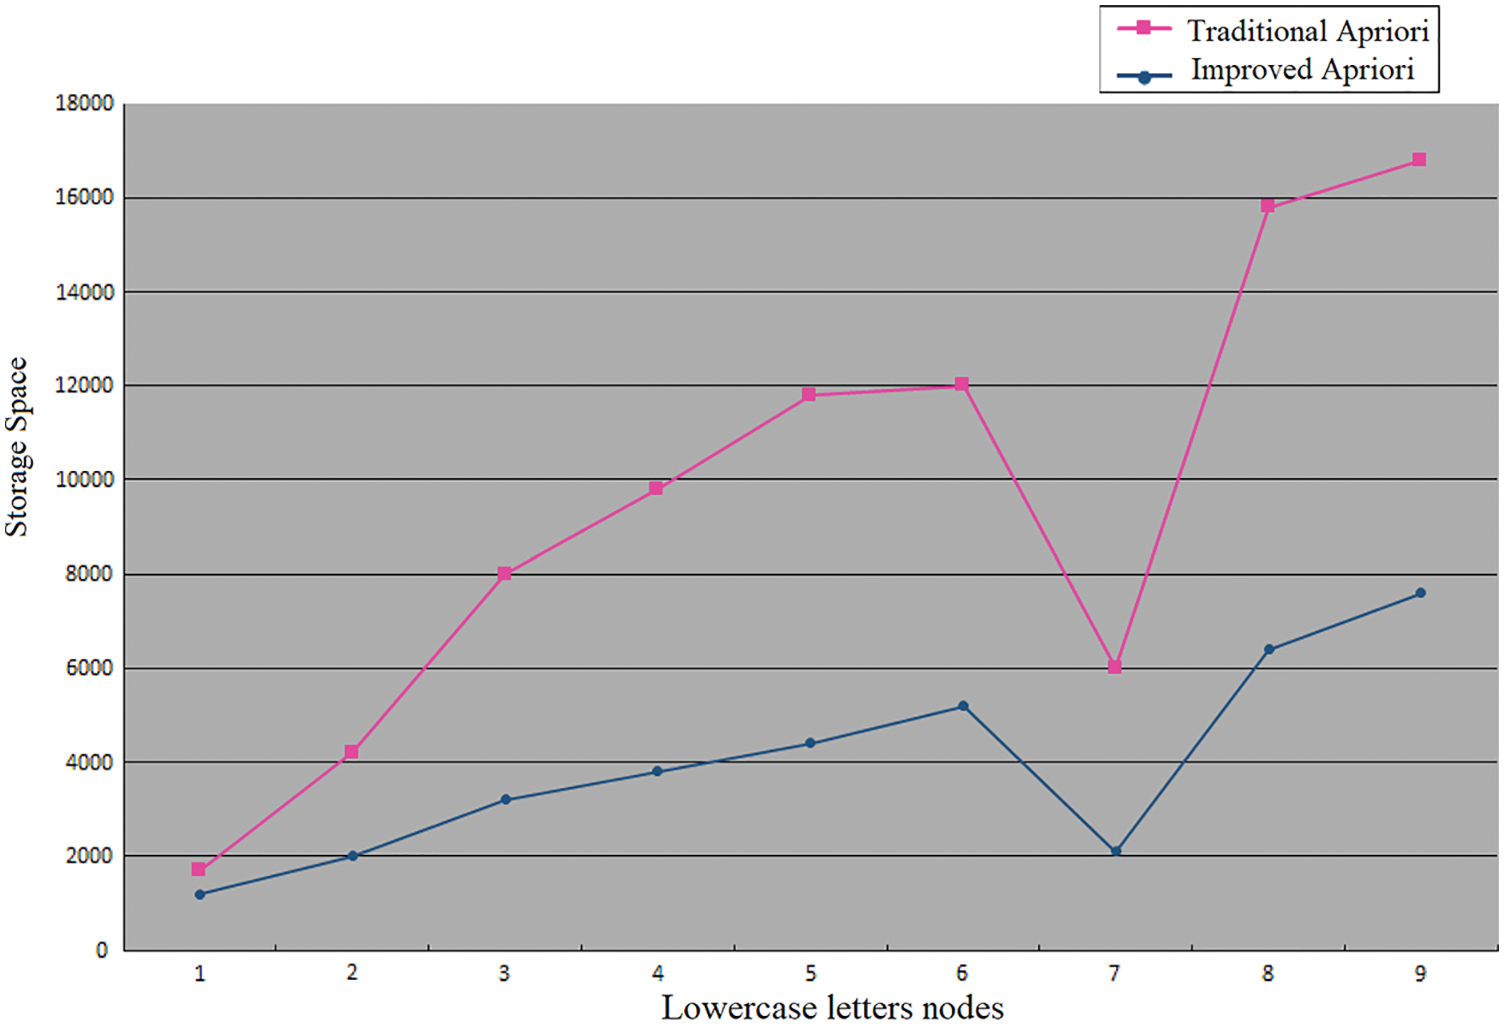
Figure 6: Comparison between the improved frequent itemsets Apriori algorithm and the traditional Apriori algorithm based on storage space [31]
Apriori algorithm is also modified in another article [32] for the MBA of transaction database. The modified Apriori algorithm builds a 0–1 transaction matrix to attain the weighted value of confidence. The modification reduces the time of memory access, the number of I/O operations, and increases the support for rare products. Although the support factor of other products is decreased, this decrease results in the effective extraction of hidden and valuable items [32].
The algorithm proposed by [32] is shown in Fig. 7. The main idea in this proposed improvement is that the database scan of transaction is done only once. Get the transaction identifier set for each item, then before the candidate item sets Ck come out, further prune Lk-1 : count the times of all items occurred in Lk-1, delete item sets with this number less than k-1.
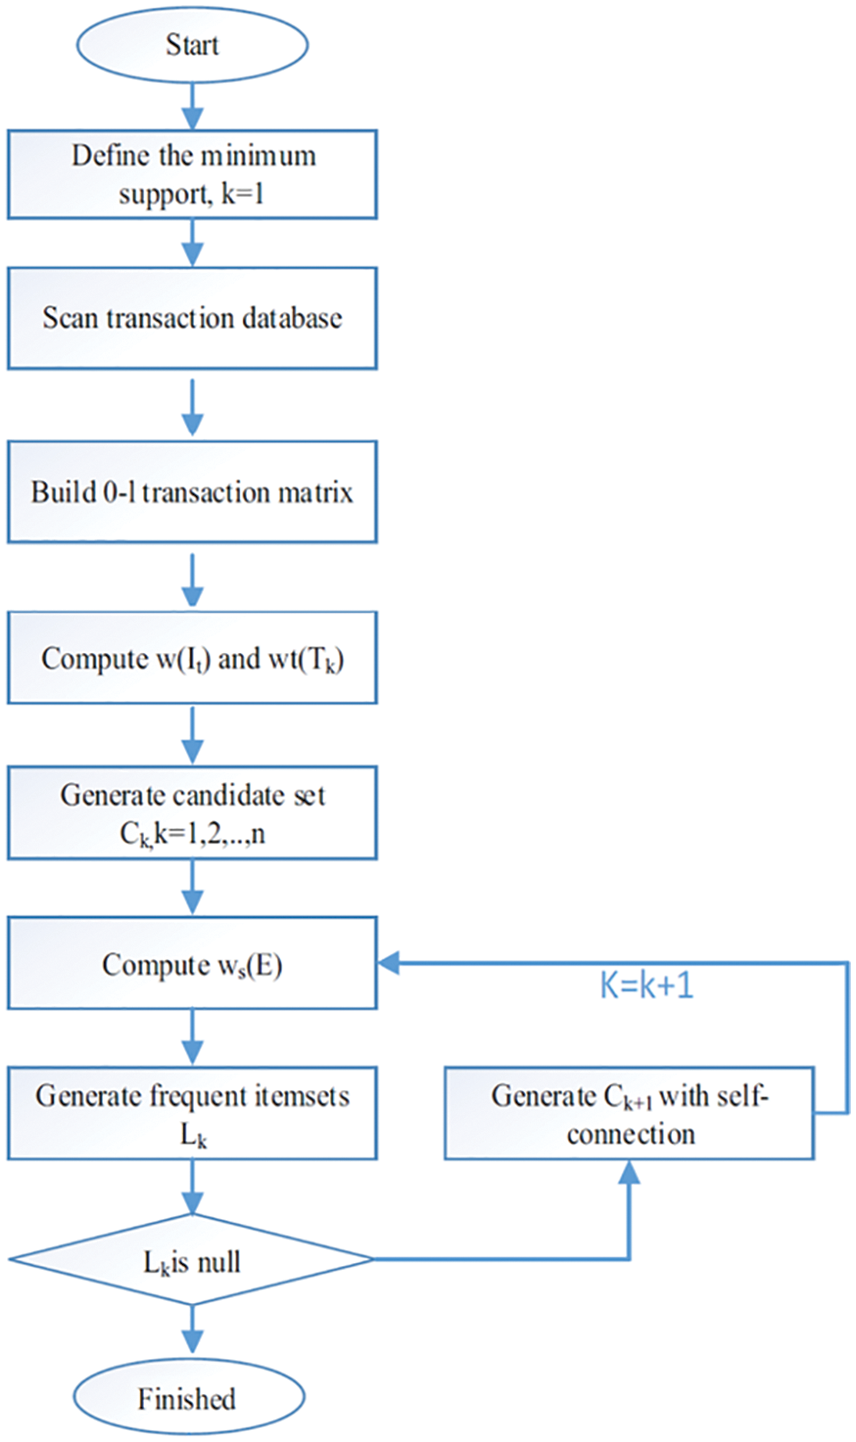
Figure 7: Flow chart of the proposed algorithm by [32]
The ARL and MBA is an important factor to arrange items on a shelf to increase sales. However, it is also critical to increase and identify the pattern of quantity item sale in an invoice. [33] proposes a technique to deal with frequent item sets in the aspect of utility invoice. An extra attribute of quantity and price per quantity of an item is included from the database. A novel NUFM algorithm is suggested for utility mining. The algorithms define rules based on frequent items with their sales per quantity and price per quantity. The algorithm assigns a specific weightage to each transaction for the items selected and quantity taken. The proposed method helps make business decisions with the ordering of shelves [33].
In [18], a comparative analysis is performed for the Uninorm (interestingness measures). This measure taking into consideration 3 factors: which store is, the user information and when (time). So, the transaction in this study is fully detailed as Ts,u,t = I2 I5 …Ii …etc. read as “A unique transaction T occurring in store ‘s’ for user ‘u’, in time period ‘t’, contains items I2 I5… etc.”. The Uninorm was compared with Jaccard measure, Cosine Similarity, and Conviction models of ARL. It outperformed all three on the monotonicity principle. The only acceptable performance by the remaining three on principle is given by Jaccard measure with high antecedent [18].
MBA is a critical factor in the categorization of sales items and decision-making. Through the MBA, the products can be classified on their quantitative and qualitative characteristics. Clustering techniques are applied to classify market basket data by [3] with the assumption that customers buy at most one product from each category. The author uses a genetic algorithm to optimize the generated problem and implemented the model to categorize items in a Czech drug store company. The resulted clusters of items are similar to that of experts’ classification of items. Moreover, the population size is kept to 500 to avoid computational complexity. It is shown in paper [3], that with synthetic data, the model produces more accurate results as compared to the real data that, in some cases affected by individual behavior violations. The test is taken on the whole population and subdivisions of population-based on selecting all categorize and selection half of the categories. However, more than one item selected in all categories is less impacted by the violation rules [3].
With the variant application fields of ARL, it is also to be noted that ARL algorithms can be designed for different computing environments. A survey [12] is conducted to cover the evolution journey of ARL covering sequential computing, parallel and distributed computing, grid computing, and cloud computing. The author provided three classes of sequential computing as Apriori based, Eclat & Clique based, and FP-growth based. Apriori based algorithms generate frequent item sets with candidate item sets generations while FP-Growth based algorithms generate frequent item sets without generating candidate item sets. Eclat & Clique based algorithms are based on equivalence classes & hypergraph clique clustering and lattice traversal schemes [12]. It is also argued that sequential algorithms are enhanced to design parallel and distributed computing algorithms that work for homogeneous clusters. However, when it comes to heterogeneous clustering in distributed and, more specifically, grid computing, the performance of these algorithms faces noticeable degradation. Therefore, novel algorithms are designed for the grid and heterogeneous clustering. For such types of computing and clusters, Hadoop MapReduce provides the basic structure of execution and solves the problem of memory and processing capacity in single computers [12].
Whenever an MBA is discussed, a related technique of Association Rule Learning (ARL) emerges as the most suitable model for MBA [11]. However, a MBA can be implemented with several other techniques as well, and similarly, ARL also have different implementations such as evolution-based, Physics inspired, swarm intelligence based and hybrid approaches [11]. In [11], the authors divided the ARL into various categories and discussed number of studies applied various Machine Learning (ML) techniques. [11] conclude that Genetic Algorithms (GA) are the most commonly used algorithms for all kinds of ARL. However, the trend is shifting towards Evolutionary Computation (EC). EC is producing better results in a hybrid approach with meta-heuristics. Although the area is still wide open for the researchers to test algorithms like Ant Bee Colony (ABC) or Cuckoo Search in ARL [11].
The Genetic Algorithm is also used for the nonlinear binary programming problem in MBA [34]. It refers to the allocation of items on shelves using a mathematical model for the optimization of the genetic algorithm. The results show a realistic approach to the mathematical model except for the linearity problem. The algorithm can be modified for the other sets of problems to address allocation that directly impacts the selling rate.
The trends of MBA are now shifting towards the online shopping portals. The nature of data is more diverse and huger in number. Thus, requiring novel and modified Apriori techniques for such type of MBA. As presented in [35], the Artificial Neural Networks (ANN) may come as a help to deal with such diverse and huge datasets.
Besides the types of algorithms used for MBA, there is also a variation in the approach of business analytics. MBA usually seems to be a customer-oriented domain. However, [36] argued about the limitations of the concept and presented a novel approach that is customer-centered with the event-oriented concept. The author claimed that the categorization of products based on basket transactions is not sufficient to analyze the business tactics [36]. It is also necessary to add occasion or the event in the database as an attribute. For instance, a customer visits a store in the morning and evening. For the morning visit, the customer buys items for breakfast and at evening customer prefers beverages [36]. So, the time of event also matters in designing promotional events. Hence, in this way business outlets can also manage traffic by introducing sales during a certain clock of time [36]. The proposed method is implied to FMCG shopping malls (a collection of European fast-moving consumer goods malls). The impact of the method seems to be better than the traditional approach in terms of promotional event responses [36]. Tab. 2 presents an overview of the literature survey since 2016.
In the literature review section, twenty recent papers in the area of market basket analysis and association rule learning were discussed. Fig. 8. Illustrate the distribution of the collected papers published between 2016 and 2020. As showed, the highest number of papers were proposed in 2018 (30%). This demonstrates that the association rule learning in the market basket analysis has emerged as a popular topic in recent years.
Figure 8: Number of papers in this survey
As seen in the literature review, association rule learning techniques in the market basket analysis helps retailer and supermarket operators. They can predict with the aid of ARL about (i) customers’ purchases behavior, (ii) market-based surveys, (iii) consumer demand, (iv) product positioning in shelves, (v) successful bids or coupons or discounts, and (vi) consumer segmentation [3,13,36]. An example to illustrate, the right position to put goods (e.g., shelving) is found through the analysis of ARL. Moreover, the ARL can be used to identify everyday items based on a certain service level and confidence level from the selling data. So that, for example the everyday items can be put nearby to boost their sales [14,25,36].
ARL aim to study the association or relation between items through generating association rules in form of A→ B. These rules are evaluated using some measurements like support and confidence. In addition to these well-known measurements, [11,20–23] and [18] interduce new measures for association rules : trust, leverage, lift, Net confidence, conviction, Interestingness, and Comprehensibility. These additional measures are discussed in the background section. These measures provide more knowledge about generated rules.
There are various aspects of an MBA that comes across from the literature review of MBA with ARL applications. These can be categorized as the business approaches to MBA, the algorithmic study of mining approaches, and applications of MBA in fields other than supermarket stores [11–12,18,35,36].
There is a transition of business approaches as a comprehensive literature study of the related data has shown that researchers analyzed sales data by customer (Consumer-centric) using various methods such as clustering, Markov chains, etc. [24]. In terms of sales volumes, frequency of visit, and a combination of goods with product type; the entire selling history per customer is analyzed, and consumer segments are thus created, providing a genome of purchases with related characteristics like budget availability and personal preferences [36]. Sales data may be analyzed to identify the individual consumer groups by clustering or classification [13,37]. For discovered consumer groups, the different marketing strategies and promotional activities may be modified. The consumer who purchases less but spends a lot often handled separately from the customer who shops very often but in smaller amounts [13]. Moreover, it is observed that indicatively groups of clients who buy regular, seasonal, or relaxation groups or that clients who buy serums are more likely to purchase other cosmetics. Alternatively, there is a customer group that includes customers that have a high proportion of their buying experience with delicacies, grooming, food and butchering goods or clients that have been consuming cosmetics with expenditure constraints and may have bought nail screws with cleaner-polish or high-dispense buyers during the sales period [8].
It is found from the literature that, despite the continues improvements and modification of many datamining algorithms, the Swarm Intelligence and Neural Networks are trending due to the better performance in clustering big data and post-processing capabilities. The novel hybrid approaches produce better results with less time and space complexity overhead as compared to traditional mining algorithms.
Many researchers apply hybrid rules on basket level data to derive pairs of food groups, in which consumers -for example- buy milk and meat products more often on their shopping trips [30]. Also, it is evaluated that basket data does not separate market categories or pairs items [36]. Therefore, the trend is shifting towards a consumer-oriented and event centered MBA. In event-centered MBA, each shopping trip is focused on, and groups identified by the types of products bought during the visits of each category are viewed [3,36]. The combination of product types bought per visit section identifies the buying goal that inspired every visit to each category. Various product category blends for each visiting segment represent specific consumer shopping criteria that conduct each segment visits [3,16]. This business approach brings a revolutionary change in the promotional sector. The application of event centered consumer-oriented approach introduces the concept of promotional activities concerning time. For instance, the sales on breakfast items can be implied in the morning and providing discounts on groceries on the weekend.
Moreover, shifts in the algorithmic implementation of the MBA approach can also be seen from the literature [25,31–35]. The neural networks and swarm algorithms are tested for the MBA and ARL. These algorithms in hybrid form produce better results in comparison to others. It is due to the fact that the huge amount of data is adding to the repository at every instant of time. Therefore, the traditional Apriori and FP-growth algorithm cannot handle them alone [35]. The traditional approaches require the pre-processing and post-processing mechanisms to generate further information that eventually helps in better decision-making. The hybrid approaches define and visualize the important set of rules and can deal with complementing categories [9,25]. The addition of time series data for frequent item sets signals the use of neural networks since the neural networks have a better impact on such type of data [13]. Similarly, to reduce the time cost of the rule’s generation, Genetic Algorithms (GA) and Swarm Intelligence (SI) can be used in feature selection and optimization of association rules [10–13,34,38]. Lastly, the visualization of classification rules various DM algorithms has shown positive results, specifically in the case of real-time data analytics [21,23,24].
Furthermore, it is shown in this survey that MBA has enough scope to be applied to other fields such as hospitality field, sports and healthcare [11,19,21–27], and this may prove to be a growing research area in the near future.
Market Basket Analysis (MBA) is a key element in the categorization and decision-making of sales products. Association rule learning (ARL) is the most well-known technique used with MBA especially for understanding the customer’s buying behavior. But the transformation of data evolution into large Data warehouses with an immense amount of data generating regularly raises an issue and an open research area. Although, the change in the computing environment from sequential computing to parallel or even cloud computing shows a tangible and beneficial effect in handling this amount of data, but this area is still an open research issue and need more researches as well. Also, the traditional ARL approaches are not fulfilling the demands of e-commerce as it requires rapid and real-time analysis of data.
The trend of ARL algorithms is now shifting towards the hybrid approaches for association rule and market basket analysis [10–13]. Even though the area is still wide open for the researchers to test hybrid algorithms as they are still not tested especially for accuracy and efficiency in most of the areas where diverse and heterogeneous data are involved.
It is also observed from the literature that the MBA is not limited to supermarket stores anymore. A few researches have been done in new area like healthcare, sports, hospitality,…etc. Therefore, it also ranked as an open research area for the upcoming researchers. However, the field of supermarket analysis also needs advancement and review for the changing trends of the business era. Moreover, the effect of using ARL as a MBA technique should be studied it term of it’ s impact on the three market performance indicators: Finance, Marketing, and Operation.
Market Basket Analysis (MBA) provides many sectors with relevant information about their customers’ behavior. MBA uses association rule learning (ARL) techniques to fulfill the market demand for rule mining and promotional marketing, considering consumption behavior. In this survey, we discussed different applications and method of MBA based on ARL. Twenty recent studies were reviewed for ARL application finding that it facilitates the change in the trends of the MBA approaches. It is observed from the literature that these concepts are not limited to a specific field or sector. MBA and ARL have a wide scope of applied research to industries such but not limited to healthcare, retail sector or supermarkets, hospitality, sports, …etc. Lastly, the “neural networks and other intelligent data mining techniques may prove as a paradigm shift in the MBA.
Funding Statement: The authors received no specific funding for this study.
Conflicts of Interest: The authors declare that they have no conflicts of interest to report regarding the present study.
1. N. T. Utami and I. Surjandari, “Identifying consumer buying behavior differences through market basket analysis in multiple outlet types,” in ACM Int. Conf. on Business & Information Management, New York, NY, USA, pp. 82–86, 2017. [Google Scholar]
2. M. Kaur and S. Kang, “Market basket analysis: Identify the changing trends of market data using association rule mining,” Procedia Computer Science, vol. 85, pp. 78–85, 2016. [Google Scholar]
3. V. Holý, O. Sokol, and M. Černý, “Clustering retail products based on customer behaviour,” Applied Soft Computing, vol. 60, pp. 752–762, 2017. [Google Scholar]
4. M. Toloo, B. Sohrabi, and S. Nalchigar, “A new method for ranking discovered rules from data mining by DEA,” Expert Systems with Applications, vol. 36, no. 4, pp. 8503–8508, 2009. [Google Scholar]
5. J. R. D. Arcos and A. A. Hernandez, “Analyzing online transaction data using association rule mining: Misumi Philippines market basket analysis,” in Int. Conf. on Information Technology: loT and Smart City, Guangzhou, China, pp. 45–49, 2019. [Google Scholar]
6. S. Kasthuri and T. Meyyappan, “Detection of sensitive items in market basket database using association rule mining for privacy preserving,” in IEEE Int. Conf. on Pattern Recognition, Periyar, India, pp. 200–203, 2013. [Google Scholar]
7. S. Halim, T. Octavia, and C. Alianto, “Designing facility layout of an amusement arcade using market basket analysis,” Procedia Computer Science, vol. 161, pp. 623–629, 2019. [Google Scholar]
8. A. Alfiqra and A. U. Khasanah, “Implementation of market basket analysis based on overall variability of association rule (OCVR) on product marketing strategy,” IOP Conference Series: Materials Science and Engineering, vol. 722, no. 1, pp. 1–8, 2020. [Google Scholar]
9. M. S. Panwar, “An analysis of different ARM algorithms for frequent pattern,” no. 3, pp. 5496–5501, 2020. [Google Scholar]
10. D. A. valarmathi, “Market basket analysis for mobile showroom,” International Journal for Research in Applied Science and Engineering Technology, vol. 5, no. x, pp. 1279–1284, 2017. [Google Scholar]
11. A. Telikani, A. H. Gandomi, and A. Shahbahrami, “A survey of evolutionary computation for association rule mining,” Information Sciences, vol. 524, pp. 318–352, 2020. [Google Scholar]
12. S. Singh, P. Singh, R. Garg, and P. K. Mishra, “Mining association rules in various computing environments: A survey,” Social Science Electronic Publishing, vol. 11, no. 8, pp. 5629–5640, 2016. [Google Scholar]
13. M. K. Gupta and P. Chandra, “A comprehensive survey of data mining,” International Journal of Information Technology, vol. 14, pp. 1–15, 2020. [Google Scholar]
14. A. N. Sagin and B. Ayvaz, “Determination of association rules with market basket analysis: Application in the retail sector,” Southeast Europe Journal of Soft Computing, vol. 7, no. 1, 2018. [Google Scholar]
15. I. Enabled, P. Location and M. View, “A study on market basket analysis and association mining,” Proceedings of National Conference on Machine Learning, ISBN: 978-93-5351-521-8, pp. 1–7, 2019. [Google Scholar]
16. S. Gupta and R. Mamtora, “A survey on association rule mining in market basket analysis,” International Journal of Information and Computation Technology, vol. 4, no. 4, pp. 409–414, 2014. [Google Scholar]
17. S. Wenninger, D. Link, and M. Lames, “Data mining in elite beach volleyball – detecting tactical patterns using market basket analysis,” International Journal of Computer Science in Sport, vol. 18, no. 2, pp. 1–19, 2019. [Google Scholar]
18. R. Moodley, F. Chiclana, F. Caraffini, and J. Carter, “Application of uninorms to market basket analysis,” International Journal of Intelligent Systems, vol. 34, no. 1, pp. 39–49, 2019. [Google Scholar]
19. T. Kutuzova and M. Melnik, “Market basket analysis of heterogeneous data sources for recommendation system improvement,” Procedia Computer Science, vol. 136, pp. 246–254, 2018. [Google Scholar]
20. Y. A. Ünvan, “Market basket analysis with association rules,” Communications in Statistics - Theory and Methods, vol. 57, pp. 1–14, 2020. [Google Scholar]
21. Y. Shiokawa, T. Misawa, Y. Date and J. Kikuchi, “Application of market basket analysis for the visualization of transaction data based on human lifestyle and spectroscopic measurements,” Analytical Chemistry, vol. 88, no. 5, pp. 2714–2719, 2016. [Google Scholar]
22. H. P. Liew, “Dietary habits and physical activity: Results from cluster analysis and market basket analysis,” Nutrition and Health, vol. 24, no. 2, pp. 83–92, 2018. [Google Scholar]
23. M. Hahsler and R. Karpienko, “Visualizing association rules in hierarchical groups,” Journal of Business Economics, vol. 87, no. 3, pp. 317–335, 2017. [Google Scholar]
24. J. W. Kim, “Construction and evaluation of structured association map for visual exploration of association rules,” Expert Systems with Applications, vol. 74, pp. 70–81, 2017. [Google Scholar]
25. M. A. Valle, G. A. Ruz and R. Morrás, “Market basket analysis: Complementing association rules with minimum spanning trees,” Expert Systems with Applications, vol. 97, pp. 146–162, 2018. [Google Scholar]
26. D. Adhikary and S. Roy, “Trends in quantitative association rule mining techniques,” in IEEE Int. Conf. on Recent Trends in Information Systems, Kolkata, India, pp. 126–131, 2015. [Google Scholar]
27. D. Solnet, Y. Boztug and S. Dolnicar, “An untapped gold mine? exploring the potential of market basket analysis to grow hotel revenue,” International Journal of Hospitality Management, vol. 56, pp. 119–125, 2016. [Google Scholar]
28. J. Song and K. Kim, “A big data analysis and mining approach for IOT big data,” International Journal of Advances in Computer Science and Technology, vol. 7, no. 1, pp. 1–3, 2018. [Google Scholar]
29. A. Strehl and J. Ghosh, “A scalable approach to balanced, high-dimensional clustering of market-baskets,” in Int. Conf. on High Performance Computing, Bangalore, India, pp. 525–536, 2000. [Google Scholar]
30. D. L. Olson and G. Lauhoff, “Market basket analysis,” Medicine, vol. 23, no. 2, pp. 31–44, 2019. [Google Scholar]
31. C. Wang and X. Zheng, “Application of improved time series apriori algorithm by frequent itemsets in association rule data mining based on temporal constraint,” Evolutionary Intelligence, vol. 13, no. 10, pp. 39–49, 2020. [Google Scholar]
32. L. N. Sun, “An improved apriori algorithm based on support weight matrix for data mining in transaction database,” Journal of Ambient Intelligence and Humanized Computing, vol. 11, no. 2, pp. 495–501, 2020. [Google Scholar]
33. M. A. Jabbar, B. L. Deekshatulu, P. Chandra, “A novel algorithm for utility-frequent itemset mining in market basket analysis,” Innovations in Bio-Inspired Computing and Applications, vol. 424, pp. 337–345, 2016. [Google Scholar]
34. M. Heydari and A. Yousefli, “A new optimization model for market basket analysis with allocation considerations: A genetic algorithm solution approach,” Management & Marketing: Challenges for the Knowledge Society, vol. 12, no. 1, pp. 1–11, 2017. [Google Scholar]
35. J. Shikshan, P. Mandal, R. Gangurde and S. D. Gore, “Optimized predictive model using artificial neural network for market optimized predictive model using artifical neural network for market basket analysis,” Computer Science & Electronics Journals, vol. 9, no. 1, pp. 42–52, 2017. [Google Scholar]
36. A. Griva, C. Bardaki, K. Pramatari and D. Papakiriakopoulos, “Retail business analytics: Customer visit segmentation using market basket data,” Expert Systems with Applications, vol. 100, pp. 1–16, 2018. [Google Scholar]
37. M. Rana and J. Singla, “A systematic review on data mining rules generation optimizing via genetic algorithm,” Proc. of the Int. Conf. on Innovative Computing & Communications (ICICC), New Delhi, India, vol. 2, pp. 1–7, 2020. [Google Scholar]
38. V. Beiranvand, M. Mobasher-Kashani, and A. Abu Bakar, “Multi-objective PSO algorithm for mining numerical association rules without a priori discretization,” Expert Systems with Applications, vol. 41, no. 9, pp. 4259–4273, 2014. [Google Scholar]
 | This work is licensed under a Creative Commons Attribution 4.0 International License, which permits unrestricted use, distribution, and reproduction in any medium, provided the original work is properly cited. |