 Open Access
ARTICLE
Optimizing Internet of Things Device Security with a Globalized Firefly Optimization Algorithm for Attack Detection
Department of Mathematics, Open Educational College, Kirkuk Branch, Kirkuk, 36001, Iraq
* Corresponding Author: Arkan Kh Shakr Sabonchi. Email:
Journal on Artificial Intelligence 2024, 6, 261-282. https://doi.org/10.32604/jai.2024.056552
Received 25 July 2024; Accepted 23 September 2024; Issue published 18 October 2024
Abstract
The phenomenal increase in device connectivity is making the signaling and resource-based operational integrity of networks at the node level increasingly prone to distributed denial of service (DDoS) attacks. The current growth rate in the number of Internet of Things (IoT) attacks executed at the time of exchanging data over the Internet represents massive security hazards to IoT devices. In this regard, the present study proposes a new hybrid optimization technique that combines the firefly optimization algorithm with global searches for use in attack detection on IoT devices. We preprocessed two datasets, CICIDS and UNSW-NB15, to remove noise and missing values. The next step is to perform feature extraction using principal component analysis (PCA). Next, we utilize a globalized firefly optimization algorithm (GFOA) to identify and select vectors that indicate low-rate attacks. We finally switch to the Naïve Bayes (NB) classifier at the classification stage to compare it with the traditional extreme gradient boosting classifier in this attack-dimension classifying scenario, demonstrating the superiority of GFOA. The study concludes that the method by GFOA scored outstandingly, with accuracy, precision, and recall levels of 89.76%, 84.7%, and 90.83%, respectively, and an F-measure of 91.11% against the established method that had an F-measure of 64.35%.Keywords
IoT is an emerging technology system of interrelated computing devices, mechanical and digital machines, or objects with unique identifiers capable of transferring data over a network without requiring human-to-human or human-to-computer interaction [1]. Its scope of application is wide, ranging from smart home systems to intelligent transportation systems and urban intelligence projects, and improving agriculture, logging, medical care, and even energy [2]. IoT is the interconnection of several physical entities with electronic, software, and sensor communication technology interfaces, by which data are collected and shared [3]. This web of connected data exchange enormously enhances most of humanity’s IoT. However, a great difficulty is the question of IoT security, which limits the potential scope of possible IoT innovations. Thus, IoT devices can easily fall victim to malicious actors and become potential vectors for disruptions in various sectors of life, influencing the availability of these devices [4]. For a large part, such security vulnerabilities result from the limited computational capability of IoT devices [5], which produces noticeable security deficits. This has consequently led to an increase in DDoS attacks, the purpose of which is predominantly to undermine the availability of certain nodes or networks, cause signal disruption, or battery drainage by multiplying IoT devices quickly, in addition to a lack of security protocols [6]. DDoS attacks are broadly classified into two types: those that debilitate the service and those that flood it [7]. However, these DDoS attack methodologies, which have been recognized for over a decade, remain grave challenges. In such attacks, access to legitimate services is blocked using different types of IoT devices to derail their intended functions [8].
Under a DDoS attack, the network server becomes a virtual weapon that attacks the IoT, resulting in colossal losses across industrial areas [9]. According to reports, different cases include attacks such as Mirai, Hajime, Hide and Seek, Bashlite, Tsunami, Brickerbot, and Luabot against IoT devices. Through such releases, these groups have precipitated a rise in the variants emanating from them, particularly groups such as Mirai and Bashlite [10]. In this context, this study proposes a novel technique for denial of service (DoS), web attacks, and port scan detection in contemporary security threats. While the majority of the existing efforts on threat detection and response aim to enhance single technologies, methodologies, or processes in the deployment of the proposed GFOA, we applied both the CICIDS and UNSW-N15 datasets in the proposed method, where preprocessing removes the noise and fills the missing information. This aids in extracting features using PCA and determining low-rate attacks using the GFOA. After selecting the features, an NB classifier is implemented to classify attacks. The remainder of this paper is organized as follows: Section 2 reviews current methodologies in the field, whereas Section 3 elaborates on the proposed GFOA-based detection framework; Section 5 reports the experimental results of the demonstration performed; and finally, Section 7 concludes the study and offers perspectives for future research. An illustrative representation of the research framework is provided in Fig. 1.

Figure 1: Conceptual framework of IoT security enhancement through GFOA
This section synthesizes ideas from a wide range of literature regarding the detection of DDoS attacks in IoT networks and summarizes key ideas from selected seminal studies. This paper outlines various methods and technologies intended to improve the security of IoT networks against DDoS attacks. For instance, a semi-supervised machine learning (ML) algorithm was integrated into a software-defined network (SDN)-cloud architecture derived from the base level of 96.28% IoT network security detection in the learning-driven detection mitigation (LEDEM) initiative [11]. In addition, they proposed a feature-selection-based approach with multi-objective optimization along with an extreme learning machine classifier, with promising improvements in the effectiveness of intrusion detection systems for the IoT compared to traditional methodologies [12]. Snake optimizer with an ensemble learning (SOEL) is a state-of-the-art (SOTA) method to classify and categorize DDoS attacks automatically and has significantly advanced attack detection in IoT environments with scarce resources [13]. For this purpose, in 5G networks, the modified equilibrium optimization algorithm with deep learning (DL) uses evolutionary algorithms in conjunction with DL techniques to classify various attacks, as mentioned and has registered success at an accuracy rate of up to 97.60% [14]. This study takes advantage of the fact that a strategy known as the double proportional threshold classification model-k-nearest neighbors (DPTCM-KNN) classifier can improve the security of the network in healthcare [15]. In the context of the software-defined Internet of Things, previous studies have been able to guarantee a detection accuracy rate of 98% using a framework that combines an enhanced firefly algorithm (FA) with convolutional neural networks (CNNs) to identify DDoS attacks [16]. Hence, the fractional anti-corona optimization-based deep neuro-fuzzy network (FACVO-based DNFN) algorithm efficiently combines feature fusion and data augmentation with DL to demonstrate outstanding capability for detecting DDoS attacks at highly accurate and precise levels within cloud computing [17]. A survey investigated the changing threat of DDoS attacks, particularly during the coronavirus disease (COVID) pandemic, and exposed chinks in the armor of conventional security measures. It also noted the importance of predicting such DDoS attacks by providing early warnings and timely defenses. From the 2482 studies, critical 27 studies on DDoS attack prediction are presented based on SOTA methods that identify research gaps. Thus, the survey calls for proactive defense mechanisms with comprehensive classifications to guide future research topics [18]. Another study considered securing IoT devices from DDoS attacks, owing to their limited resources and dynamic communication. In this respect, a hybrid DL model using recurrent neural network (RNN), long short-term memory (LSTM), and convolutional neural network (CNN) techniques was developed to efficiently detect DDoS attacks. The results indicated that the model equipped with CNN-BiLSTM had the best accuracy and precision compared with other individual models on the datasets for CICIDS 2017. This study concludes that the CNN-BiLSTM model performs well in real-world scenarios but highlights the vulnerabilities of IoT networks and resilience to DDoS attacks, which is left as part of future work [19]. A detailed study was conducted to obtain enhanced insight into the complexity of forecasting DDoS attacks, mechanisms of the prediction model, identification of common challenges, and unveiling opportunities for progress.
With the introduction of the GFOA, the course lays the groundwork for attack detection, utilizing the holistic approach of the GFOA in a methodical manner to address this problem. This study proposes a methodology for detecting the three most common types of attacks by considering two major datasets. Two datasets, one from CICIDS and the other from UNSW-NB15, serve as benchmarks for modern Internet traffic detection techniques. The first preprocessing step involves processing the input data to remove unwanted noise and fill in missing values. The next step involves an exhaustive process of cleaning, normalization, transformation, and data integration. Next, we apply PCA as a preprocessing step to reduce the dimensionality of the most important features. The final step in this process applies an NB classifier to the following categories of selected attacks: DoS, web attack, and port scan. Fig. 2 presents a block diagram of the hybrid GFOA, which depicts this systematic methodology.
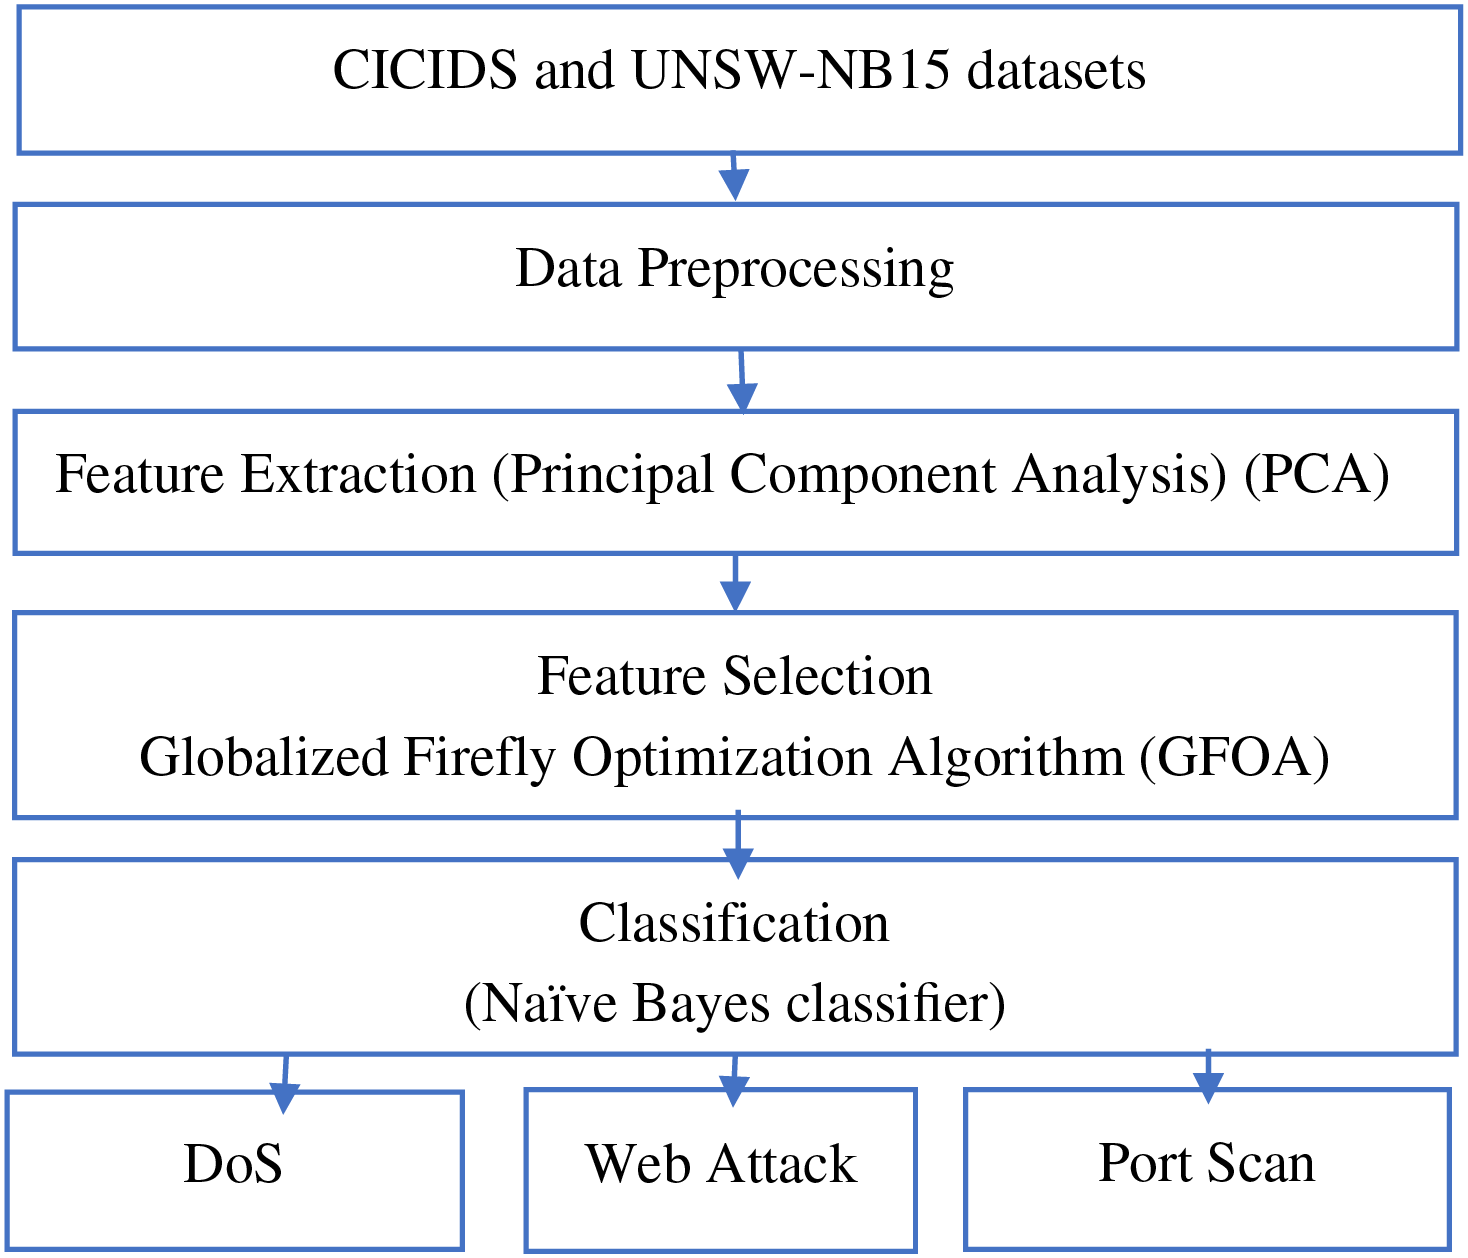
Figure 2: Schematic of the GFOA-based method for detecting attacks
The datasets used in this study include CICIDS [20] and UNSW-NB15 [21], which are the major sources of data that point to the configurations and features intended for analysis directed toward threats in attack detection. The CICIDS contains 85 attributes for each instance, focusing on the 78 features necessary for traffic characteristics. The other properties used help classify the traffic as normal or another form of attack, and annotate it according to the level of severity or potential impact. Moreover, the UNSW-NB15 dataset includes 49 attributes per instance, each providing a broad description. While some of these attributes are consistent in their focus and analysis of input traffic obligations, they also include fair markers to distinguish between normal activity and an attack, as well as metadata to assess the severity of the findings. We discuss these datasets in relation to three types of attacks: DoS, web attacks, and port scans. This is because every type of enumeration is critical at the capability level for developing a full-scale framework for investigating vulnerabilities in network security systems.
-DoS attacks orchestrate an excessive flow of traffic that disrupts the regular operation of computer systems, networks, or services. This barrage of requests drains the resources of the targeted entity, resulting in complete service outages or significant performance reductions. Given the profound consequences of these attacks, it is imperative for organizations to develop and implement strong defensive measures. Such strategies are essential not only for mitigating the damaging impact of DoS attacks but also for ensuring the ongoing availability of services [22].
-Web application attacks are targeted at exploitable vulnerabilities in web applications and services. An attacker can exploit some of these gaps to enter unauthorized systems, steal data, inject additional code, and modify web content. These include structured query language (SQL) injection, among other common attack paths that lead to web security compromises. SQL injection is an attack in which an attacker modifies the SQL database queries on websites to extract data, a practice that is clearly illegal. In contrast, cross-site scripting attacks (XSS) attacks compromise user data integrity and webpage security by inserting a malicious script into web pages [23].
-Port scanning is used by attackers as the first reconnaissance activity to identify open ports of the target system. Open ports play a crucial role in the operation of network services, revealing the active services in a system. Attackers frequently use tools such as Nmap, which may enable them to detect and exploit vulnerabilities in the future. Given that this is the fundamental precursor to more complex offensive methods, system administrators and attack detection experts must exercise great vigilance and correct port scanning to enhance the defensive capabilities of networks.
After collecting the data, we performed a crucial preprocessing phase to refine the dataset. This entails eliminating noise and filling gaps in the data to maintain integrity for further examination. This crucial stage comprises four fundamental procedures: data cleaning, which focuses on rectifying or removing inaccurate records; normalization, which recalibrates the data scale for uniformity; data transformation, which changes the format of the data into a more analytical structure; and data integration, which combines data from different sources into a uniform dataset. These steps are required to control accuracy, consistency, and data preparation.
Data cleaning is crucial in data preparation, because it removes damaged, inaccurate, duplicated, or poorly structured data from datasets. The purpose of selecting data is to improve its quality, standardize it for analysis, and make it approachable to the questions. This step is particularly important for data collection because it helps reduce the number of irrelevant data points. Moreover, data cleaning plays an important role in guaranteeing data compatibility with particular analytical models, particularly in studies addressing specific threats. It also facilitates correction of inconsistencies in the data structure that may occur during data transfer between different systems. The main data stripping procedure involves distinguishing incomplete data by deleting entries that arrest handicap or absent values.
Normalization is a key step in the preparation phase of data analysis. This includes a classical process for refining and transforming data from the pilot scope to a consistent scale. Such adjustments play a crucial role in managing uncertainties and filling data gaps, ultimately ensuring overall data integrity. At this stage, min-max normalization is an important technique for securing the consistency of data values within a dataset, as it tramps from 0 to 1. This procedure is essential for consistently analyzing datasets of varying sizes and importance, making it an integral part of predictive modelling exercises. This standardization facilitates the comparison of data from different sources to attain more accurate and dependable results during analysis.
This process is crucial for converting the raw data into a restructured format. Data transformation repositions the challenges associated with the interpretation and management of cut data by metamorphosing them into well-disposed formats. Smoothing strategies involve reducing noise in a dataset, summarizing data points through aggregation, and generalizing information from specific details to a broader level. Combining all these methods enhances the practicality and lucidity of the data, simplifying the analyst’s task in terms of navigating and comprehending the data, and efficiently extracting relevant information.
It is a process of merging all the necessary information from various heterogeneously available sources into one coherent database, providing a complete overview of the collected data. It involves the aggregation of data in whatever format it existed initially–data cubes, database records, or flat files–owing to cooperation among different stakeholders within an organization and outside the organization. The objective is to consolidate several data segments into a unified location that facilitates access and retrieval. Such consolidation is essential for optimizing research, analysis, and decision-making processes and is a fundamental step toward holistic data management and utilization.
3.7 Feature Extraction with PCA and GFOA
After preprocessing the data, PCA was applied for feature extraction. PCA is a statistical method that mathematically transforms a set of correlated variables into a set of linearly uncorrelated variables known as principal components. The goal was to minimize the feature space while maintaining maximum interpretability and minimal information loss. This was achieved by retaining the maximal variation in the dataset. Generally, the PCA methodology operates on the principal components that encompass the maximum variance in the data and aid in dimensionality reduction. The next step is to apply the GFOA to optimize the selection of these principal components. Inspired by the flashing behavior of fireflies, the GFOA optimizes toward brighter and more attractive solutions in the search space to identify the optimal solution. The main aim of using the proposed GFOA with PCA is to determine an optimal combination of principal components to maximize classification accuracy. This algorithm further refines the solution by iterating the attraction and brightness, which are indicators of the quality of the solution in relation to feature selection. We applied a learning algorithm to the entire set of principal components, and tested each component for its contribution to the prediction of the model. This improves the global search ability and moves toward the best-selected feature subset.
In the context of PCA and the GFOA, we generalize the mathematical expression that describes the feature vectors and optimal hyperplanes as follows:
For a set of feature vectors
The optimal hyperplane is given by Eq. (2):
In an ML model, the above equation is in the form of a hyperplane function h(x), where (x) denotes the input feature vector, θ denotes the weight vector, θT defines the transpose of θ, allowing the dot product with (x), and (c) denotes the bias term that shifts the hyperplane to optimally fit the data. This equation is crucial for classification tasks and optimization problems because it defines a decision boundary within the feature space. Eq. (3) provides the following conditions for class separation:
We maximized the margin of the nearest training data points and hyperplane, as shown in Eq. (4):
This implies that the GFOA checks the right weights (shown as θ) and biases (shown as c) for the strongest set of features to make the classification.
Following PCA, feature selection plays a crucial role in identifying features that aid in accurate recognition decisions and discarding less significant features to enhance the performance of the model. This results in the use of a refined model that employs the GFOA for feature selection, thereby enhancing the model’s accuracy in identifying potential threats. This improves the efficiency of the model by allowing it to focus on the most indicative attributes of potential attacks and, consequently, follows a pointed and effective attack detection strategy.
3.9 Standard Firefly Algorithm (SFA)
Fireflies worldwide are known for their ability to display rhythmic and short light patterns, as evidenced by approximately 2000 different firefly species. Therefore, this indicates that bioluminescent displays are important behaviors in mating, prey attraction, and a defense mechanism for fireflies to enhance their survival. Visibility was determined by two factors. The first influence is based on the inverse square law, which determines the intensity of light
-Fireflies are naturally attracted to each other regardless of gender, as they are considered gender neutral in this context.
-A firefly’s attractiveness is directly tied to its brightness, drawing less luminous fireflies toward brighter fireflies. The attractiveness decreases with distance, resulting in random movements when brighter fireflies are present.
-A firefly’s brightness is equivalent to the fitness function in the optimization landscape, reflecting the optimization goal in maximization problems, where brightness is proportional to the value of the firefly function.
The trajectory equation for firefly
where
where
3.9.1 Attractiveness in Standard Firefly Algorithm (SFA)
In the framework of the standard firefly algorithm (SFA), the attractiveness factor
Here,
In this formula,
3.9.2 Movement Dynamics in SFA
The movement dynamics of fireflies within the SFA are influenced by the relative brightness between them, formulated in Eq. (9):
In this equation,
4 Proposed Globalized Firefly Algorithm (GFOA)
The GFOA is considered an improvement over the conventional FA: the local search of the deepest point, the global search throughout the search domain, and features that have been hailed as richly applicable to other swarm-based optimization techniques. This latter version of the FA can be used to remediate specific drawbacks of the previous version, such as low convergence speeds and being prone to becoming stuck by local optima, which were observed within the original FA framework. The evolution of the FA has resulted in different variants, each crafted to solve the intricate nature of the nonlinear optimization problem with a marked improvement over older classical algorithms in solving NP (Non-deterministic Polynomial)-hard problems. Major developments include its use in Yang’s improved FA [25,28], which diverges from the standard Gaussian distribution random walk model. In general, the performance levels indicated that the levy-flight firefly algorithm (LFA) surpassed particle swarm optimization (PSO) in most benchmark tests. Furthermore, the FA with neighborhood attraction (NaFA) variant mixes a randomly selected population with a Cauchy distribution to increase the exploration of the algorithm, primarily in neighboring population operations [29]. The other approach is to again fit the classical “beauty model” based on distance and brightness with an equation for the tidal forces, dispensing this time with the absorption coefficients of FA. This achieves a better reach of the global minima, avoiding premature convergence using a simplified tidal force equation that adapts better to the behavioral patterns of the fireflies. Considering these features, the proposed GFOA, inspired by SOTA works [30,31], was designed to address the most prevalent problem of early convergence observed in standard FA implementations. Similar to PSO, the GFOA merges the harmony between exploration and exploitation through local and global search mechanisms, that is, avoiding getting stuck at a local optimum early is by far a great breakthrough from previous models. In addition, unlike the model of particle velocity, which is guided by its motion, the GFOA directs fireflies toward optimal solutions without any relation to velocity. This underscores the key operational divergence between the GFOA and PSO in the pursuit of global optima.
4.1 Attractiveness Calculation in GFOA
This study suggests a new way to compute attractiveness (λ) in the GFOA, where much emphasis is placed on fireflies and their spatial interactions. This is a deviation from the normal FA, where the attractiveness
This equation points to the inverse relationship of distance and attractiveness, hence governing the movement of firefly
4.2 Distance Calculation between Fireflies
Accurate distance calculation of fireflies is important within the search space of the GFOA. The distance between the optimal firefly
Here,
4.3 Strategic Movement in GFOA
The strategic realignment of the firefly
In instances where
This method introduces a level of randomness, ensuring that the algorithm can venture beyond its current position even when converging to a singular point, thereby diversifying the search and reducing the likelihood of premature convergence.
The operational framework of GFOA is distinguished by its nuanced decision-making process in which the fitness scores of newly generated fireflies inform their spatial positioning and steer the algorithm’s overarching search strategy. Comparing the fitness from
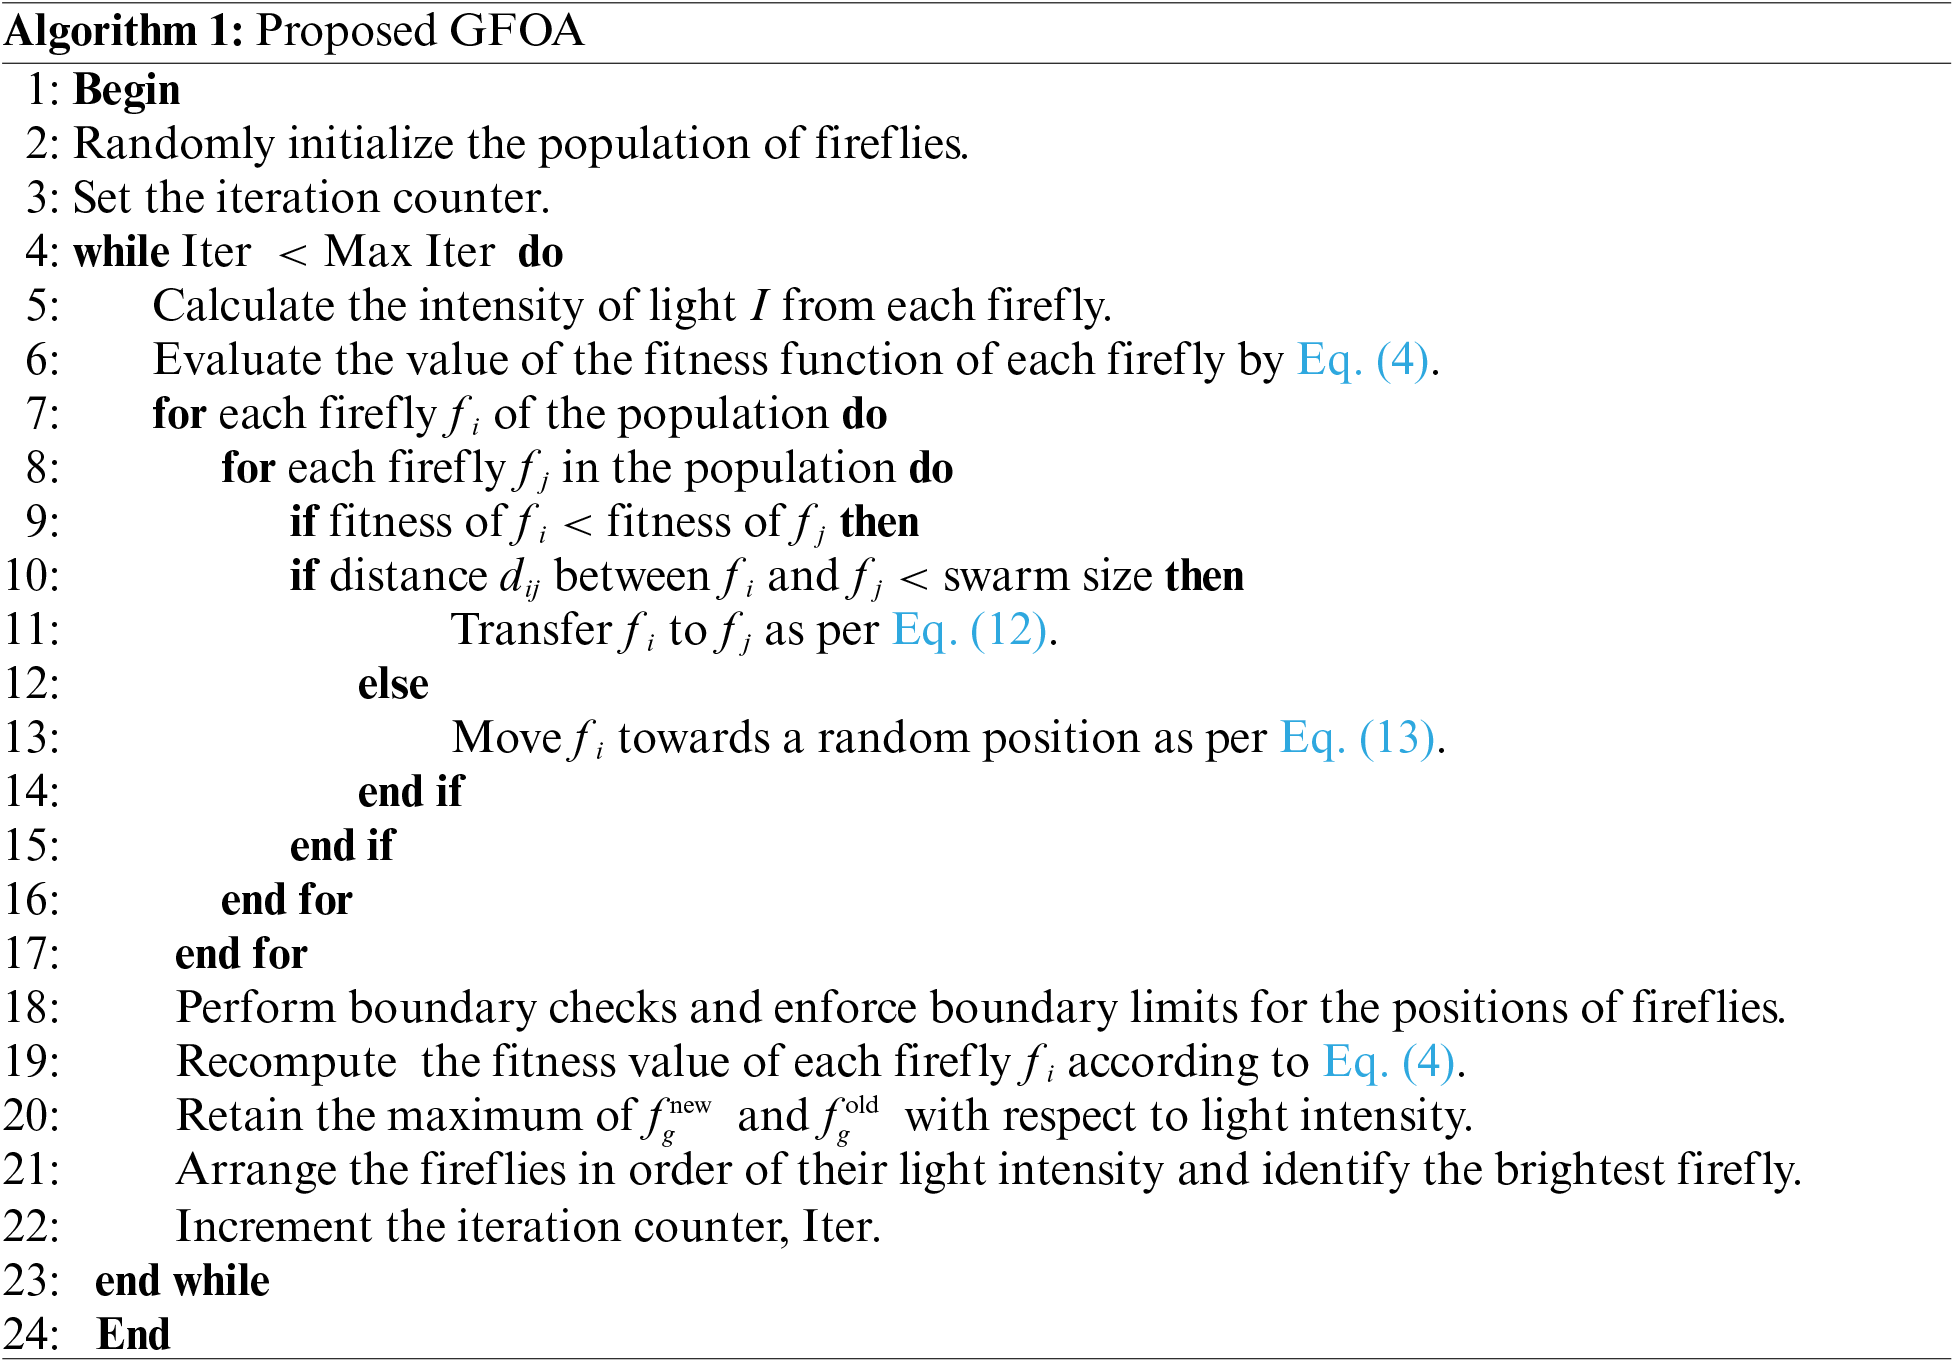
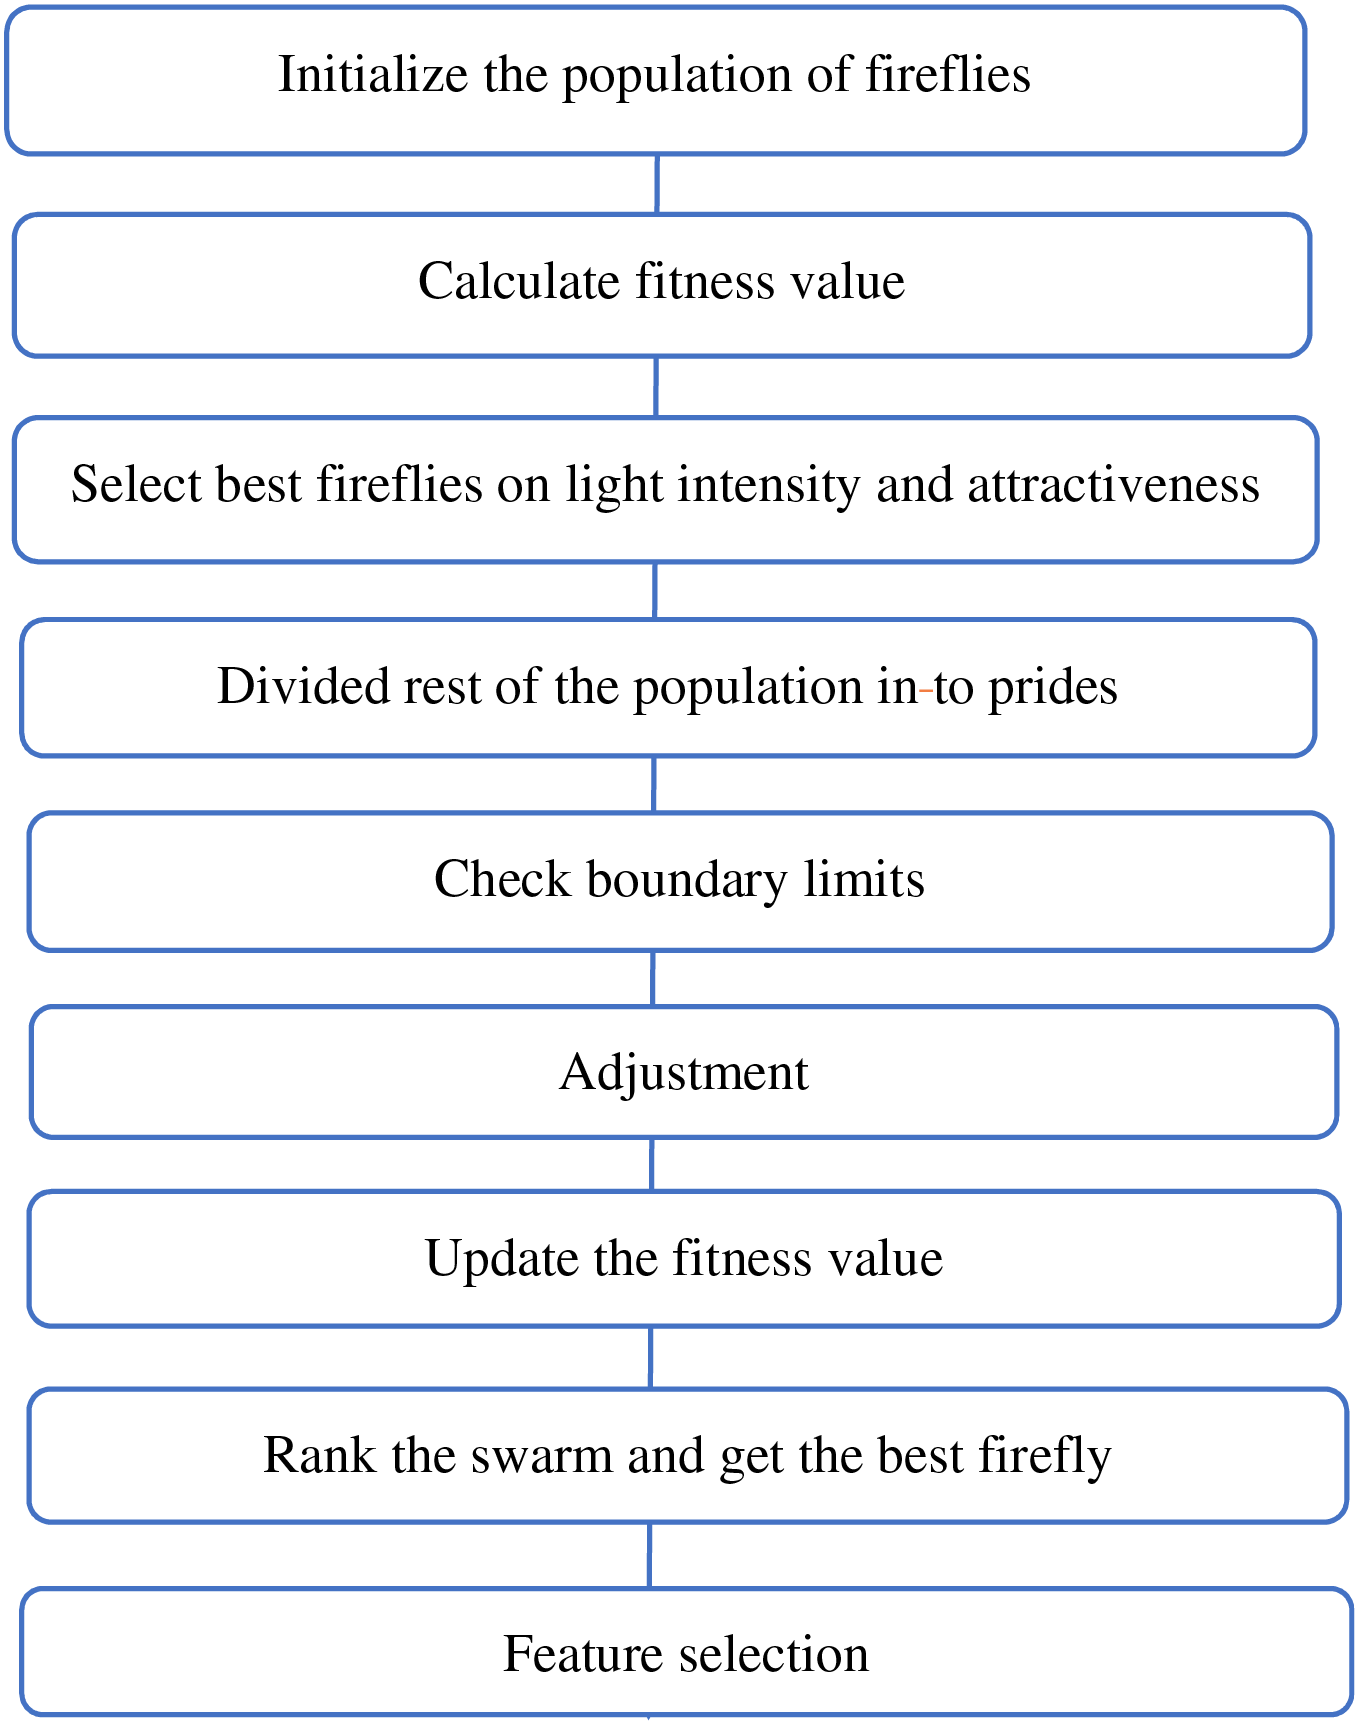
Figure 3: Conceptual diagram of the proposed GFOA framework
4.4 Classification Methodology
This study assessed the effectiveness of the NB classifier [32] for certain attribute relevance and data class classification tasks. The novel contribution of this approach is that it embeds decision trees at the core of the classification strategy. The data were used several times during training, further enabling data accuracy polishing when classifying attacks. This further enhances the efficacy and reliability of the NB classifier by utilizing a more diverse dataset, resulting in a more precise and accurate categorization of attacks. What distinguishes this classifier from the others is its architecture, which is typified by the voting of multiple classifiers over the classification of the input vectors.
Such collective voting adds complexity and variation, thereby enhancing the classifier’s ability to accommodate the various data subsets developed during feature selection in the ensemble method. Thus, the NB classifier’s performance will, to some extent, establish important parameters that guide the model’s predictive process. Their results are used to determine the classification of each data instance, making the NB classifier a robust tool with a smaller tendency to classify errors than conventional classification methods. This improves the performance of the classifier by accounting for factors such as several trees, minimum node dimensions, and the number of functions at each split. This provides a detailed setup for the classifier, making it powerful for classifying different types of attacks such as DoS, web attacks, and port scans in their respective clusters. This enhanced the ability of the classifier to perform composite classification tasks.
5 Experimental Results and Discussion
In this section, we evaluate the performance of the proposed GFOA in the detection of DoS, web, and port scan attacks. Our results demonstrate that the GFOA achieves a performance comparable to those of SOTA classifiers, such as extreme gradient boosting [33], discrete AdaBoost [34], and SFA when evaluated on the CICIDS and UNSW-NB15 datasets. The experimental configuration comprised a computer with 16 GB of RAM and a 1.80 GHz processor, and the experiments were performed using MATLAB R2013a.
The performance comparison of the GFOA with traditional methods was evaluated using multiple metrics: accuracy, precision, recall, F-measure, error rate, false positive percentage, false negative percentage, and area under the curve (AUC). These metrics provide a holistic evaluation of the ability of the GFOA to accurately observe attack detection threats and provide nuanced insights into usable effectiveness.
The performance of the GFOA was compared with those of extreme gradient boosting and discrete AdaBoost classifiers based on the CICIDS dataset. As summarized in Table 1, the success of the GFOA in comparison with the other two classifiers lags behind that of the GFOA across several important metrics. The GFOA performed significantly better than the extreme gradient boosting classifier, which had lower scores for accuracy (44.32%), precision (48.21%), recall (63.71%), and F-measure (55.32%). The accuracy, precision, recall, and F-measure values were 89.76%, 84.7%, 90.83%, and 91.11%, respectively. The discrete AdaBoost classifier performs better than extreme gradient boosting, but not as well as the GFOA. It had 67.51% accuracy, 71.4% precision, 74.67% recall, and 72.36% F-measure, whereas SFA had 53.1% accuracy, 57.21% precision, 60.89% recall, and 54.73% F-measure.

Further insights, listed in Table 2, concentrate on the AUC score and error rate, highlighting the ability of the GFOA to detect threats with an AUC of 81.33% and a minimal error rate of 10.29. The extreme gradient boosting classifier’s AUC score of 32.11%, the discrete AdaBoost classifier’s score of 54.6%, and the SFA score of 64.81 were all better than those of the GFOA at finding and categorizing attack detection threats. Figs. 4 and 5 show how well the GFOA performed binary classification on the CICIDS dataset and a comparison of the AUC scores. These results demonstrate that the GFOA is the best at detecting threats.

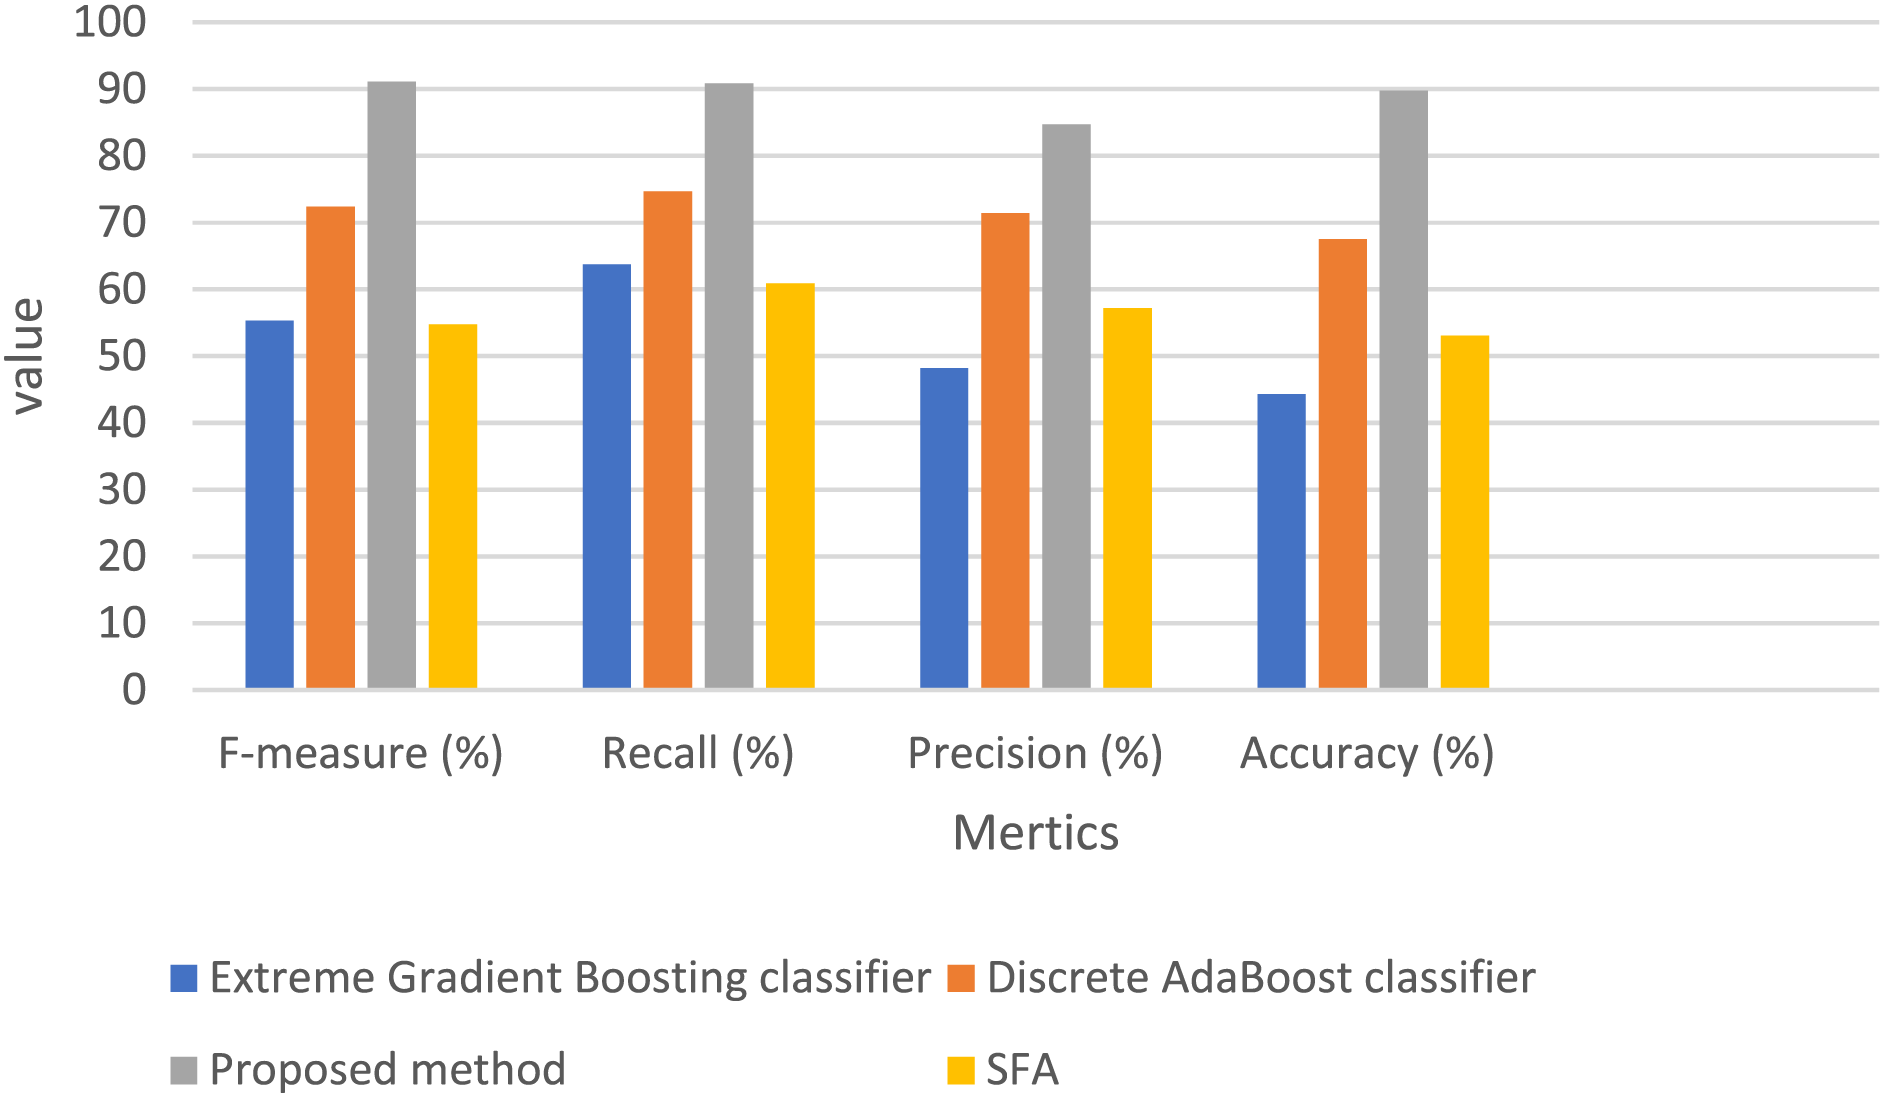
Figure 4: Comparative analysis graph of binary classification for CICIDS: proposed GFOA vs. existing methods
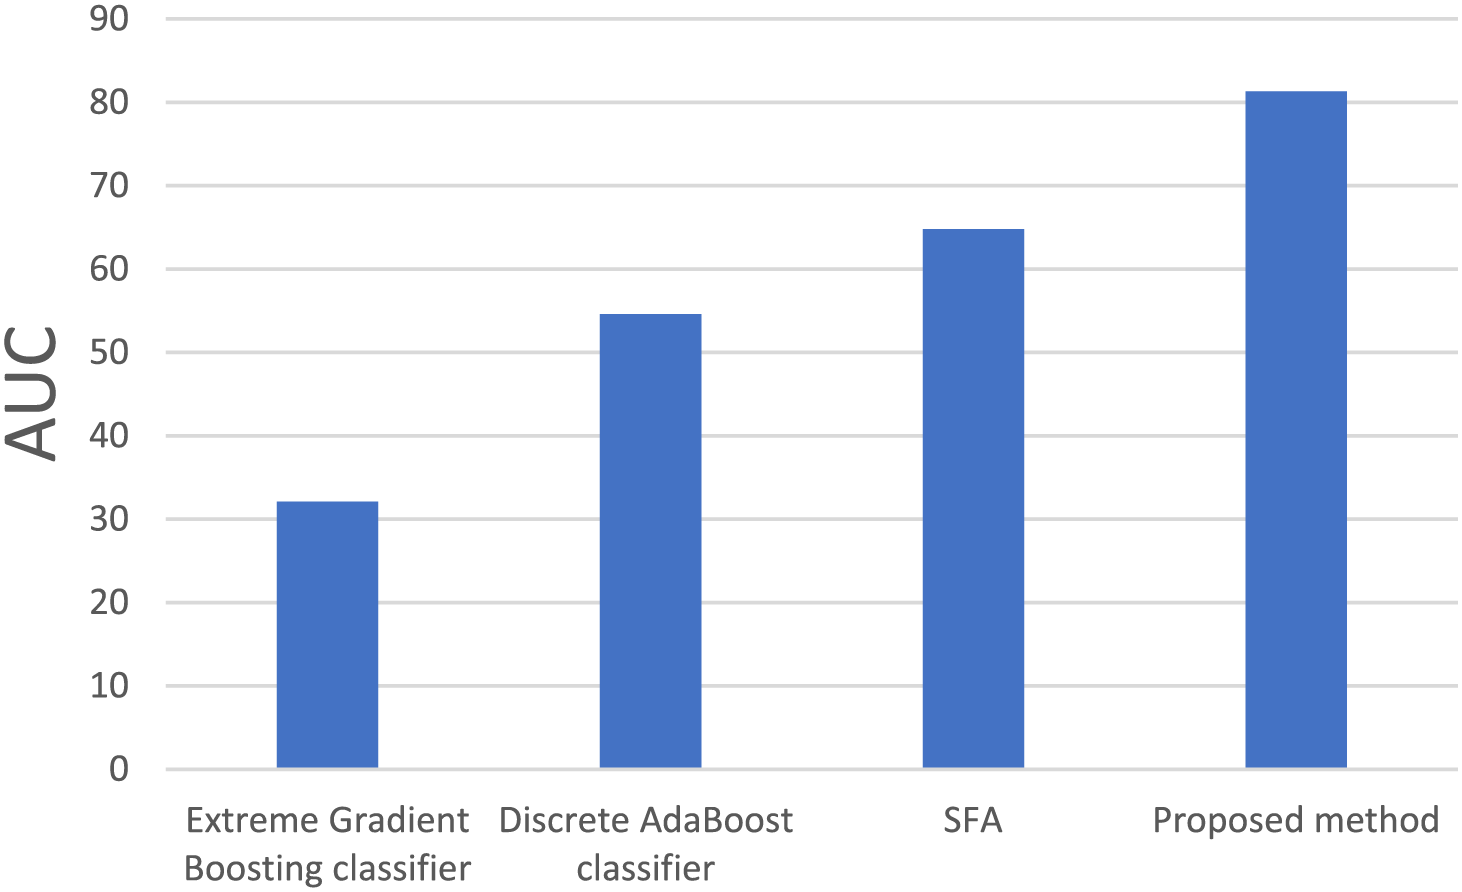
Figure 5: Comparative graph of AUC scores for binary classification using the proposed GFOA vs. existing methods
An error rate comparison between the proposed method for binary classification and conventional methods is shown in Fig. 6. The performance metrics of the multi-classification analysis for the CICIDS dataset are summarized in Table 3. These metrics include the F-measure, accuracy, precision, and recall. With an accuracy of 83.37%, precision of 84.02%, recall of 82.27%, and F-measure of 82.03%, this study shows that the proposed method is the best way to identify port scan attacks. Comparatively, the extreme gradient boosting classifier recorded an accuracy of 82.43%, precision of 83.14%, recall of 81.2%, and F-measure of 82.07% for port scan attacks. Meanwhile, the discrete AdaBoost classifier exhibited an accuracy of 82.61%, precision of 82.36%, recall of 82.04%, and F-measure of 82.51%. In contrast, SAF exhibits 83.01% accuracy, 83.62% precision, 82.98% recall, and 83.15% F-measure for port scan attacks. Visual depictions of the multi-classification outcomes on the CICIDS dataset, focusing on the accuracy and F-measure, are shown in Fig. 7.
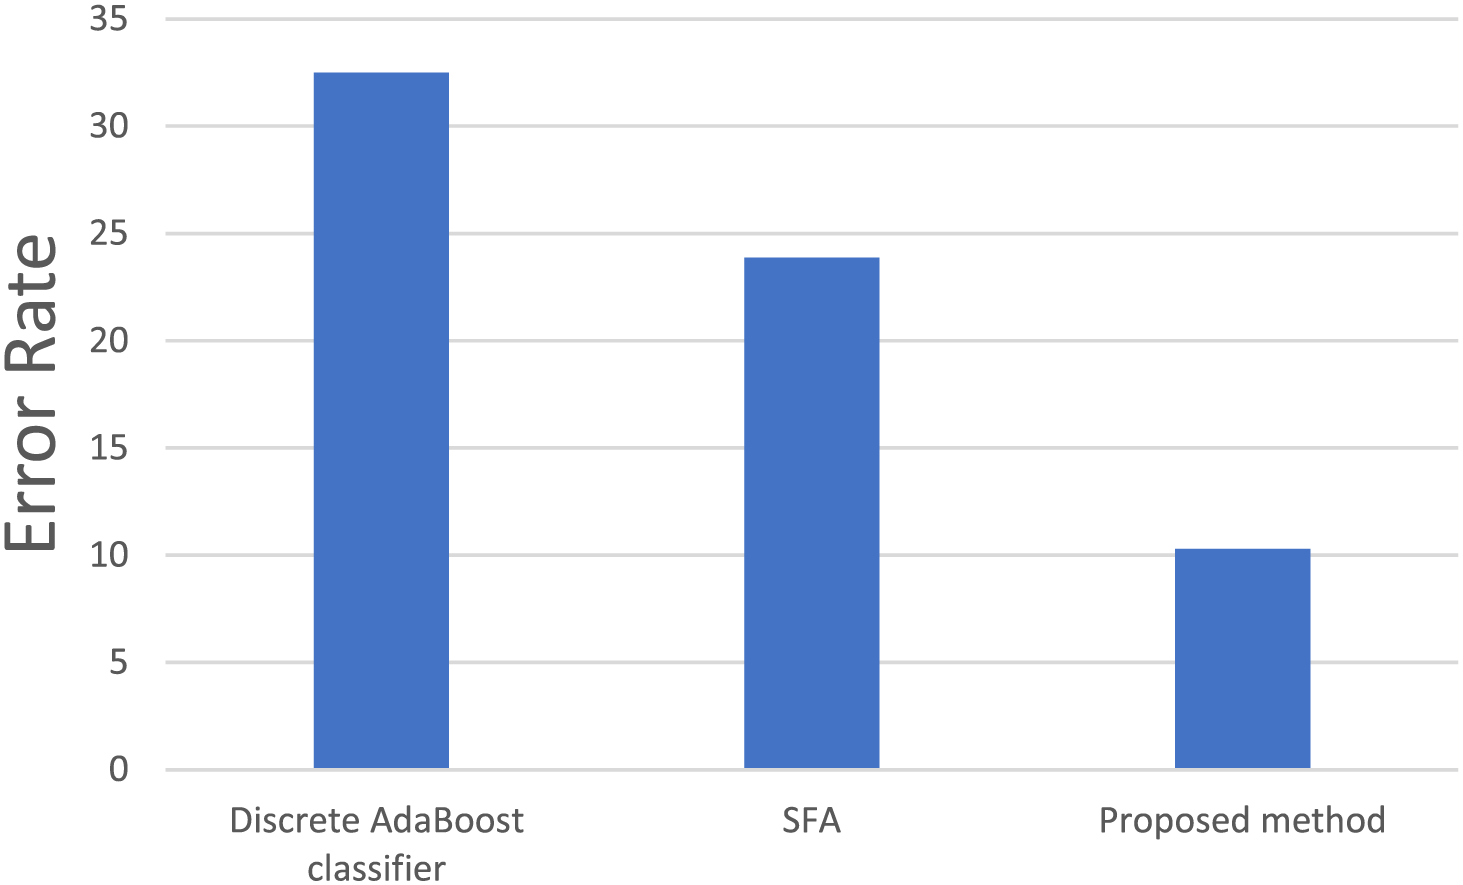
Figure 6: Comparative error rate analysis of binary classification: proposed GFOA vs. existing methods


Figure 7: Comparative analysis for multi-classification of CICIDS: accuracy and F-measure of proposed GFOA vs. existing method
Fig. 8 shows a graph of the derived values for the precision and recall metrics in the multi-classification analysis of the CICIDS dataset. The figures show the precision of the method in class differentiation and the capture of relevant instances in the GFOA. Table 4 summarizes these multi-classification results in further detail, including one of the more important characteristics when determining a classifier’s performance: AUC scores and error rate.
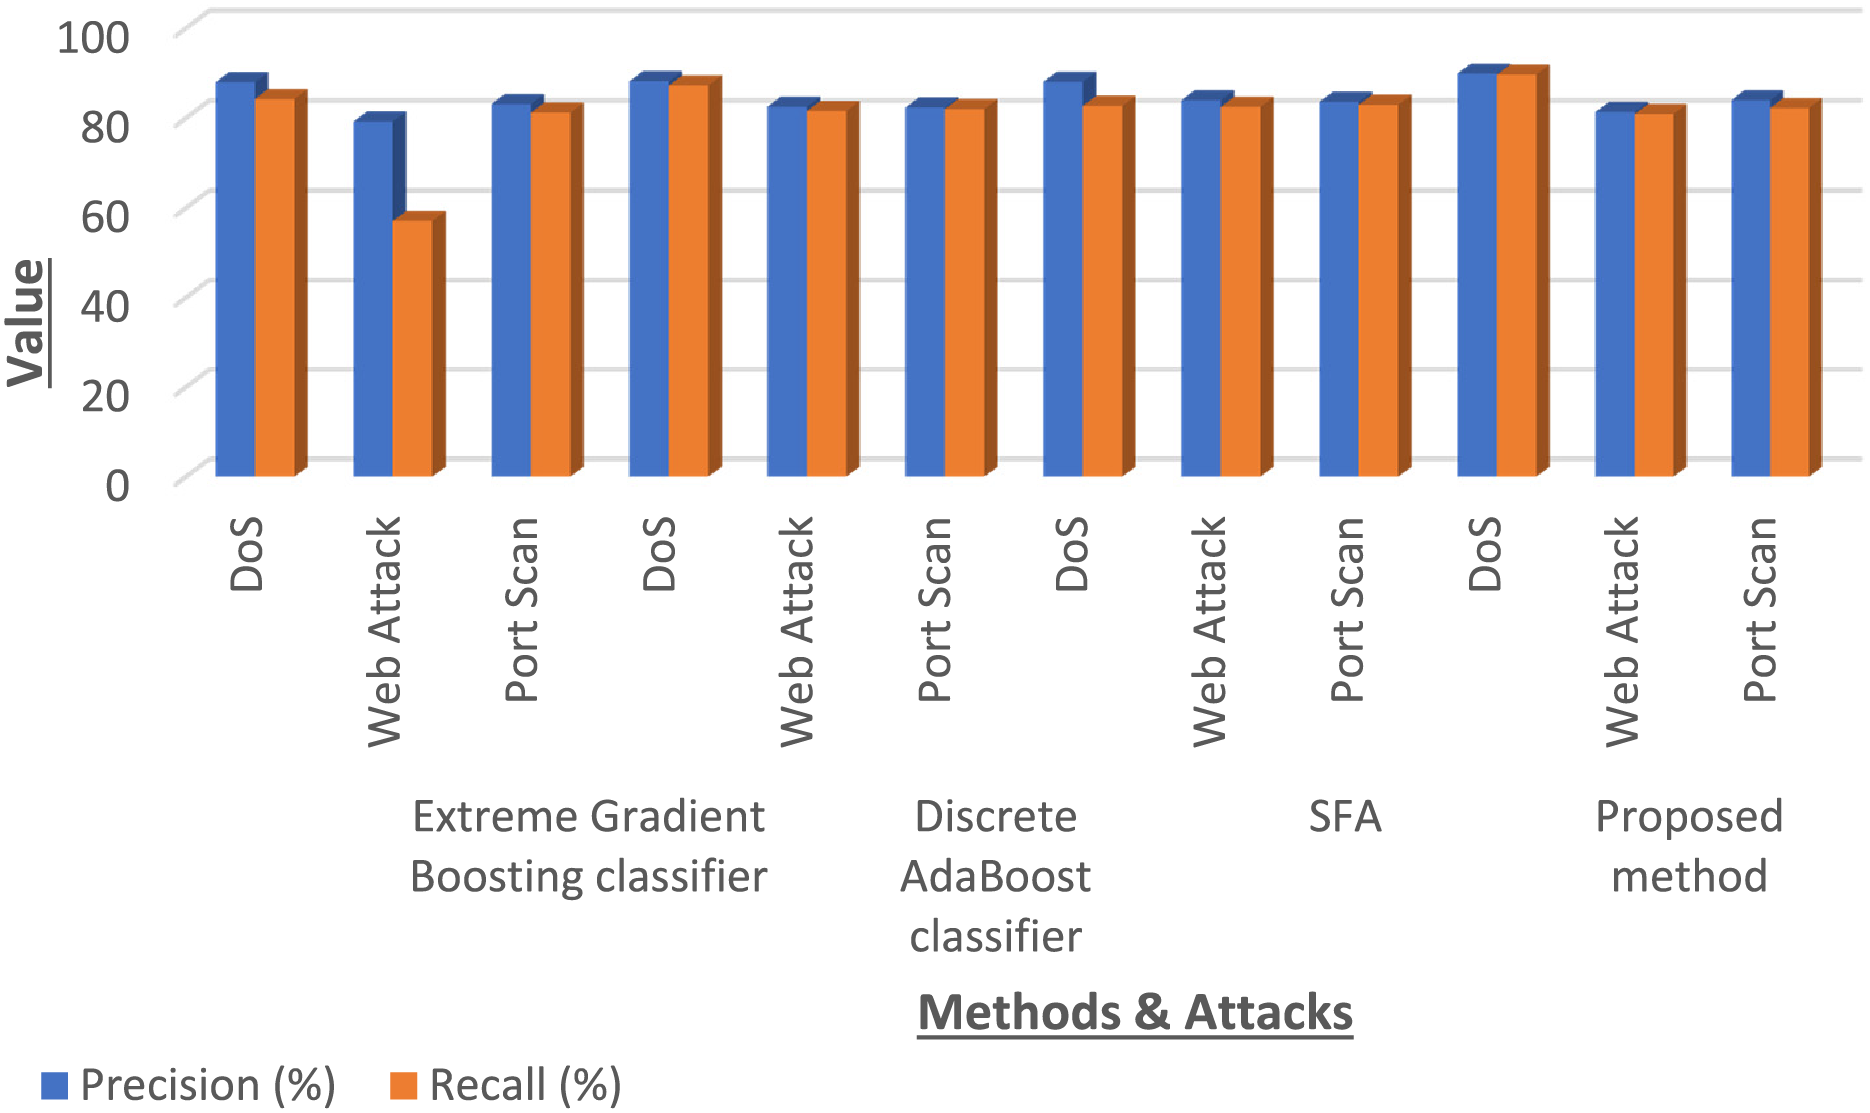
Figure 8: Comparing GFOA with classic methods on precision and recall for CICIDS threat classification

The AUC score provides an indication of the classifier’s level of accuracy and ranges from 0 to 100. If the number approaches 100, it is considered extremely high; otherwise, the classifier is considered inaccurate. According to this evaluation, the GFOA has a high capacity to detect port scans, achieving a notable AUC score of 90.05% with an extremely low error of 1.663. Extreme gradient boosting achieved an AUC score of 81.11% and an error rate of 1.757 for the same attacks. The SFA had an AUC score of 89.93% and an error rate of 1.692 for the same attacks, and the discrete AdaBoost classifier had an AUC score of 89.17% and an error rate of 1.739 for port scan attacks. This comparative analysis, particularly focusing on the AUC scores and error rates of the multi-classification capabilities of the GFOA and traditional approaches, is depicted in Fig. 9, which provides a clear visual representation of the superior performance and efficiency of the GFOA in threat detection and classification.
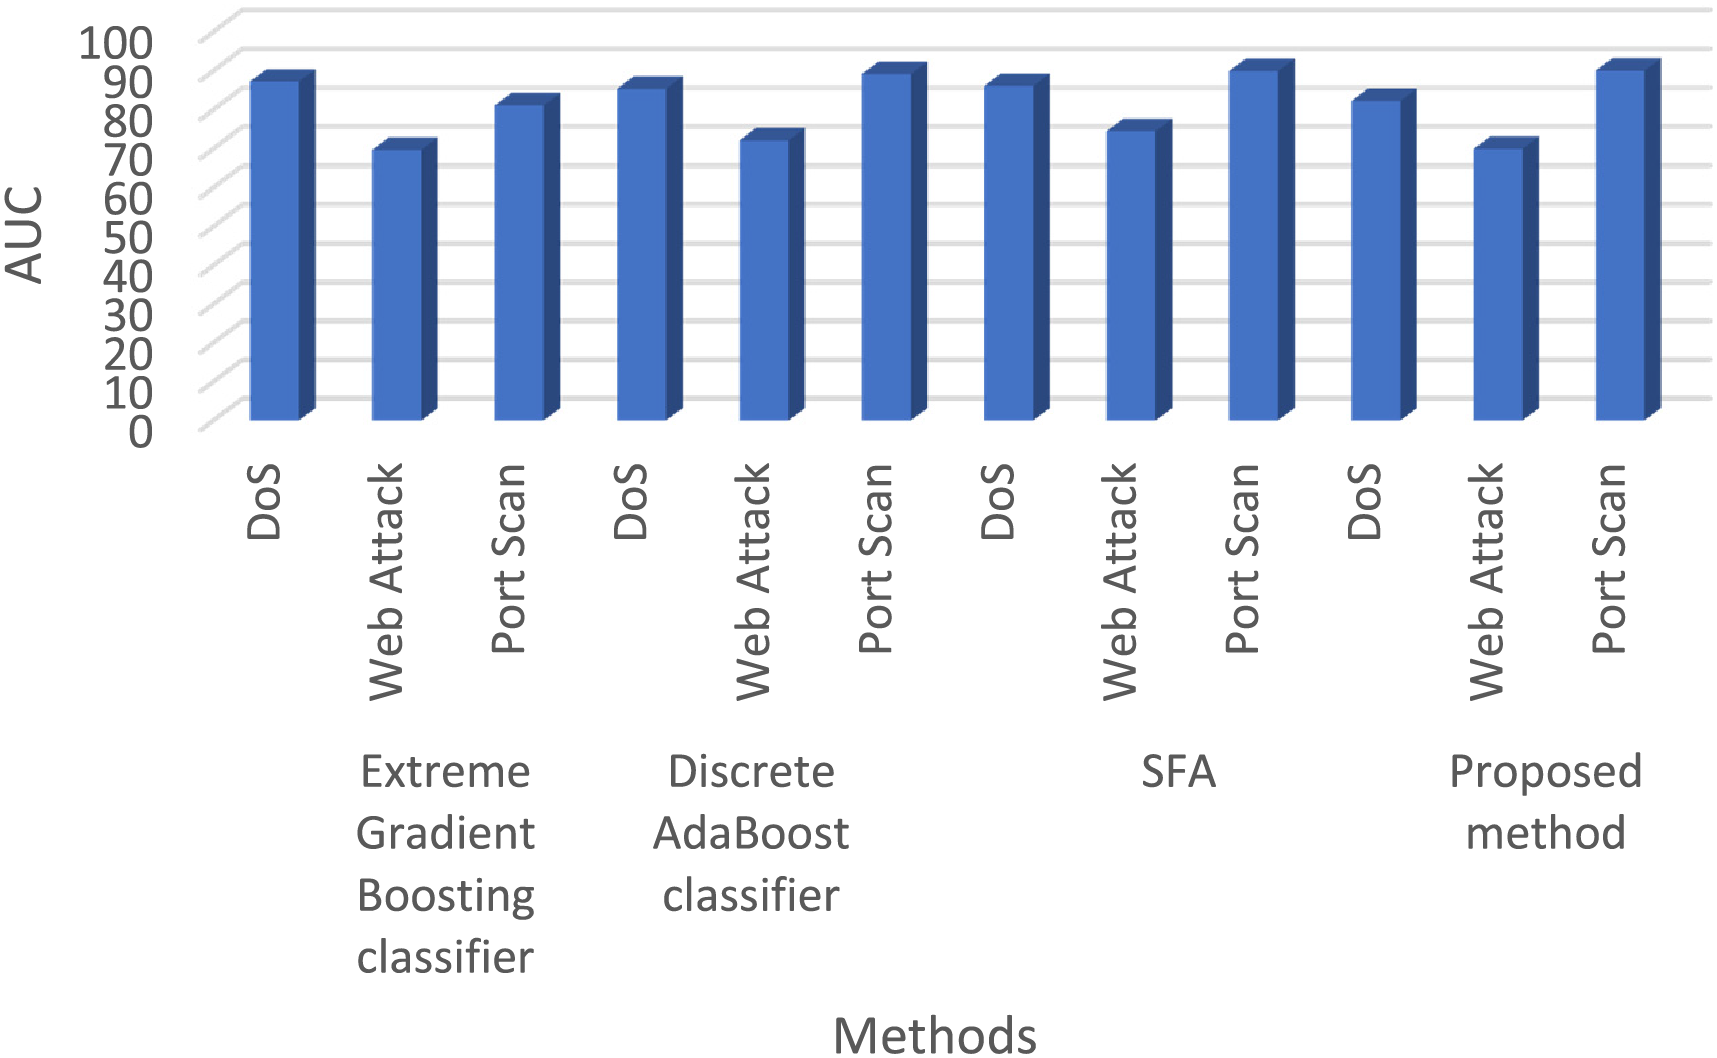
Figure 9: AUC score showdown: GFOA vs. conventional methods on the CICIDS dataset
The proposed GFOA performs better than traditional classification methods, as shown in Fig. 10, which shows the error rates for multi-classification on the UNSW-NB15 dataset. For the UNSW-NB15 dataset, Table 5 summarizes a full breakdown of the classification performance metrics, including the error rate, false negative rate, false positive rate, recall, F-measure, and accuracy. This in-depth analysis pits the performance of the GFOA against that of widely recognized classifiers, such as extreme gradient boosting and discrete AdaBoost classifiers. The study showed that GFOA performed better on the UNSW-NB15 dataset, with accuracy, precision, recall, and F-measure rates of 86.25%, 86.07%, 86.82%, and 86.99%, respectively. It also had error, false negative, and false positive rates of 0.007, 5, and 3, respectively. By contrast, the extreme gradient boosting classifier achieved an accuracy of 85.37%, precision of 89.59%, recall of 89.32%, F-measure of 89.95%, error rate of 0.0093, false negative rate of 4, and a significantly higher false positive rate of 22. In contrast, SFA reported 85.21% accuracy, 85.73% precision, 85.23% recall, 86.23% F-measure, 0.0096 error rate, four false negative rates, and 23 noticeably larger false positive rates. Then, Fig. 11 shows how the new GFOA compares to other methods by showing how the binary classification results on the UNSW-NB15 dataset differ.
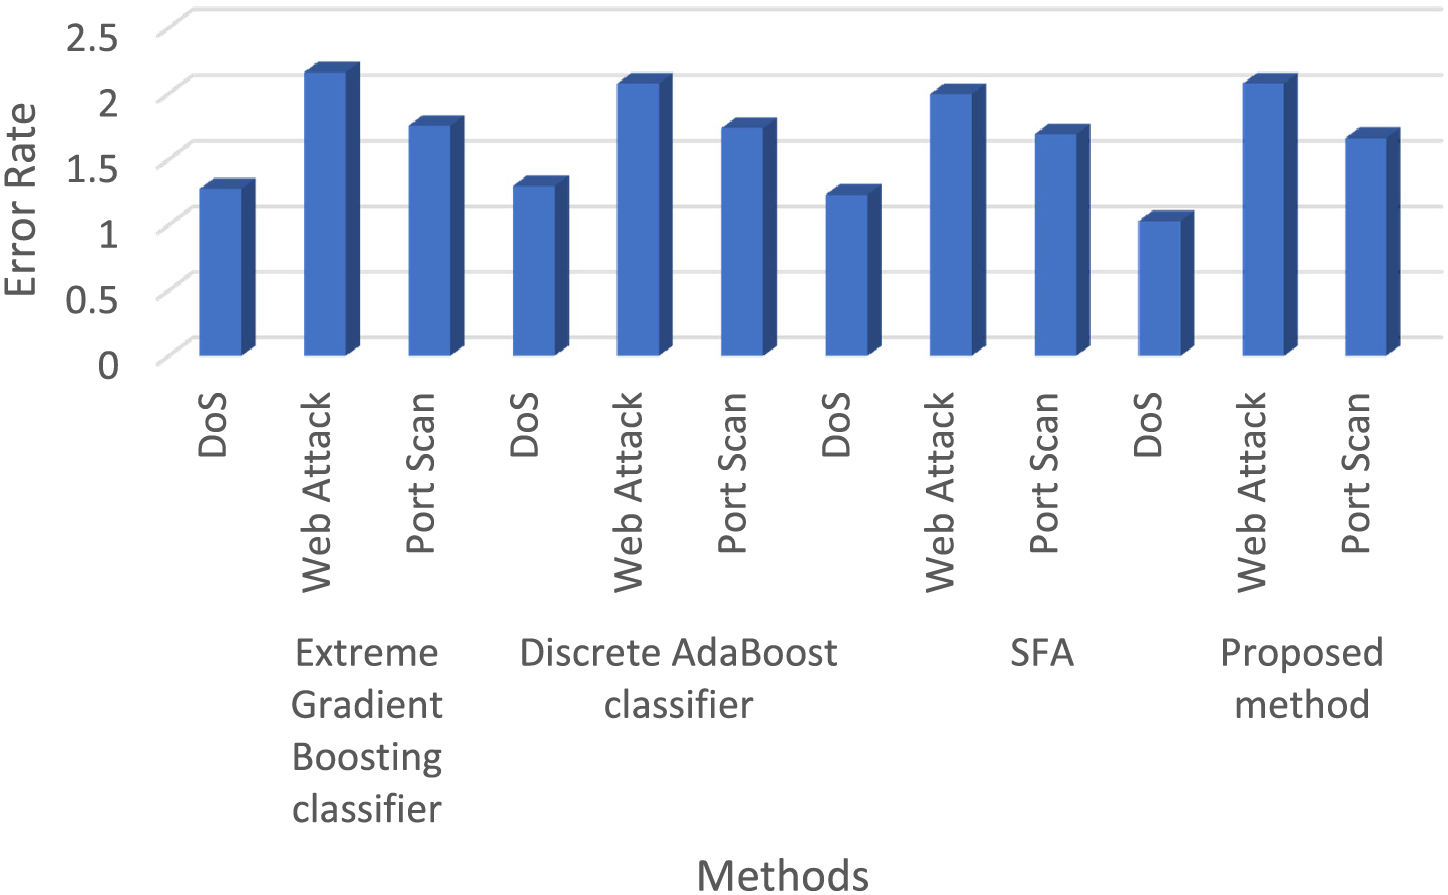
Figure 10: Comparing error rates in multi-classification: GFOA vs. traditional methods

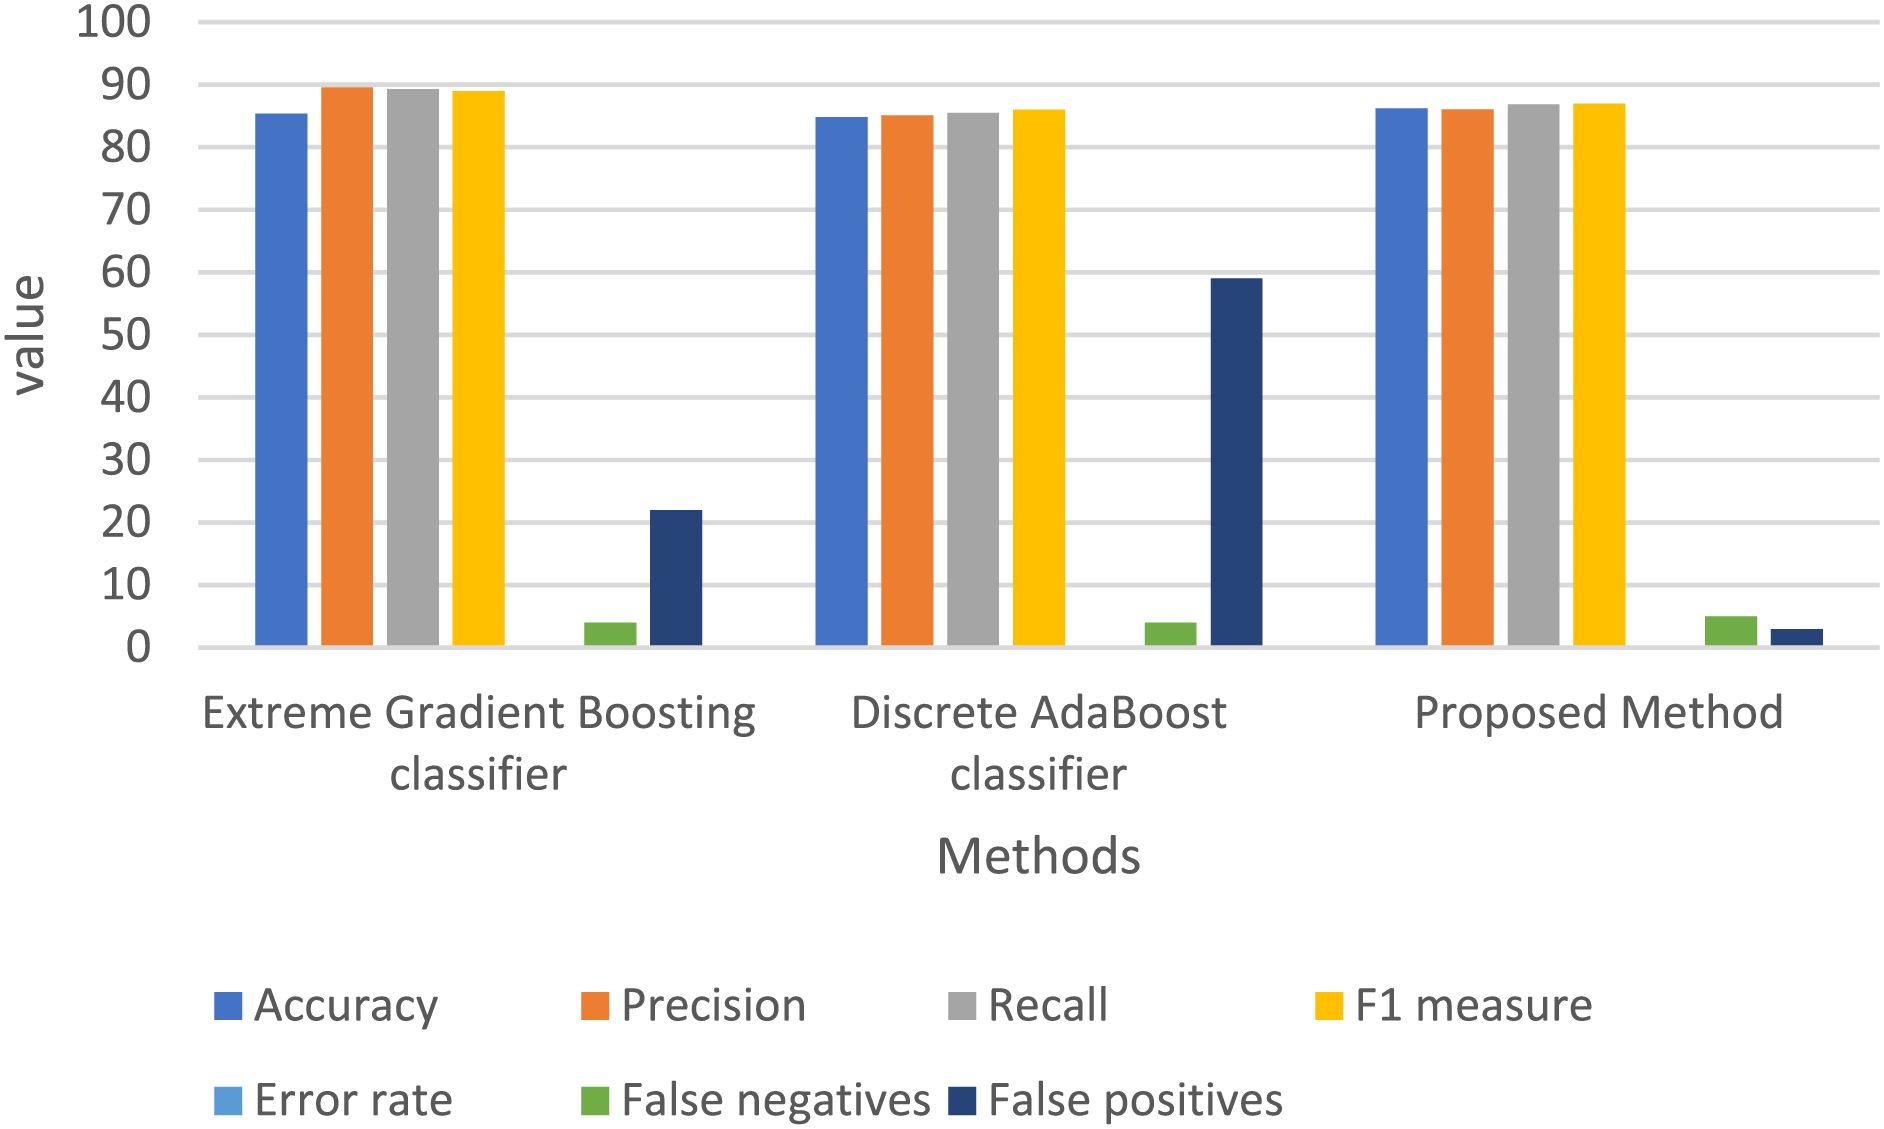
Figure 11: Binary classification showdown on UNSW-NB15: GFOA vs. traditional methods
This section compares how well the new GFOA works compared to well-known computer models such as feedforward neural networks (FNN), Vanilla long short-term memory (LSTM), and sparse deep belief networks (DBN) in terms of binary classification on the CICIDS dataset. This tabulated comparison against the key performance indicators developed and summarized in Table 6 includes accuracy, precision, recall, and F-measure. Specifically, traditional approaches only test against a subset of attack types compared to training, resulting in a significantly less optimal overall attack classification. By contrast, the GFOA substantially improved its classification ability through detailed training and data evaluation. The GFOA perfectly classified data for different types of attacks using the NB classifier, thereby increasing the classification accuracy. Notably, for the binary classification exercise of the CICIDS dataset, the GFOA exhibited the following results: precision, 86.34%; recall, 85.78%; and an F-measure of 85.45%. In contrast, the accuracy, precision, recall, and F-measure of the FNN approach were 82.34%, 83.98%, 83.99%, and 84.38%, respectively. Fig. 12 presents a comparison graph, which succinctly shows that the GFOA performed better in identifying and classifying attack detection threats. This comparison is shown between the GFOA and traditional models, which further proves that the GFOA has a better ability to detect attacks accurately than traditional models.

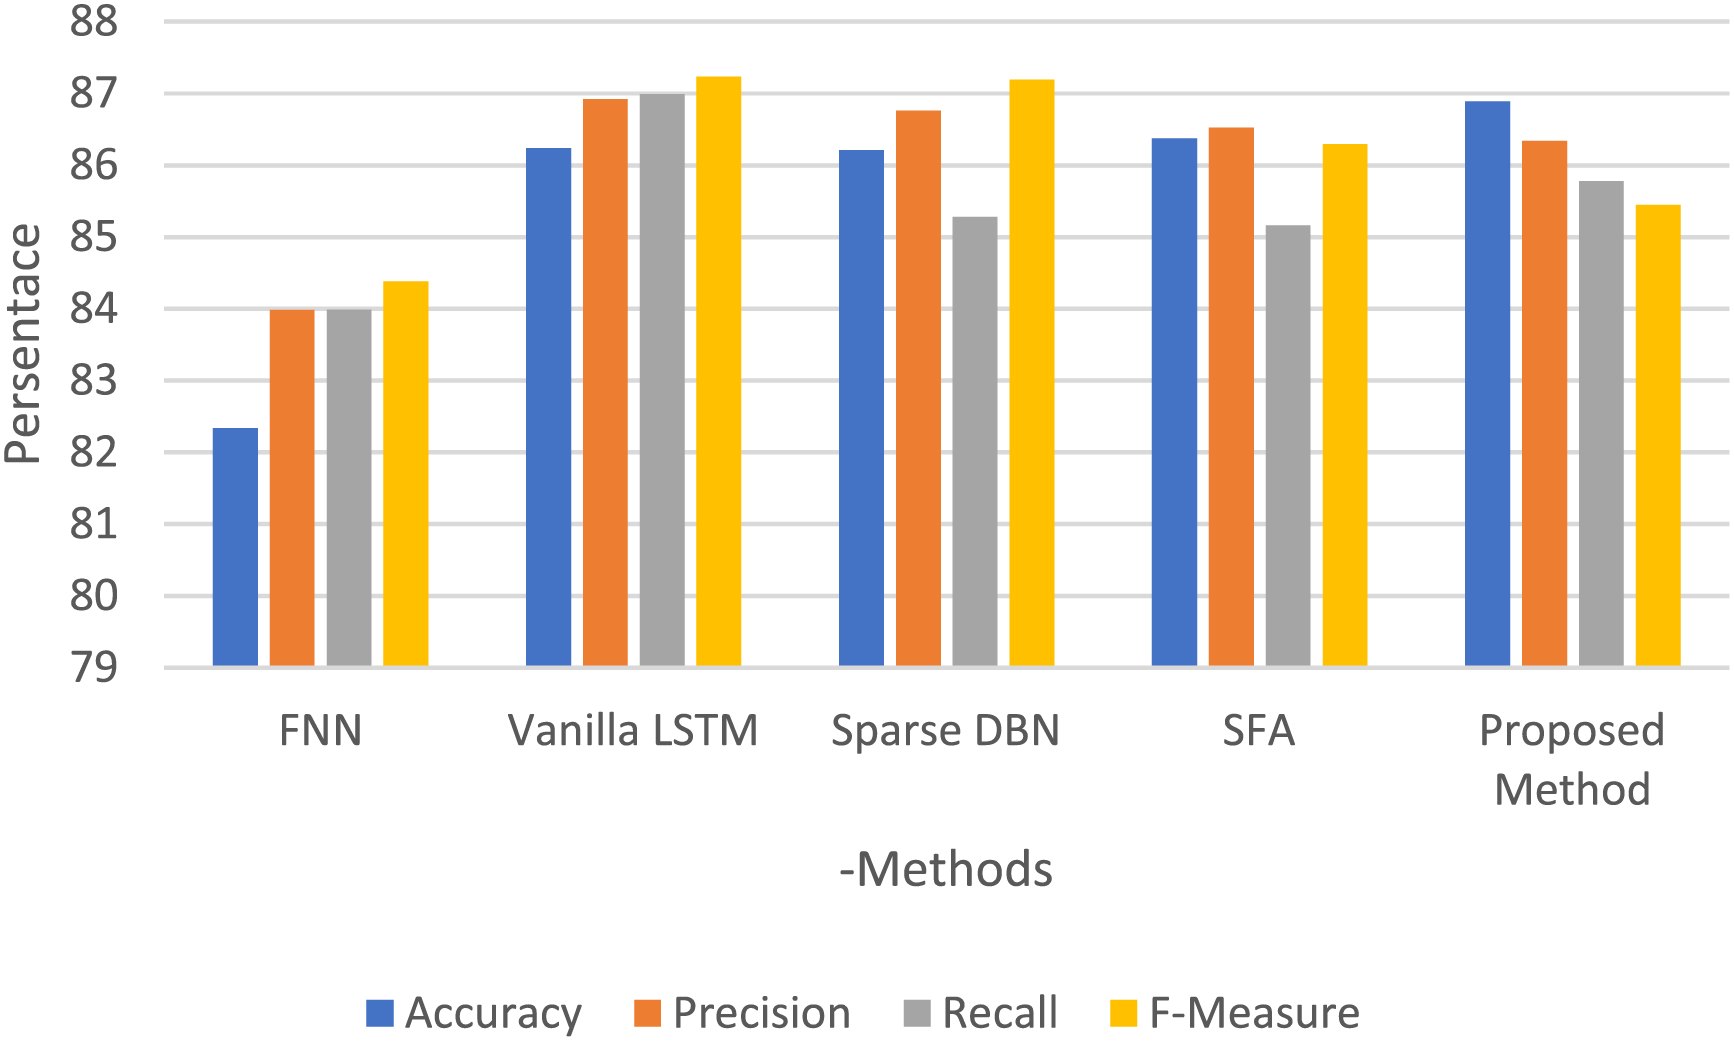
Figure 12: Performance graph for binary classification on UNSW-NB15: showcasing the GFOA
In this study, an innovative optimization method, the GFOA, is proposed for DoS, web attacks, and port scan threat detection in the IoT. When analyzing the key datasets (CICIDS and UNSW-NB15), it underwent preprocessing to eliminate noise and fill data gaps. Using PCA to extract features helped identify low-rate attacks and improved the selection process in the GFOA framework, which made the classifications more accurate. The NB classifier, at the heart of the classification phase, was instrumental in efficiently organizing data across various attack vectors, significantly improving the classification results. With extensive training and accurate data evaluation, the GFOA outperformed conventional gradient-boosting classifiers in attack classification.
Although the GFOA has not been used practically, its performance compared to the existing techniques has been quite remarkable. The GFOA outperformed the existing algorithms, indicating its potential in real-world practical applications. Such comparisons are important because they reveal an algorithm’s competence and constitute the first steps toward its practical implementation. We have confidence in the success that the GFOA will experience as well as in helping push IoT security measures forward.
However, a few limitations associated with the GFOA exist, which have only been tested using the CICIDS and UNSW-NB15 datasets; hence, its effectiveness on other datasets or in practical applications is yet to be demonstrated. Success depends on the preprocessing phase and the results are unlikely to be as effective under different data characteristics. PCA used for feature extraction may overlook important features that are useful for detecting sophisticated attacks. The performance of the NB classifier is data dependent and may not consistently offer high accuracy. However, its ability to generalize different types of attacks is yet to be proven. Additional studies are required to fine-tune this method. The current dependence on a single classifier suggests that improvements in detection accuracy and reliability can be achieved by integrating more types of classifiers.
In the context of IoT domain threats, the GFOA represents a significant improvement in terms of DoS, web attacks, and port scanning. The technique has exhibited promising results in its novel approach, but further development is required for its full potential to change the larger security landscape of the IoT. Specifically, it focuses on the scalability and adaptability of the method in different IoT ecosystems, resilience to emerging threats, and the integration of real-time data analysis to proactively mitigate threats. Future studies in these areas will strengthen the contribution of the GFOA to a robust and dynamic IoT security framework, leading to the final enhancement and improvement of defense against a spectrum of attacks in a secure IoT environment.
Acknowledgement: The author extends gratitude to the Department of Mathematics at the Open Educational College, Kirkuk Branch, for its invaluable support throughout this study.
Funding Statement: This research did not receive any specific grants from funding agencies in the public, commercial, or not-for-profit sectors.
Availability of Data and Materials: Data and materials for this study can be made available through an inquiry managed by Arkan Kh Shakr Sabonchi, under data and privacy guidelines and access, could be subject to limitations for confidentiality purposes, according to ethical and legal standards.
Ethics Approval: Not applicable.
Conflicts of Interest: The author declares that they have no conflicts of interest to report regarding the present study.
References
1. Y. Jia, F. Zhong, A. Alrawais, B. Gong, and X. Cheng, “FlowGuard: An intelligent edge defense mechanism against IoT DDoS attacks,” IEEE Internet Things J., vol. 7, no. 10, pp. 9552–9562, 2020. doi: 10.1109/JIOT.2020.2993782. [Google Scholar] [CrossRef]
2. P. Kumar, R. Kumar, G. P. Gupta, and R. Tripathi, “A distributed framework for detecting DDoS attacks in smart contract-based Blockchain-IoT systems by leveraging Fog computing,” Trans. Emerg. Telecommun. Technol., vol. 32, no. 6, 2021, Art. no. e4112. doi: 10.1002/ett.4112. [Google Scholar] [CrossRef]
3. C. O. Kumar and P. R. S. Bhama, “Detecting and confronting flash attacks from IoT botnets,” J. Supercomput., vol. 75, no. 12, pp. 8312–8338, 2019. doi: 10.1007/s11227-019-03005-2. [Google Scholar] [CrossRef]
4. G. Liu, W. Quan, N. Cheng, H. Zhang, and S. Yu, “Efficient DDoS attacks mitigation for stateful forwarding in Internet of Things,” J. Netw. Comput. Appl., vol. 130, pp. 1–13, Mar. 2019. doi: 10.1016/j.jnca.2019.01.006. [Google Scholar] [CrossRef]
5. J. Galeano-Brajones, J. Carmona-Murillo, J. F. Valenzuela-Valdés, and F. Luna-Valero, “Detection and mitigation of DoS and DDoS attacks in IoT-based stateful SDN: An experimental approach,” Sensors, vol. 20, no. 3, 2020, Art. no. 816. doi: 10.3390/s20030816. [Google Scholar] [PubMed] [CrossRef]
6. W. Chen, S. Xiao, L. Liu, X. Jiang, and Z. Tang, “A DDoS attacks traceback scheme for SDN-based smart city,” Comput. Elec. Eng., vol. 81, 2020, Art. no. 106503. doi: 10.1016/j.compeleceng.2019.106503. [Google Scholar] [CrossRef]
7. Z. R. Alashhab, M. Anbar, M. M. Singh, I. H. Hasbullah, P. Jain and T. A. Al-Amiedy, “Distributed denial of service attacks against cloud computing environment: Survey, issues, challenges and coherent taxonomy,” Appl. Sci., vol. 12, no. 23, Dec. 2022, Art. no. 12441. doi: 10.3390/app122312441. [Google Scholar] [CrossRef]
8. J. Li, M. Liu, Z. Xue, X. Fan, and X. He, “RTVD: A real-time volumetric detection scheme for DDoS in the Internet of Things,” IEEE Access, vol. 8, pp. 36191–36201, 2020. doi: 10.1109/ACCESS.2020.2974293. [Google Scholar] [CrossRef]
9. C. D. McDermott, F. Majdani, and A. V. Petrovski, “Botnet detection in the Internet of Things using deep learning approaches,” presented at the 2018 Int. Joint Conf. Neural Netw. (IJCNN), Rio de Janeiro, Brazil, 2018, pp. 1–8. doi: 10.1109/IJCNN.2018.8489489. [Google Scholar] [CrossRef]
10. Y. Meidan et al., “N-BaIoT-network-based detection of IoT botnet attacks using deep autoencoders,” IEEE Pervasive Comput., vol. 17, no. 3, pp. 12–22, 2018. doi: 10.1109/MPRV.2018.03367731. [Google Scholar] [CrossRef]
11. N. Ravi and S. M. Shalinie, “Learning-driven detection and mitigation of DDoS attack in IoT via SDN-cloud architecture,” IEEE Internet Things J., vol. 7, no. 4, pp. 3559–3570, 2020. doi: 10.1109/JIOT.2020.2973176. [Google Scholar] [CrossRef]
12. M. Roopak, G. Y. Tian, and J. Chambers, “Multi-objective-based feature selection for DDoS attack detection in IoT networks,” IET Netw., vol. 9, no. 3, pp. 120–127, 2020. doi: 10.1049/iet-net.2018.5206. [Google Scholar] [CrossRef]
13. M. Aljebreen, H. A. Mengash, M. A. Arasi, S. S. Aljameel, A. S. Salama and M. A. Hamza, “Enhancing DDoS attack detection using snake optimizer with ensemble learning on Internet of Things environment,” IEEE Access, vol. 11, pp. 104745–104753, 2023. doi: 10.1109/ACCESS.2023.3318316. [Google Scholar] [CrossRef]
14. M. Aljebreen, F. S. Alrayes, M. Maray, S. S. Aljameel, A. S. Salama and A. Motwakel, “Modified equilibrium optimization algorithm with deep learning-based DDoS attack classification in 5G networks,” IEEE Access, vol. 11, pp. 108561–108570, 2023. doi: 10.1109/ACCESS.2023.3318176. [Google Scholar] [CrossRef]
15. G. Kaur and P. Gupta, “Detection of distributed denial of service attacks for IoT-based healthcare systems,” Comput. Assist. Method Eng. Sci., vol. 30, no. 2, pp. 167–186, 2022. [Google Scholar]
16. N. Sivanesan and K. S. Archana, “Detecting distributed denial of service (DDoS) in SD-IoT environment with enhanced firefly algorithm and convolution neural network,” Opt. Quantum Electron., vol. 55, no. 5, p. 393, 2023, Art. no. 3931. doi: 10.1007/s11082-023-04553-x. [Google Scholar] [CrossRef]
17. E. S. GSR, R. Ganeshan, I. D. J. Jingle, and J. P. Ananth, “FACVO-DNFN: Deep learning-based feature fusion and distributed Denial of Service attack detection in cloud computing,” Knowl.-Based Syst., vol. 261, Jan. 2023, Art. no. 110132. doi: 10.1016/j.knosys.2022.110132. [Google Scholar] [CrossRef]
18. A. B. de Neira, B. Kantarci, and M. Nogueira, “Distributed denial of service attack prediction: Challenges, open issues and opportunities,” Comput. Netw., vol. 222, 2023, Art. no. 109553. doi: 10.1016/j.comnet.2022.109553. [Google Scholar] [CrossRef]
19. F. M. Aswad et al., “Deep learning in distributed denial-of-service attacks detection method for Internet of Things networks,” J. Intell. Syst., vol. 32, no. 1, 2023, Art. no. 20220155. doi: 10.1515/jisys-2022-0155. [Google Scholar] [CrossRef]
20. D. Stiawan, M. Y. Idris, A. M. Bamhdi, and R. Budiarto, “CICIDS-2017 dataset feature analysis with information gain for anomaly detection,” IEEE Access, vol. 8, pp. 132911–132921, 2020. doi: 10.1109/ACCESS.2020.3009843. [Google Scholar] [CrossRef]
21. S. Choudhary and N. Kesswani, “Analysis of KDD-Cup’99, NSL-KDD and UNSW-NB15 datasets using deep learning in IoT,” Procedia Comput. Sci., vol. 167, pp. 1561–1573, 2020. doi: 10.1016/j.procs.2020.03.367. [Google Scholar] [CrossRef]
22. H. Hasbullah and I. A. Soomro, “Denial of service (DOS) attack and its possible solutions in VANET,” Int. J. Electron. Commun. Eng., vol. 4, no. 5, pp. 813–817, 2010. [Google Scholar]
23. D. Everson, L. Cheng, and Z. Zhang, “Log4shell: Redefining the web attack surface,” in Workshop on Meas., Attacks, Defenses Web (MADWeb), San Diego, CA, USA, Apr. 28, 2022. doi: 10.14722/madweb.2022.23010. [Google Scholar] [CrossRef]
24. X. S. Yang, “Firefly algorithms for multimodal optimization,” in 5th Int. Symp., Int. Symp. Stoch. Algorith. (SAGA), Sapporo, Japan, Oct. 26–28, 2009, pp. 169–178. [Google Scholar]
25. X. -S. Yang and X. He, “Firefly algorithm: Recent advances and applications,” Int. J. Swarm Intell., vol. 1, no. 1, pp. 36–50, 2013. doi: 10.1504/IJSI.2013.055801. [Google Scholar] [CrossRef]
26. S. Łukasik and S. Żak, “Firefly algorithm for continuous constrained optimization tasks,” in Int. Conf. Comput. Collective Intell., Wroclaw, Poland, Oct. 5–7, 2009, pp. 97–106. [Google Scholar]
27. A. Yelghi and C. Köse, “A modified firefly algorithm for global minimum optimization,” Appl. Soft Comput., vol. 62, pp. 29–44, 2018. doi: 10.1016/j.asoc.2017.10.032. [Google Scholar] [CrossRef]
28. X. -S. Yang, Nature-Inspired Metaheuristic Algorithms. Beckington, UK: Luniver Press, 2010. [Google Scholar]
29. H. Wang et al., “Firefly algorithm with neighborhood attraction,” Inform. Sci., vol. 382, pp. 374–387, 2017. doi: 10.1016/j.ins.2016.12.024. [Google Scholar] [CrossRef]
30. H. S. Alhadawi, D. Lambić, M. F. Zolkipli, and M. Ahmad, “Globalized firefly algorithm and chaos for designing substitution box,” J. Inf. Secur. Appl., vol. 55, 2020, Art. no. 102671. doi: 10.1016/j.jisa.2020.102671. [Google Scholar] [CrossRef]
31. A. H. Gandomi, X. S. Yang, S. Talatahari, and A. H. Alavi, “Firefly algorithm with chaos,” Commun. Nonlinear Sci. Numer. Simul., vol. 18, no. 1, pp. 89–98, 2013. doi: 10.1016/j.cnsns.2012.06.009. [Google Scholar] [CrossRef]
32. K. P. Murphy, Naive Bayes Classifiers. Vancouver, BC, Canada: University of British Columbia, 2006, vol. 60, pp. 1–8. [Google Scholar]
33. A. Bansal and S. Kaur, “Extreme gradient boosting based tuning for classification in intrusion detection systems,” in Adv. Comput. Data Sci.: Second Int. Conf., Dehradun, India, Apr. 20–21, 2018, pp. 372–380. [Google Scholar]
34. W. Hu, W. Hu, and S. Maybank, “AdaBoost-based algorithm for network intrusion detection,” IEEE Trans. Syst., Man, Cybern., Part B (Cybern.), vol. 38, no. 2, pp. 577–583, 2008. doi: 10.1109/TSMCB.2007.914695. [Google Scholar] [PubMed] [CrossRef]
Cite This Article
 Copyright © 2024 The Author(s). Published by Tech Science Press.
This work is licensed under a Creative Commons Attribution 4.0 International License , which permits unrestricted use, distribution, and reproduction in any medium, provided the original work is properly cited.


 Submit a Paper
 Propose a Special lssue
 View Full Text
 Download PDF
 Downloads
 Citation Tools