 Open Access
ARTICLE
An Optimisation Strategy for Electric Vehicle Charging Station Layout Incorporating Mini Batch K-Means and Simulated Annealing Algorithms
School of Information and Communication Engineering, Nanjing Institute of Technology, Nanjing, 211167, China
* Corresponding Author: Peng Geng. Email:
Journal on Artificial Intelligence 2024, 6, 283-300. https://doi.org/10.32604/jai.2024.056303
Received 19 July 2024; Accepted 30 September 2024; Issue published 18 October 2024
Abstract
To enhance the rationality of the layout of electric vehicle charging stations, meet the actual needs of users, and optimise the service range and coverage efficiency of charging stations, this paper proposes an optimisation strategy for the layout of electric vehicle charging stations that integrates Mini Batch K-Means and simulated annealing algorithms. By constructing a circle-like service area model with the charging station as the centre and a certain distance as the radius, the maximum coverage of electric vehicle charging stations in the region and the influence of different regional environments on charging demand are considered. Based on the real data of electric vehicle charging stations in Nanjing, Jiangsu Province, this paper uses the model proposed in this paper to optimise the layout of charging stations in the study area. The results show that the optimisation strategy incorporating Mini Batch K-Means and simulated annealing algorithms outperforms the existing charging station layouts in terms of coverage and the number of stations served, and compared to the original charging station layouts, the optimised charging station layouts have flatter Lorentzian curves and are closer to the average distribution. The proposed optimisation strategy not only improves the service efficiency and user satisfaction of EV (Electric Vehicle) charging stations but also provides a reference for the layout optimisation of EV charging stations in other cities, which has important practical value and promotion potential.Keywords
With the increasingly severe global climate change and energy crisis, green travelling and clean energy transition have become the focus of attention for governments and all sectors of society. Since the 18th National Congress of the Chinese Communist Party, the Chinese government has attached great importance to developing the new energy vehicle industry and taken it as an important strategy to promote economic restructuring and achieve sustainable development. As a representative of new energy vehicles, electric vehicles (EVs) not only play an important role in reducing greenhouse gas emissions and improving urban air quality but also become a key area for promoting national energy security and technological innovation. The popularity of EVs cannot be separated from a perfect charging infrastructure. As an important energy supply point, the planning, construction, and operation of EV charging stations are directly related to the convenience and economy of EV use. Therefore, it is of great significance to study the layout optimisation of electric vehicle charging stations to promote the sustainable development of the electric vehicle industry.
To support the sustainable development of the electric vehicle industry, this paper will examine in detail the optimisation of the layout of electric vehicle charging stations to meet the future charging demand of the growing electric vehicle population. This paper will analyse the geographical information within the city and then design a charging station network with wide coverage.
This paper focuses on the overall planning of the construction of EV charging stations rather than the engineering details of its various aspects. Modern transport systems need to be considered from a holistic perspective. The electrification of transport is necessary to meet national requirements for environmental protection in the transport sector, and this depends on the growth of the number of electric vehicles. The experience of the driver and the wide coverage of the energy supply are important factors that influence the growth of the number of electric vehicles in cities. Therefore, optimising the layout of EV charging stations is essential to increase the attractiveness and popularity of EVs.
Our main contributions include the following:
• Proposes an electric vehicle charging station layout algorithm based on Mini Batch K-Means and a simulated annealing algorithm, which avoids the problem of Mini Batch K-Means initial clustering points falling into local optimum.
• Proposes an EV charging station layout optimisation strategy based on single-source POI data, which is also generic to other cities.
The rest of the paper is organised as follows. Section 2 analyses the related work. Section 3 demonstrates the initial screening of POIs (Points of Interest). Section 4 proposes an EV charging station layout algorithm based on Mini Batch K-Means and a simulated annealing algorithm. Experimental results for Nanjing are provided in Section 5. Finally, the paper is concluded in Section 6.
In the field of EV charging station layout optimisation, literature [1] proposed an EV charging station layout optimisation method to enhance the flexibility of the power system and facilitate the integration of renewable energy sources and demonstrates the potential of the method to reduce carbon emissions and optimise the charging infrastructure, using Jiangxi Province as a case study. Literature [2] proposed a genetic algorithm-based approach for optimal deployment of electric vehicle charging stations using location tracking data from large-scale mobile phone users to reduce the number of charging stations and the extra driving distance drivers have to travel to reach the charging stations. Literature [3] optimised the layout of electric vehicle charging stations using urban informatics data by developing a methodological framework based on an improved geographic PageRank model and a capacity-constrained model of the maximum coverage location problem to improve charging station utilisation and reduce spatial mismatches in charging demand. Literature [4] compared planning-oriented and market-oriented EV public charging infrastructure deployment strategies through an agent-based model and found that the planning-oriented strategy is more conducive to initial market cultivation, while the market-oriented strategy is superior in terms of long-term cost efficiency. Literature [5] proposed an optimal design model for EV charging stations based on service balance considerations, uses a nonlinear autoregressive neural network to predict the number of EVs, and solves the model efficiently through a hybrid heuristic algorithm GA-BPSO (Genetic Algorithm and Binary Particle and Swarm Optimisation), and finally verifies the reasonableness of the methodology through a case study in Cixi City. Literature [6] proposed a multi-objective approach to optimise the planning of fast charging stations using the MOSAPSO (multi-objective simulated annealing particle swarm optimisation) algorithm by taking into account factors such as urban functional zoning, traffic flow, and signal light waiting time to improve the profitability and user satisfaction of charging stations. Literature [7] proposed a dynamic demand-based multi-period optimisation model to optimise the location and size of EV charging stations in urban areas by combining a genetic algorithm and centroid clustering algorithm to improve the quality of charging services and promote the market penetration of EVs. Literature [8] proposed a data-based approach to optimise the layout of existing EV charging stations to improve utilisation, reduce resource wastage and help solve charging problems by representing the correlation of charging behaviours among different charging stations, hours, and days with a 3D (3 Dimensions) tensor model, which was applied in Wuhan to demonstrate its effectiveness. Literature [9] proposed a data-driven shared charging station siting model to optimise the charging station layout to balance the supply and demand by taking into account factors such as electric vehicle mileage, distribution and passenger demand, and verifies the effectiveness of the model through a case study in Nanjing. Literature [10] proposed a two-tier EV charging station recommendation strategy based on the influence of multiple factors, aiming to solve the aggregation effect caused by the disorderly charging of EVs, optimise the EV charging service system, and improve user satisfaction.
Most of the above literature uses multi-source data, and some of the data may be more difficult to obtain in other cities, with poor generalisability. For this reason, this paper proposes an EV charging station layout optimisation model based on POIs [11] fused with Mini Batch K-Means [12] and a simulated annealing algorithm [13], which uses only POI single-source data, which is simple to obtain, and confirms the charging station deployment in the study area through the profile coefficients [14], according to pre-screened types of POIs influencing charging station deployment K-value of Mini Batch K-Means, and optimise the charging station deployment for each study area using the fusion algorithm. To achieve full coverage of charging station areas and sparsity in different areas, the effectiveness of the strategy is verified through simulation and analysis of electric vehicle charging stations in Nanjing, Jiangsu Province.
3 Initial Screening of POI Types
POI (Point of Interest), is the representation of a geographical location with specific characteristics or importance on a map or GIS (Geographic Information System). Before constructing the electric vehicle charging station layout optimisation model, since this paper uses single source data POI, the most important thing is the selection of the type of POI of the influencing factors. According to the first level of classification, the second level of classification can be POI data of important places in Nanjing City by the two districts and three centres, respectively, residential areas, office areas, commercial centres, industrial centres, leisure centres, the specific POIs selected in this paper are shown in Table 1 below.

Residential and office areas are undoubtedly the two key parts of EV charging station construction, as they are the core places of people’s daily life and work, with long stay time and stable charging demand. Constructing charging facilities in these areas not only facilitates users to charge during their daily activities and reduces charging anxiety, but also gains community and commercial support, while utilising the existing space for an efficient layout, promoting the popularity of electric vehicles and sustainable urban development.
Industrial centres are likewise an influential factor in the construction of electric vehicle charging stations. Industrial centres are often home to a large number of factories, businesses and offices, which are not only the locations where employees work daily but also the operating bases for a large number of transport and commercial vehicles. The construction of charging facilities in these locations can meet the changing needs of commercial vehicles and logistics vehicles during long periods of operation, thus significantly reducing the use of traditional fuel vehicles, environmental pollution and carbon emissions. At the same time, industrial centres usually have well-developed infrastructures and extensive land space, which is conducive to the placement and expansion of charging stations.
Commercial and leisure centres are also considerations for the construction of charging stations. Commercial centres are the core areas of economic activity in cities, with a large concentration of office buildings, shopping centres, food and beverage establishments and other commercial facilities. Constructing charging facilities in these areas can facilitate charging for thousands of office workers, customers and business visitors, meeting their charging needs in the course of business activities or during their leisure time, and enhancing the user’s charging convenience and charging experience. Leisure centres such as parks, sports venues, entertainment venues and tourist attractions are usually places where large numbers of city residents and tourists gather. Constructing charging stations in these areas can provide convenient charging services to tourists and residents, supporting their convenience in using energy supplies during leisure and recreational activities.
4 An Optimisation Model for Electric Vehicle Charging Station Layout Incorporating Mini Batch K-Means and Simulated Annealing Algorithm
In this section, based on the previous screening of POI types, an EV charging station layout optimisation model incorporating Mini Batch K-Means and a simulated annealing algorithm is constructed and the model results are further evaluated. The research programme is shown in Fig. 1.
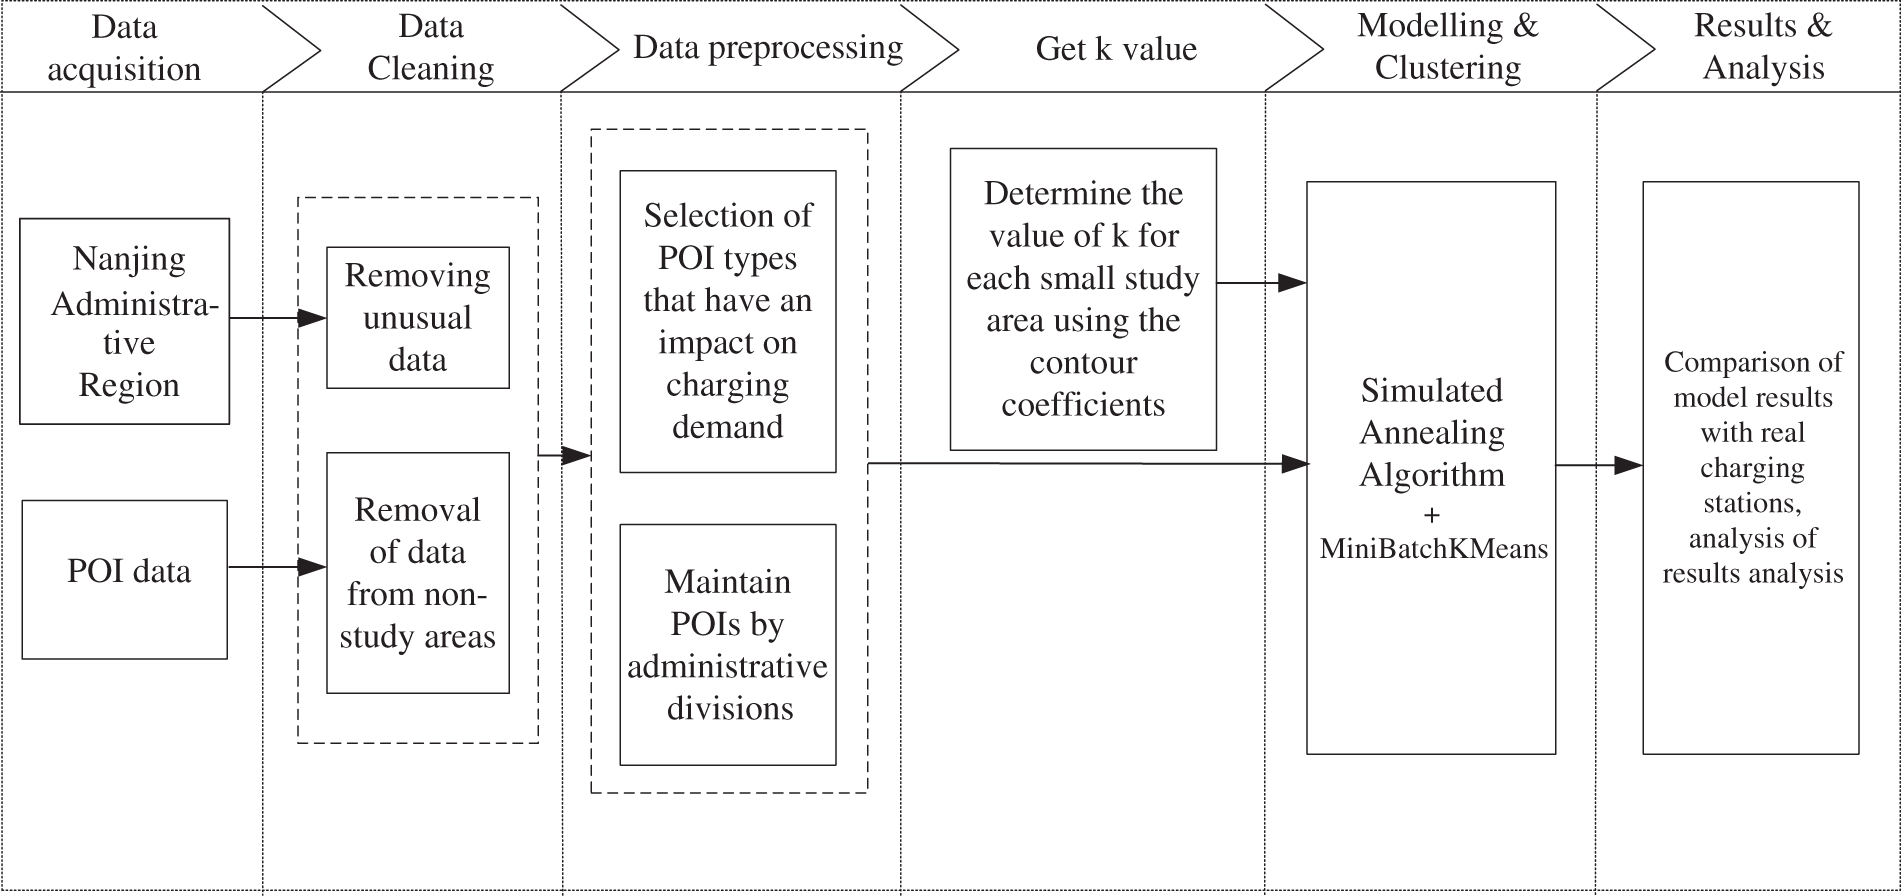
Figure 1: Block diagram of the research programme
First, the study area was subdivided into 11 study sub-areas based on administrative regions. Subsequently, the POI data belonging to the 11 study subregions were screened and abnormal residual data were removed. The POI data of the 11 research sub-regions were then clustered using Mini Batch K-Means, and the centre of each cluster was perturbed using a simulated annealing algorithm to avoid falling into a local optimum. For the K-value of Mini Batch K-Means, this paper uses the contour coefficient to determine it, and the closer the contour coefficient is to 1, the better the separation of clusters from other clusters is proved.
Considering that Nanjing is the fifth largest city in China and the amount of POI data is huge, this paper uses Mini Batch K-Means to cluster POI data. The Mini Batch K-Means [12] algorithm is an optimised variant of the K-Means [15] algorithm, which reduces the computation time by using a small subset of the data, and at the same time optimises the objective function, to reduce convergence time while maintaining similar results to the standard K-Means algorithm.
The algorithm flow is roughly as follows:
1) Randomly Extract Mini-Batch: a mini-batch dataset of fixed size is randomly extracted from the entire dataset.
2) Update Nearest Cluster Centre: For each extracted data point, calculate its distance from the current cluster centre and assign it to the cluster centre with the nearest distance.
3) Update Cluster Centres: For each new mini-batch data point, update the position of the cluster centre according to the cluster centre assigned to them. This is usually done using a moving average, i.e., a weighted average of the new sample points and the old cluster centres.
4) Convergence judgement: repeat the above steps until the conditions for stopping the iteration are met, e.g., the maximum number of iterations is reached, the change in the cluster centre is less than a certain threshold, etc.
4.2 Simulated Annealing Algorithm
Simulated Annealing is a global optimisation algorithm for searching for optimal solutions in the solution space. It simulates the principle of the solid annealing process to avoid falling into local optimal solutions by accepting the possibility of slightly worse solutions in the solution space.
The basic flow of the algorithm is as follows:
1) Select an initial solution and set an initial temperature (
2) Randomly perturb the current solution to produce a new one. This perturbation can be small or large, depending on the temperature.
3) Calculate the cost difference (
4) If the new solution is worse (
5) After each iteration or a certain number of iterations, the temperature
6) The algorithm terminates when the temperature is low enough or a predetermined number of iterations is reached.
4.3 Fusion of Mini Batch K-Means and Simulated Annealing Algorithms
Since the initial clustering centre of a single Mini Batch K-Means can easily fall into the local optimum and lead to unsatisfactory clustering results, this paper uses the simulated annealing algorithm to optimise the initial clustering centre of Mini Batch K-Means, to improve the clustering effect. The simulated annealing algorithm mimics the thermodynamic principle of the physical annealing process, allowing a certain probability of a ‘backward step’ in the solution process, which helps to jump out of the local optimal solution, and ultimately find the global optimal solution.
The model in this paper uses the Silhouette Coefficient to determine the K-value for each small region of the study. The Silhouette Coefficient (SC) is a measure of the quality of the clustering results. It combines the similarity of each data point to other data points within the same cluster and to data points
The contour coefficient for each study subregion is the average of the contour coefficients of all data points within the study subregion, as shown in (2):
Initialise the clustering centre
Mini Batch K-Means randomly selects a small batch
where
The goal of Mini Batch K-Means is to minimise the objective function and the formula is shown in (4):
where is a data point, is the centre of the
The simulated annealing is used to optimise the amount of change in the objective function, and the cost difference
where
The complete steps of the fusion algorithm in this paper are shown in Fig. 2.
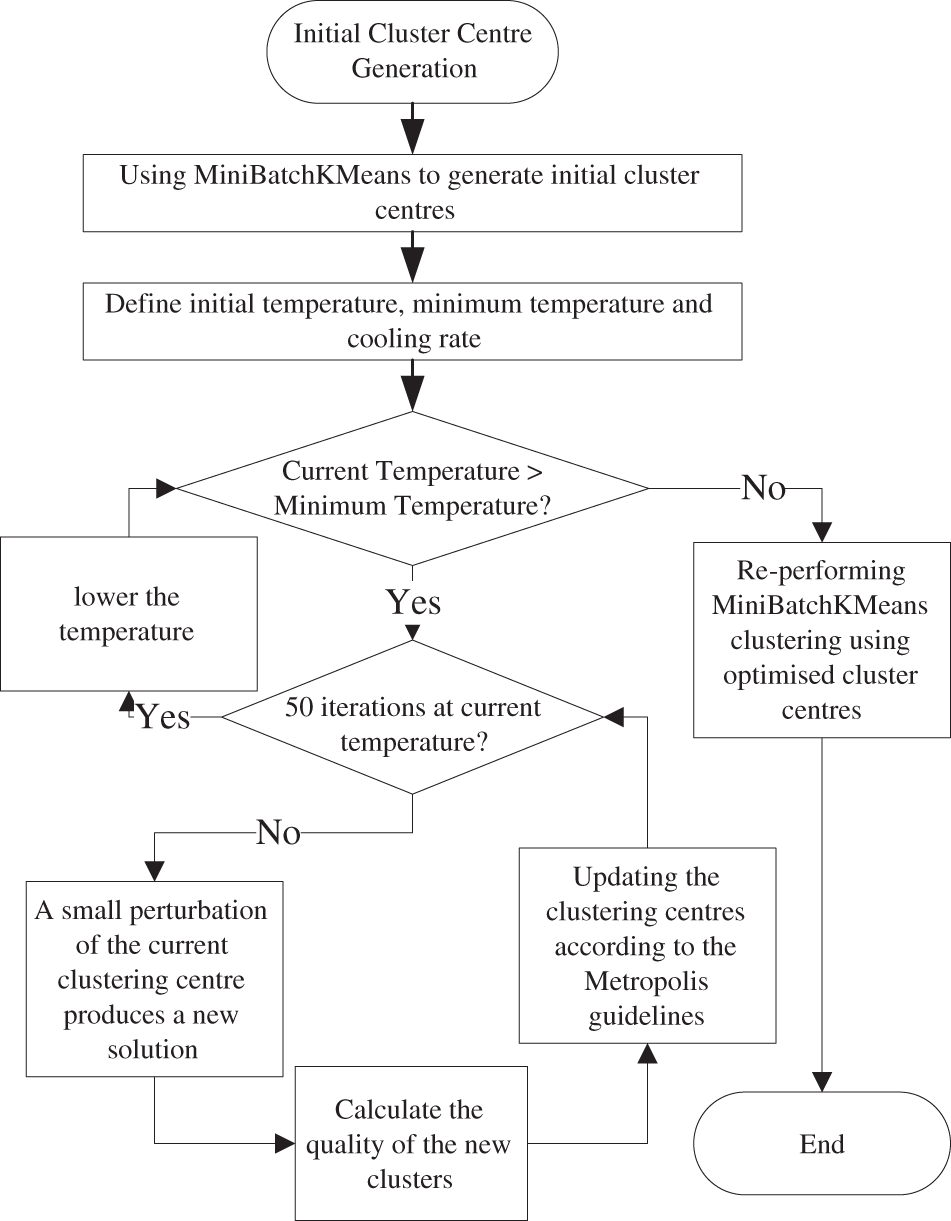
Figure 2: Flowchart of fusion algorithm
As shown in the figure, the fusion algorithm proposed in this paper contains three parts:
1) Initial Cluster Centre Generation: Mini Batch K-Means is used to generate the initial cluster centres.
2) Simulated annealing process:
• Define the initial temperature, minimum temperature and cooling rate.
• At each temperature, several iterations are performed.
• Perform a small perturbation to the current cluster centre to generate a new solution.
• Calculate the value of the objective function for the new solution.
• Update the clustering centres according to the Metropolis criterion.
• Reduce the temperature and repeat the above steps until the minimum temperature is reached.
3) Final clustering: re-perform Mini Batch K-Means clustering using the optimised clustering centres.
5.1 Purpose, Principle and Procedure of the Experiment
In this experiment, an electric vehicle charging station layout optimisation model incorporating simulated annealing algorithm and Mini Batch K-Means is constructed, aiming at balancing the problem of irrational distribution of charging stations through layout optimisation, and then enhancing the utilisation rate of electric vehicle charging stations. Since the EV charging station layout problem is a maximum coverage problem, firstly, the POI data of important places in Nanjing are selected and the abnormal or incomplete data are deleted, and then the POI data are divided into 11 study subregions according to the administrative area of Nanjing, and the optimal K-value within each study subregion is determined using the contour coefficient. Next, a fusion simulated annealing algorithm and Mini Batch K-Means were used to find the clustering centres for each study subregion. Finally, the model results were compared to traditional K-Means and the results were analysed.
The experiments were written in Python in PyCharm 2023 and conducted on a computer equipped with 32 GB RAM and a 12th Gen Intel(R) Core(TM) i5-12500H processor. The POI data of Nanjing was obtained from Gaode Map API (Application Programming Interface), the vector file of the Nanjing administrative area was obtained from the “OpenStreetMap” platform, and the geographic coordinate system was WGS84 (World Geodetic System 1984).
To ensure the accuracy of the geographic location of EV charging stations obtained after clustering the POI data from a single source, the POI data are screened out of the POI data of important places by Table 1 and the abnormal error data are removed, and the processing results are shown in Fig. 3.
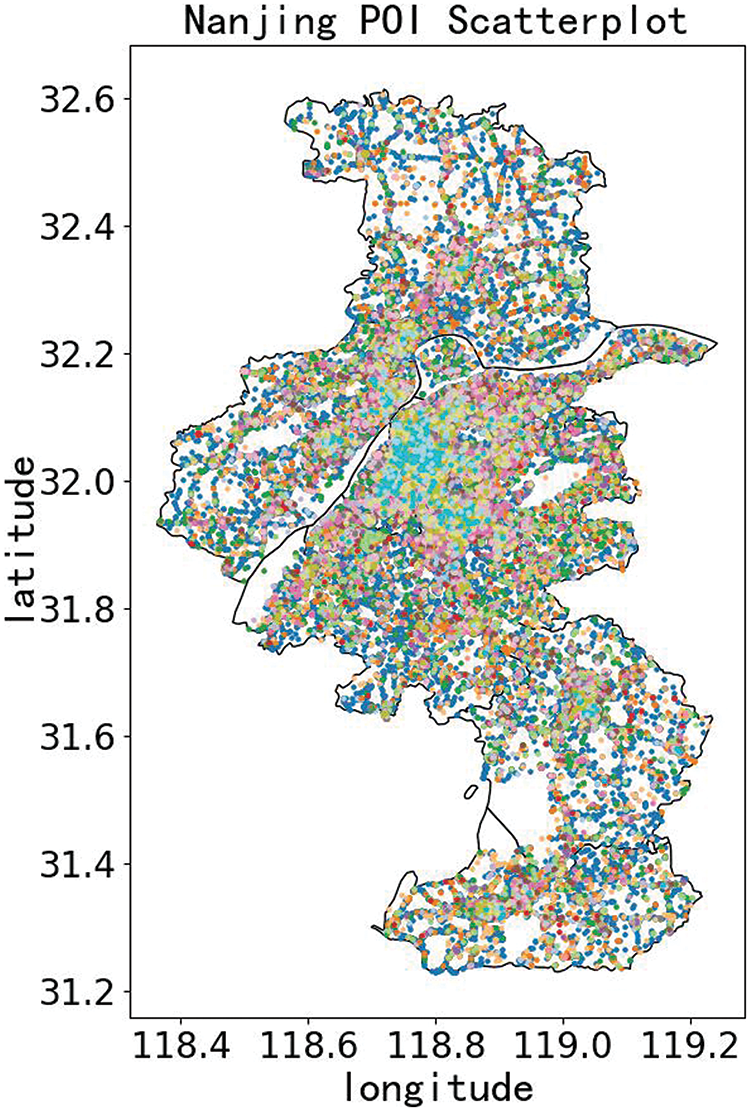
Figure 3: Nanjing POI scatter plot
Different colours in the figure represent different types of POIs in Nanjing, e.g., cyan for shopping malls and blue for leisure centres in the dense Nanjing city centre in the figure.
5.3 Fusion of Mini Batch K-Means and Simulated Annealing Electric Vehicle Charging Station Layout Optimisation Strategies
In this paper, we first determine the K-value for each small region of the study using the Silhouette Coefficient, a metric used to assess the effectiveness of clustering, which reflects the closeness and separation of the data points in the clusters. It not only considers the degree of cohesion between a sample point and its cluster but also compares the degree of separation between a sample point and its nearest neighbour cluster. The contour coefficient has a value range of [−1, 1], and the larger the value, the better the clustering effect. Through several iterations, the contour coefficients of each region in Nanjing are obtained as shown in Fig. 4. According to the K-value corresponding to the highest value of the contour coefficient, the K-value of each study area in Nanjing is finally obtained as shown in Table 2.
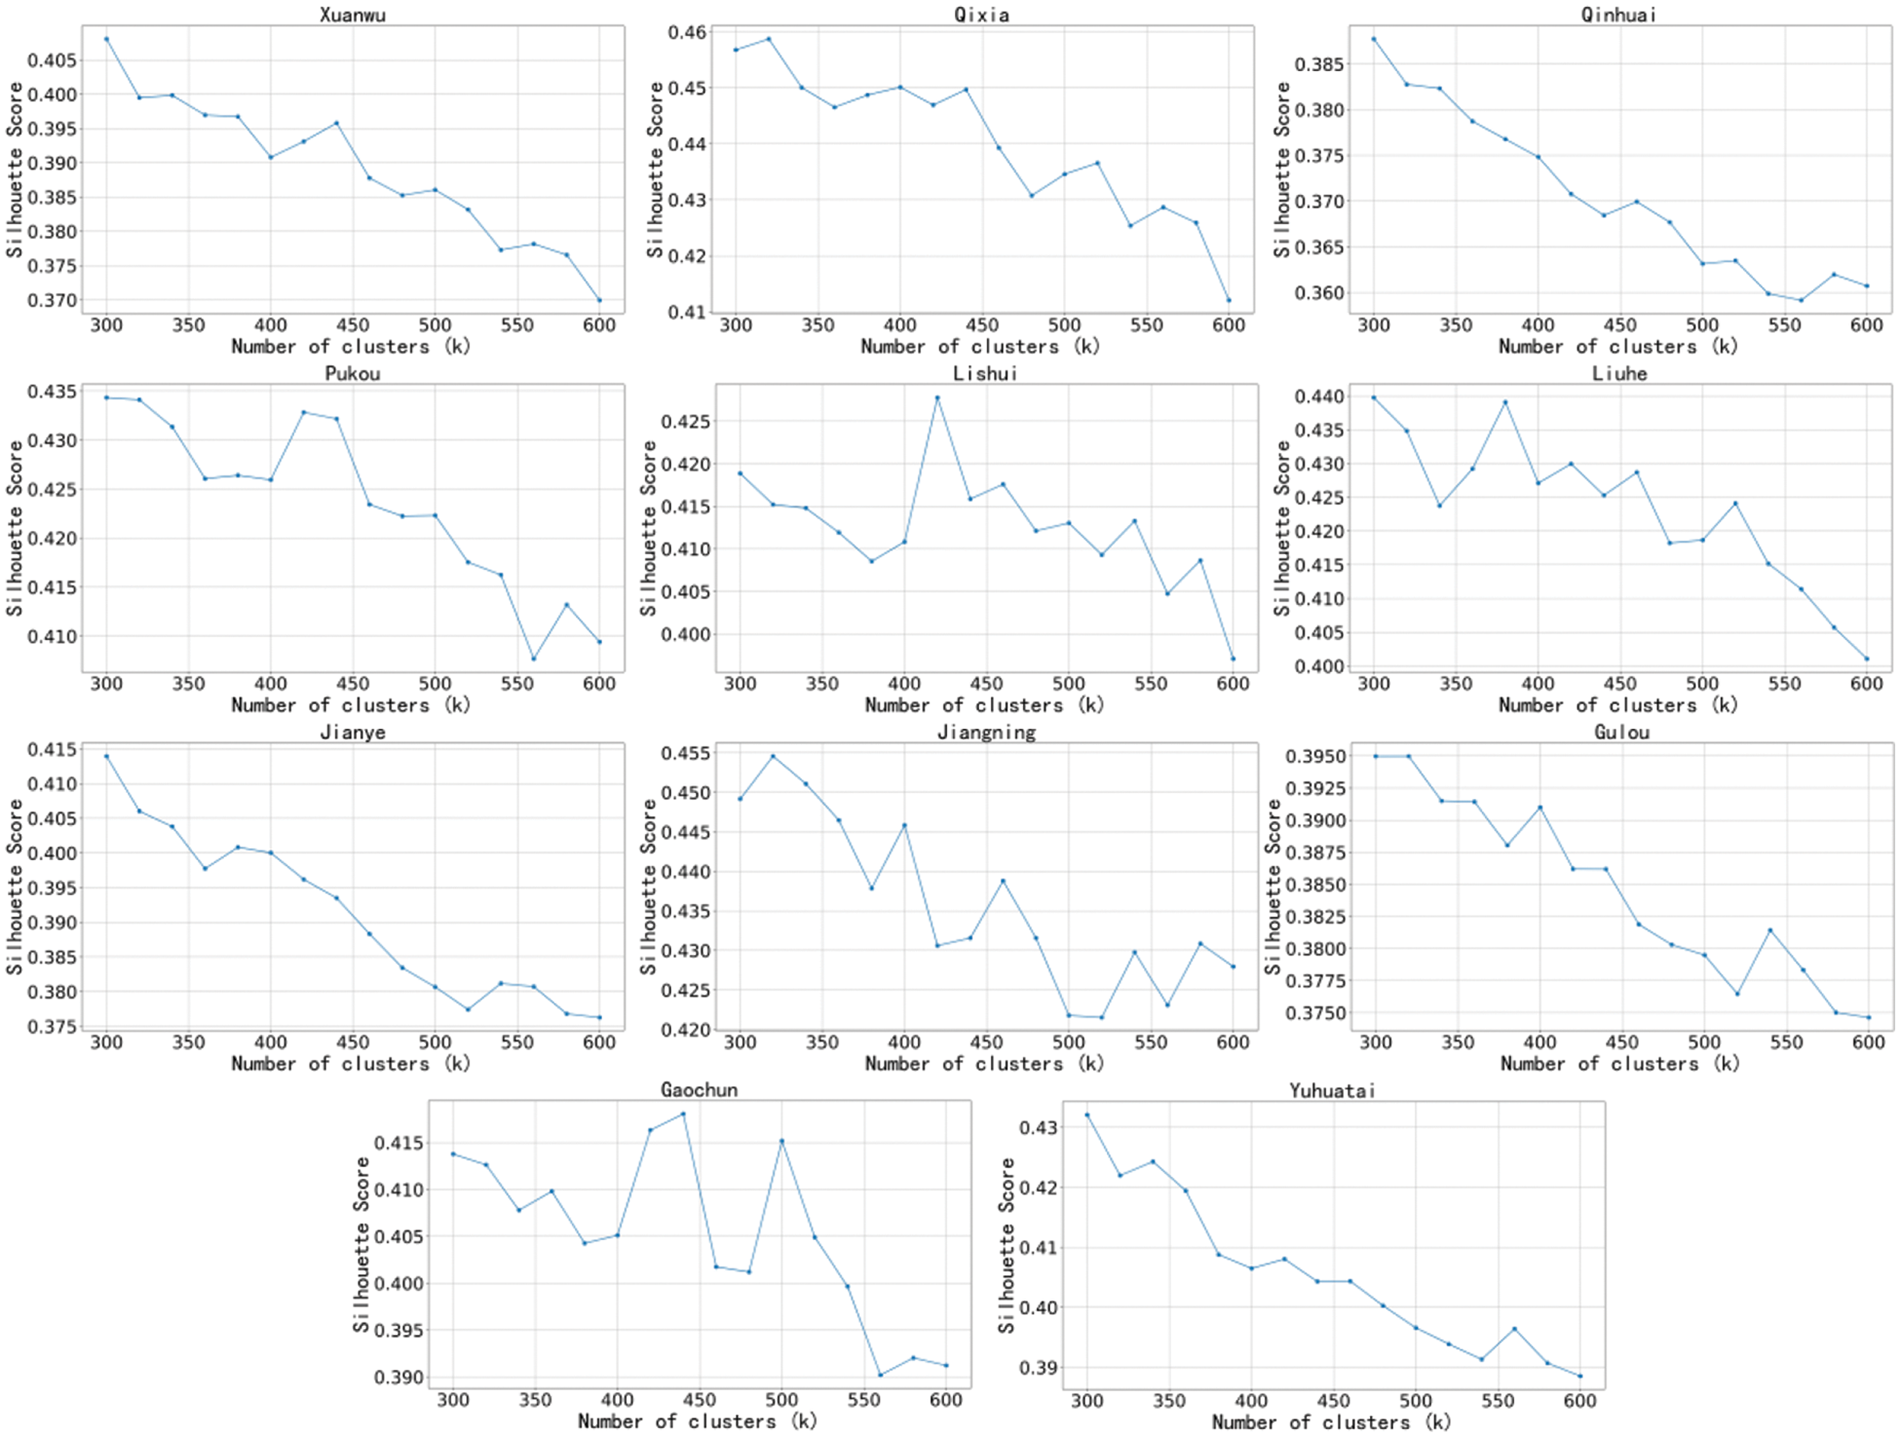
Figure 4: Line graph of profile coefficients for each study area in Nanjing City

The contour coefficients corresponding to different values of K in Fig. 4 are reacted as different points on the line graph, the size of the contour coefficients can be reacted as the size of the difference in the mean inter-cluster distance and the mean intra-cluster distance, when the contour coefficients are large it can be interpreted as a larger mean inter-cluster distance, a smaller mean intra-cluster distance, the sample points are closer to the other points of its cluster with good cohesion and at the same time, the sample points are separated from the other clusters with a higher degree of separation. As the value of K becomes progressively larger and the number of clusters clustered increases, the average distance between clusters decreases, leading to a decrease in the contour coefficient, which can be improved by a suitable value of K. Therefore, a sudden increase in the contour coefficient can be observed in some cases.
Based on the K-value of each region obtained from Table 2, the results are obtained by fusing Mini Batch K-Means and simulated annealing EV charging station layout optimisation algorithms as shown in Fig. 5. The red points in Fig. 5 represent the clustering centre, and the other coloured points represent the POI points belonging to different clusters respectively. Taking Xuanwu District in Fig. 5 as an example, the POI points are uniformly scattered around the clustering centre, and all POI points from the clusters belonging to the clustering centre to the current clustering centre are the shortest distance from the POI to all the clustering centres, which meets the need of the shortest distance for EV users to charge.
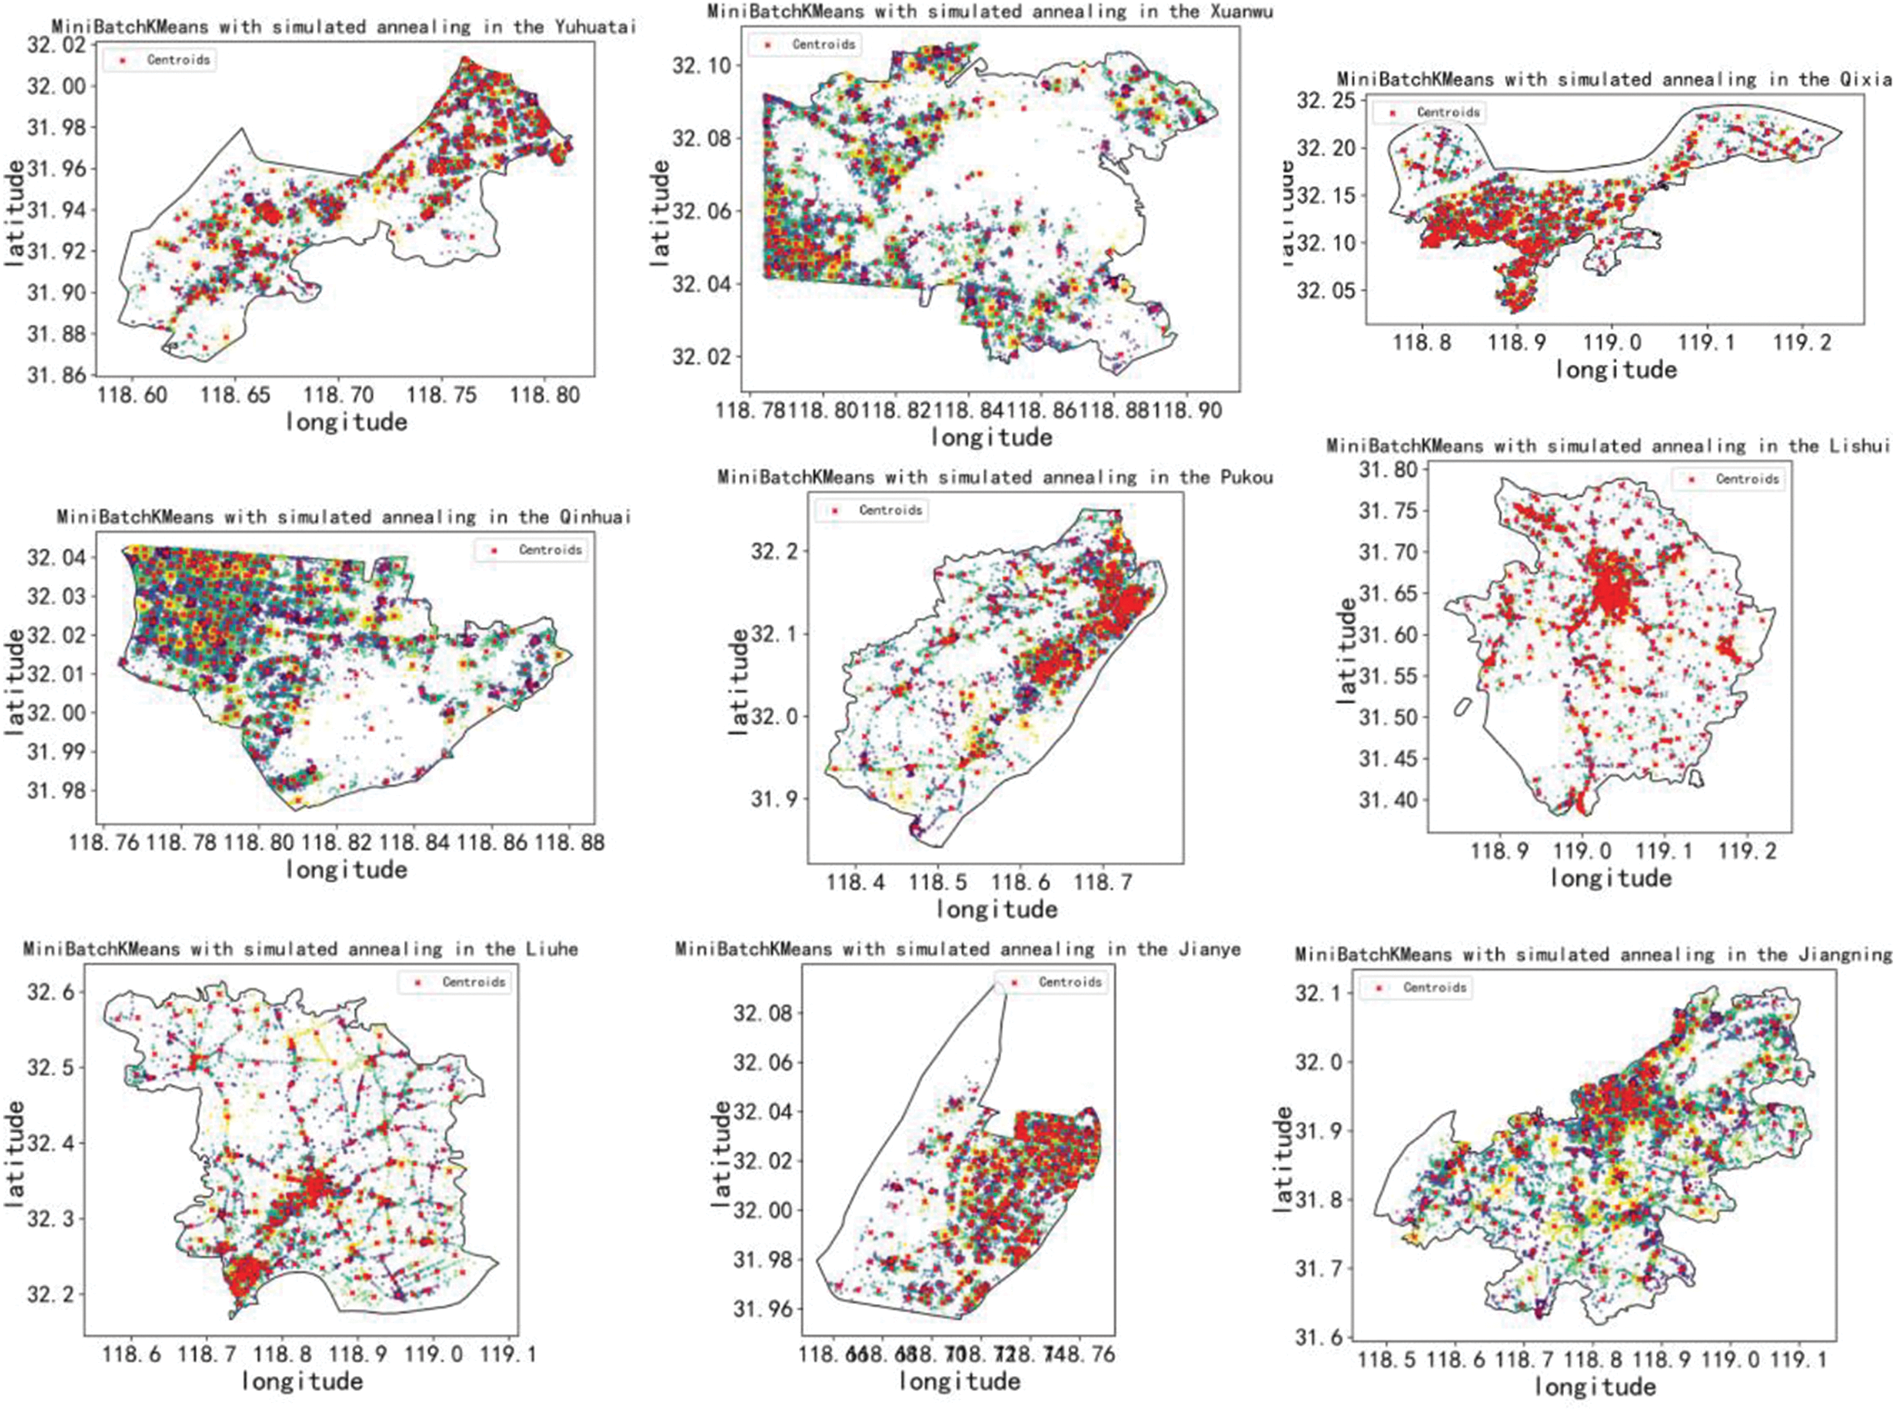
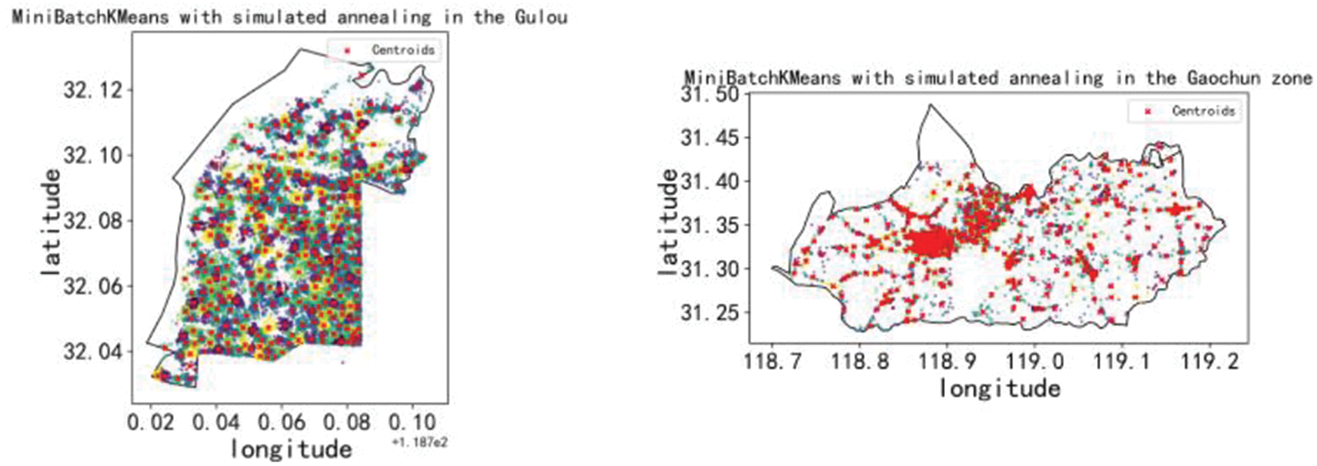
Figure 5: Results of the optimisation algorithm incorporating Mini Batch K-Means and simulated annealing electric vehicle charging station layouts
The model in this paper uses the Lorenz curve to assess the optimisation of the layout of electric vehicle charging stations in the current real-world environment. The Lorenz curve was introduced by American economist Max Lorenz in 1905 to graphically represent the degree of equality in the distribution of resources. Ideally, in the case of a perfectly equal distribution, resources would be distributed perfectly evenly to everyone, and the Lorenz curve would be a straight line from the origin (0,0) to (1,1).
The comparison table of the cumulative percentage of the fusion algorithm, and cumulative percentage of real charging stations are shown in Table 3, and the comparison graph of the fusion algorithm Lorenz curve, real charging station Lorenz curve and ideal Lorenz curve is shown in Fig. 6, and from the comparison in Fig. 6, it can be observed that the optimisation method of EV charging stations using the fusion of Mini Batch K-Means and simulated annealing algorithms is effective in adjusting the distribution pattern of charging stations. Not only does it smooth out the Lorenz curve, making it closer to the ideal Lorenz curve, but more importantly, it promotes the balanced distribution of charging station resources among different regions, significantly improving the problem of uneven distribution of charging station resources in the original layout. This improvement is undoubtedly of great practical significance for enhancing the fairness and efficiency of charging network services.

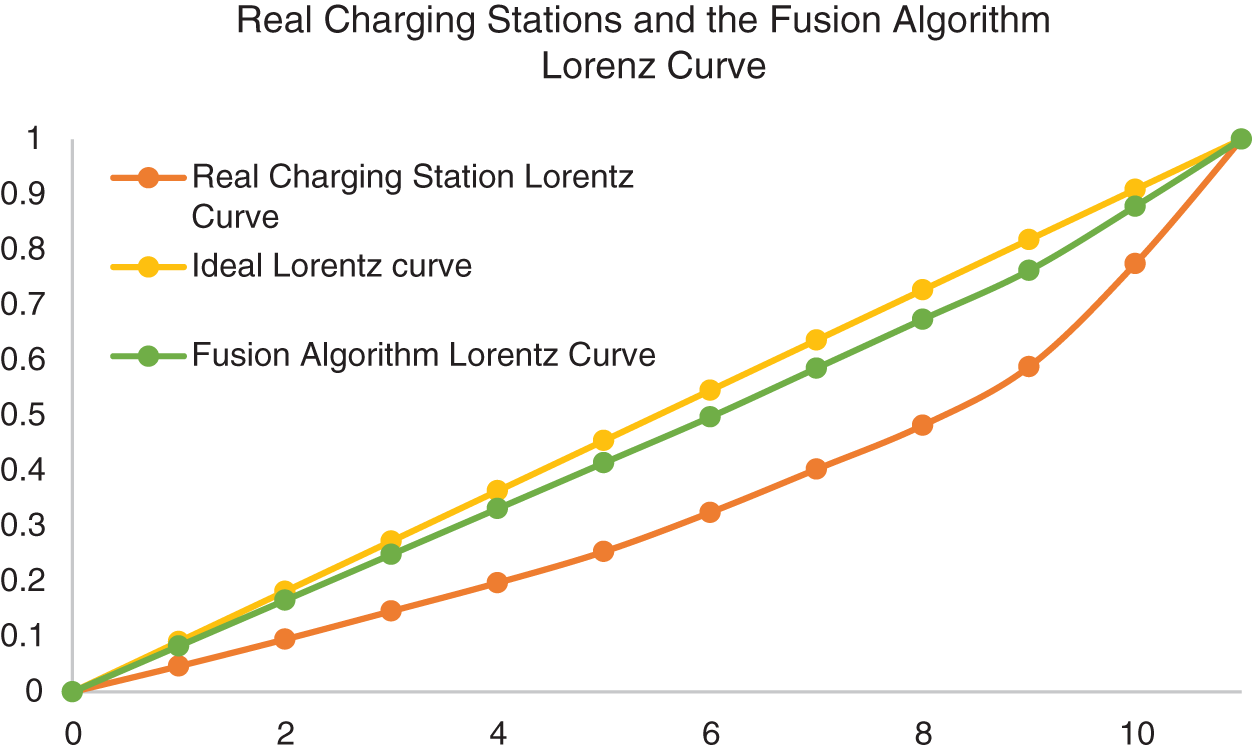
Figure 6: Comparison of real charging station Lorentz curve, fusion algorithm Lorentz curve and ideal Lorentz curve
To compare the superiority of the proposed method, this paper evaluates the fusion clustering method using 2 datasets. Table 4 summarises the number of features, total number of samples and number of clusters for each dataset.

Comparison of the proposed fusion Mini Batch K-Means and Simulated Annealing algorithms with the standalone K-Means algorithm PCA (Principal Component Analysis) is a statistical technique that is mainly used for dimensionality reduction, data compression and feature extraction. It preserves the principal information of the data by identifying the direction with the highest variance in the dataset and projecting the high-dimensional data into a low-dimensional space. For all selected datasets, a fusion of Mini Batch K-Means and Simulated Annealing algorithms with independent K-Means algorithm obtained the PCA dimensionality reduced images as shown in Figs. 7 and 8.
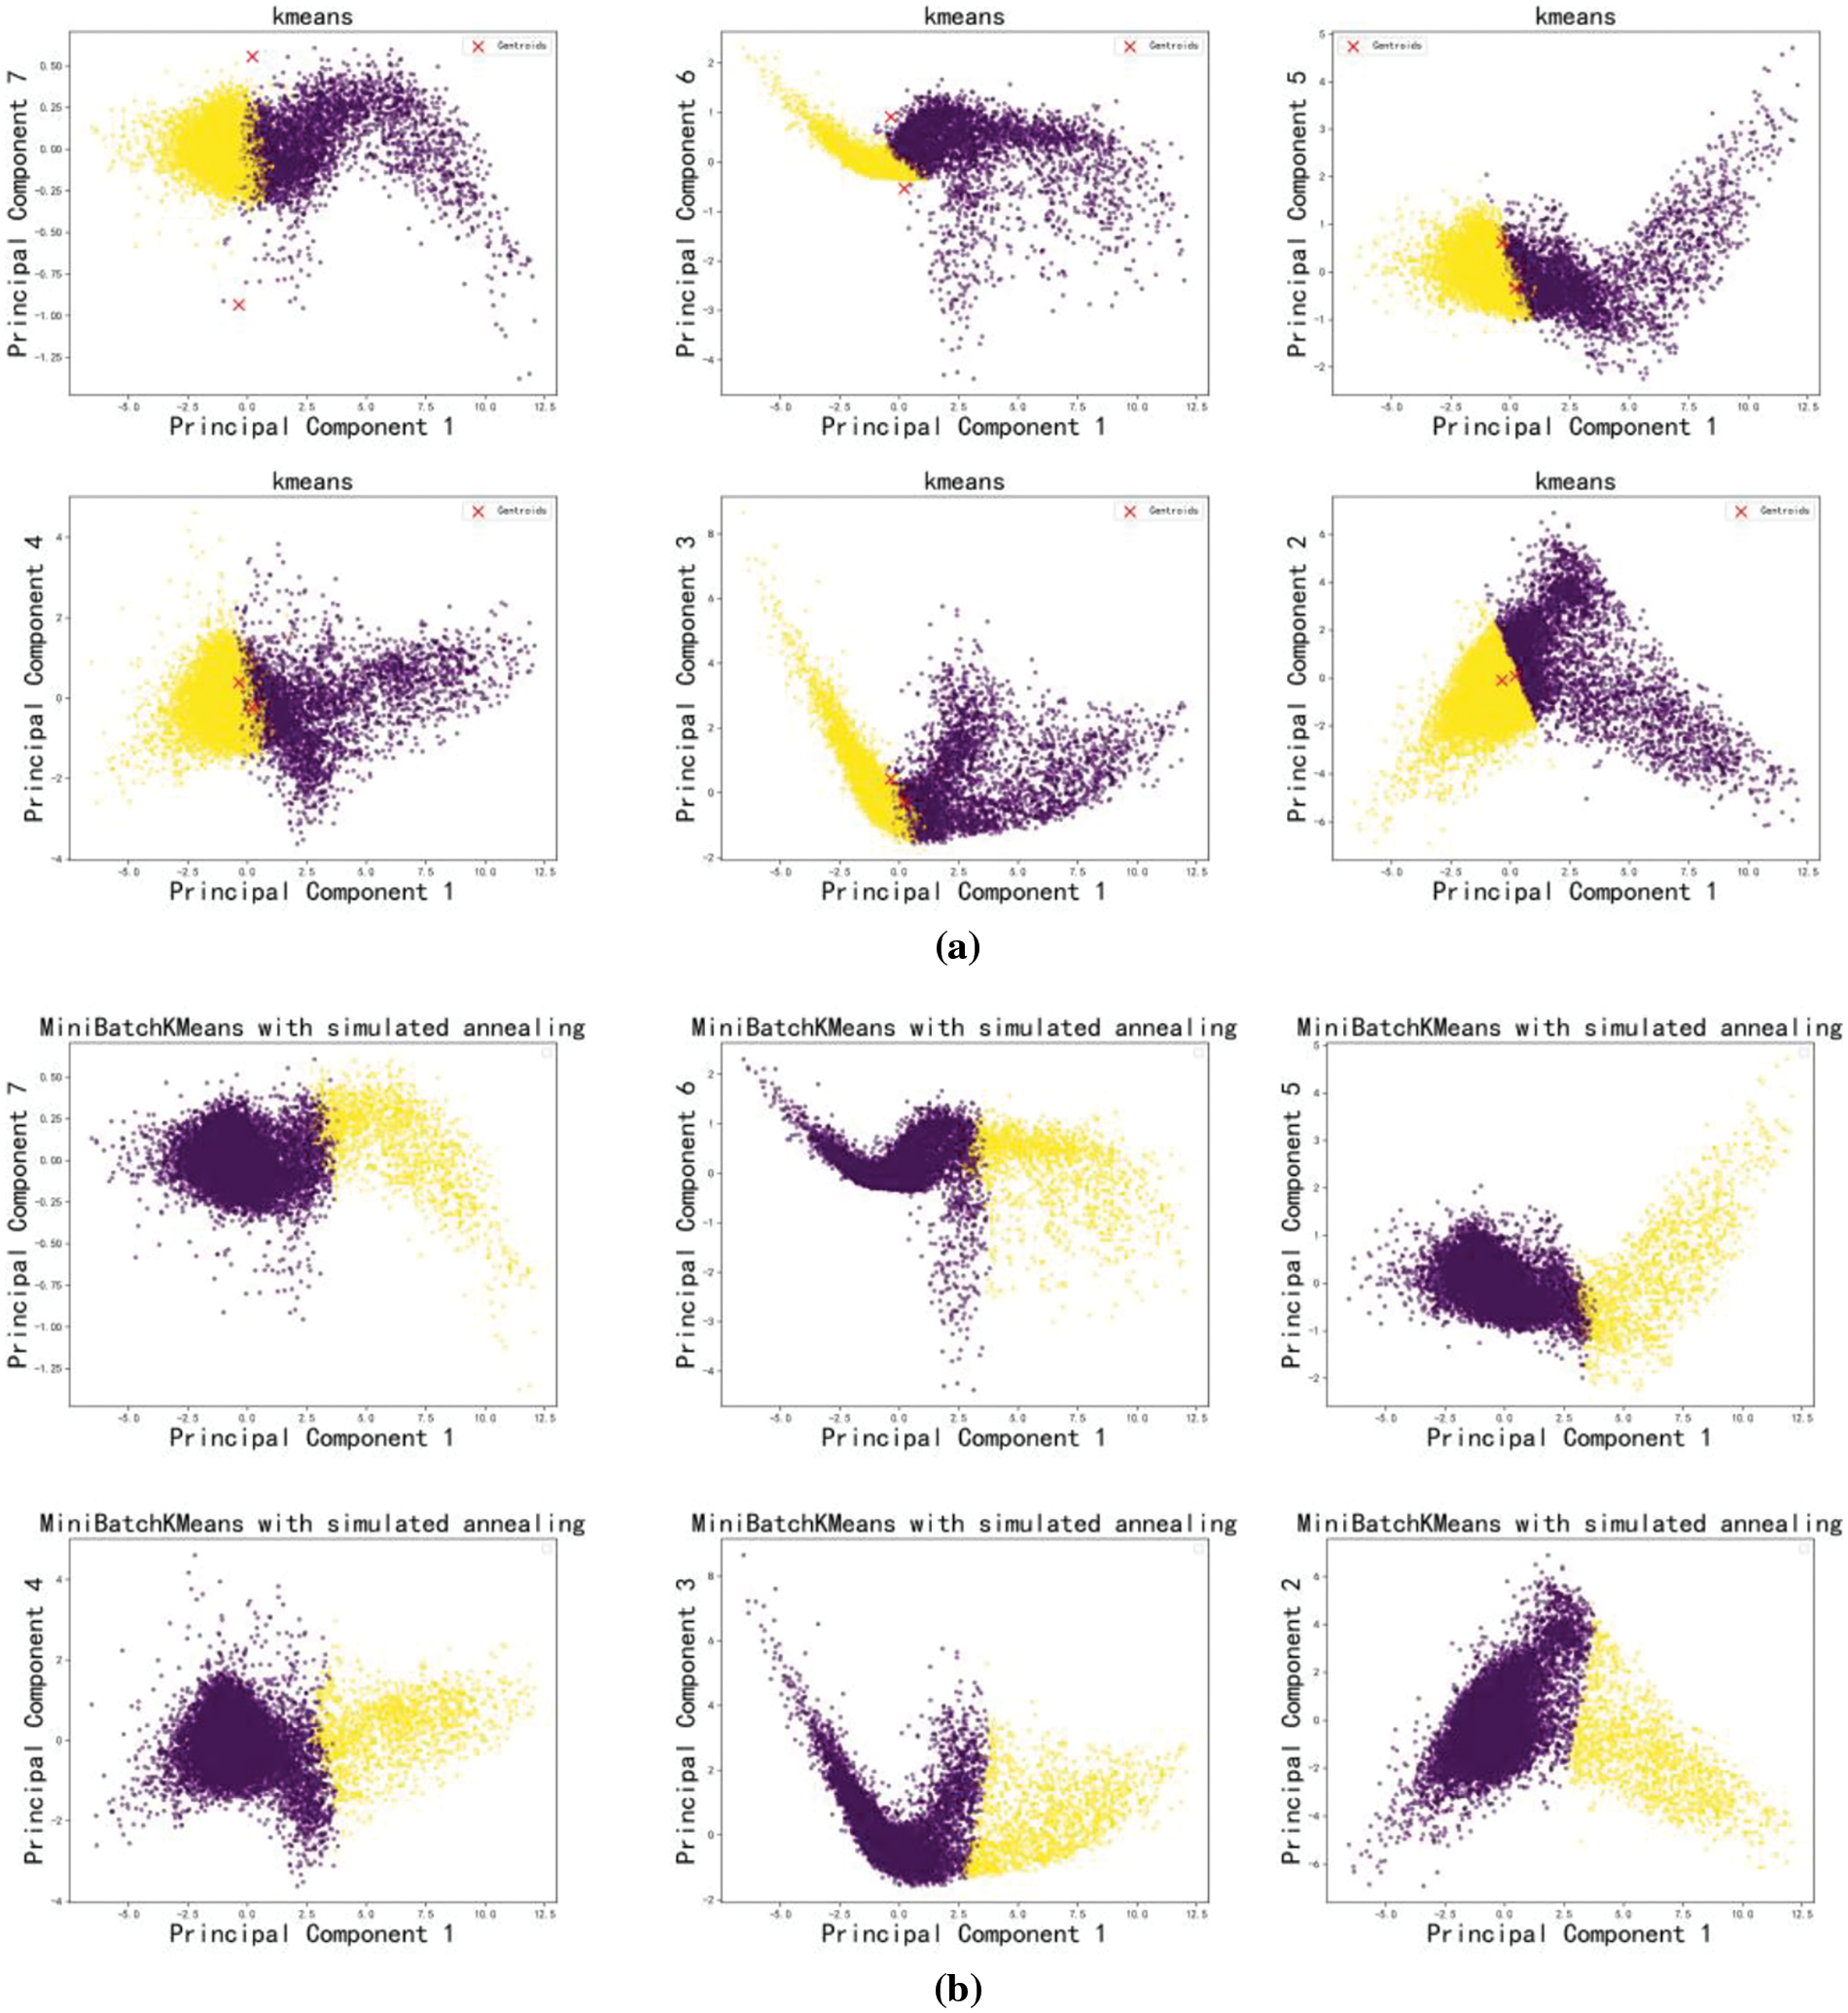
Figure 7: PCA plot of HTRU2 data set
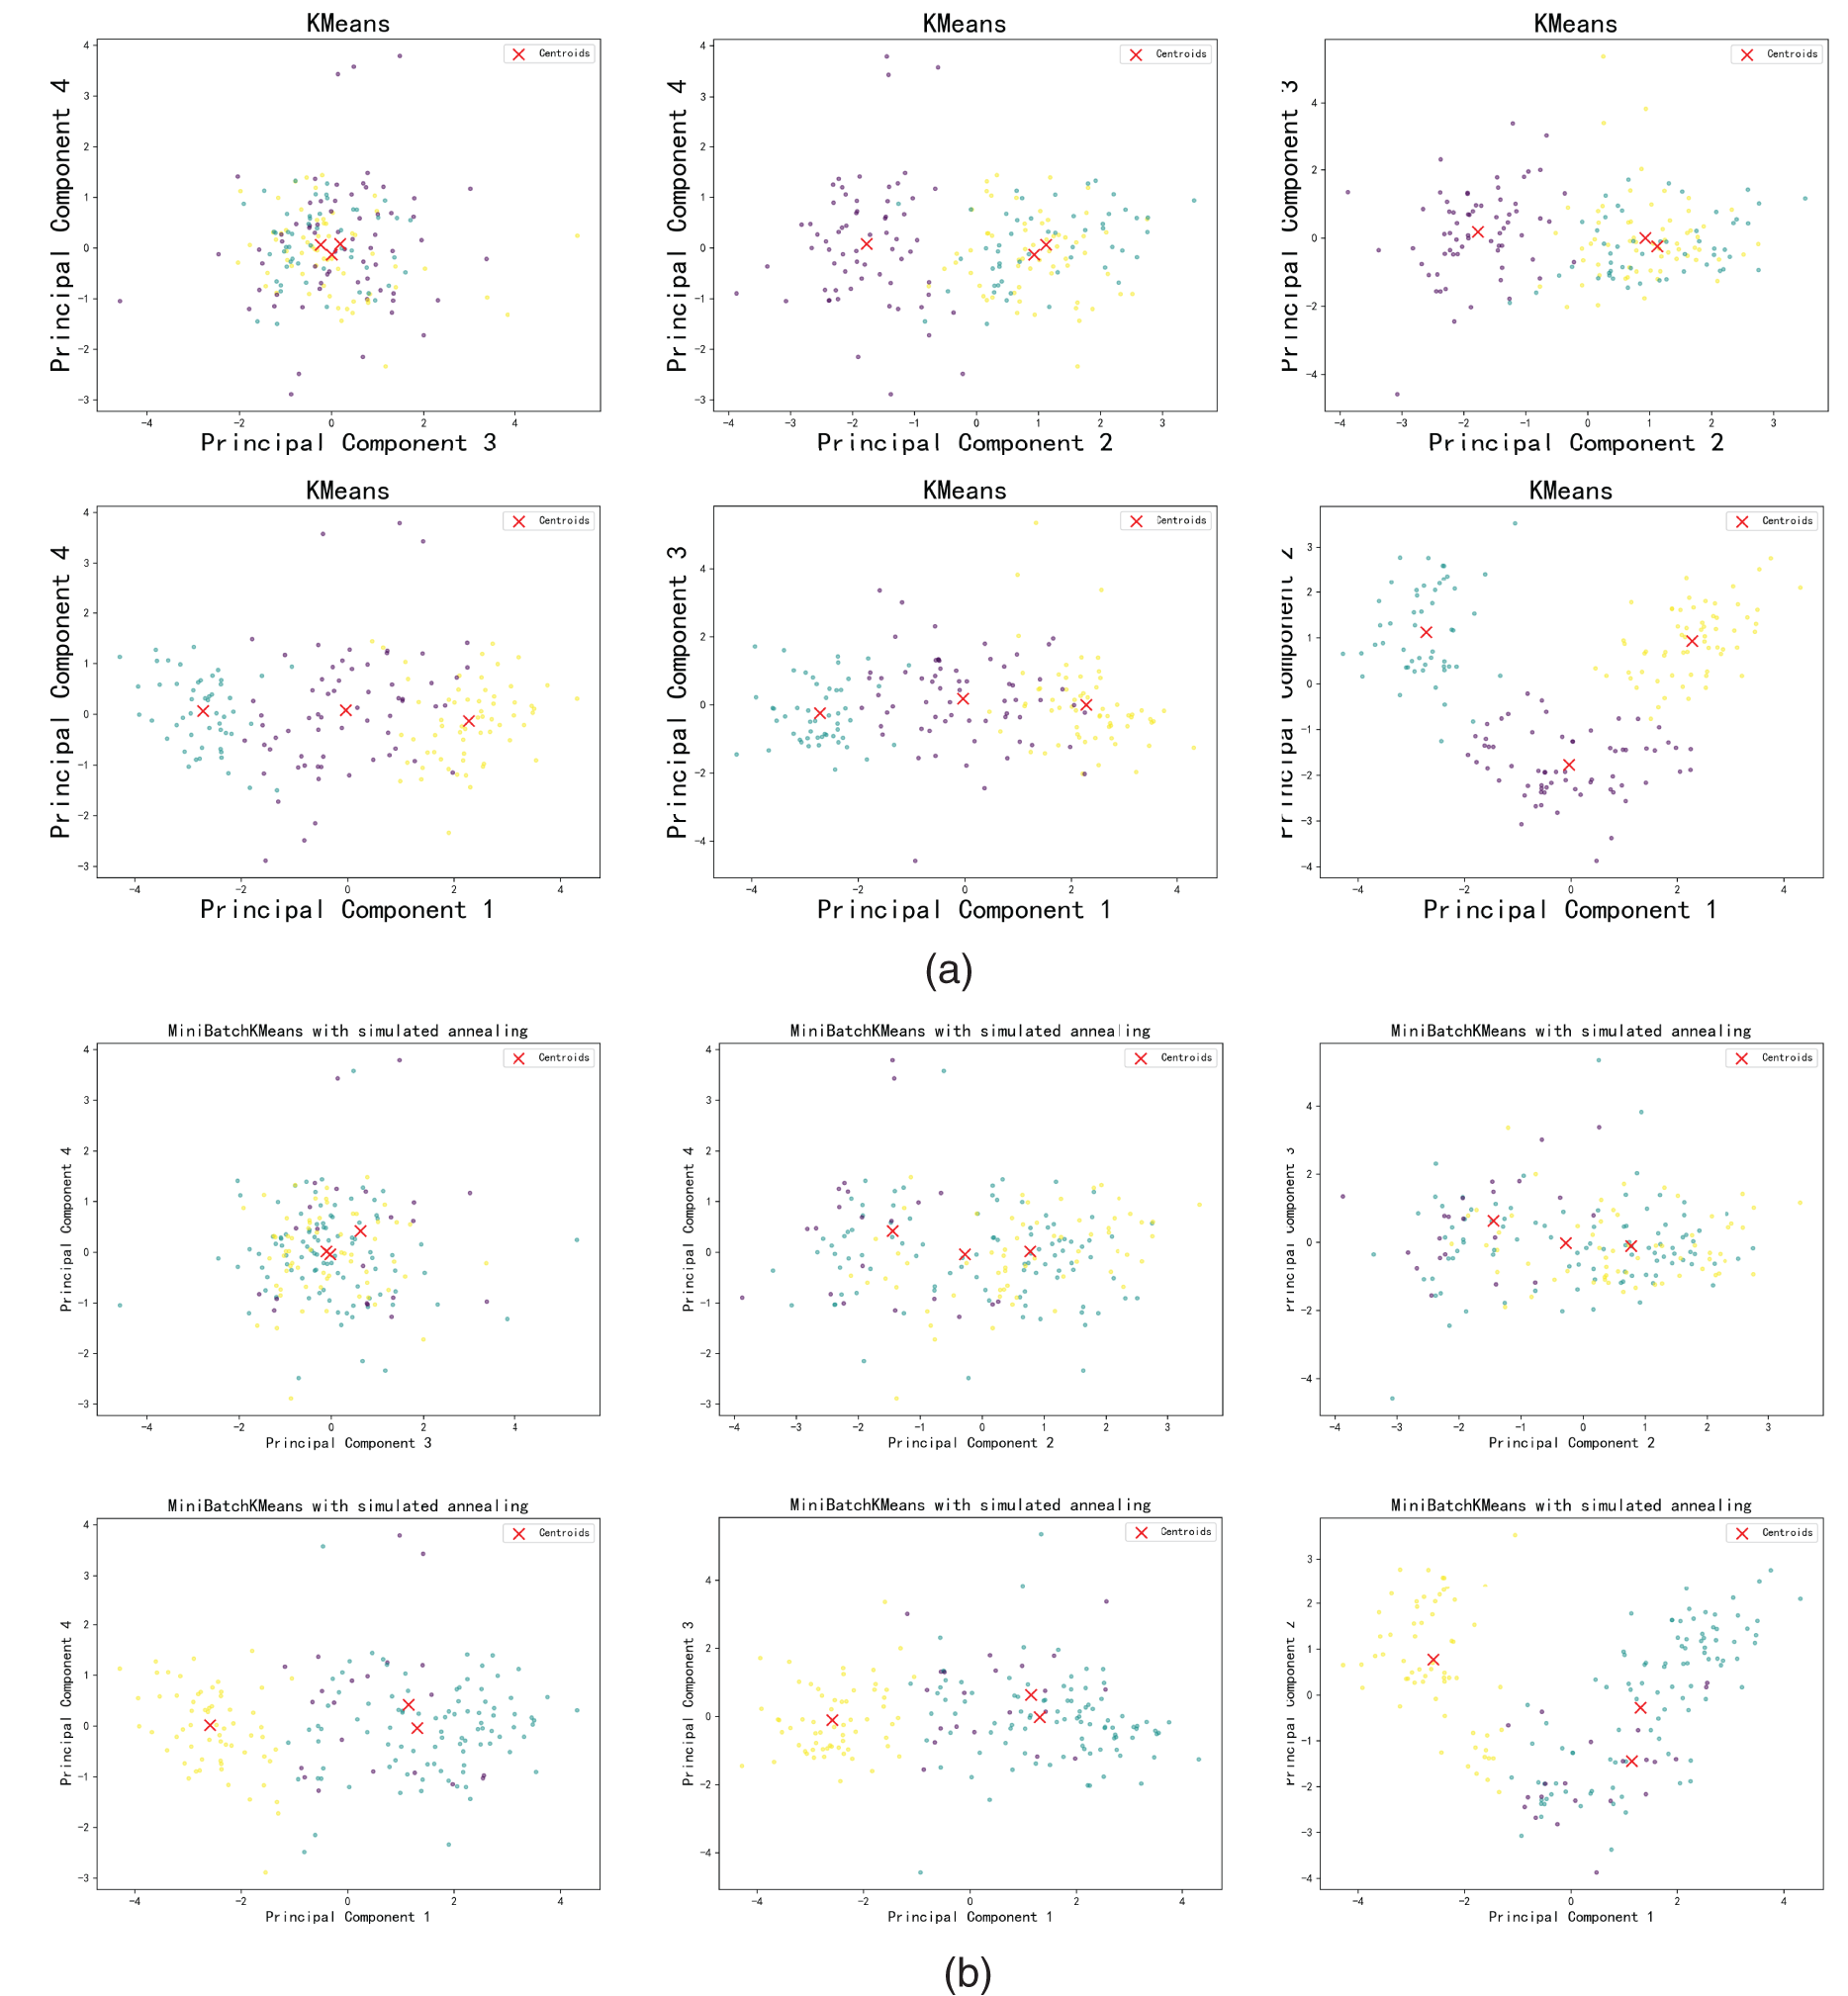
Figure 8: PCA plot of Wine data set
Fig. 7a shows the PCA plot obtained by the K-Means algorithm. The figure also shows the cluster centres of each cluster found by the K-Means algorithm, indicated by the red forks. Fig. 7b shows the distribution of HTRU2 data between dimensions obtained by fusing Mini Batch K-Means and simulated annealing algorithms, it also shows the distribution of high dimensional data in two dimensions.
Fig. 8a shows the PCA plot obtained by the K-means algorithm. The figure also shows the cluster centres of each cluster found by the K-Means algorithm, indicated by red forks. Fig. 8b shows the distribution of the Wine data between dimensions obtained by fusing the Mini Batch K-Means and simulated annealing algorithms, and it also shows the distribution of the high-dimensional data in two dimensions.
To demonstrate the performance of the proposed fused Mini Batch K-Means and simulated annealing algorithms, the accuracy and lift of the combined Mini Batch K-Means and simulated annealing algorithms compared to the standalone K-Means algorithm are recorded in Table 5. The results show that the fused Mini Batch K-Means and simulated annealing algorithms produce more accurate results than K-Means. The possible reason for obtaining such results is that the fused Mini Batch K-Means and simulated annealing algorithm avoids early convergence and achieves a compromise between global and local searches, which improves the ability to identify nonlinear clusters.

Fig. 5 demonstrates the results of the EV charging station optimisation method based on the fusion of Mini Batch K-Means and simulated annealing algorithms for single-source POIs with superior EV charging station layouts in Nanjing. By carefully comparing and analysing Fig. 6, it can be observed that the fusion algorithm effectively improves the imbalance of the EV charging station layout in Nanjing, which makes the charging station resources more reasonably and evenly distributed in the city.
Although the experiments in this paper are based on the optimisation of charging station layout based on a wide range of POI types, it is important to recognise that in the real-world environment, there is a difference in the impact of the same POI type on the passenger flow of EV charging station construction in different areas, or different POIs in the same region. If the influence of POI attributes around EV charging stations on charging station passenger flow is further considered in future studies, new adjustment needs for the charging station layout may arise. For example, the distribution of charging stations may become denser in some areas and relatively sparse in others.
The optimisation strategy in this paper is mainly based on the type of POI in the surrounding environment of EV charging stations. However, in the actual operation process, the charging flow carrying capacity of charging stations is also an important factor that cannot be ignored. If this factor is further considered, there is a mismatch between the capacity of some charging stations at the time of design and the actual buildable capacity. This not only affects the operational efficiency of charging stations but may also hurt the charging experience of users.
This paper provides an in-depth discussion and empirical analysis of the layout optimisation of electric vehicle charging stations in Nanjing by integrating Mini Batch K-Means and simulated annealing algorithms.
By using single-source POI data, this study simplifies the data acquisition process and improves the generalisability and operability of the model. In addition, the introduction of a simulated annealing algorithm effectively avoids local optimal solutions and further optimises the clustering effect, resulting in a more balanced distribution of charging station resources among different regions.
In the empirical analysis, by comparing the fusion algorithm Lorentz curve with the ideal Lorentz curve, and the real charging station Lorentz curve with the ideal Lorentz curve, the advantages of the optimisation method in smoothing the Lorentz curve and making it closer to the ideal state can be observed. This improvement not only enhances the fairness and efficiency of charging network services but also provides important practical implications for the planning and construction of urban EV charging networks.
This paper also points out the factors that need to be further considered in practical application, such as the influence of POI attributes around EV charging stations on the passenger flow of charging stations and the charging traffic carrying capacity. An in-depth exploration of these factors will help achieve a more accurate and efficient charging station layout optimisation. Future research should explore these comprehensive influencing factors more deeply to achieve a scientific and rational charging station layout.
This study provides a new perspective and method for the optimisation of EV charging station layout, as well as theoretical and practical support for sustainable urban development and the promotion of green mobility. By optimising the charging station layout, construction waste can be reduced and the accessibility and convenience of charging services can be improved, thus promoting the popularity of electric vehicles and sustainable urban development.
Acknowledgement: None.
Funding Statement: This work is supported by the Jiangsu Provincial College Students Innovation and Entrepreneurship Training Plan Project (grant number 202411276037Z) and the Nanjing Institute of Technology Fund for Research Startup Projects of Introduced Talents (grant number TB202406012).
Author Contributions: The authors confirm contribution to the paper as follows: study conception and design: Haojie Yang, Peng Geng; data collection: Haojie Yang; analysis and interpretation of results: Haojie Yang, Xiang Wen; draft manuscript preparation: Haojie Yang. All authors reviewed the results and approved the final version of the manuscript.
Availability of Data and Materials: Not applicable.
Ethics Approval: Not applicable.
Conflicts of Interest: The authors declare that they have no conflicts of interest to report regarding the present study.
References
1. Z. Jiang et al., “Charging station layout planning for electric vehicles based on power system flexibility requirements,” Energy, vol. 283, Nov. 2023, Art. no. 128983. [Google Scholar]
2. M. M. Vazifeh, H. Zhang, P. Santi, and C. Ratti, “Optimizing the deployment of electric vehicle charging stations using pervasive mobility data,” Transp. Res. A: Policy Pract., vol. 121, no. 11, pp. 75–91, Mar. 2019. doi: 10.1016/j.tra.2019.01.002. [Google Scholar] [CrossRef]
3. Z. Yi, X. C. Liu, and R. Wei, “Electric vehicle demand estimation and charging station allocation using urban informatics,” Transp. Res. D: Trans. Environ., vol. 106, no. 4, May 2022, Art. no. 103264. doi: 10.1016/j.trd.2022.103264. [Google Scholar] [CrossRef]
4. Y. Wang, S. Fan, X. Sun, and X. Liu, “Investigating the deployment of initial public charging infrastructure: Planning-based VS market-based approaches,” Transp. Res. D: Trans. Environ., vol. 119, no. 9, Jun. 2023, Art. no. 103755. doi: 10.1016/j.trd.2023.103755. [Google Scholar] [CrossRef]
5. D. Hu, J. Zhang, and Q. Zhang, “Optimization design of electric vehicle charging stations based on the forecasting data with service balance consideration,” Appl. Soft Comput., vol. 75, no. 5, pp. 215–226, Feb. 2019. doi: 10.1016/j.asoc.2018.07.063. [Google Scholar] [CrossRef]
6. H. Bian, C. Zhou, Z. Guo, X. Wang, Y. He and S. Peng, “Planning of electric vehicle fast-charging station based on POI interest point division, functional area, and multiple temporal and spatial characteristics,” Energy Rep., vol. 8, no. 4, pp. 831–840, Nov. 2022. doi: 10.1016/j.egyr.2022.10.161. [Google Scholar] [CrossRef]
7. D. Hu, L. Huang, C. Liu, and Z. -W. Liu, “Locating and sizing charging station in multi-period to promote electric vehicles adoption in urban areas,” Energy Rep., vol. 11, no. 2, pp. 3581–3598, Jun. 2024. doi: 10.1016/j.egyr.2024.03.029. [Google Scholar] [CrossRef]
8. Y. Yang, Y. Zhang, and X. Meng, “A data-driven approach for optimizing the EV charging stations network,” IEEE Access, vol. 8, pp. 118572–118592, 2020. doi: 10.1109/ACCESS.2020.3004715. [Google Scholar] [CrossRef]
9. D. Gong, M. Tang, B. Buchmeister, and H. Zhang, “Solving location problem for electric vehicle charging stations—A sharing charging model,” IEEE Access, vol. 7, pp. 138391–138402, 2019. doi: 10.1109/ACCESS.2019.2943079. [Google Scholar] [CrossRef]
10. M. Liu, L. Feng, Y. Yuan, Y. Liu, and P. Geng, “Study on two-tier EV charging station recommendation strategy under multi-factor influence,” J. Artif. Intell., vol. 5, pp. 181–193, 2023. doi: 10.32604/jai.2023.046066. [Google Scholar] [CrossRef]
11. Z. Yao, Y. Fu, B. Liu, Y. Liu, and H. Xiong, “POI recommendation: A temporal matching between POI popularity and user regularity,” in 2016 IEEE 16th Int. Conf. Data Min. (ICDM), Barcelona, Spain, IEEE, Dec. 2016, pp. 549–558. [Google Scholar]
12. S. C. Hicks, R. Liu, Y. Ni, E. Purdom, and D. Risso, “mbkmeans: Fast clustering for single cell data using mini-batch k-means,” PLoS Comput. Biol, vol. 17, no. 1, Jan. 2021, Art. no. e1008625. doi: 10.1371/journal.pcbi.1008625. [Google Scholar] [PubMed] [CrossRef]
13. R. A. Rutenbar, “Simulated annealing algorithms: An overview,” IEEE Circuits Devices Mag., vol. 5, no. 1, pp. 19–26, Jan. 1989. doi: 10.1109/101.17235. [Google Scholar] [CrossRef]
14. H. B. Tambunan, D. H. Barus, J. Hartono, A. S. Alam, D. A. Nugraha and H. H. H. Usman, “Electrical peak load clustering analysis using k-means algorithm and silhouette coefficient,” in 2020 Int. Conf. Technol. Policy Energy Electric Power (ICT-PEP), Bandung, Indonesia, IEEE, Sep. 2020, pp. 258–262. [Google Scholar]
15. M. Ahmed, R. Seraj, and S. M. S. Islam, “The k-means algorithm: A comprehensive survey and performance evaluation,” Electronics, vol. 9, no. 8, Aug. 2020, Art. no. 1295. doi: 10.3390/electronics9081295. [Google Scholar] [CrossRef]
Cite This Article
 Copyright © 2024 The Author(s). Published by Tech Science Press.
This work is licensed under a Creative Commons Attribution 4.0 International License , which permits unrestricted use, distribution, and reproduction in any medium, provided the original work is properly cited.


 Submit a Paper
 Propose a Special lssue
 View Full Text
 Download PDF
 Downloads
 Citation Tools