
 Submit a Paper
 Propose a Special lssue
 Open Access
ARTICLE

Representation of HRTF Based on Common-Pole/Zero Modeling and Principal Component Analysis
1 School of Software Henan Polytechnic University, Jiaozuo, 454000, China
2 College of Computer Science and Technology, Henan Polytechnic University, Jiaozuo, 454000, China
* Corresponding Authors: Wei Chen. Email: ; Xiaogang Wei. Email:
Journal on Artificial Intelligence 2024, 6, 225-240. https://doi.org/10.32604/jai.2024.052366
Received 31 March 2024; Accepted 16 July 2024; Issue published 16 August 2024
 View Full Text
 Download PDF
Abstract
The Head-Related Transfer Function (HRTF) describes the effects of sound reflection and scattering caused by the environment and the human body when sound signals are transmitted from a source to the human ear. It contains a significant amount of auditory cue information used for sound localization. Consequently, HRTF renders 3D audio accurately in numerous immersive multimedia applications. Because HRTF is high-dimensional, complex, and nonlinear, it is a relatively large and intricate dataset, typically consisting of hundreds of thousands of samples. Storing HRTF requires a significant amount of storage space in practical applications. Based on this, high-dimensional, complex, and nonlinear HRTFs need to be compressed and reconstructed. In this study, inspired by the conventional common-pole/zero model, we propose a method for representing HRTF based on the common-pole/zero model and principal component analysis (PCA). Our method utilizes human auditory features and extends the traditional Common-Acoustical-Pole/Zero (CAPZ) method to estimate the common pole and zero coefficients across multiple subjects. Subsequently, the zero coefficients are compressed using the PCA procedure. Experimental results on the CIPIC database show that the compression ratio can reach 9.5% when the average spectral distortion is less than 2 dB.Keywords
Virtual Reality (VR) technology has rapidly developed in recent years, and virtual 3D sound plays a crucial role in creating a truly immersive VR experience. At present, there are two approaches to achieving a 3D audio presentation. The first method simulates the sound signals of different spatial sources by using multiple speakers to reconstruct the 3D sound field [1]. This technique has been widely utilized in home theaters, cinemas, and other settings. However, this method has some inherent limitations in practice. It requires strict regulations on the placement of speakers, which results in a limitation of optimal sweet spots. These limitations render this method unsuitable for mobile devices. The second method involves reconstructing the signal of the original sound source in the binaural region to create a simulated 3D auditory effect based on the principles of human binaural hearing. This method allows users to experience the virtual 3D audio effect using just a pair of dual-channel headphones [2]. This approach offers the convenience of easy application and is not limited by the user’s environment. These advantages make binaural 3D audio technology particularly suitable for VR.
The Head-Related Transfer Function (HRTF) describes how a sound signal from any location will reach the listener’s ears. HRTF is used to synthesize binaural sound that appears to come from any location in space, making it a crucial component of binaural 3D audio technology.
HRTF is typically obtained by measuring acoustic impulse responses and stored as Head-Related Impulse Responses (HRIR) that correspond to a specific orientation. The HRTF is then extracted from the HRIR through the Fourier transform. The measured HRIR is affected by a combination of factors, such as measurement equipment errors, the morphological characteristics of the person being tested, and the spatial orientation of the acoustic source signals. It is characterized by a large data size, high-dimensional complexity, and nonlinearity [3]. This leads to two problems. First, the high-dimensional complexity of the data hinders the analysis of the effects of its intrinsic auditory localization cues on the auditory localization of the human ear. Second, in specific applications, the large data size increases the pressure on data storage, which is not conducive to using small end devices. Therefore, researchers have developed various representation models to simplify the HRTF while preserving the features associated with auditory localization.
The initial research mainly focused on approximating HRTF (or HRIR). For example, one approach was to approximate it as a zero/pole model [4] or represent it as a filter with finite or infinite impulse responses [5,6]. However, traditional zero/pole models can only approximate the spectral envelope information of HRTF. Additionally, due to the uncertainty of parameter values, these models are unable to reveal the inherent relationship between zero/pole parameters and the spatial direction information of HRTF. Therefore, scholars have proposed the Common-Acoustical-Pole and Zero (CAPZ) model for HRTF [7–9]. This model decomposes HRTF into two components: one component that is independent of spatial direction and modeled using a pole model, and another that is spatially dependent and modeled using a zero model. In the CAPZ model, all HRTFs with different spatial directions share the same direction-independent component information. This means that all HRTFs are modeled using the same pole parameters, allowing the zero model to accurately represent the variation of HRTF with spatial direction.
However, the CAPZ model has two limitations. Firstly, it only investigates the component representation of HRTF and does not study the variation of zero parameters of HRTF with spatial direction for different spatial directions. Secondly, the CAPZ model is designed for a single object. However, since HRTF has personalized characteristics, there are variations in HRTFs among different individuals. As a result, the zero parameters of HRTF also exhibit personalized differences in spatial direction for different individuals.
This paper presents a method for the representation of HRTF based on common-pole/zero modeling and principal component analysis (PCA). Our method utilizes human auditory features and extends the traditional Common-Acoustical-Pole/Zero (CAPZ) method to estimate the common pole and zero coefficients with multiple subjects. Subsequently, the zero coefficients are compressed using a PCA procedure. Experimental results on the CIPIC database show that the compression ratio can reach 9.5% when the average spectrum distortion is below 2 dB. In addition, the proposed HRTF modeling method may provide an advantage in other HRTF-related research areas, such as HRTF interpolation and HRTF individualization, which require multiple subjects.
Measurements of HRTF data need to be carried out sequentially in multiple spatial orientations using measurement instruments. As a result, HRTF data have large file sizes. Taking the HRTF database of the Austrian Academy of Sciences (ARI) as an example, each HRTF sample contains HRIR data in 1550 spatial orientations. Each data entry contains 256 points of HRIR impulse response measurements. These data are subject to multiple effects, including measurement error, sound source orientation, and human body features. As a result, they are naturally characterized by complexity, high dimensionality, and nonlinearity. This makes it difficult to extract the intrinsic features of HRTF and study its relationship with spatial orientation and human morphological features. Therefore, realizing the low-dimensional feature representation of HRTF is one of the crucial research areas in binaural 3D audio technology.
Spatial spherical harmonic decomposition is a commonly used low-dimensional representation method for HRTF [10–12]. In 1998, Evans et al. proposed to use spherical harmonics (SH) to express HRTF [13]. This representation method reduces the amount of data and introduces a more important feature: the spatial continuity of HRTF. Subsequently, SH-based methods have been extensively studied, including different sampling schemes [14], preprocessing techniques [15], and mixed-order approximations [16]. Some alternative continuous representation methods have also been proposed, e.g., based on spherical wavelets [3,17] or Slepian functions [18], but SH is still the most commonly used basis function. Since such methods only consider the correlation between frequency or spatial variables, they cannot effectively deal with the complex nonlinear relationships between multiple auditory cues in HRTF. To address this problem, several studies have been devoted to modeling low-dimensional representations of HRTFs that cover both spectral and spatial dependencies. Adam et al. achieved a spatially and frequency-continuous representation of HRTFs by expanding the SH-based method using hyperspherical harmonics (HSH) [19].
In addition, some studies have found that HRTF data from different directions, frequencies, and individuals are correlated. Eliminating these correlations through statistical analysis can effectively reduce the dimensionality of HRTF. Kistler et al. conducted a study on the approximate expression of HRTF using PCA [20]. This method captures
On the other hand, some studies have attempted to mathematically express certain auditory localization cue features (such as auricular valleys and spectral valleys related to height perception) in the HRTF. Algazi et al. investigated the relationship between different parts of the human body and the spectral features in the HRTF [24]. Based on the relationship between the morphological features of the human body and the HRTF spectra, a structured expression model of HRTF was established. Geronazzo et al. utilized the structured modeling method of HRTF to extract the features of spectral valleys resulting from auricular resonance and auricular reflexes (known as auricular troughs) [25]. They then employed these features to construct a parametric descriptive model of HRTF. Iida et al. proposed an approximate representation of HRTF by adding two spectral peak features to the two highly perceptually relevant spectral valley features in the HRTF spectrum [26]. Such methods tend to focus on only a subset of the HRTF spectral features and disregard a significant number of intricate HRTF features in order to balance reconstruction accuracy and data compression efficiency. However, auditory perception in the human ear is a multifactorial and complex process. Recent studies have shown that retaining more detailed features of HRTFs is crucial for improving auditory localization accuracy [27]. Estimating HRTFs based on only a subset of auditory localization cues may result in a degradation of overall auditory localization performance.
In this paper, we focus more on the zero/pole-based HRTF representation model, which treats the HRTF as a linear time-invariant system, utilizes the concept of common poles for multiple-input/multiple-output systems, and uses a set of shared poles to represent all the system transfer functions across the entire set of HRTFs, thereby significantly reducing the number of required parameters and simplifying the model. However, when HRTFs are modeled individually, the poles of individual models are usually different. These differences may be small, but the overall model still needs to track each transfer function’s complete set of poles. If the complete system transfer function is modeled simultaneously, each HRTF can be modeled using a common set of poles. Haneda et al. developed a CAPZ low-dimensional representation method for HRTF based on this [8]. According to Haneda, the HRTF can be regarded as a resonant system consisting of ear canals whose resonant frequency and Q-factor are independent of the sound source position, such that the HRTF can be represented as a CAPZ model. In the CAPZ model, the HRTFs at all positions share a set of poles, whose co-poles correspond to the frequency characteristics of the resonant system independent of the sound source position. In contrast, the HRTFs at all positions have their zeros to represent the variation of the HRTFs concerning position. Since the CAPZ model has the same poles, fewer parameters can be used to represent the HRTFs, which significantly reduces the storage space; at the same time, in binaural sound synthesis, regardless of the number of sources, the entire HRTF filtering process requires only one pole filtering operation, so its computational volume is also significantly reduced.
To further improve the compression performance and reconstruction quality of HRTFs, we propose an HRTF representation based on a common pole/zero model and PCA. This approach exploits the auditory features of HRTFs by extending the traditional CAPZ model to multiple subjects and then compressing the zero coefficients using PCA. We conducted experiments on the CIPIC database [28], showing that our method can achieve higher compression ratios while maintaining low spectral distortion.
The flowchart of the proposed method is shown in Fig. 1, and it consists of the following key steps:

Figure 1: The flowchart of the proposed method
1) Preprocess the measured HRTF to remove redundant information;
2) Extract the common pole coefficients and zero coefficients of HRTF, which are represented as ① and ② in Fig. 1;
3) Principal component analysis with zero coefficients.
All three essential processes will be discussed in the remainder of this section.
It is widely accepted that the interaural time and level differences (ITD and ILD) are the most important cues used to determine the azimuth location of a sound source [29,30]. Additionally, the spectral cues in the HRTF above 3 kHz contribute to the perception of frontal and elevation information. However, current research on the contribution of HRTF cues to human sound localization indicates that the overall shape of the HRTF is more significant in auditory perception than the fine details [31–33].
Our method’s preprocessing technique for raw HRIR data is based on previous research [34,35]. The main process is as follows:
1. Firstly, remove the faint pulse value preceding the main pulse of the HRIR signal;
2. Truncate the remaining HRIR using a half Hann window of size 64 (1.45 ms);
3. Mean-normalize the HRIR by subtracting the mean value of the remaining HRIR.
It should be noted that although ITD is an important cue for auditory localization, our study primarily focuses on the reconstruction of HRTF spectral features. However, the ITD can be estimated using the azimuth angle of the sound source or by considering the anthropometry of the subjects [36–38].
3.2 Extract the Common Pole Coefficients and Zero Coefficients of HRTFs
A straightforward method to approximate HRTF is through pole/zero modeling. The pole/zero model can be constructed using an infinite impulse response (IIR) filter, which can easily capture the spectral cues of the HRTF. However, the pole/zero model only approximates the spectrum envelope and is unlikely to reveal the inherent features in the HRTF signal. Haneda represents HRTF using the CAPZ model, which expresses the HRTF as a direction-independent part (common acoustical poles) and a direction-dependent part (zeros). In the CAPZ model, common acoustical poles are independent of the source and receiver positions. Compared to the conventional pole/zero model, the CAPZ model can represent HRTF with fewer parameters. Meanwhile, it retains the characterization of HRTF variations caused by changes in spatial sources.
Based on this principle, we extend the CAPZ model to multiple subjects by calculating the common acoustical poles for each subject and then averaging the pole coefficients to obtain the common pole coefficients for all subjects. Suppose there are
where
Let
where the
and the reconstructed
Then the estimated numerator polynomial
Specifically, for the HRTF dataset containing N objects, the algorithm for solving its common pole parameter is:

In our study, we utilized the CIPIC’s HRTF database [28] to investigate the optimal ratio of the pole and zero coefficients. The main idea is as follows: Firstly, we represent the HRTF with a classic pole/zero model and investigate the average spectral distortion (SD) score of all the subjects using different combinations of poles and zeros. Secondly, we set the threshold value of the SD to 1 dB and determine the optimal combination of pole and zero coefficients. Finally, the common-pole/zero model is established with a fixed number of poles and zeros.
The performance of reconstruction can be evaluated by measuring the SD between the measured and reconstructed HRTFs [39,40]. The SD is calculated as follows:
where
And the average SD results of all 45 subjects from CIPIC’s HRTF database with the classic pole/zero model are shown in Fig. 2. It can be observed from the figure that the average SD decreases as the number of pole and zero coefficients increases. And we set the number of pole coefficients at 20 and the number of zero coefficients at 19, which resulted in an average SD of 0.99 dB. And finally, the average SD result of the proposed common-pole/zero model is 1.77 dB.

Figure 2: Average SD results with different combinationsof poles and zeros
Fig. 3 shows a comparison of the reconstructed HRTF using a common-pole/zero model against the original HRTF of subject 165 in CIPIC’s HRTF database. The subject 165 is a KEMAR dummy with small pinnae from CIPIC’s HRTF database. The left panel displays the measured HRTF of subject 165’s left ear on the horizontal plane. The right panel displays the reconstructed results, and the average SD of all the reconstructed HRTF on the horizontal plane is 2.02 dB.

Figure 3: Representation of HRTF using common-pole/zero model. (a) Measured HRTF. (b) Reconstructed HRTF. (c) Residual
3.3 Principal Component Analysis of the Zeros
PCA can reduce the dimensionality of a dataset while retaining most of the original information. It can also be utilized to compress data by extracting the principal components of the data [40].
In our approach, PCA is used to compress the zero coefficient further. With the transformation provided by PCA, we can represent the data with fewer principal components (PCs), thus effectively reducing the dimensionality of the data. In the proposed model further, PCA is applied to all the zero coefficients extracted from Eq. (5) in order to derive the PCs. PCs can be regarded as eigenvectors with larger eigenvalues of the matrix of numerator polynomials. These eigenvectors contribute to the variation in the data, and the magnitude of their contribution is proportional to their eigenvalue.
Fig. 4 shows the percentage of variance that can be captured with different numbers of principal components. Fig. 5 illustrates the PCA processing with zero coefficients of subject 003. Fig. 5a represents the original zero coefficients of HRTF at an azimuth of

Figure 4: Percent variance of the zero coefficients represented by a different number of PCs

Figure 5: Compress zero coefficients at different percent variance. (a) The number of zero coefficients. (b) Eigenvector. (c) PC weights
Fig. 6 shows the comparison of reconstructed zero coefficients of subject 003 at different percentages of variance. The target references shown in the Fig. 6a are zero coefficients of the left HRTFs (azimuth =

Figure 6: Reconstruction of zero coefficients from different orders of PCA. (a) Target zero coefficients. (b) Estimated zero coefficients from 14 PC. (c) Estimated zero coefficients from 11 PCs. (d) Estimated zero coefficients from 11 PCs
The experiments in this article were conducted on the publicly available CIPIC HRTF dataset [28]. This dataset is provided by the Interface Laboratory of the Center for Image Processing and Integrated Computing at the University of California, Davis. It is a high-precision HRTF dataset. The dataset comprises 112,500 sets of HRTF data involving 45 different subjects. For each subject, HRTF measurements were carried out at 1250 different spatial orientations, including 25 horizontal and 50 vertical orientations. Fig. 7 illustrates the distribution of spatial measurement points and a CIPIC dataset coordinate schematic. The range of elevation angles spans from

Figure 7: Spatial point distribution of the CIPIC database and its coordinate system. (a) Distribution of spatial measurement points in the CIPIC database. (b) Coordinate system used for the CIPIC database
The numbers of pole and zero coefficients in our method are set at 20 and 19, respectively, which has been discussed in Subsection 3.2. We investigated three strategies of principal components configuration:
where
The compressive performance of the proposed method is evaluated with the compression ratio
where
4.3 Objective Experiments and Analysis
The performances of HRTF compression and reconstruction are listed in Table 1. The ASDs of reconstructed HRTFs over all 45 subjects (112,500 spectral directions) are 5.46 dB with 8 PCs, 4.57 dB with 11 PCs, and 3.88 dB with 14 PCs. The compression ratios (ratio of the number of low-dimensional features to the number of features in the original input data) are

Fig. 8 compares the HRTF reconstruction results using the three ratios mentioned above. The evaluation subject is the left ear HRTF of subject 003, which was extracted from the CIPIC’s HRTF database. The spatial points of reconstructed HRTFs are on the median plane, with the elevation ranging from
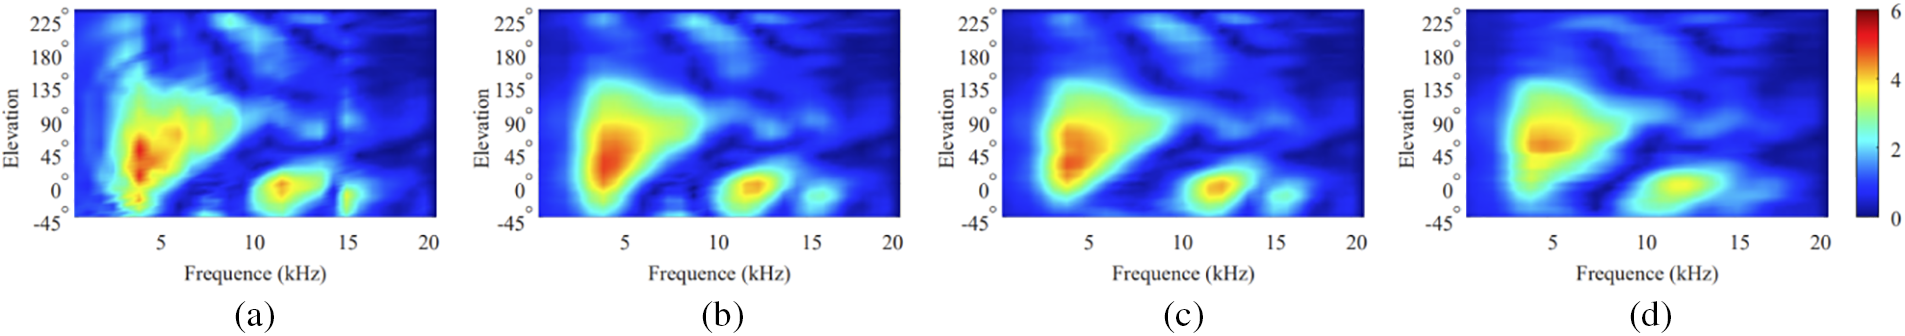
Figure 8: Comparison of HRTF reconstruction results with different orders of PCA. (a) Target HRTFs of median plane. (b) Reconstructed HRTFs with 14 PCs. (c) Reconstructed HRTF with 11 PCs. (d) Reconstructed HRTF with 8 PCs
Fig. 9 compares the ASD results for all 45 subjects in the CIPIC’s HRTF database. The ASD was calculated using all 1250 spatial points. The evaluation results indicated that all the ASD values are below 6 dB, with the maximum values being 5.92 dB on the left side and 5.96 dB on the right side. The mean ASD across all 45 subjects is 4.56 dB to the left and 4.59 dB to the right side.

Figure 9: Comparison of ASD results of all the 45 subjects with percent variance of 96.14% (with a compression ratio of 5.5%)
We also investigated the distribution of ASD in different spatial positions, as shown in Fig. 10. From the figure, it can be observed that the ASD result is below 5 dB for most spatial positions. However, the frequency distortion worsens as the azimuth changes to the contralateral spatial position. Fortunately, however, humans likely only use the ipsilateral ear for vertical localization [42]. Additionally, the most significant frequency distortion only occurs at the opposite spatial orientation, which may have a limited impact on auditory location.

Figure 10: ASD results at different spatial positions. (a) Left side with ASD = 4.30 dB. (b) Right side with ASD = 4.32 dB
In this study, we proposed an HRTF representation method based on the common-pole/zero modeling and PCA. Enlightened by the conventional common-acoustical-pole/zero model, we estimate the common-pole coefficients of multi-subject HRTFs and propose a method to calculate the zero coefficients. The PCA is then applied to the zero coefficients of all the subjects in order to derive the principal components. There are two benefits to this method. Firstly, compared to conventional pole/zero-based models, our method achieves better compression performance by recompressing zero coefficients. Secondly, compressing zero coefficients preserves the variations caused by changes in spatial directions, which may provide a new approach for representing the dimensional reduction of HRTFs. Experimental results on the CIPIC database show that the compression ratio can reach 9.5% when the average spectral distortion is less than 2 dB. Our method utilizes human auditory features and extends the traditional Common-Acoustical-Pole/Zero (CAPZ) method to estimate the common pole and zero coefficients across multiple subjects. Subsequently, the zero coefficients are compressed using the PCA procedure. This work is one step in exploring methods to obtain individualized HRTF from a user’s anthropometric features and an existing HRTF database. Our future work includes analyzing the low-dimensional characterization of HRTF and its relationships with anthropometric features.
Acknowledgement: The authors also grate fully acknowledge the helpful comments and suggestions of the reviewers, which have improved the presentation.
Funding Statement: The authors received no specific funding for this study.
Author Contributions: The authors confirm contribution to the paper as follows: study conception and design: Wei Chen, Xiaogang Wei; data collection: Hongxu Zhang, Wenpeng He; analysis and interpretation of results: Xiaogang Wei, Hongxu Zhang; draft manuscript preparation: Xiaogang Wei, Hongxu Zhang. All authors reviewed the results and approved the final version of the manuscript.
Availability of Data and Materials: The data that support the findings of this study are openly available in CIPIC at https://sofacoustics.org/data/database/cipic/ (accessed on 04 July 2023).
Ethics Approval: Not applicable.
Conflicts of Interest: The authors declare that they have no conflicts of interest to report regarding the present study.
References
1. R. Hu et al., “Review on three-dimension audio technology,” (in ChineseShuju Caiji Yu Chuli/J. Data Acquis. Process., vol. 29, pp. 661–676, 2014. [Google Scholar]
2. Y. Song, W. Tu, R. Hu, X. Wang, W. Chen and C. Yang, “An efficient method using the parameterized HRTFs for 3D audio real-time rendering on mobile devices,” in Pac. Rim Conf. Multimed., Harbin, China, Springer, 2017, pp. 663–673. [Google Scholar]
3. S. Hu, J. Trevino, C. Salvador, S. Sakamoto, and Y. J. A. A. Suzuki, “Modeling head-related transfer functions with spherical wavelets,” Appl. Acoust., vol. 146, no. 6, pp. 81–88, 2019. doi: 10.1016/j.apacoust.2018.10.026. [Google Scholar] [CrossRef]
4. M. A. Blommer and G. H. Wakefield, “Pole-zero approximations for head-related transfer functions using a logarithmic error criterion,” IEEE Trans. Speech Audio Process., vol. 5, no. 3, pp. 278–287, 1997. doi: 10.1109/89.568734. [Google Scholar] [PubMed] [CrossRef]
5. A. Kulkarni and H. S. Colburn, “Efficient finite-impulse-response filter models of the head-related transfer function,” J. Acoust. Soc. Am., vol. 97, no. 5_Supplement, pp. 3278, 1995. doi: 10.1121/1.411579. [Google Scholar] [CrossRef]
6. A. Kulkarni and H. S. Colburn, “Infinite-impulse-response models of the head-related transfer function,” J. Acoust. Soc. Am., vol. 115, no. 4, pp. 1714–1728, 2004. doi: 10.1121/1.1650332. [Google Scholar] [PubMed] [CrossRef]
7. M. Chen and S. -F. Hsieh, “Common acoustical-poles/zeros modeling for 3D sound processing,” in 2000 IEEE Int. Conf. Acous. Speech Signal Process. Proc. (Cat. No. 00CH37100), Istanbul, Turkey, IEEE, 2000, vol. 2, pp. II785–II788. [Google Scholar]
8. Y. Haneda, S. Makino, Y. Kaneda, and N. Kitawaki, “Common-acoustical-pole and zero modeling of head-related transfer functions,” IEEE Trans. Speech Audio Process., vol. 7, no. 2, pp. 188–196, 1999. doi: 10.1109/89.748123. [Google Scholar] [CrossRef]
9. C. Liu and S. -F. Hsieh, “Common-acoustic-poles/zeros approximation of head-related transfer functions,” in 2001 IEEE Int. Conf. Acous. Speech Sig. Process. Proc. (Cat. No. 01CH37221), Salt Lake City, UT, USA, IEEE, 2001, vol. 5, pp. 3341–3344. [Google Scholar]
10. P. Guillon, R. Nicol, and L. Simon, “Head-related transfer functions reconstruction from sparse measurements considering a priori knowledge from database analysis: A pattern recognition approach,” in Conf. Audio Eng. Soc. Conven. 125, San Francisco, CA, USA, Audio Engineering Society, 2008. [Google Scholar]
11. W. Zhang, T. D. Abhayapala, R. A. Kennedy, and R. Duraiswami, “Insights into head-related transfer function: Spatial dimensionality and continuous representation,” J. Acoust. Soc. Am., vol. 127, no. 4, pp. 2347–2357, 2010. doi: 10.1121/1.3336399. [Google Scholar] [PubMed] [CrossRef]
12. D. N. Zotkin, R. Duraiswami, and N. A. Gumerov, “Regularized HRTF fitting using spherical harmonics,” in 2009 IEEE Workshop Appl. Sig. Process. Audio Acoust., New Paltz, NY, USA, IEEE, 2009, pp. 257–260. [Google Scholar]
13. M. J. Evans, J. A. S. Angus, and A. I. Tew, “Analyzing head-related transfer function measurements using surface spherical harmonics,” J. Acoust. Soc. Am., vol. 104, no. 4, pp. 2400–2411, 1998. doi: 10.1121/1.423749. [Google Scholar] [CrossRef]
14. W. Zhang, M. Zhang, R. A. Kennedy, and T. D. Abhayapala, “On high-resolution head-related transfer function measurements: An efficient sampling scheme,” IEEE Trans. Audio Speech Lang. Process., vol. 20, no. 2, pp. 575–584, 2011. doi: 10.1109/TASL.2011.2162404. [Google Scholar] [CrossRef]
15. F. Brinkmann and S. Weinzierl, “Comparison of head-related transfer functions pre-processing techniques for spherical harmonics decomposition,” in Audio Eng. Soc. Conf.: 2018 AES Int. Conf. Audio Virtual Augment. Real., Redmond, WA, USA, Audio Engineering Society, 2018. [Google Scholar]
16. Z. B.-Hur, D. L. Alon, B. Rafaely, and R. Mehra, “Loudness stability of binaural sound with spherical harmonic representation of sparse head-related transfer functions,” EURASIP J. Audio Speech Music Process., vol. 2019, pp. 1–14, 2019. [Google Scholar]
17. H. Liu, Y. Fang, and Q. J. I. A. Huang, “Efficient representation of head-related transfer functions with combination of spherical harmonics and spherical wavelets,” IEEE Access, vol. 7, pp. 78214–78222, 2019. doi: 10.1109/ACCESS.2019.2921388. [Google Scholar] [CrossRef]
18. A. P. Bates, Z. Khalid, and R. A. Kennedy, “On the use of Slepian functions for the reconstruction of the head-related transfer function on the sphere,” in 9th Int. Conf. Sig. Process. Commun. Syst. (ICSPCS), Cairns, QLD, Australia, 2015, IEEE, 2015, pp. 1–7. [Google Scholar]
19. S. Adam, “Continuous head-related transfer function representation based on hyperspherical harmonics,” 2022. doi: 10.48550/arXiv.2209.05110. [Google Scholar] [CrossRef]
20. D. J. Kistler and F. L. Wightman, “A model of head-related transfer functions based on principal components analysis and minimum-phase reconstruction,” J. Acoust. Soc. Am., vol. 91, no. 3, pp. 1637–1647, 1992. doi: 10.1121/1.402444. [Google Scholar] [PubMed] [CrossRef]
21. F. Grijalva, L. Martini, D. Florencio, and S. Goldenstein, “A manifold learning approach for personalizing HRTFs from anthropometric features,” IEEE/ACM Trans. Audio Speech Lang. Process., vol. 24, no. 3, pp. 559–570, 2016. doi: 10.1109/TASLP.2016.2517565. [Google Scholar] [CrossRef]
22. F. Grijalva, L. C. Martini, B. Masiero, and S. J. I. A. Goldenstein, “A recommender system for improving median plane sound localization performance based on a nonlinear representation of HRTFs,” IEEE Access, vol. 6, pp. 24829–24836, 2018. doi: 10.1109/ACCESS.2018.2832645. [Google Scholar] [CrossRef]
23. V. D. Maaten, Laurens, E. O. Postma, and H. J. V. D. Herik, “Dimensionality reduction: A comparative review,” J. Mach. Learn. Res., vol. 10, no. 66–71, pp. 13, 2009. [Google Scholar]
24. V. R. Algazi, R. O. Duda, R. P. Morrison, and D. M. Thompson, “Structural composition and decomposition of HRTFs,” in Proc. 2001 IEEE Workshop Appl. Sig. Process. Audio Acoust. (Cat. No. 01TH8575), New Platz, NY, USA, IEEE, 2001, pp. 103–106. [Google Scholar]
25. M. Geronazzo, S. Spagnol, and F. Avanzini, “Estimation and modeling of pinna-related transfer functions,” in Proc. 13th Int. Conf. Digital Audio Effects Graz DAFx 2010, Trondheim, Norway, 2010, pp. 431–438. [Google Scholar]
26. K. Iida and Y. J. A. A. Ishii, “Effects of adding a spectral peak generated by the second pinna resonance to a parametric model of head-related transfer functions on upper median plane sound localization,” Appl. Acoust., vol. 129, pp. 239–247, 2018. doi: 10.1016/j.apacoust.2017.08.001. [Google Scholar] [CrossRef]
27. K. Iida, H. Shimazaki, and M. J. A. A. Oota, “Generation of the amplitude spectra of the individual head-related transfer functions in the upper median plane based on the anthropometry of the listener’s pinnae,” Appl. Acoust., vol. 155, pp. 280–285, 2019. doi: 10.1016/j.apacoust.2019.06.007. [Google Scholar] [CrossRef]
28. V. R. Algazi, R. O. Duda, D. M. Thompson, and C. Avendano, “The cipic hrtf database,” in Proc. 2001 IEEE Workshop Appl. Sig. Process. Audio Acoust. (Cat. No. 01TH8575), New Platz, NY, USA, IEEE, 2001, pp. 99–102. [Google Scholar]
29. M. Raspaud, H. Viste, and G. Evangelista, “Binaural source localization by joint estimation of ILD and ITD,” IEEE Trans. Audio Speech Lang. Process., vol. 18, no. 1, pp. 68–77, 2009. doi: 10.1109/TASL.2009.2023644. [Google Scholar] [CrossRef]
30. X. Wu, D. S. Talagala, W. Zhang, and T. D. Abhayapala, “Binaural localization of speech sources in 3-D using a composite feature vector of the HRTF,” in IEEE Int. Conf. Acoust. Speech Sig. Process. (ICASSP), South Brisbane, QLD, Australia, 2015, IEEE, 2015, pp. 2654–2658. [Google Scholar]
31. F. Asano, Y. Suzuki, and T. Sone, “Role of spectral cues in median plane localization,” J. Acoust. Soc. Am., vol. 88, no. 1, pp. 159–168, 1990. doi: 10.1121/1.399963. [Google Scholar] [PubMed] [CrossRef]
32. K. Iida and M. J. A. A. Oota, “Median plane sound localization using early head-related impulse response,” Appl. Acoust., vol. 139, pp. 14–23, 2018. doi: 10.1016/j.apacoust.2018.03.027. [Google Scholar] [CrossRef]
33. E. H. A. Langendijk and A. W. Bronkhorst, “The contribution of spectral cues to human sound localization,” J. Acoust. Soc. Am., vol. 105, no. 2_Supplement, pp. 1036, 1999. doi: 10.1121/1.424945. [Google Scholar] [CrossRef]
34. W. Chen, R. Hu, X. Wang, C. Yang, and L. J. C. C. Meng, “Individualization of head related impulse responses using division analysis,” China Commun., vol. 15, no. 5, pp. 92–103, 2018. doi: 10.1109/CC.2018.8387989. [Google Scholar] [CrossRef]
35. V. C. Raykar, R. Duraiswami, and B. Yegnanarayana, “Extracting the frquencies of the pinna spectral notches in measured head related impulse responses,” J. Acoust. Soc. Am., vol. 118, no. 1, pp. 364–374, 2005. doi: 10.1121/1.1923368. [Google Scholar] [PubMed] [CrossRef]
36. L. Spillman and B. R. Wooten, Sensory Experience, Adaptation, and Perception: Festschrift for Ivo Kohler. New York, USA: Psychology Press, 2013, pp. 775. [Google Scholar]
37. R. Algazi, C. Avendano, and R. O. Duda, “Estimation of a spherical-head model from anthropometry,” AES: J. Audio Eng. Soc., vol. 49, pp. 472–479, 2001. [Google Scholar]
38. H. Gamper, M. R. Thomas, and I. J. Tashev, “Estimation of multipath propagation delays and interaural time differences from 3-D head scans,” in 2015 IEEE Int. Conf. Acoust. Speech Sig. Process. (ICASSP), South Brisbane, QLD, Australia, IEEE, 2015, pp. 499–503. [Google Scholar]
39. J. He, W. S. Gan, and E. L. Tan, “On the preprocessing and postprocessing of HRTF individualization based on sparse representation of anthropometric features,” in 2015 IEEE Int. Conf. Acoust. Speech Sig. Process. (ICASSP), South Brisbane, QLD, Australia, IEEE, 2015, pp. 639–643. [Google Scholar]
40. C. Ahuja and R. M. Hegde, “Fast modelling of pinna spectral notches from HRTFs using linear prediction residual cepstrum,” in 2014 IEEE Int. Conf. Acoust. Speech Sig. Process. (ICASSP), Florence, Italy, IEEE, 2014, pp. 4458–4462. [Google Scholar]
41. B. Xie and T. Zhang, “The audibility of spectral detail of head-related transfer functions at high frequency,” Acta Acust. United Acust., vol. 96, no. 2, pp. 328–339, 2010. doi: 10.3813/AAA.918282. [Google Scholar] [CrossRef]
42. J. C. Middlebrooks and D. M. Green, “Sound localization by human listeners,” Annu. Rev. Psychol., vol. 42, no. 1, pp. 135–159, 1991. doi: 10.1146/annurev.ps.42.020191.001031. [Google Scholar] [PubMed] [CrossRef]
Cite This Article
 Copyright © 2024 The Author(s). Published by Tech Science Press.
This work is licensed under a Creative Commons Attribution 4.0 International License , which permits unrestricted use, distribution, and reproduction in any medium, provided the original work is properly cited.
 Downloads
 Citation Tools