
 Submit a Paper
 Propose a Special lssue
 Open Access
ARTICLE

Explainable AI and Interpretable Model for Insurance Premium Prediction
Department of Computer and Information Science, University of Strathclyde, Glasgow, UK
* Corresponding Authors: Umar Abdulkadir Isa. Email: ; Anil Fernando. Email:
Journal on Artificial Intelligence 2023, 5, 31-42. https://doi.org/10.32604/jai.2023.040213
Received 09 March 2023; Accepted 23 May 2023; Issue published 11 August 2023
 View Full Text
 Download PDF
Abstract
Traditional machine learning metrics (TMLMs) are quite useful for the current research work precision, recall, accuracy, MSE and RMSE. Not enough for a practitioner to be confident about the performance and dependability of innovative interpretable model 85%–92%. We included in the prediction process, machine learning models (MLMs) with greater than 99% accuracy with a sensitivity of 95%–98% and specifically in the database. We need to explain the model to domain specialists through the MLMs. Human-understandable explanations in addition to ML professionals must establish trust in the prediction of our model. This is achieved by creating a model-independent, locally accurate explanation set that makes it better than the primary model. As we know that human interaction with machine learning systems on this model’s interpretability is more crucial. For supporting set validations in model selection insurance premium prediction. In this study, we proposed the use of the (LIME and SHAP) approach to understand research properly and explain a model developed using random forest regression to predict insurance premiums. The SHAP algorithm’s drawback, as seen in our experiments, is its lengthy computing time—to produce the findings, it must compute every possible combination. In addition, the experiments conducted were intended to focus on the model’s interpretability and explain its ability using LIME and SHAP, not the insurance premium charge prediction. Three experiments were conducted through experiment, one was to interpret the random forest regression model using LIME techniques. In experiment 2, we used the SHAP technique to interpret the model insurance premium prediction (IPP).Keywords
Although, Machine learning systems (MLMs) are unquestionably ubiquitous; they are shown in a variety of fields performing a variety of tasks with increasing frequency there in the machine learning system. The present trend has highlighted the necessity and significance of ML interpretability with regard to the usage of ML in contemporary society, a study area that has only recently begun to attract some attention. These innovative Interpretable machine learning studies are discussed portion of the overall ML research when we compared it to the machine learning models (MLMs) as well as the focus on reaching higher performance measures.
According to ML algorithms have their own shortcomings and hazards, despite the fact that their results and predictions make them more powerful. The important one is black box machine learning (BBML) algorithms’ inherent lack of transparency or opaqueness [1]. The user is not privy to the internal logic and workings of these models, which is a severe drawback as it makes it impossible for a human, expert or non-expert, to check, analyze, and also comprehend the rationale behind the system and how certain decisions making the unreached to reached easily [2].
Simply put, every adequately complicated system behaves as a black box whenever experimentation becomes more appealing than comprehension [3]. This “Black box” category includes more ML models, including research with the best models in many fields, unlike engineering, management, computer science, charted accountancy and business experts [4], including DNN or ensemble networks.
In terms of interpretability per se, there has been intermittent attention to explanations of expert machines since the 1970s, starting with expert systems [5,6], and moving to neural networks a century later [7], We observed that recommended systems are started from “Black box” category includes more ML models, including research 2000s [8,9]. Approximately a century ago, if we focus on research in AI has turned away from explaining decision processes (DP) and toward building algorithms with techniques that are centred on the predictive capability, and rate of development towards tackling these difficulties.
A deeper grasp of the outputs is an essential part of the resurgence of interest in this for the above-mentioned systems due to the successes of ML systems in many effective and highly relevant fields. The usage of ever-more complicated and opaque methods, such as deep learning and is quite essential for all users [10].
According to the reviewed literature (ROL) explained now in existence, numerous approaches have been put forth to achieve explainability. How Numerous criteria are involved [11,12] to classify these techniques, including model-independent (MI) or model-specific, global, local, example-based, extrinsic, and intrinsic models? Model-agnostic techniques (MATs) are among them frequently used in practice since the method is designed to be effective for any type of machine learning model in the world.
Due to the major significance of understandability and interpretability in this machine learning process, it is very obvious that more attention must be paid to this area of research in order to advance and unify new findings. Regretfully, machine learning models (MLMs) are well-known as Black boxes. These are far from perfect, and explainable AI is desperately needed in the medical industry, patients’ attention is quite an important concern.
This study is intended to represent a step in that direction by proposing through the explainability and interpretability model used by the insurance premium charge model (IPCM).
In order to keep the study succinct and consider model-agnostic techniques as innovative (IMAT) such as LIME and SHAP, both of these models are designed to function with any kind of machine learning model (MLM). A collection of features are basically out of the model and evaluating the loss in terms of the model quality is a typical tactic.
The specific task of prediction is highlighted by the large loss value, which quantifies the significance of the removed feature. The idea of the random forest technique (RFTs) was first put forth by Breiman [13], and it has since been developed to incorporate a model-neutral model (MNM) called LOCO [14].
In addition, another frequent strategy seems to be given for the true copy of the training replica model that mimics the ML model’s behaviour. In this same manner, among others, [15,16] give approximations of the full input spaces. Reference [17] as well as its extension utilizing decision criteria [18] rely on this method to provide local approximations and to promote the further research.
Barredo et al. [19] claimed that there is a minimal consensus among academics regarding what those explanations of characteristics. They might have the appropriate nomenclature to employ. Further, according to Barredo et al. [19], the most frequently used words and their many definitions in XAI research are defined as three distinct levels of transparency are expressly recommended. Barredo et al. [19] went over these levels of transparency and how they relate to various AI systems in order to categorize AI algorithms as transparent, opaque, or non-transparent. Of course, a system is never opaque by itself; rather, it is opaque in relation to a particular agent.
Vilone et al. [20] provided a thorough breakdown of a system’s many agent groupings. A specific agent is likely to need a distinct form of knowledge to do the important task at hand, and as a result, they will require a different type of explanation. A summary of the study objectives that various entities can accomplish through this innovative model explainability has been put together by Vilone et al. [20].
We must accept that explanations are available in a wide variety of proverbial shapes in order to properly understand the idea of describing AI models. Lundberg et al. [21] defined various explanation kinds as well as their characteristics and traits. Recently, a number of XAI techniques have been created to increase model transparency and explainability. Lundberg et al. [21] have compiled a thorough overview of all the pre-and post-hoc explainable artificial intelligence (Known as XAI or explainable AI) techniques currently in use.
This section covered the model and explain the AI techniques used in this research. In this work, a Random Forest Regressor Model (RFRM) is used to predict the cost of insurance premiums. To assess the effectiveness of the model utilized in this work, we also used several performance assessment metrics, such as mean square error (MSE), root mean square error (RMSE), R square score (R2) and (R2) values to find among others.
The random forest regression technique to build our baseline model and used the Sklearn module (SM) to train our baseline model by the random forest regressor function (RFRF). Also, n-estimators had random state parameters set to 10 and 0, respectively, to achieve the optimal prediction. Moreover, we used LIME and SHAP techniques to interpret the baseline model and understand how our model makes a prediction and how features interact with each other to make the predicted target do the accurate directions.
Below are brief explanations of the explainable AI techniques used in this work. This study is not aiming to produce an optimal prediction but rather to demonstrate it and explain AI techniques included with LIME and SHAP tools and techniques used to validate the model AI for prediction. (see Fig. 1).
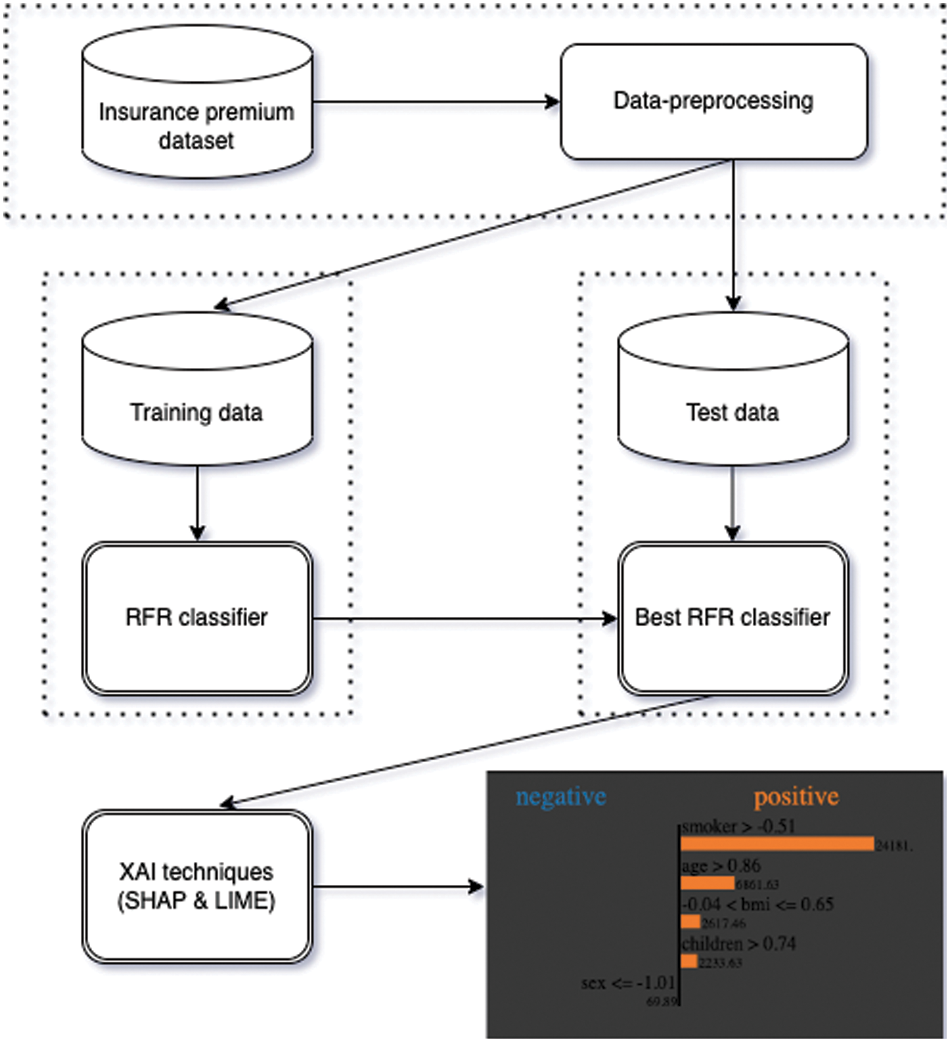
Figure 1: Semantic diagram representation of the proposed methodology. The RFR and XAI stand for random forest regression and explainable artificial intelligence, respectively
The proposed model with different numbers of layers and a pre-trained model is shown step by step in Fig. 1. Fig. 1 shows the process of pre-processing, training, and testing the prediction of insurance premium charges, then applying explainable AI techniques such as SHAP and LIME for human evaluation. Also, as shown in Fig. 1, the trained black-box model is the input to the explainable AI technique for visual representation and human evaluation of the trained model.
The model-agnostic technique (MAT) is instance-based in the LIME process to create the data points that are scored according to their proximity to the instance being described in all samples from the distribution of the training original dataset. On the weighted dataset, only the most important variables for the linear model have been trained by using feature selection. Model coefficients are considered as a possible explanation. On LIME technique has been employed in medicine on a number of occasions, including data related to intensive care [22], cancer [23], and HIV [24].
SHAP was originally developed from the game theory for evaluating every player’s involvement in the cooperative game [25]. The issue of giving each player a fair reward and determining their individual value-based (IVB) on local consistency (LC), accuracy (AC), and null value was resolved by the SHAP model values [25]. Recent work on machine learning algorithms has created a new direction to comprehend model outputs, giving previously, thought “black box” models more transparency, accuracy, IVB, LC, AC and their in-fact.
To validate and provide training in our proposed methodology, used by all newly developed data datasets [26]. The dataset contains 1334 observations with 7 features. The features included in the dataset are age, sex, bmi, children, smokers, and charges, as shown in the socio-demographic tables in Fig. 2. The dataset has been divided into 80/20 train/test splits using Sklearn’s train_test_split function with 30 random-state.
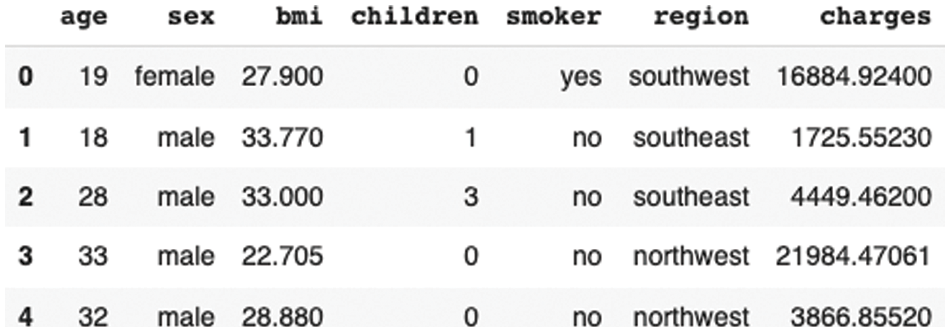
Figure 2: Dataset used and its variables representation
During the study, all experiments were performed using Google Colab Notebook with the SKlearn Library. The performances achieved using MSE, RMSE, and r2 by the random forest regression model (RFRM) are plotted in Fig. 1. Also, two of the most popular explainable AI techniques were used, namely, Lime and Shap.
This model was evaluated by developing model-neutral, locally accurate explanation (LAE) sets using the advanced LIME and SHAP approaches. This explanation set enables even non-experts to comprehend how well the original model version (OMV) comes to its conclusions. In addition, the experiments conducted were intended to focus on the model’s interpretability and explainability using the LIME and SHAP. As the two experiments were conducted, experiment one was conducted to interpret in the random forest regression model using LIME techniques. In experiment 2, the SHAP technique was used to interpret the AI model.
The LIME technique used for the first experiment to give users in broad perspective model’s decision boundaries during the experiment, the intercept, right local and left predictions, and prediction global were obtained (shown in Fig. 3). It was observed during the study that the model prediction and the LIME prediction are very close, which shows that the model can be trusted since it is quite close to the actual prediction obtained. The AI straightforward model on both similarity score data and N’s strongest feature permuted data produced the LIME local prediction and their exposure.
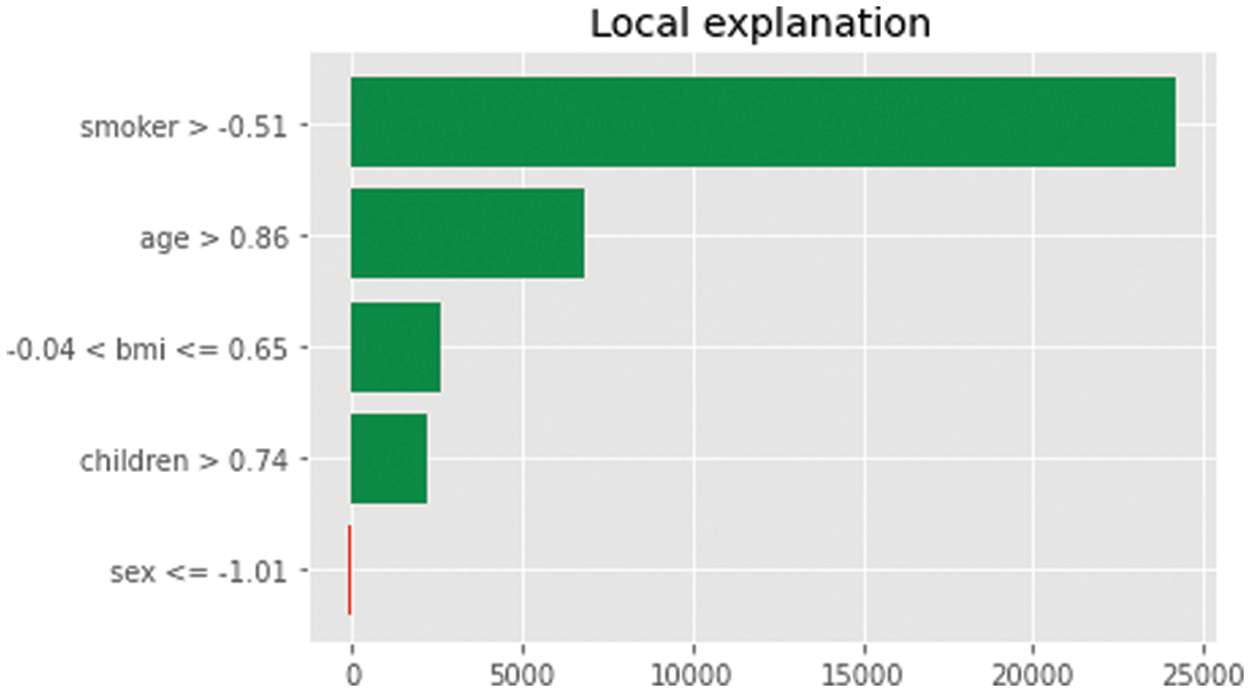
Figure 3: LIME local explanation diagram
The second experiment was carried out by using the SHAP technique. We interpreted the baseline model using the SHAP summary plot, feature importance plot, dependence plot, and force plot. We suggested assessing the feature’s importance as a first step. It is a fundamental understanding of this model. You can compare the feature importance determined by SHAP values in the following figure compared with a newly developed AI model.
The graphic shown in Fig. 4 illustrated that the traits’ relevance and effects are combined with the summary plot. Each point on the summary plot (SP) is a value for an instance per feature. The y-axis location is determined by the feature, x-axis position is determined by the Shapley value of each instance location. The feature SMOKER has a high Shapley value range. The hue indicated the value of the trait, from low to higher.
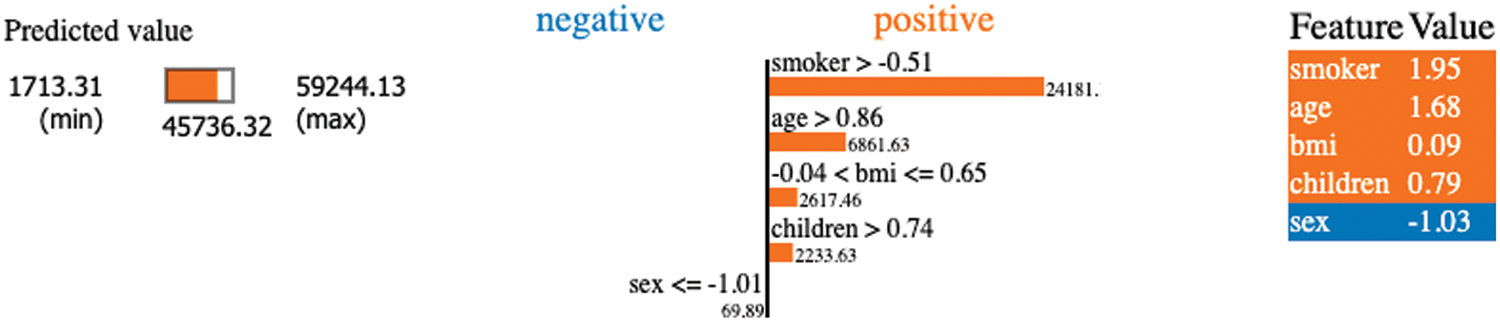
Figure 4: Our model explanation using the LIME explanation
Although overlapping points are jittered as shown in Fig. 5 in the y-axis direction, we examine that the range of the Shapley values for each feature is distributed with characteristics given in increasing order of importance. The summary plot (see Fig. 6) offers a unique opportunity to observe the connection between the feature’s value and its impact on the forecast. To see the exact shape of the relationship must examine with the SHAP-dependent plots (SDPs).
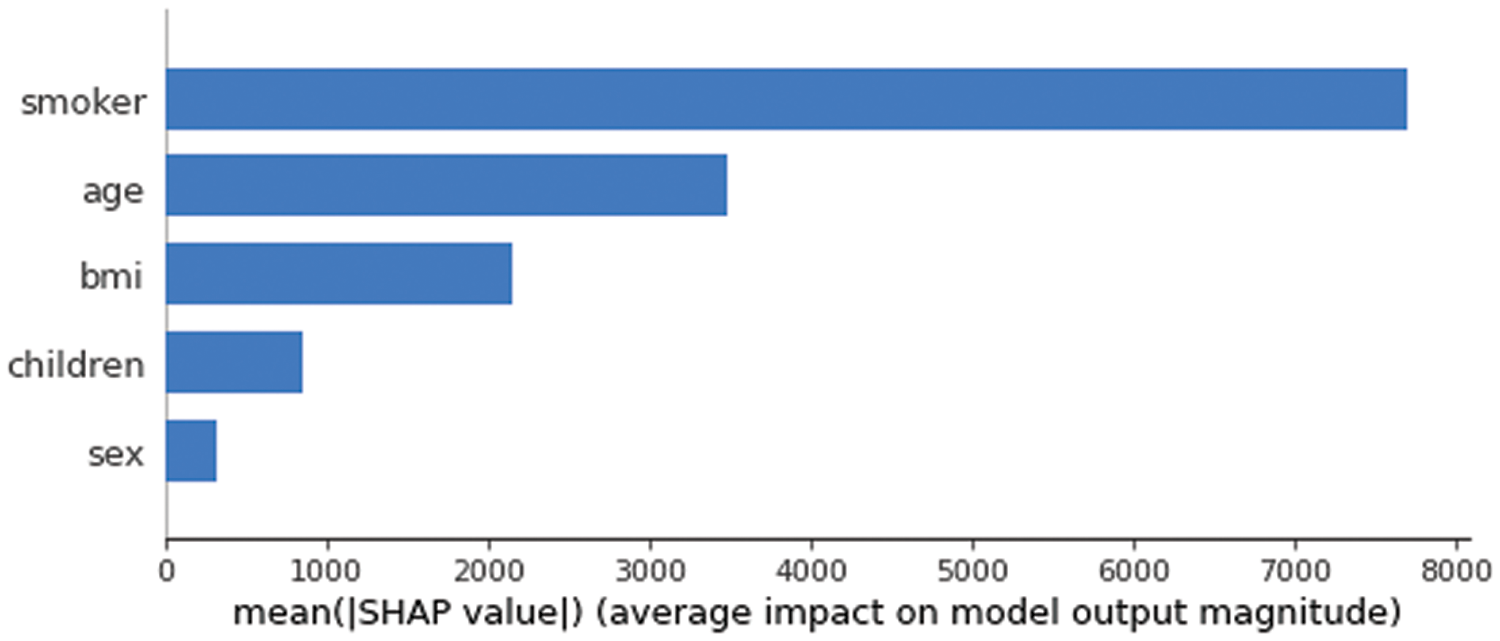
Figure 5: Average impact on our trained model output magnitude
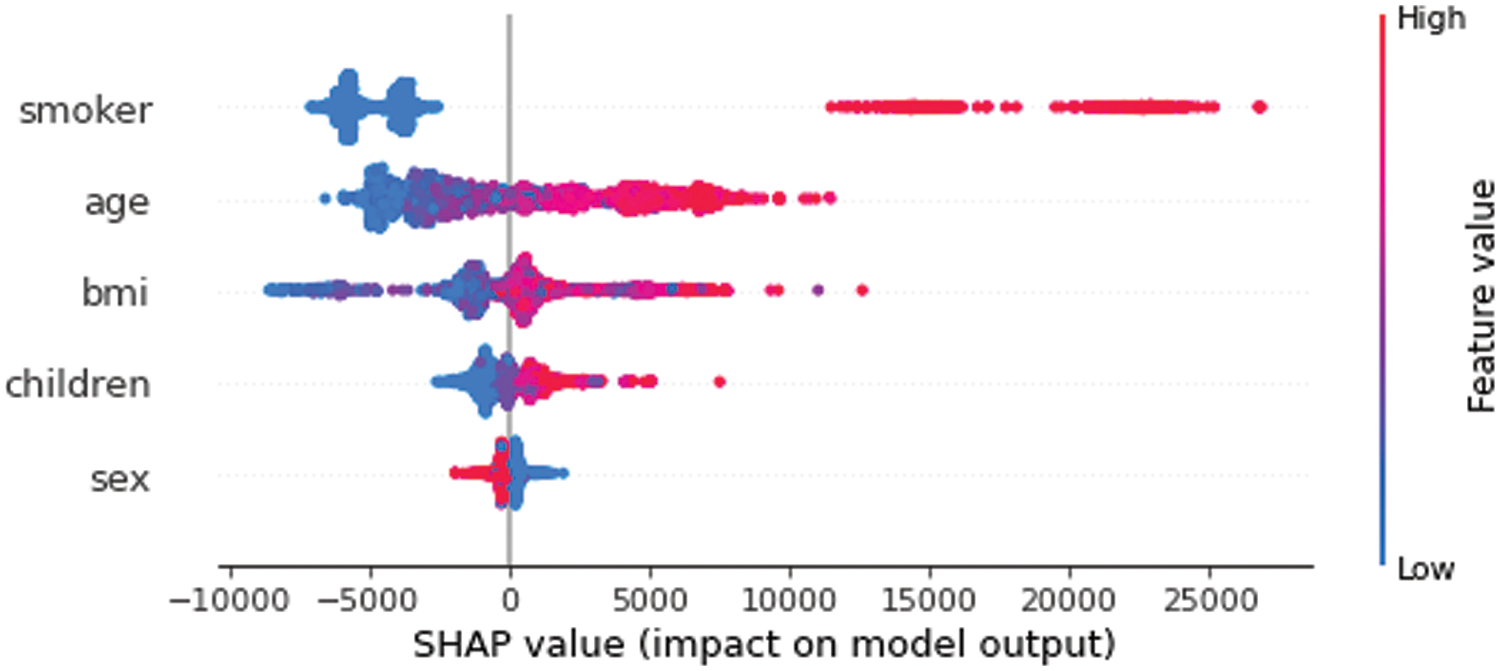
Figure 6: Feature value impact on our trained model output
The develop feature have a linear, monotonic and more complex relationship. It can be seen in a SHAP dependence plot (see Fig. 7). The partial dependence plot (SDP) is a comprehensive technique that considers all (instances and draws broad) about the state of the relationship between the feature and the anticipated outcome. The PDP assumes that the initial and second attributes don’t correlate with one another. The averages values are calculated for the partial dependence plot will contain data points that are highly implausible or even impossible if this assumption is disproven. A secondary feature is connected to the color may interact with the primary feature we are graphing. The interaction to influence between this particular variable and the features. We were graphing, a distinct vertical structure of coloring will manifest.
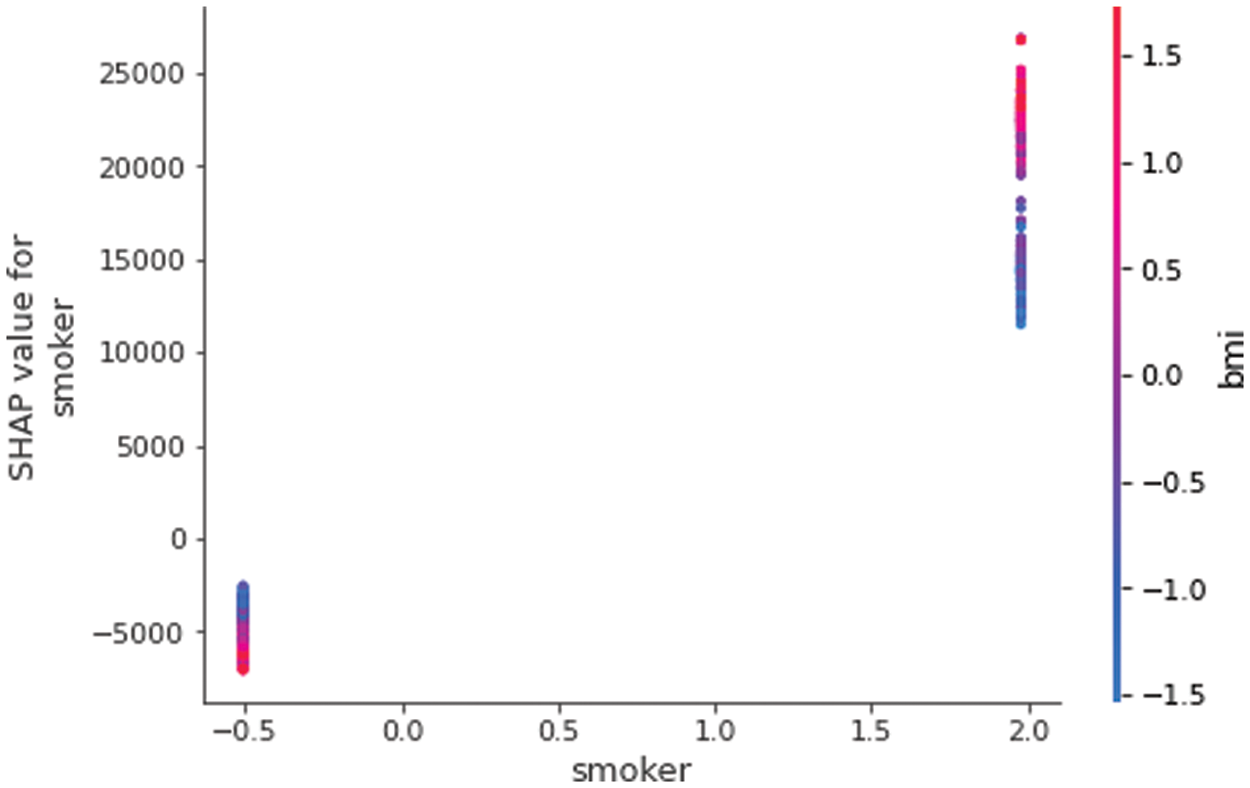
Figure 7: SHAP value impact on our trained model output using smoker and BMI features
The force charts below illustrate that explain that specific model prediction. For error analysis (minor and major) to identify the cause of a particular instance of prediction, the force plot is employed. We have plotted our results from the baseline model using the SHAP force plot. We can easily observe each feature influences the predictions, even when considering a specific instance of the data, by looking at the force plots areas.
In this research, we also used a force plot as a useful tool for determining how the “output value” fits in relation to the “base value,” as shown in Figs. 8–15, respectively. In addition, the features that influence the forecast positively (red) or negatively (blue) are shown, along with their relative importance, in the above-mentioned figures.

Figure 8: Force plot representation using base value
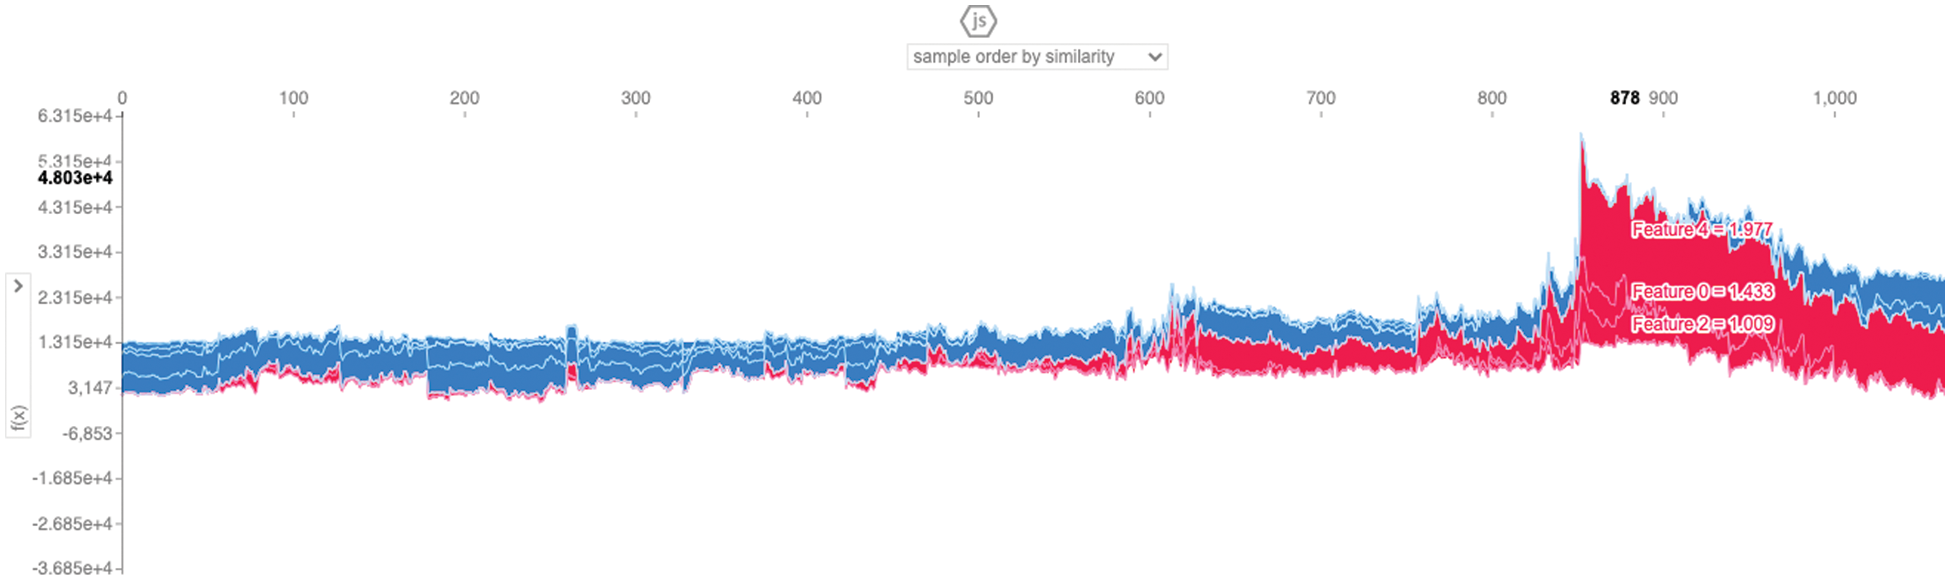
Figure 9: Force plot representation using order by similarity
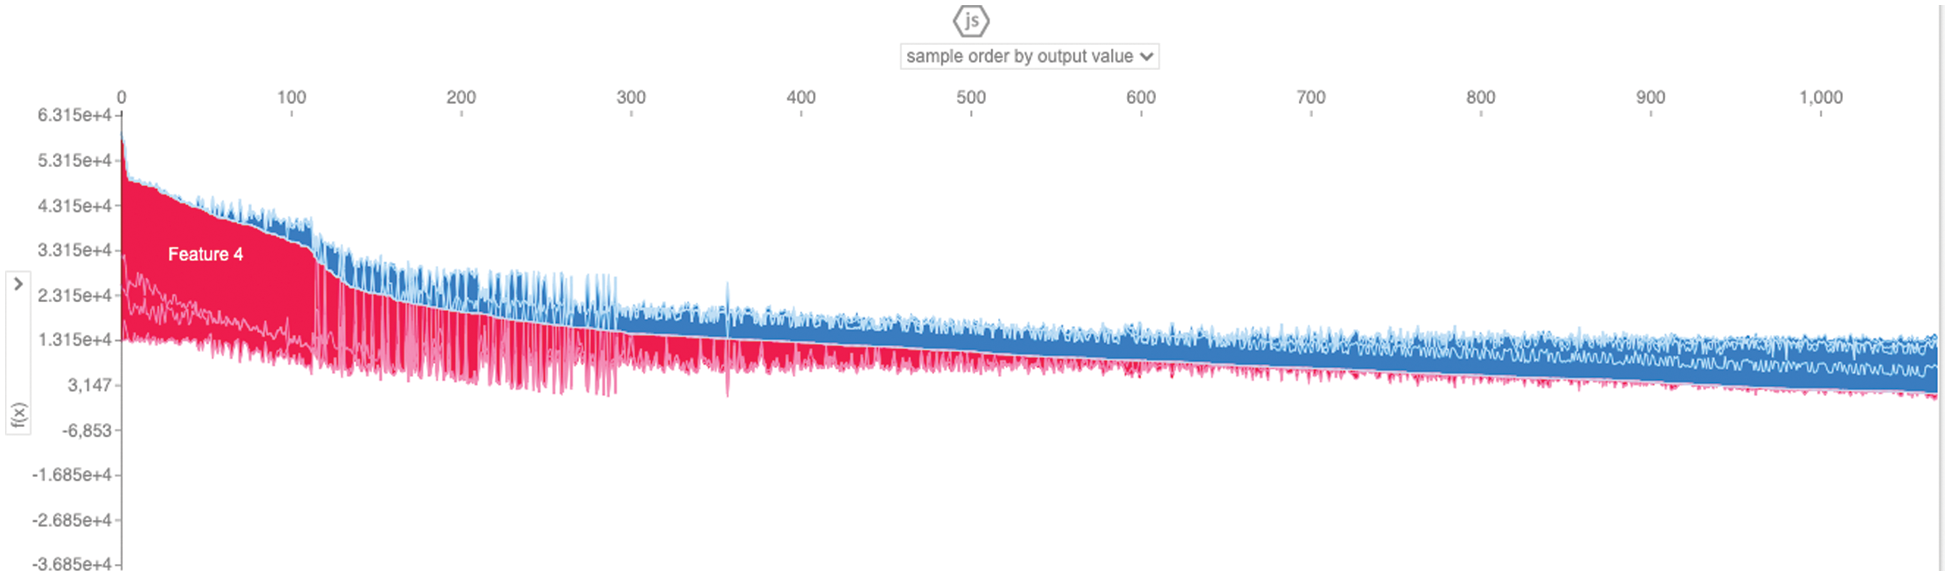
Figure 10: Force plot representation using order by the output value
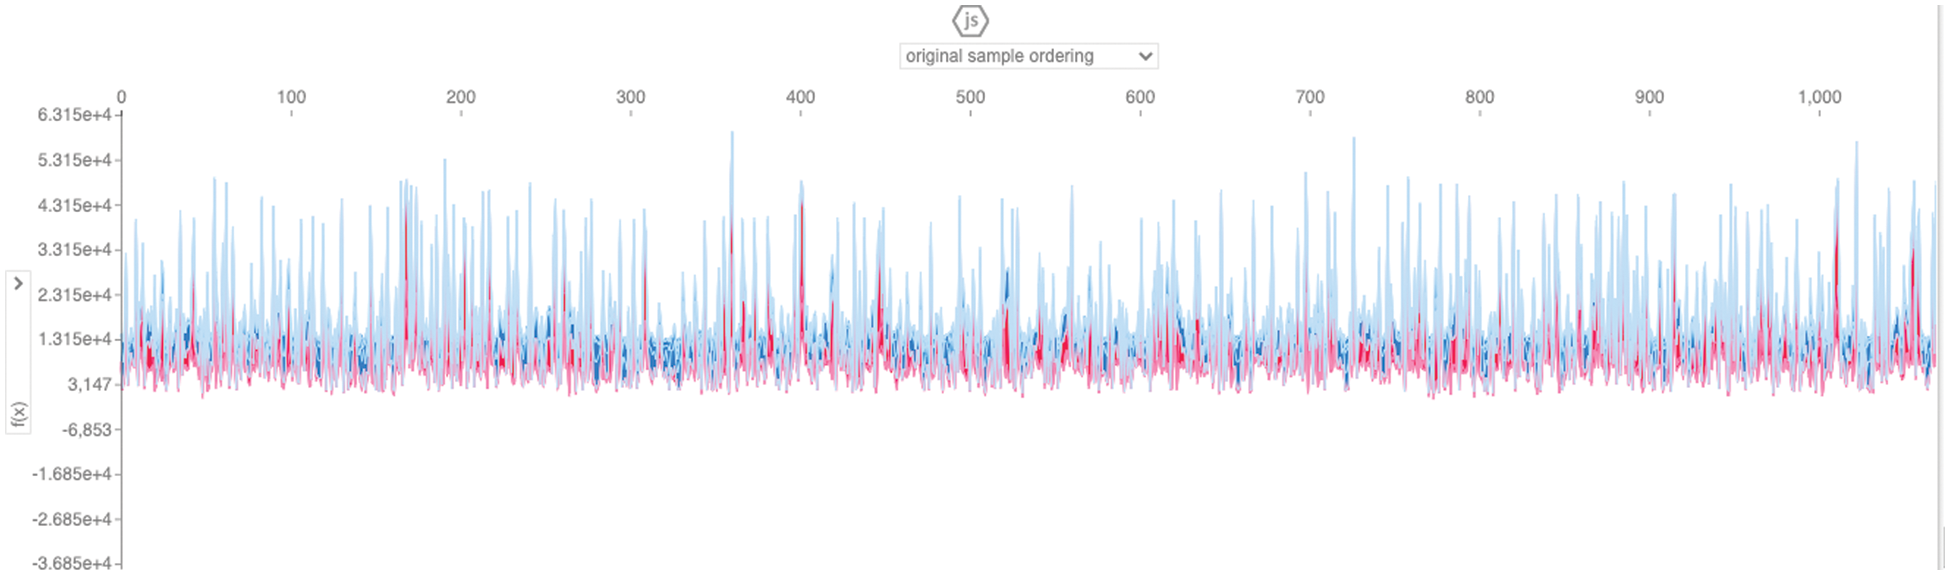
Figure 11: Force plot representation using sample order
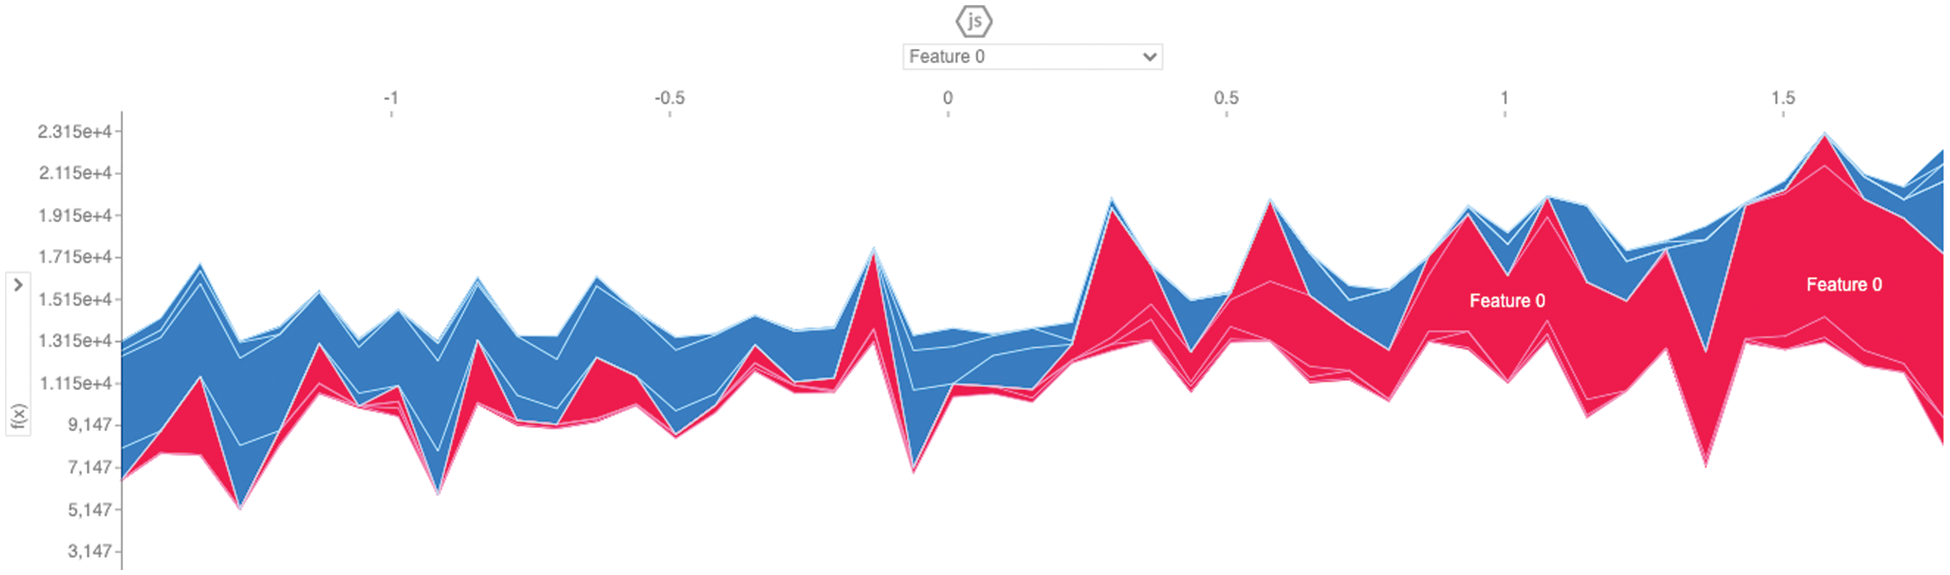
Figure 12: Force plot representation using feature 0
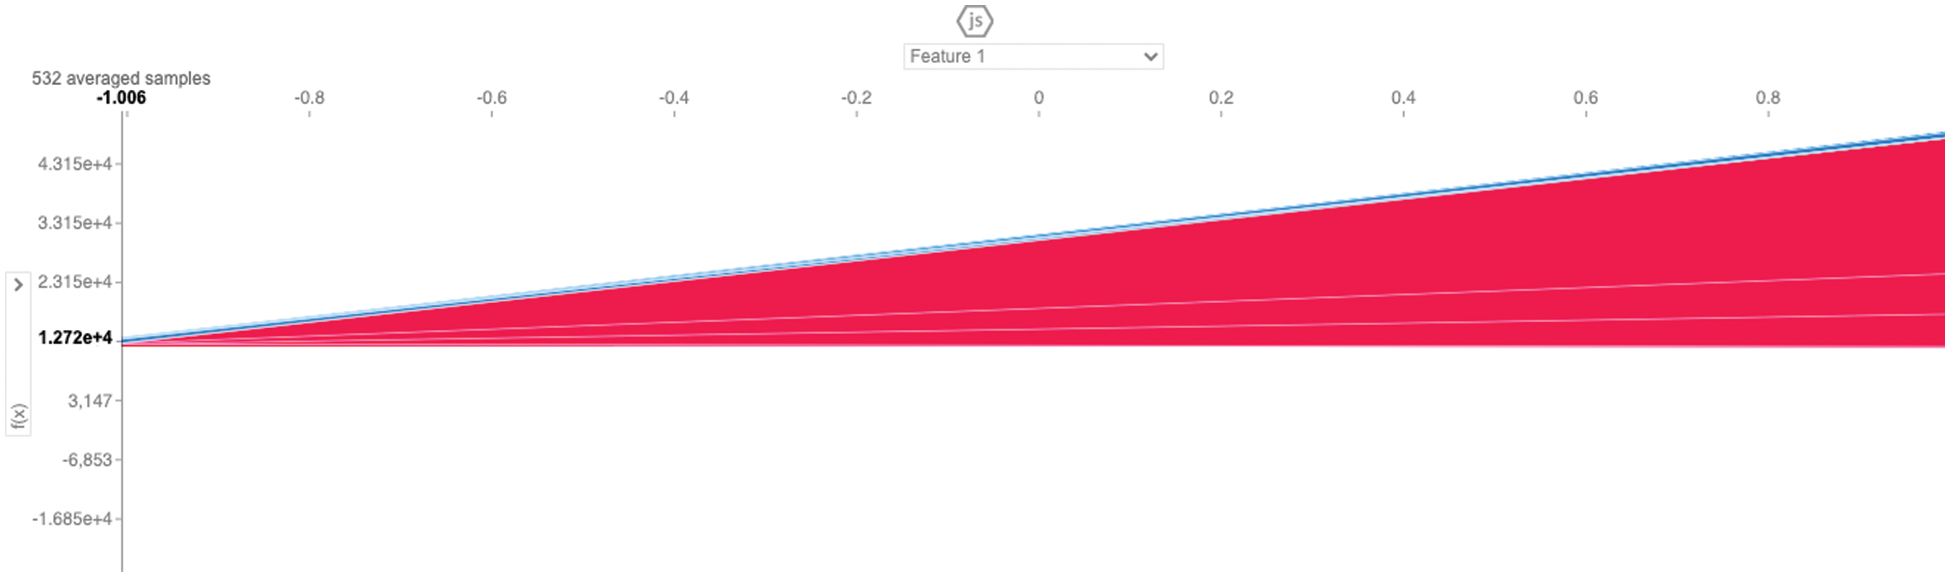
Figure 13: Force plot representation using feature 1
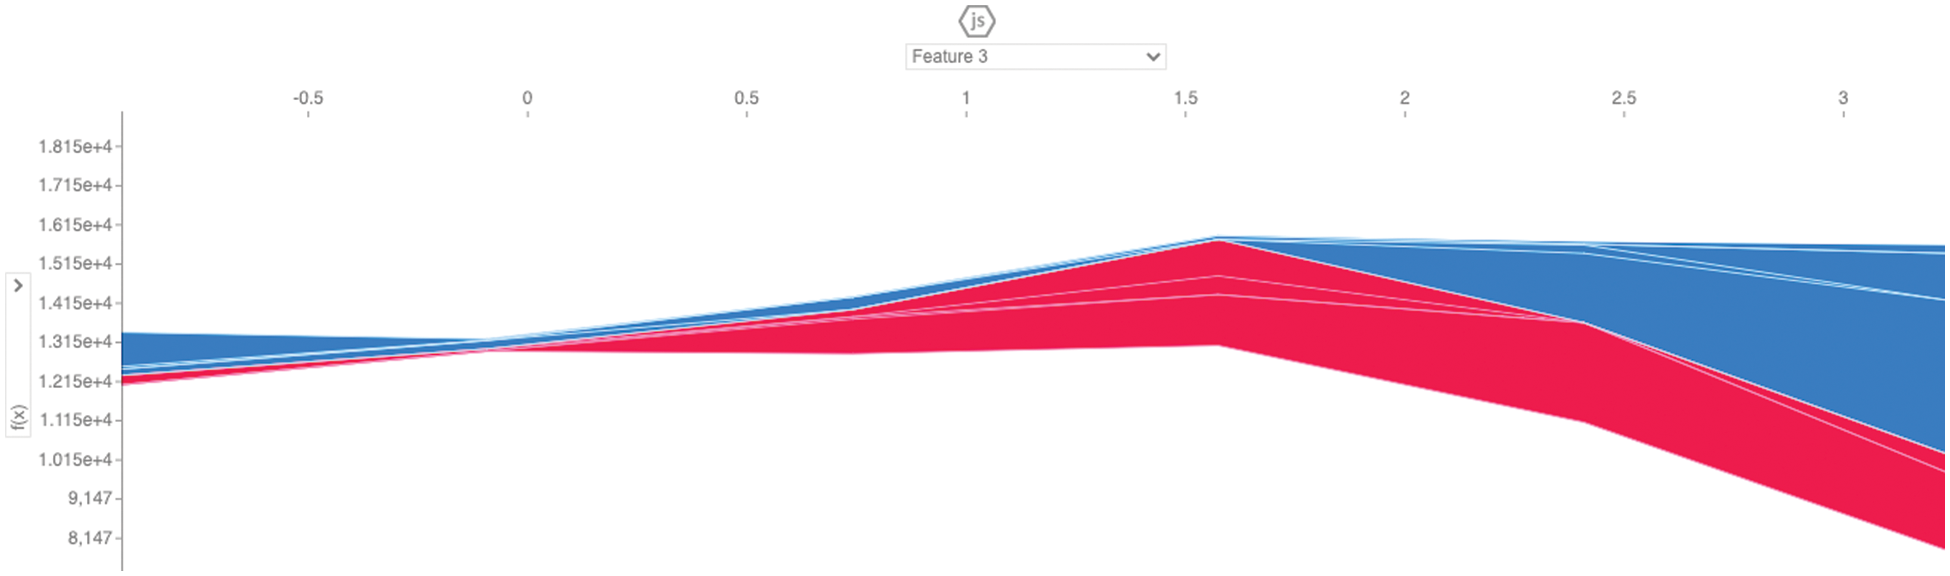
Figure 14: Force plot representation using feature 3
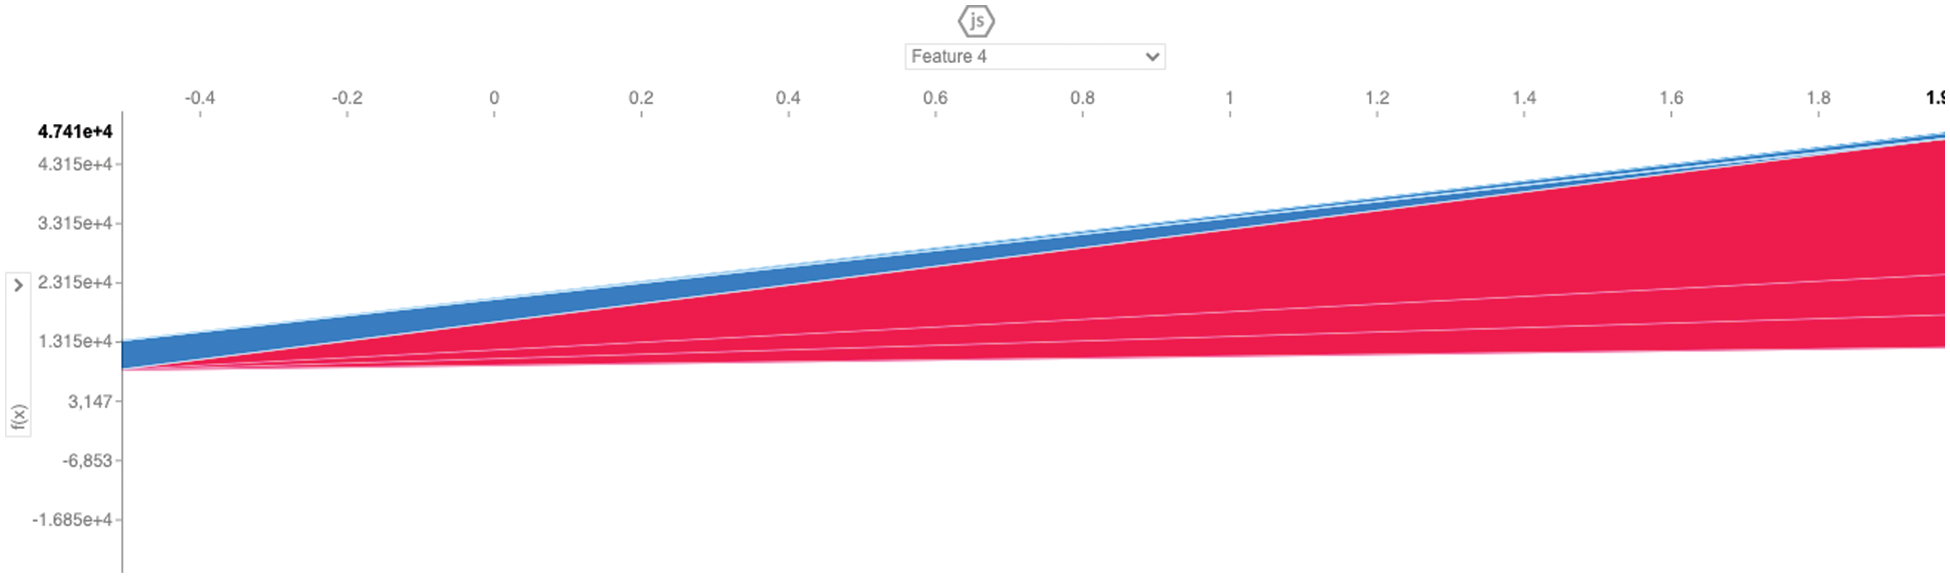
Figure 15: Force plot representation using feature 4
We defined force plot (WP) as a game theory-based explanation of feature and importance using by SHAPley values. The force plot displays how each feature has an impact on the current prediction. Obtained values that are colored blue be thought of as having a positive influence on the prediction, while values that are colored red have a negative influence on the AI system.
AI technique is supporting and holds out set validations in model selection (MS), explaining individual predictions (IPs) is crucial in determining trust. This is accomplished by developing a unique model for the independent local accurate explanation (ILAE) set. That explains well the initial model version (IMV) coming in to indeed non-experts to understand the addition to efficient human interaction with ML systems. This innovative model’s interpretability is an essential tool to compare the LIME framework. The SHAP framework represents a substantial innovation in the field of the machine-learning model (MLM) for better understanding and actual prediction.
The SHAP technique combines with a number of current approaches to reproduce the needed approach. That is both solid and intuitive for explaining predictions for any model. During the experiments, we investigated different (LIME and SHAP explanation plots) such as (local and global lime predictions) force plots, dependence plots, summary plots, and many more.
The SHAP algorithm’s drawback, as seen in our experiments and its lengthy computing time—in order to produce the findings. It must compute every possible combination with LIME builds dense linear models over each assumption in this region. SHAP algorithm is a subset of the LIME algorithm. We recommend the machine learning pipeline (MLP) should be included on XAI analysis using by SHAP, LIME, with our newly develop tools and this algorithm is highly remarkable and practically its more helpful to use.
Acknowledgement: We express our sincere gratitude to all contributors for their invaluable support and insights. Their expertise and dedication significantly enriched this paper. We also thank the reviewers for their constructive feedback, which helped enhance the quality of our work. This publication wouldn't have been possible without the encouragement and assistance of our colleagues and institution.
Funding Statement: The authors received no specific funding for this study.
Author Contributions: Conceptualization: Umar Abdulkadir Isa and Anil Fernando; Methodology: Umar Abdulkadir Isa and Anil Fernando; Software: Umar Abdulkadir Isa; Validation: Umar Abdulkadir Isa; Formal analysis: Umar Abdulkadir Isa; Investigation: Umar Abdulkadir Isa; Writing – original draft: Umar Abdulkadir Isa; Writing – Review and Editing: Umar Abdulkadir Isa and Anil Fernando; Supervision: Anil Fernando.
Availability of Data and Materials: Sample Insurance Claim Prediction Dataset: https://www.kaggle.com/datasets/easonlai/sample-insurance-claim-prediction-dataset (accessed on 08 February 2023) (Available at Kaggle for Research Purposes).
Conflicts of Interest: The authors declare that they have no conflicts of interest to report regarding the present study.
References
1. M. Du, N. Liu and T. Hu, “Techniques for interpretable machine learning,” arXiv preprint arXiv:1808.00033, 2019. [Google Scholar]
2. G. Montavon, S. Lapuschkin, A. Binder, W. Samek and K. Müller, “Explaining nonlinear classification decisions with deep Taylor decomposition,” Pattern Recognition, vol. 65, pp. 211–222, 2017. [Google Scholar]
3. D. Golovin, B. Solnik, S. Moitra, G. Kochanski, J. Karro et al., “A service for black-box optimization,” in Proc. of the 23rd ACM SIGKDD Int. Conf. on Knowledge Discovery and Data Mining, Halifax, NS, Canada, pp. 1487–1495, 2017. [Google Scholar]
4. C. Rudin, “Please stop explaining black box models for high-stakes decisions,” arXiv preprint arXiv:1811.10154, 2018. [Google Scholar]
5. W. Swartout, “A system for creating and explaining expert consulting programs,” Technical Report, University of Southern California, Information Sciences Institute: Marina del Rey, CA, USA, 1983. [Google Scholar]
6. W. van Melle, E. Shortliffe and H. Buchanan, “EMYCIN: A knowledge engineer’s tool for constructing rule-based expert systems,” in Rule-Based Expert Systems: The MYCIN Experiments of the Stanford Heuristic Programming Project, Boston, MA, USA: Addison-Wesley Publishing, pp. 302–313, 1984. [Google Scholar]
7. R. Andrews, J. Diederich and A. Tickle, “Survey and critique of techniques for extracting rules from trained artificial neural networks,” Knowledge-Based Systems, vol. 8, pp. 373–389, 1995. [Google Scholar]
8. H. Cramer, V. Evers, S. Ramlal, M. van Someren, L. Rutledge et al., “The effects of transparency on trust in and acceptance of a content-based art recommender,” User Modeling and User-Adapted Interaction, vol. 18, pp. 455, 2008. [Google Scholar]
9. J. Herlocker, A. Konstan and J. Riedl, “Explaining collaborative filtering recommendations,” in Proc. of the 2000 ACM Conf. on Computer Supported Cooperative Work, Philadelphia, PA, USA, pp. 241–250, 2000. [Google Scholar]
10. A. Abdul, J. Vermeulen, D. Wang, Y. Lim and M. Kankanhalli, “Trends and trajectories for explainable, accountable, and intelligible systems: An HCI research agenda,” in Proc. of the 2018 CHI Conf. on Human Factors in Computing Systems, pp. 582, 2018. [Google Scholar]
11. A. Holzinger, “From machine learning to explainable AI,” in 2018 World Symp. on Digital Intelligence for Systems and Machines (DISA), IEEE, Košice, Slovakia, pp. 55–66, 2018. [Google Scholar]
12. R. Guidotti, A. Monreale, S. Ruggieri, F. Turini, F. Giannotti et al., “A survey of methods for explaining black box models,” ACM Computing Surveys (CSUR), vol. 51, pp. 93, 2018. [Google Scholar]
13. L. Breiman, “Random forests,” Machine Learning, vol. 45, pp. 5–32, 2001. [Google Scholar]
14. D. W. Apley and J. Zhu, “Visualizing the effects of predictor variables in black box supervised learning models,” arXiv preprint arXiv:1612.08468, 2016. [Google Scholar]
15. M. Craven and W. Shavlik, “Extract tree-structured representations of trained networks,” Advances in Neural Information Processing Systems, Denver, CO. MIT Press, pp. 24–30, 1996. [Google Scholar]
16. Y. Zhou and G. Hooker, “Interpreting models via single tree approximation,” arXiv preprint arXiv:1610.09036, 2016. [Google Scholar]
17. M. Ribeiro, S. Singh and C. Guestrin, “Why should I trust you?: Explaining the predictions of any classifier,” in Proc. of the 22nd ACM SIGKDD Int. Conf. on Knowledge Discovery and Data Mining, San Francisco, California, USA, ACM, pp. 1135–1144, 2016. [Google Scholar]
18. R. Tomsett, D. Braines, D. Harborne, A. Preece and S. Chakraborty, “Interpretable to wham? A role-based model for analyzing interpretable machine learning systems,” arXiv preprint arXiv:1810.00184, 2018. [Google Scholar]
19. A. Barredo, D. Natalia, D. Javier, B. Adrien, T. Siham et al. “Explainable artificial intelligence (XAIConcepts, taxonomies, opportunities, and challenges toward responsible AI,” Information Fusion, vol. 58, pp. 82–115, 2020. https://doi.org/10.1016/j.inffus.2019.12.012 [Google Scholar] [CrossRef]
20. G. Vilone and L. Longo, “Explainable artificial intelligence: A systematic review,” Computer Science,vol. 4, pp. 44–53, 2020. [Google Scholar]
21. L. Lundberg and S. I. Lee, “A unified approach to interpreting model predictions,” arXiv preprint arXiv:1705.07874, 2017. [Google Scholar]
22. J. Katuwal and R. Chen, “Machine learning model interpretability for precision medicine,” arXiv preprint arXiv:1610.09045, 2016. [Google Scholar]
23. A. Zhang, S. Lam, N. Liu, Y. Pang, L. Chan et al., “Development of a radiology decision support system for the classification of MRI brain scans,” in 2018 IEEE/ACM 5th Int. Conf. on Big Data Computing Applications and Technologies (BDCAT), Auckland, New Zealand, pp. 107–115, 2018. [Google Scholar]
24. C. Moreira, R. Sindhgatta, C. Ouyang, P. Bruza and A. Wichert, “An investigation of interpretability techniques for deep learning in predictive process analytics,” arXiv preprint arXiv:2002.09192, 2020. [Google Scholar]
25. L. S. Shapley, “A value for n-person games,” In: H. W. Kuhn, A. W. Tucker (Eds.Contributions to the Theory of Games, Princeton University Press, pp. 69–79, 1997. [Google Scholar]
26. https://www.kaggle.com/code/nehahatti/health-insurance-premium-prediction-project/data [Google Scholar]
Cite This Article
 Copyright © 2023 The Author(s). Published by Tech Science Press.
This work is licensed under a Creative Commons Attribution 4.0 International License , which permits unrestricted use, distribution, and reproduction in any medium, provided the original work is properly cited.
 Downloads
 Citation Tools