
 Submit a Paper
 Propose a Special lssue
 Open Access
ARTICLE

X-ray Based COVID-19 Classification Using Lightweight EfficientNet
Department of Computer Science, King Saud University, Riyadh, 11543, Saudi Arabia
* Corresponding Author: Tahani Maazi Almutairi. Email:
Journal on Artificial Intelligence 2022, 4(3), 167-187. https://doi.org/10.32604/jai.2022.032974
Received 03 June 2022; Accepted 19 July 2022; Issue published 01 December 2022
 View Full Text
 Download PDF
Abstract
The world has been suffering from the Coronavirus (COVID-19) pandemic since its appearance in late 2019. COVID-19 spread has led to a drastic increase of the number of infected people and deaths worldwide. Imminent and accurate diagnosis of positive cases emerged as a natural alternative to reduce the number of serious infections and limit the spread of the disease. In this paper, we proposed an X-ray based COVID-19 classification system that aims at diagnosing positive COVID-19 cases. Specifically, we adapted lightweight versions of EfficientNet as backbone of the proposed recognition system. Particularly, lightweight EfficientNet networks were used to build classification models able to discriminate between positive and negative COVID-19 cases using chest X-ray images. The proposed models ensure a trade-off between scaling down the architecture of the deep network to reduce the computational cost and optimizing the classification performance. In the experiments, a public dataset containing 7,345 chest X-ray images was used to train, validate and test the proposed models for binary and multi-class classification problems, respectively. The obtained results showed the EfficientNet-elite-B9-V2, which is the lightest proposed model yielded an accuracy of 96%. On the other hand, EfficientNet-lite-B0 overtook the other models, and achieved an accuracy of 99%.Keywords
COVID-19 appeared in Wuhan, China, in December 2019. It has been named Coronaviruse (CoV) because it appears under an electron microscope as a solar corona (crown-like) [1]. The World Health Organization (WHO) called the infection caused by this type of virus COVID-19 on February 11th, 2020 [2]. COVID-19 spread rapidly around the world and infected more than three hundred million people till January 2022 [3]. The World Health Organization stated officially on March 11th, 2020 that COVID-19 has become a pandemic [4]. Precisely, until 05:30 pm CET, on January 26th, 2022 there have been 356,955,803 confirmed infections around the world, and the number of deaths reached 5,610,291 [3]. In particular, in Saudi Arabia, the total number of confirmed infections has reached 666,259 and the number of deaths attained 8927 [5].
To slow down the pandemic spread, governments all around the world have imposed drastic restrictions on their populations, such as halting international travellers, imposing wearing masks, social distancing, and closing barbershops. Despite these restrictions, the pandemic affected strategic sectors, such as education. The schools closed and many countries, such as in Saudi Arabia, where schools and universities shifted to online/distance learning [6]. Furthermore, the global economy was impacted, and many people lost their jobs. Saudi Arabia government provided considerable financial support to the companies acting in the damaged sectors. A support of 17.3 billion Riyals contributed to compensating for the salaries of the affected employees [7].
The early diagnosis of Coronavirus limits its spread around the world and helps to boost the recovery rate of infected patients. Currently, the diagnostic tool widely used is the Real-Time Reverse Transcription-Polymerase Chain Reaction (RT-PCR) test on respiratory specimens. However, the clinicians reported that this technique yields a low positive rate when conducted during the early stage of the infection. Moreover, the manual process required is tedious and laborious for the involved manpower. Furthermore, a high contamination risk holds for the medical staff in addition to a relatively long time required to release the test results. These limitations and disadvantages fostered the use of medical imaging as a promising alternative to positive COVID-19 case detection. Particularly, chest X-ray modalities have been introduced as less time consuming and more deployable diagnoses on a larger scale [8]. However, with the continuously increasing number of cases, the sanitary facilities as well as their staff are put under pressure, which limits their ability to “manually” diagnose such a huge number of patients [9]. Also, the accuracy of the diagnosis may be affected due to the lack of prior knowledge and experience related to the lung region being damaged by COVID-19 [8]. Machine Learning (ML) has been introduced as an option to automate the X-ray-based detection of positive COVID-19 cases and improve the overall recognition performance. Actually, ML based Computer Aided Diagnosis (CAD) system would provide an automatic, safe, fast, and more reliable solution for early detection of COVID-19 cases.
Nowadays, machine learning techniques, especially deep learning, are being used to address various problems in the medical field [10]. Particularly, they have been used in applications such as brain tumour detection [11], breast cancer detection [12], and pneumonia detection [13]. Lately, Convolutional Neural Networks (CNN) based solutions have been proposed to alleviate pneumonia and COVID-19 detection using chest X-ray images [8].
Despite the promising results achieved by the existing works, the typical limitations of CNN architectures are inherited by most the previous contributions. Specifically, their deep architectures are complex and need powerful computing resources. Therefore, it is difficult to embed the resulting CAD systems in medical equipment or smart devices. In this work, we intend to overcome these limitations by using lightweight EfficientNet. Specifically, the proposed approach aims at a finding trade-off between scaling down the deep network architecture to reduce the computational cost and optimizing the classification performance. In addition, due to the lack of data in the medical field, we need a lightweight architecture that has less learnable parameters to avoid overfitting problem. The proposed approach aims to build a CAD system for the classification of COVID-19 cases using X-ray images. Specifically, we design a lightweight EfficientNet inspired architecture. The designed network is intended to build a model able to automatically discriminate between positive and negative COVID-19 cases.
The rest of this manuscript is organized as follows: Section 2 depicts the related works relevant to image-based detection of positive COVID-19 cases. Section 3 outlines the proposed methods. The results are presented in Section 4. Moreover, a discussion of the obtained results is conducted in Section 5. Lastly, the conclusions and future work are presented in Section 6.
In this section, we review the recent studies that rely on end-to-end deep learning models, as well as the related works that use deep learning for feature extraction only.
2.1 End-to-End Architecture Based Solutions
The authors in [14] proposed a deep learning framework, called COVIDX-Net, to support radiologists in the diagnosis of COVID-19 using X-ray images. In particular, they used a small public dataset that included 50 X-ray images only. On the other hand, they investigated seven pre-trained models. Namely, they used VGG19 [15], DenseNet201 [16], InceptionV3 [17], ResNetV2 [18], InceptionResNetV2 [19], Xception [20], and MobileNetV2 [21]. It should be noted that VGG19 and DenseNet201 models yielded the highest accuracy. Similarly, the researchers in [22] introduced a deep learning-based solution for accurate discrimination between COVID-19, pneumonia, viral pneumonia, bacterial pneumonia, and healthy cases, using chest X-ray and CT images. Specifically, they applied transfer learning techniques to exploit AlexNet [23], ResNet [18,24], and GoogleNet [25], for automated features extraction. Besides, they divided the classificationi problem into: (i) Binary classification (i.e., COVID-19 vs. healthy, COVID-19 vs. bacterial pneumonia, and COVID-19 vs. viral pneumonia) and (ii) Multi-class classification including, either three classes (COVID-19, healthy and bacterial pneumonia) or four classes (COVID-19, healthy, bacterial, and viral pneumonia). In the experiments, MobileNet achieved an accuracy of 97.20% and 80.95% for the three-classes and four classes classification problems. On the other hand, the binary classification problem was addressed with an accuracy of 98.75% using ResNet. Further, other deep learning models for automatic detection of COVID-19 pneumonia using chest X-ray images were introduced in [10]. Particularly, transfer learning and data augmentation techniques were used to train and validate several pre-trained (CNNs). Specifically, the authors used eight different pre-trained CNN models: three of them were shallow networks, and the rest consisted of deep networks. The authors concluded that deep networks overtake shallow networks. Recently, [26] developed a model that uses chest X-ray images to automatically diagnose COVID-19. They formulated the detection problem as: (i) A binary classification (COVID vs. No-Findings) and (ii) A multi-class classification (COVID vs. No-Findings vs. Pneumonia) problem. They used the You Only Look Once (YOLO) [27] model that is typically used for real-time object detection. The experiments yielded a classification accuracy of 98.08% for the binary classification problem vs. 87.02% for the multi-class classification challenge.
2.2 Solutions Using Deep Learning for Features Extraction
The researchers in [28] outlined a method based on fusing and ranking deep model decisions along with an SVM classifier for the early detection of positive COVID-19 cases. For the experiments, they extracted two subsets of patches from 150 CT images. Each patch was divided into normal and positive COVID-19 cases. The outlined model achieved an accuracy of 98.27%. Similarly, the authors in [29] developed a CNN architecture that includes 15 layers to extract features from CT images in order to address the same classification problem. Specifically, the features were first extracted a global average pool and a fully connected layers, then fused into the max layer. Besides, a correntropy technique was also used to choose the most discriminative features. Finally, the selected features were fed into a One-Class Kernel ELM (OCK-ELM) [30] for the classification task. The experiments proved that this feature selection approach improved the classification accuracy from 89.2% to 95.1%. A framework to predict COVID-19 pneumonia from X-ray images was also introduced in [31]. The authors used a deep network for feature extraction, and deployed a ResNet152 [18] model along with a synthetic minority oversampling technique (SMOTE) intended to address an unbalanced dataset problem. Then, they investigated the performance of k-Nearest Neighbour (kNN), Decision Trees (DT), Random Forest (RF), and Adaptive Boosting (AdaBoost) when associated with the extracted features. The best results were obtained using the Random Forest (RF) classifier and the XGBoost (XGB) ensemble. The researchers in [32] outlined a hybrid system that combines deep learning techniques to detect COVID-19 symptoms in X-ray images. Specifically, they used three CNN models (i.e., AOCTNet [33], ShuffleNet [34], and MobileNet [35] and four classifiers (Softmax, SVM, k-Nearest Neighbor (kNN), and Random Forest (RF)) for this COVID-19 classification task based on chest X-ray images. The obtained accuracy, sensitivity, specificity, and precision exceeded 98%. Further, the authors in [36] introduced a new methodology based on analyzing X-ray images to detect COVID-19 pneumonia. They formulated the problem as three-classes classification problem. Namely, they considered COVID-19, pneumonia, and healthy categories. They adapted 13 deep network models for feature extraction and associated them with an SVM classifier. As a result, ResNet50 coupled with SVM overtook all the other models.
In this section we provide a description of the dataset used to build the proposed models. Then, we provide the system design and methodology as well as the network architectures proposed in this research.
3.1 Dataset Description and Pre-Processing
The dataset used in this work was collected by the researchers in [37]. In particular, it contains four classes. Namely these categories enclose positive COVID-19, negative COVID-19, viral pneumonia, and lung opacity cases. For the binary classification problem, 4000 images for the positive and negative COVID-19 classes were considered. To assess further the proposed models, a viral pneumonia class containing 1345 images, and a lung opacity class including 2000 images were added to address the multi-class classification problem. One should note that the resulting 7,345 grayscale images exhibit a resolution of 299 × 299 pixels. Fig. 1 shows samples from each class of the considered dataset.

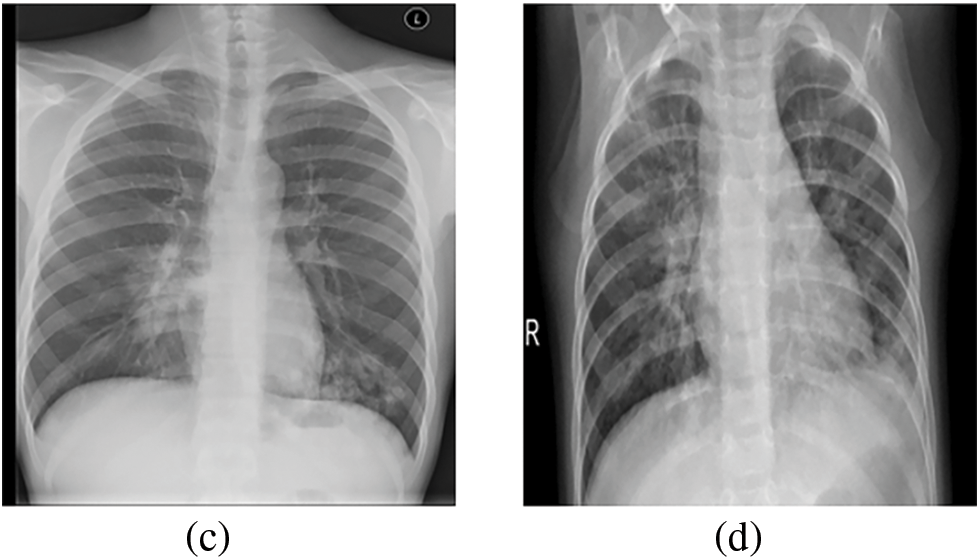
Figure 1: (a) Sample of positive COVID-19 images. (b) Sample of negative COVID-19 images. (c) Sample of lung opacity images. (d) Sample of viral pneumonia images
As pre-processing step, all images were converted to the RGB color space, and resized to 224 × 224 pixels in order to fulfill the input requirements of the lightweight EfficientNet models. Moreover, typical data augmentation techniques were deployed to address the data shortage and unbalance issues. Namely, image rotation, flipping, zooming, normalizing (scaling), and shearing were conducted on the training set images. Sample augmented images are shown in Fig. 2.

Figure 2: Samples augmented image instances
3.2 System Design and Methodology
The proposed system aims at classifying new chest X-ray images of patients by feeding them into lightweight EfficientNet models and mapping their visual features into the pre-defined COVID-19 classes. Fig. 3 overviews the proposed system. As it can be seen, the proposed models were trained using labeled instances. Then, during the testing phase, the learned models are fed with unseen chest X-ray images of patient under diagnosis. In particular, we investigated three architectures of lightweight EfficientNet. Namely, we adapted EfficientNet-elite-B9-V2, EfficientNet-elite-B9-V3 and EfficientNet-lite-B0 [38]. One should mention that EfficientNet-elite-B9-V2 and EfficientNet-elite-B9-V3 were trained from scratch, while the EfficientNet-lite-B0 [38] was pre-trained and fine-tuned using our X-ray image collection.
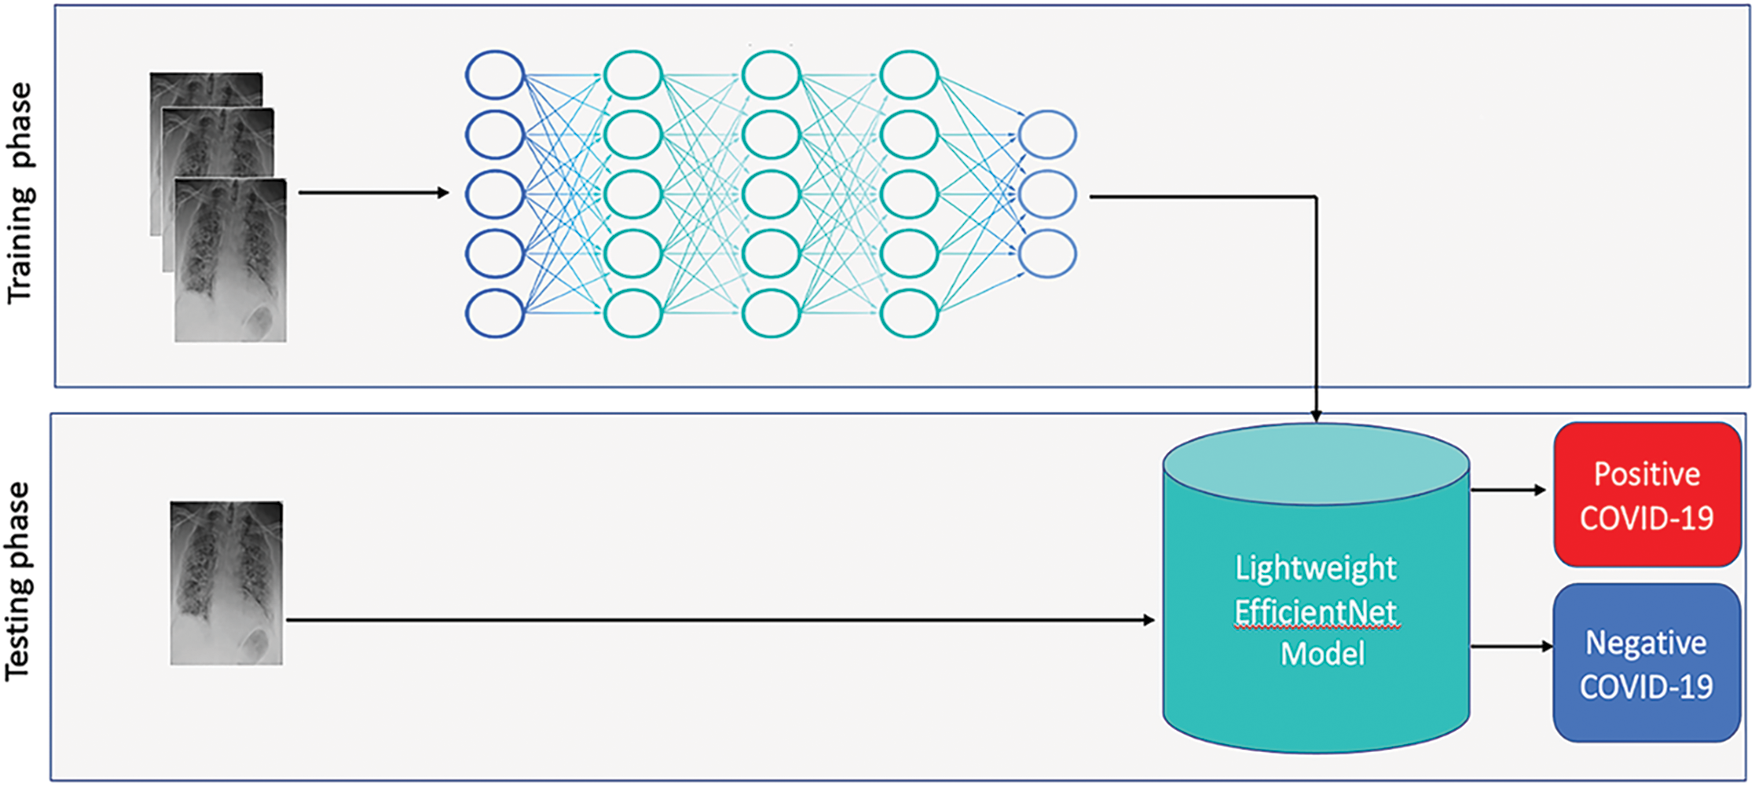
Figure 3: Overview of the proposed system
3.2.1 The Proposed EfficientNet-Elite-B9–V2
In fact, EfficientNet-elite-B9 [39] was obtained by scaling down the baseline model EfficientNet-B0 [38]. Specifically, the original network was scaled down in each stage s in terms of channels
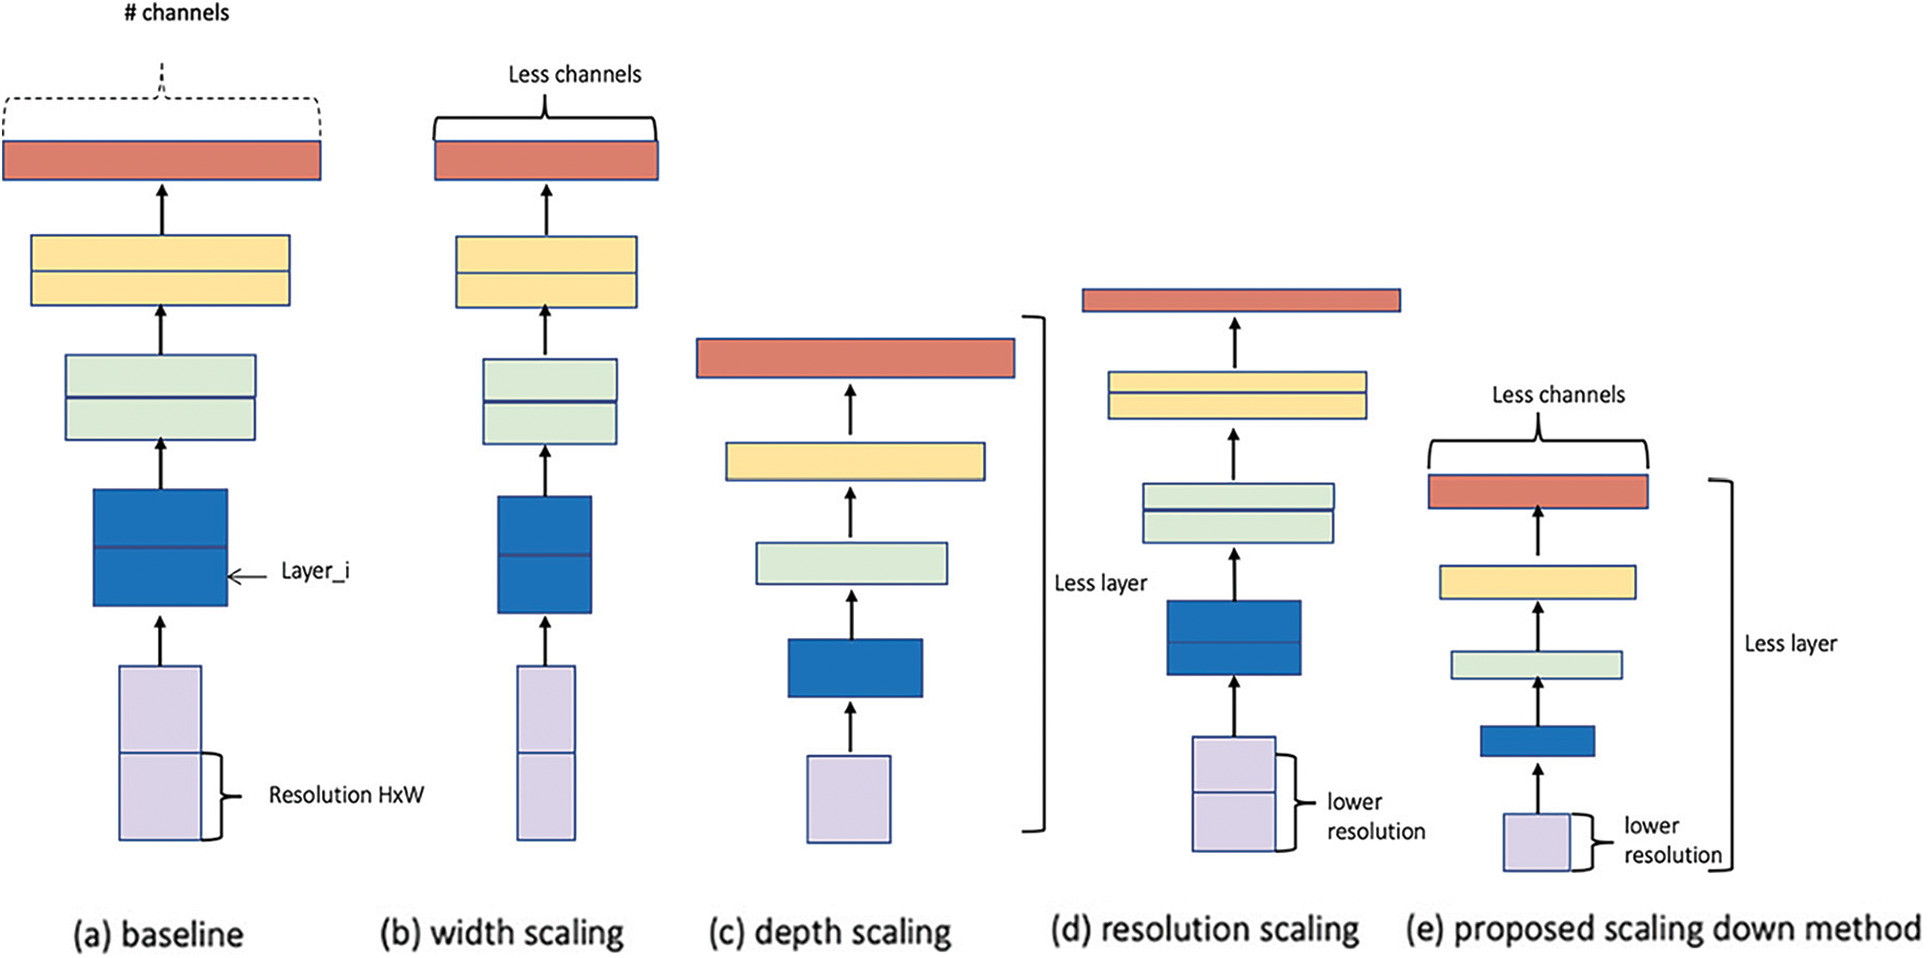
Figure 4: Model scaling (a) is a baseline model (EfficientNet-B0). (b), (c), and (d) are traditional scaling that only decrease one dimension of network width, depth, or resolution. (e) is scaling down method that uniformly scales down all three dimensions of the model with a fixed ratio
On the other hand, Fig. 5 shows EfficientNet-elite-B9-V2 architecture while Fig. 6 details its core building block, MBConv (mobile inverted bottleneck). As it can be seen in Fig. 5, EfficientNet-elite-B9-V2 has seven main MBConv blocks preceded by a
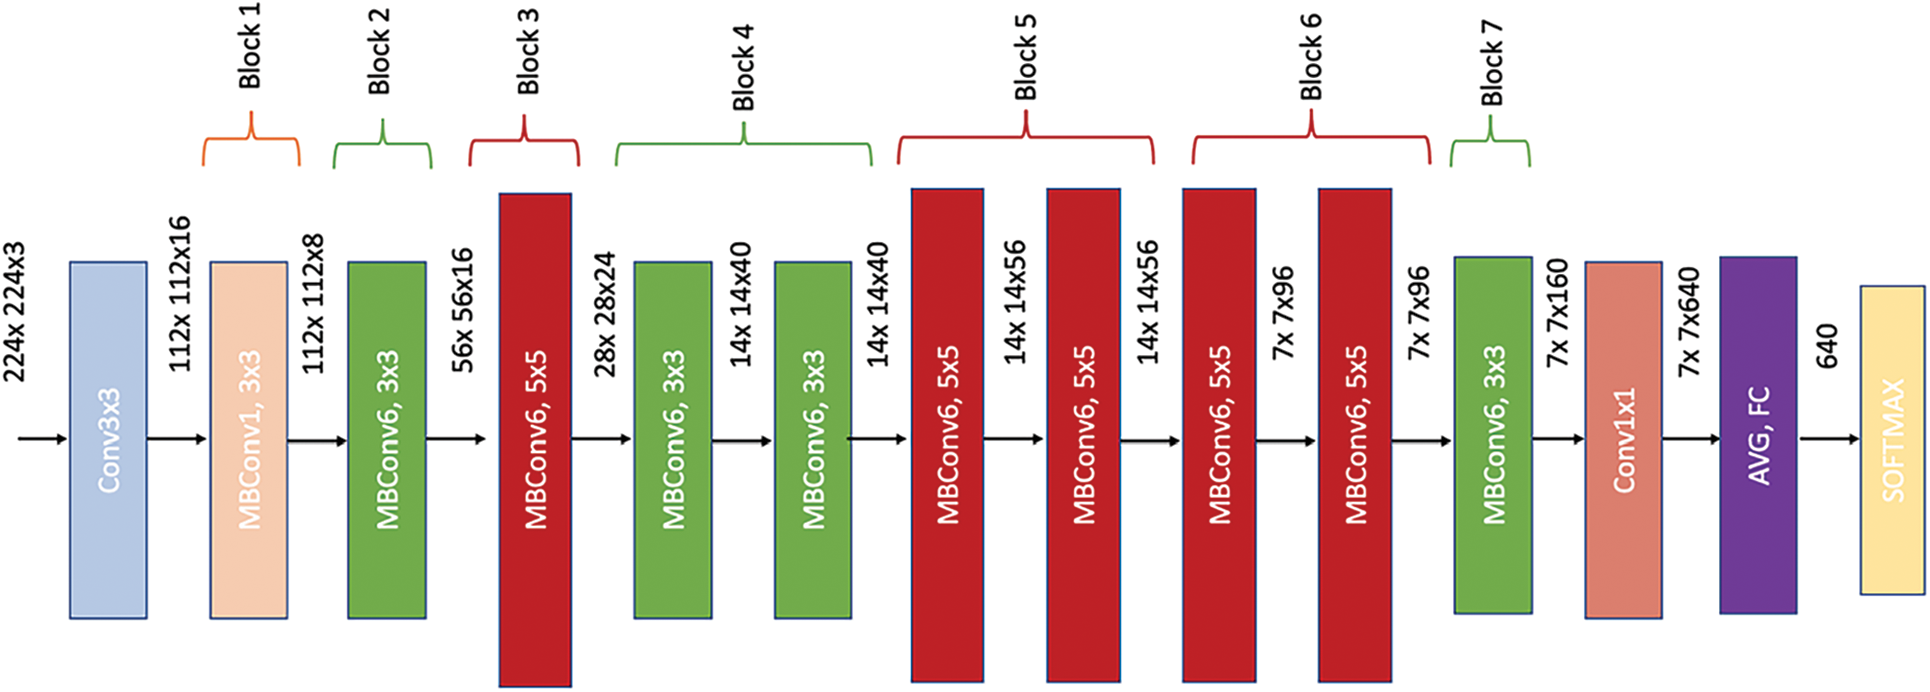
Figure 5: EfficientNet-elite-B9-V2 architecture
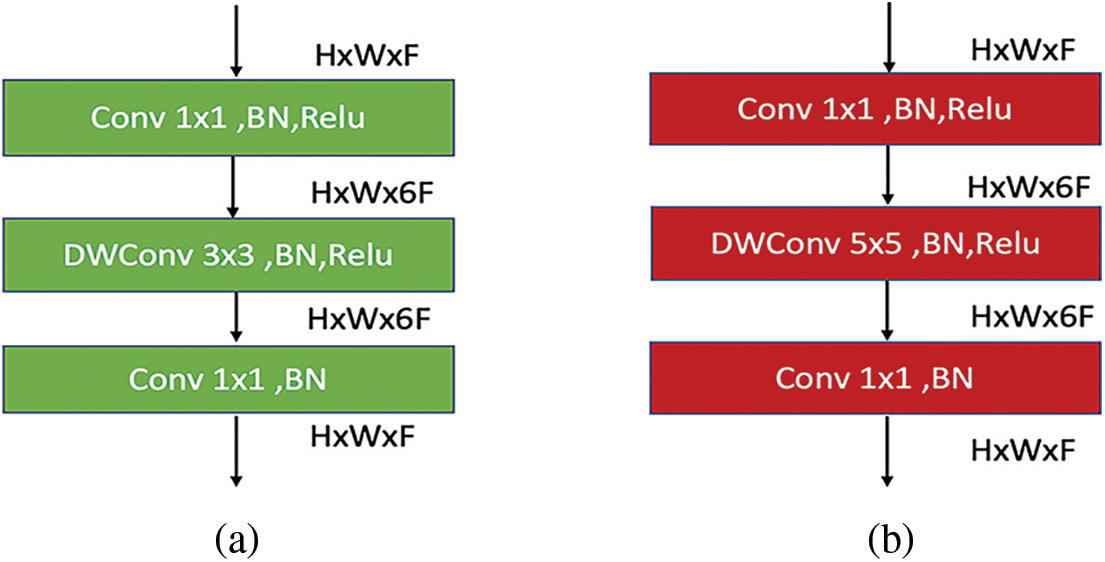
Figure 6: (a) MBConv6 (k 3 × 3) architecture for the first sub-block of main blocks 2, 4, and 7. (b) MBConv6 (k 5 × 5) architecture for the first sub-block of main blocks 3, 5, and 6
In particular, Fig. 6a depicts the MBConv of the first sub-block in the main blocks 2, 4, and 7. Similarly, Fig. 6b shows the MBConv of the first sub-block in the main blocks 3, 5, and 6. As one can see, MBConv block contains a
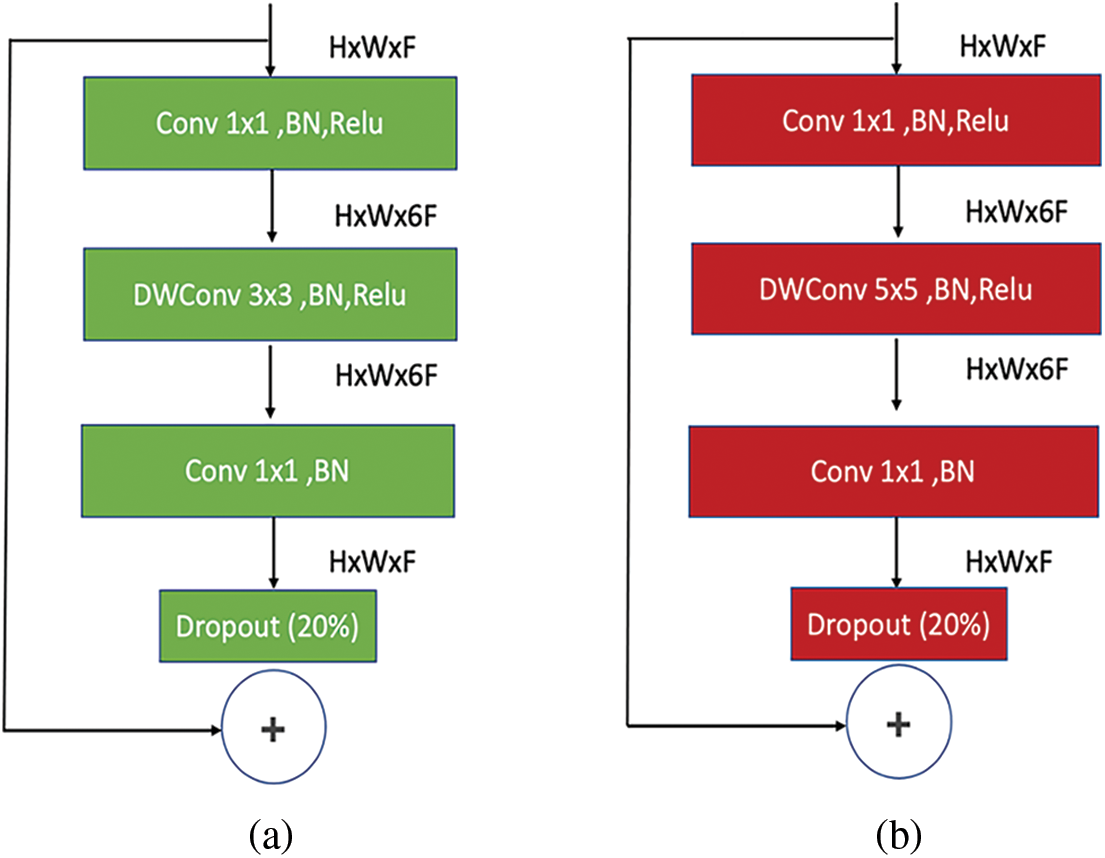
Figure 7: (a) MBConv6 (k 3 × 3) architecture for the remaining sub-block of main block 4. (b) MBConv6 (k 5 × 5) architecture for the remaining sub-blocks of main blocks 5 and 6
One should note that the MBConv1 contains a
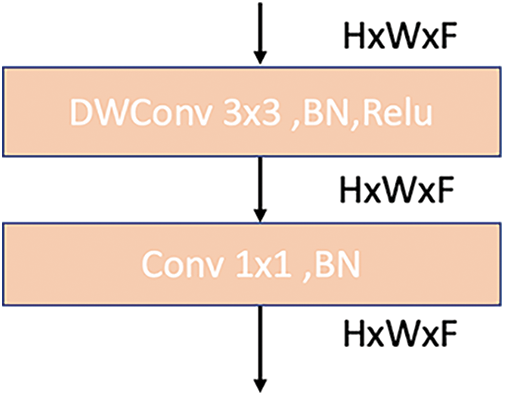
Figure 8: MBConv1 architecture
In this research, we designed another version of EfficientNet-elite-B9-V2, called EfficientNet-elite-B9-V3, that includes a larger number of sub-blocks. Particularly, the depths of the main blocks 1, 2, and 3 are set to 3 while the depth of main blocks 4, 5, and 6 are set to 6. Besides, the depth of main block 7 is set to 4, as presented in Table 1. This yielded 1.2 M learnable parameters.

3.2.2 The Proposed EfficientNet-lite-B0
EfficientNet-lite-B0 is a lightweight version of EfficientNet that has been pre-trained on ImageNet [40] dataset. This version is a modification of the baseline model, EfficientNet-B0, that does not contain squeeze-and-excite (SE) module and uses Relu6 in the hidden layer. EfficientNet-lite-B0 encloses the same number of layers and the same number of channels as the baseline model, EfficientNet-B0. However, it contains less learnable parameters with a total of 3.5 M. Fig. 9 reports EfficientNet-lite-B0 architecture.
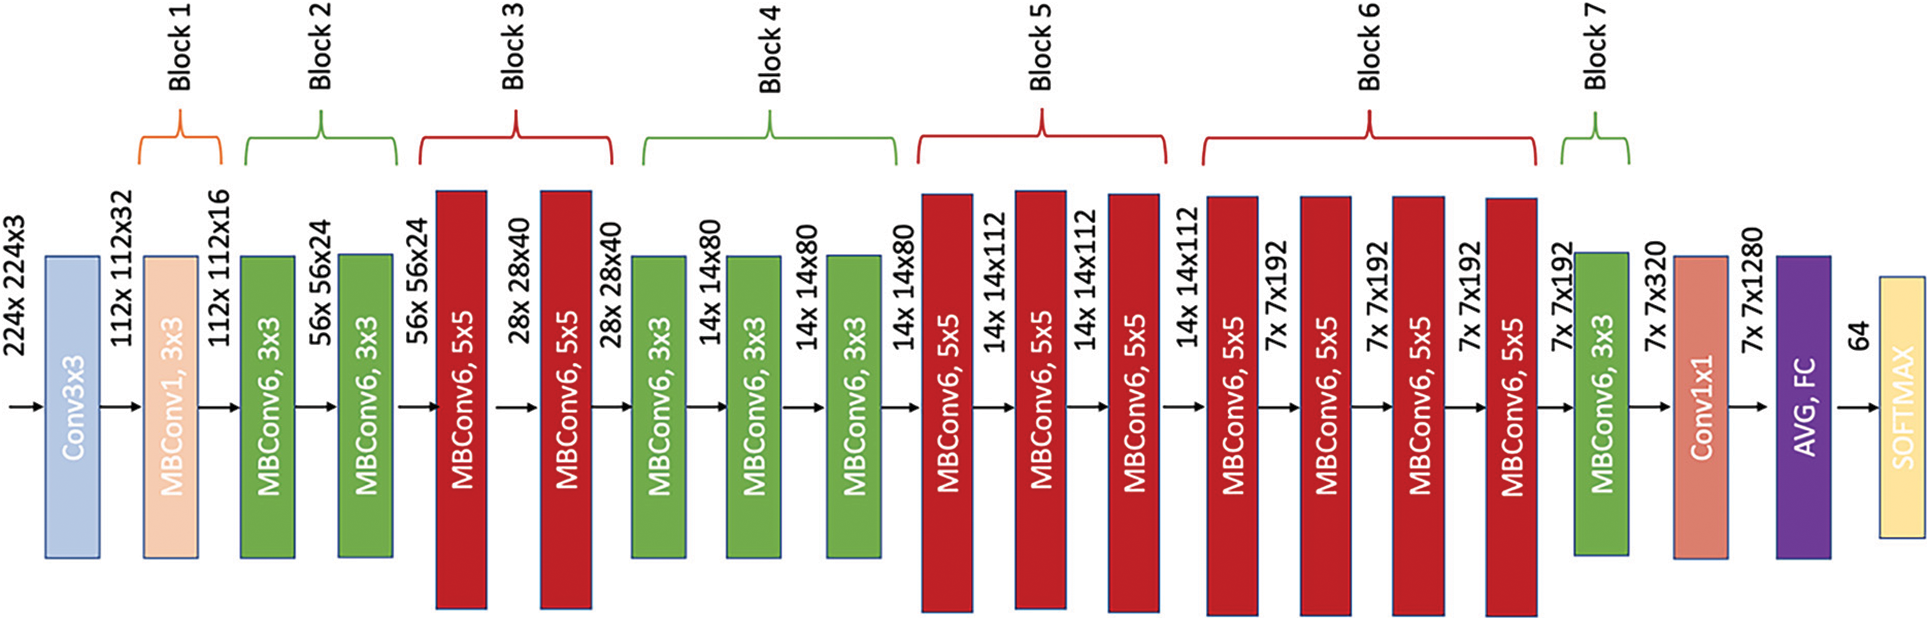
Figure 9: EfficientNet-lite-B0 architecture
Actually, the architecture of EfficientNet-lite-B0 is similar to EfficientNet-elite-B9-V2 architecture but with an extra number of sub-blocks and with a zero-padding layer in each first sub-block of the main blocks. Also, it differs from EfficientNet-elite-B9-V2 in terms of channels. The channels in EfficientNet-lite-B0 are wider than those in EfficientNet-elite-B9-V2. Fig. 10a displays the first sub-block architecture in the main blocks 2 and 4. On the other hand, Fig. 10b shows the first sub-block of the main blocks 3 and 6. Note that the first sub-block of the main block 5 is similar to the one in the main blocks 3 and 6 but with no zero-padding layer. Similarly, the main block 7 is similar to the first sub-block of the main blocks 2 and 4 but with no zero-padding layer. The architecture of the remaining sub-blocks of the main blocks 2 to 6 is identical to the architecture of the remaining sub-blocks in the EfficientNet-elite-B9-V2. Also, the architectures of the main block 1 in EfficientNet-elite-B9-V2 and EfficientNet-lite-B0 are identical.
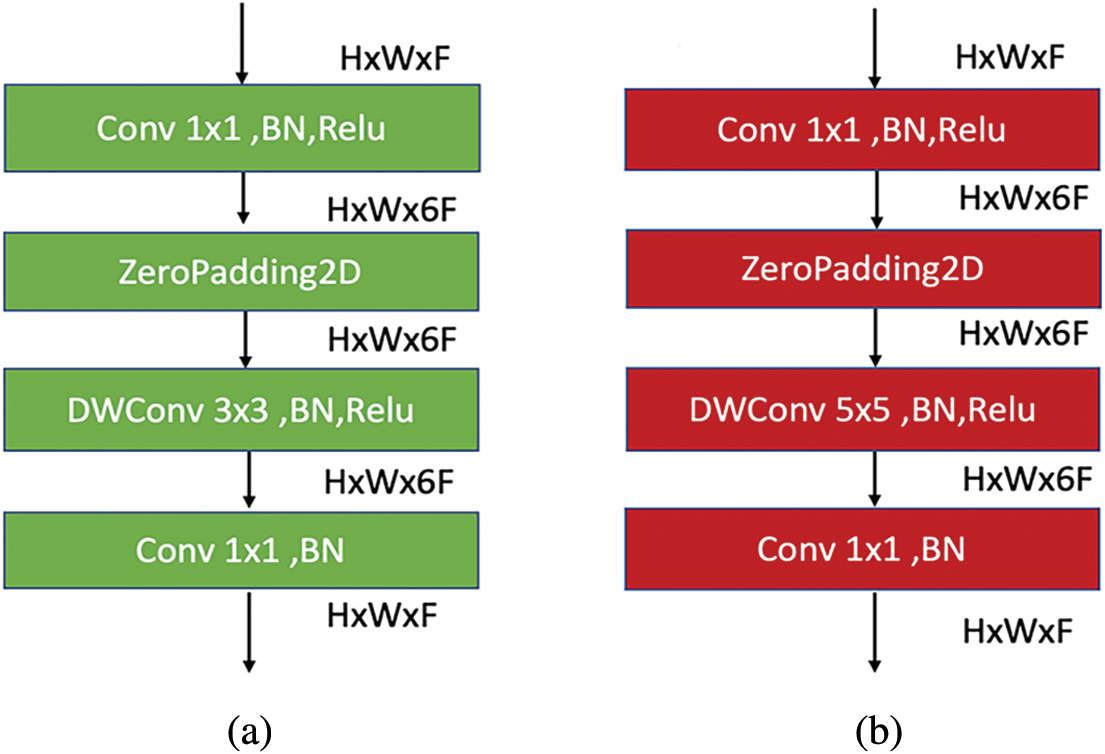
Figure 10: (a) MBConv6 (k 3 × 3) architecture for the first sub-block of main blocks 2 and 4. (b) MBConv6 (k 5 × 5) architecture for the first sub-block of main blocks 3 and 6
In our experiments, we considered a training/validation/testing holdout split strategy. Note that we divided the dataset into three different sets: 60% for training, 20% for validation, and 20% for testing when using the training/validation/test split.
4.1 Binary Classification Results
Table 2 reports the results obtained using the proposed models for the binary classification problem. Specifically, the performance measure attainments are reported for the validation and the testing phases. In order to fine-tune the considered models, we investigated different settings for the relevant hyper-parameters. Particularly, we used two types of optimizers: (i) Adam and (ii) RSMprop. As it can be seen in Fig. 11, Adam yielded the best performance when associated with EfficientNet-lite-B0 and EfficientNet-elite-B9-V2. On the other hand, RSMprop performed best with EfficientNet-elite-B9-V3.

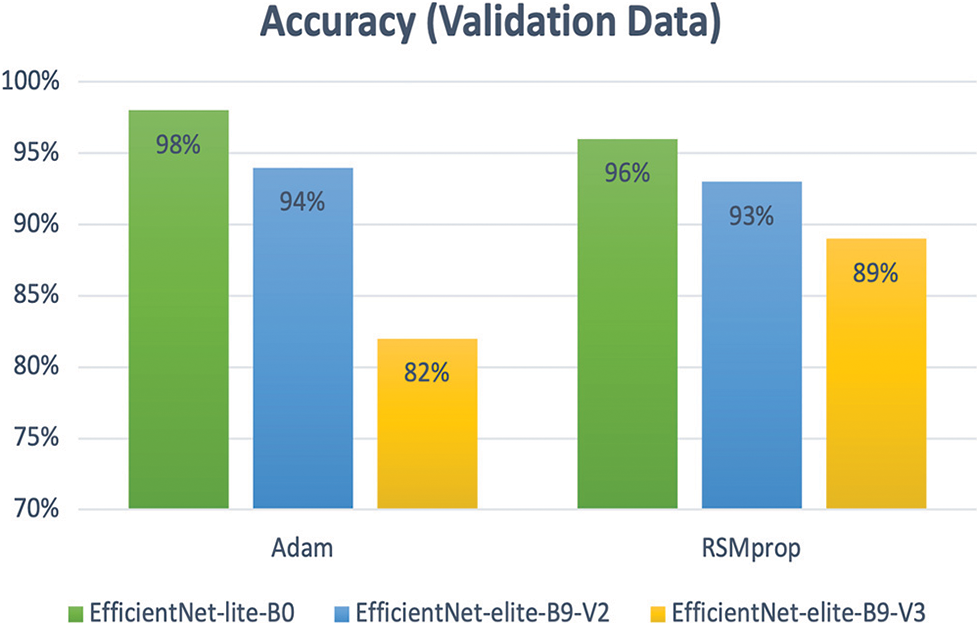
Figure 11: The accuracy of Adam and RSMprop optimizers for all proposed models of binary classification
Regarding the use of data augmentation techniques, Fig. 12 proves that data augmentation increased the accuracy of EfficientNet-elite-B9-V2 and EfficientNet-elite-B9-V3. On the other hand, it reduced the performance of EfficientNet-lite-B0.

Figure 12: The accuracy of applying image data augmentation for all proposed models of binary classification
EfficientNet-lite-B0 and EfficientNet-elite-B9-V2 achieved higher accuracy when using a batch of size 16 while EfficientNet-elite-B9-V3 achieved a higher accuracy when using a batch of size 64. Besides, L2 regularization was applied for all proposed models, and it improved the accuracy of EfficientNet-lite-B0 and EfficientNet-elite-B9-V3 from 98% to 99%, and from 89% to 93%, respectively. At last, regarding the learning rate value, we initially set the learning rate to 0.0001, and it we reduced it automatically when the loss function stops improving. As shown in Table 3, the architecture of EfficientNet-elite-B9-V2 that yielded the best performance, does not associate a zero-padding layer with the first sub-blocks of the main blocks and without Squeeze-and-Excite (SE) block. Besides, a Relu6 is associated with the hidden layers.

4.2 Multi-Class Classification Results
To further evaluate EfficientNet-lite-B0, we experimented it to address a multi-class classification problem. Specifically, we considered two more classes: (i) Viral pneumonia, and (ii) Lung opacity, in addition to the typical classes: (iii) positive COVID-19, and (iv) negative COVID-19. Table 4 reports the validation and the testing results obtained EfficientNet-lite-B0. As one can see, EfficientNet-lite-B0 reached the highest performance after 35 epochs with 138 steps in each epoch.

In the following, we present samples classification results achieved using EfficientNet-lite-B0 and EfficientNet-elite-B9-V2. Fig. 13 reports sample images, correctly and incorrectly classified by EfficientNet-lite-B0 in the context of binary classification. Similarly, Fig. 14 presents sample cases classified using EfficientNet-elite-B9-V2 in the context of binary classification. Lastly, Fig. 15 shows sample classification cases obtained using EfficientNet-lite-B0 in the context of multi-class classification.
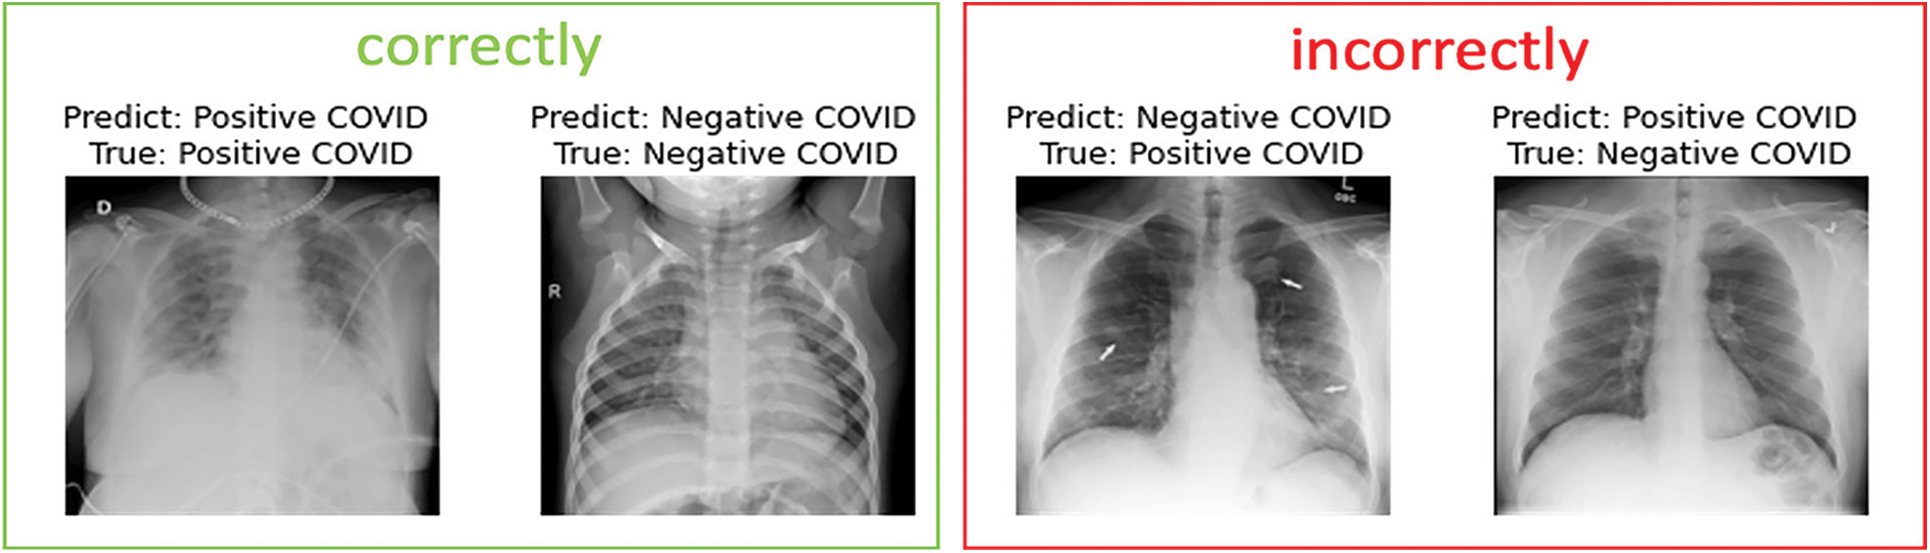
Figure 13: Sample images of the EfficientNet-lite-B0 predicted for binary classification
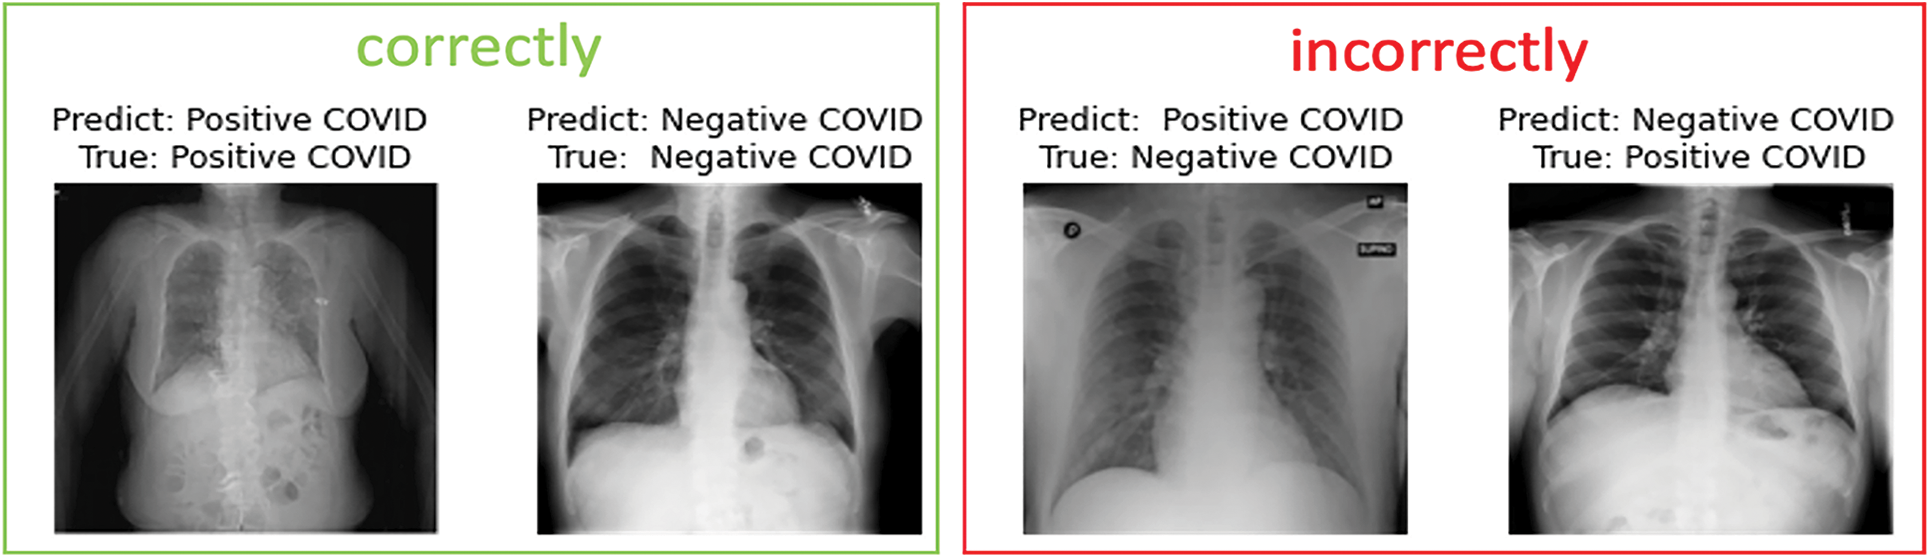
Figure 14: Sample images of the EfficientNet-elite-B9-V2 predicted for binary classification
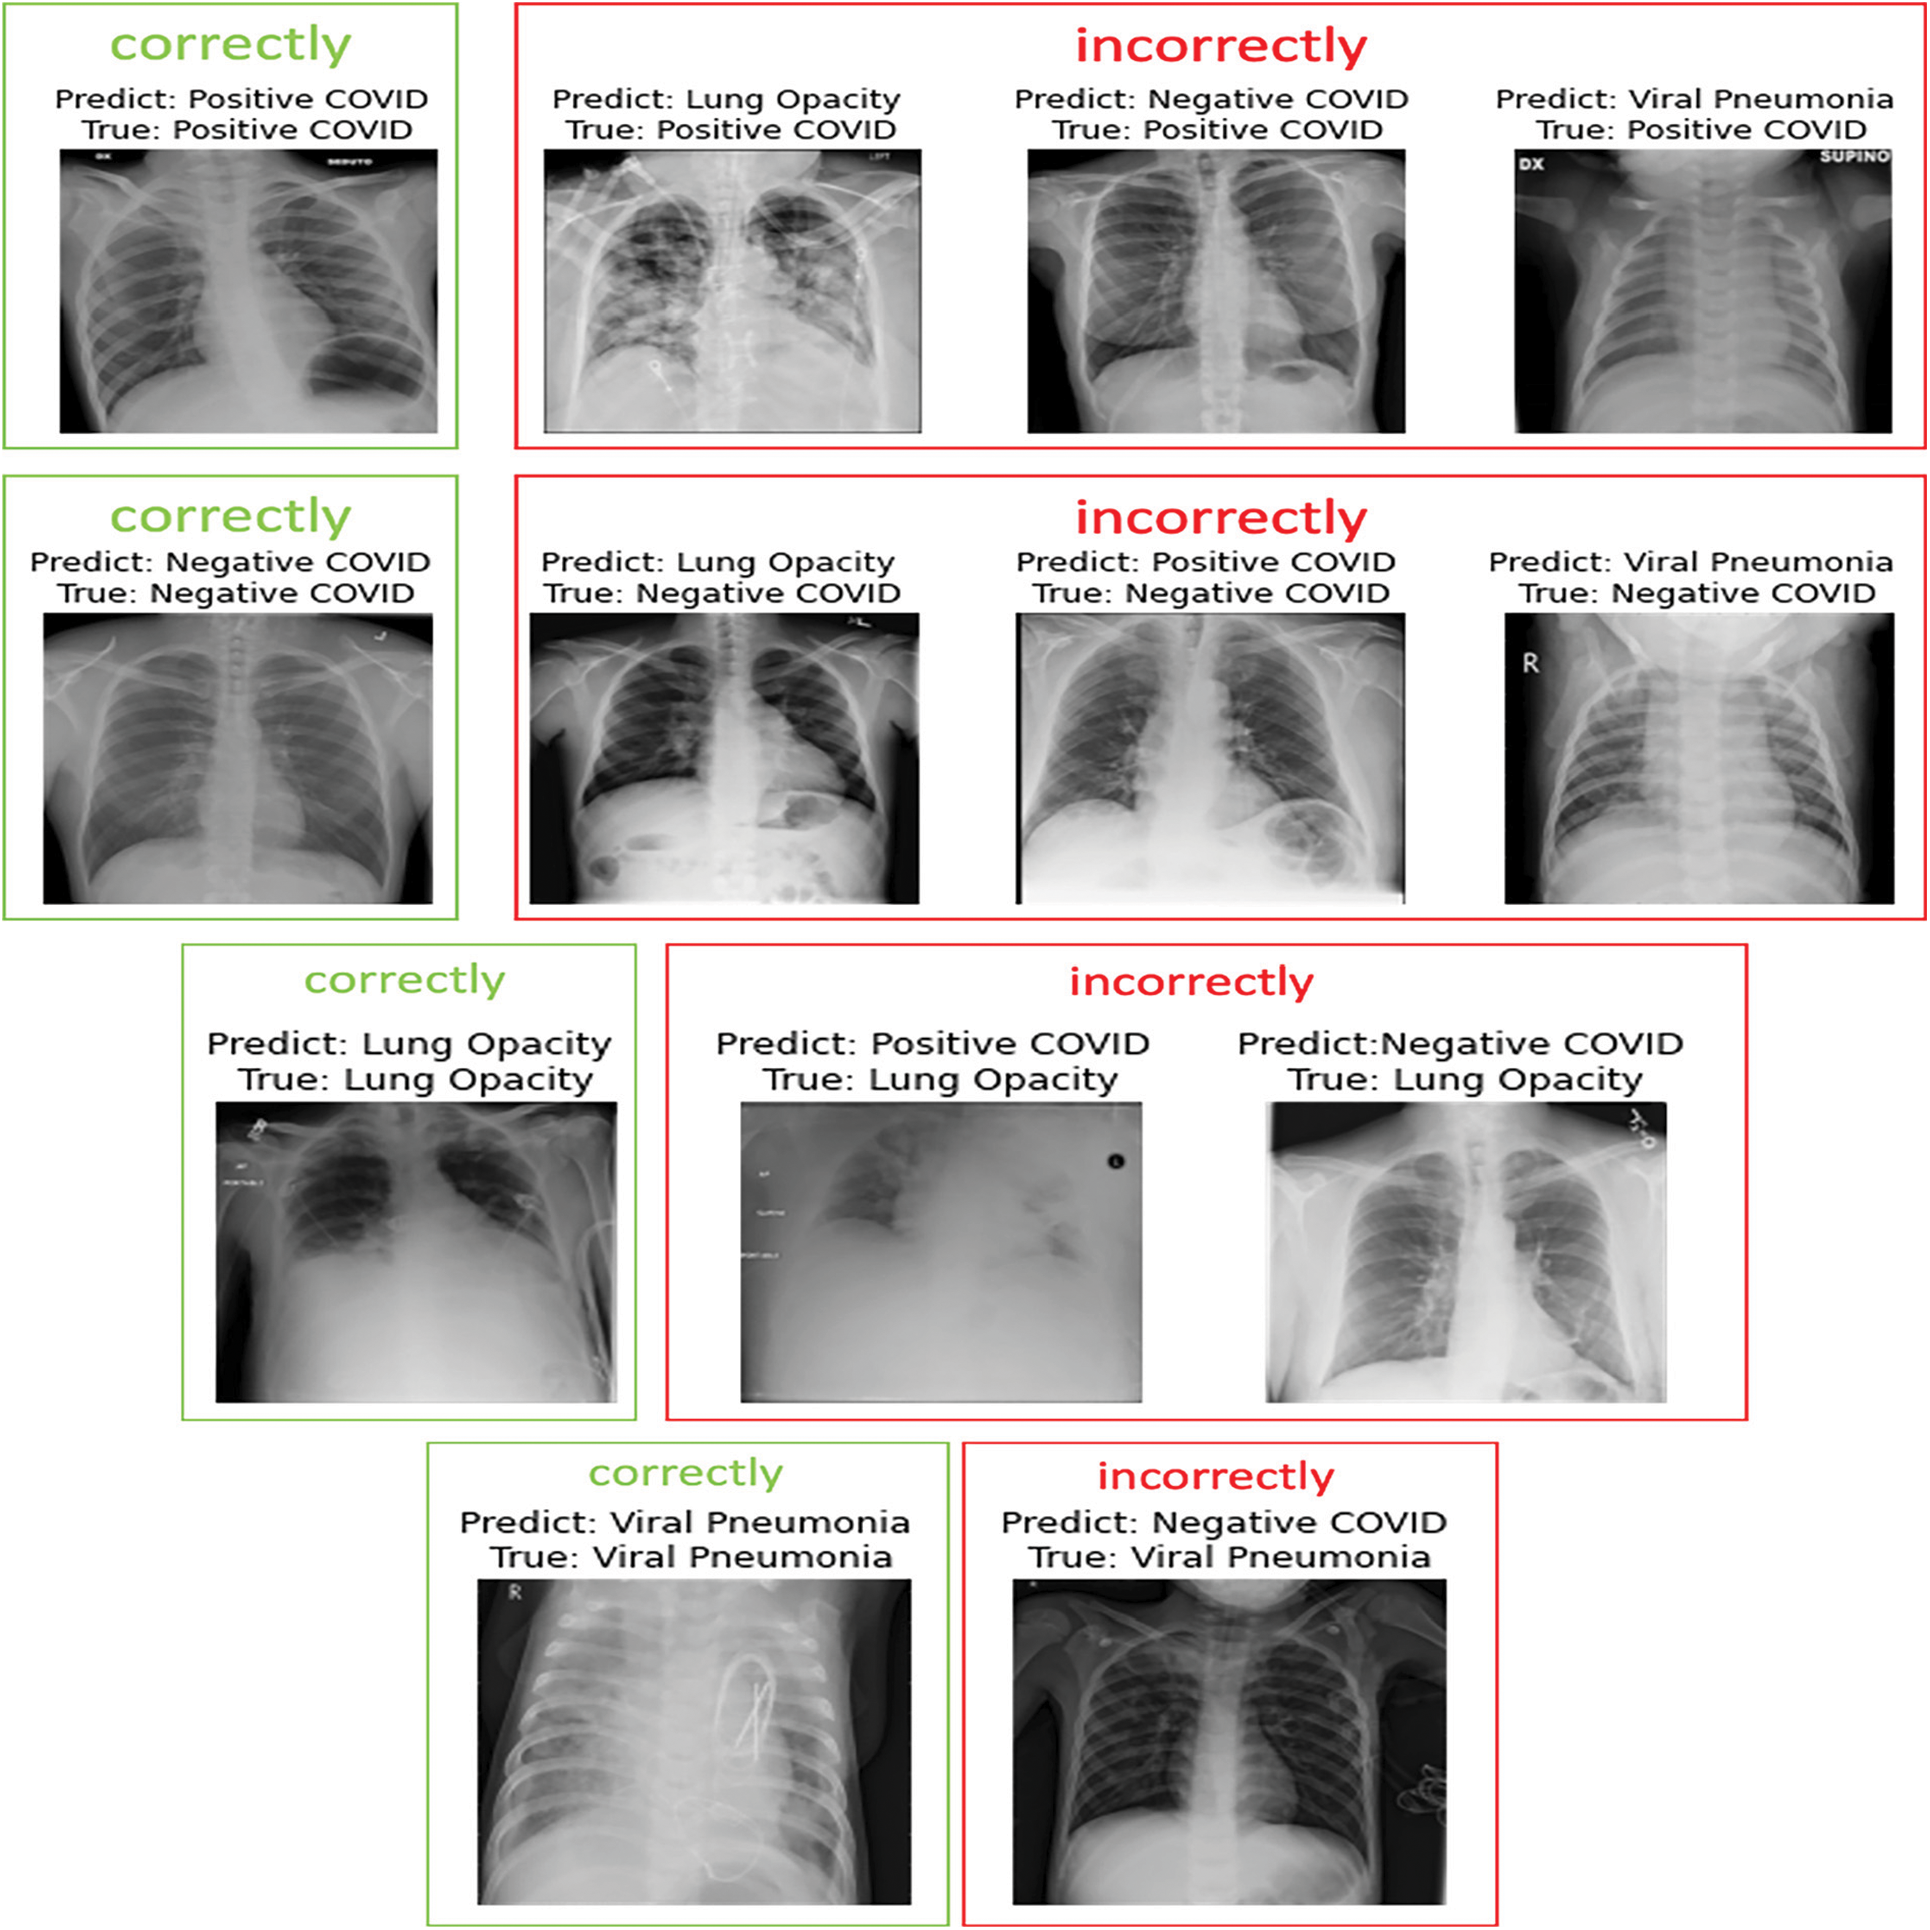
Figure 15: Sample images of the EfficientNet-lite-B0 predicted for multi-class classification
As reported in Table 2 above, the results obtained using the considered models for the binary classification proved that EfficientNet-lite-B0 outperformed the other models in terms of accuracy, precision, sensitivity, specificity, F1-measure, and AUC. This can be attributed to the fact that EfficientNet-lite-B0 was pre-trained using ImageNet [40] dataset. On the other hand, EfficientNet-elite-B9-V2 and EfficientNet-elite-B9-V3 were trained from scratch. Thus, for the latter models, one can claim that more data may be required to achieve higher performance. Note that EfficientNet-elite-B9-V2 yielded pretty high performance with less number of parameters compared to EfficientNet-elite-B9-V3 which is deeper. Specifically, EfficientNet-elite-B9-V2 achieved an accuracy of 96% with a total number of parameters equal to 751,938 while EfficientNet-elite-B9-V3 achieved an accuracy of 92% with 1.2 M learnable parameters. besides, EfficientNet-lite-B0 attained its top performance after 49 epochs with 160 steps in each epoch. This took forty-two minutes for training, while EfficientNet-elite-B9-V2 achieved its highest performance after 300 epochs with 160 steps in each epoch, in two hours and forty-three minutes for training. On the other hand, EfficientNet-elite-B9-V3 reached its highest performance after 350 epochs with 40 steps in each epoch. The recorded training time was four hours and twenty-two minutes. Since we used a balanced dataset for the binary classification problem, the values of the accuracy and F1-score were also consistent as shown in Table 2. In summary, EfficientNet-lite-B0 overtook EfficientNet-elite-B9-V2 and EfficientNet-elite-B9-V3 in terms of typical performance measures and training time.
In this research, the problem consists in diagnosing COVID-19 patients. Therefore, the sensitivity attainment is critical compared to the precision. Fig. 16 shows the confusion matrices obtained using the proposed models during the testing phase of the binary classification. As it can be seen, EfficientNet-lite-B0 outperformed EfficientNet-elite-B9-V2 in terms of sensitivity and precision. In particular, EfficientNet-lite-B0 misclassified five positive cases (FN = 5) and three negative cases (FP = 3) while EfficientNet-elite-B9-V2 misclassified eighteen positive cases (FN = 18) and fourteen negative cases (FP = 14) out of 800 testing instances. Further, EfficientNet-elite-B9-V2 overtook EfficientNet-elite-B9-V3 in terms of sensitivity and precision. In addition, the ROC curves in Fig. 17 show clearly that EfficientNet-lite-B0 performed better than EfficientNet-elite-B9-V2 and EfficientNet-elite-B9-V3.
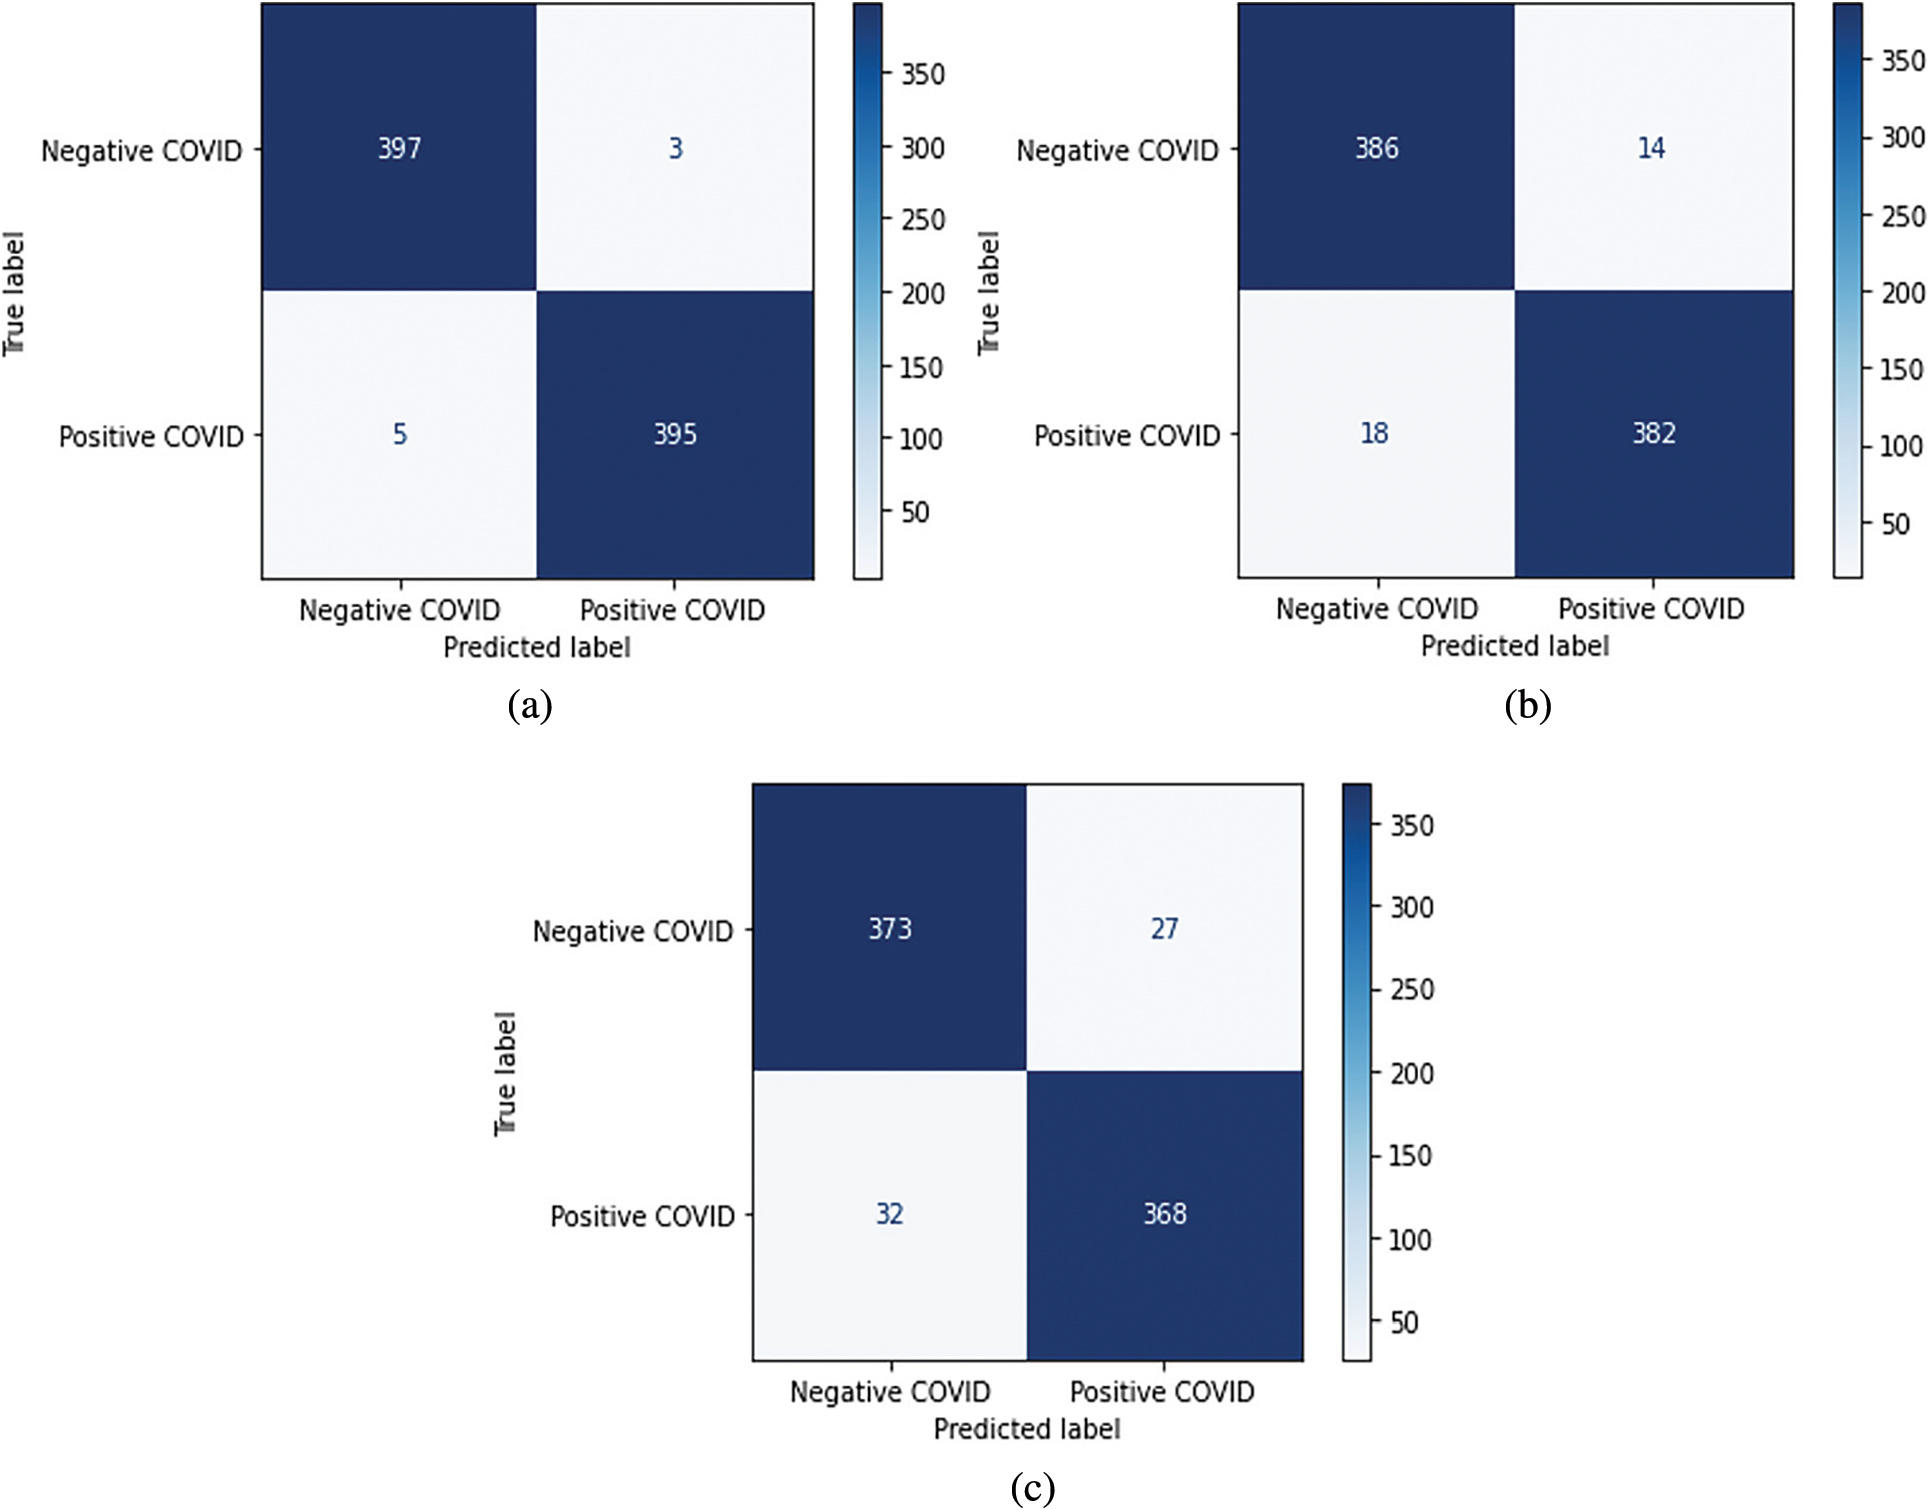
Figure 16: Confusion matrices of the binary classification (a) The EfficientNet-lite-B0. (b) The EfficientNet-elite-B9-V2. (c) The EfficientNet-elite-B9-V3
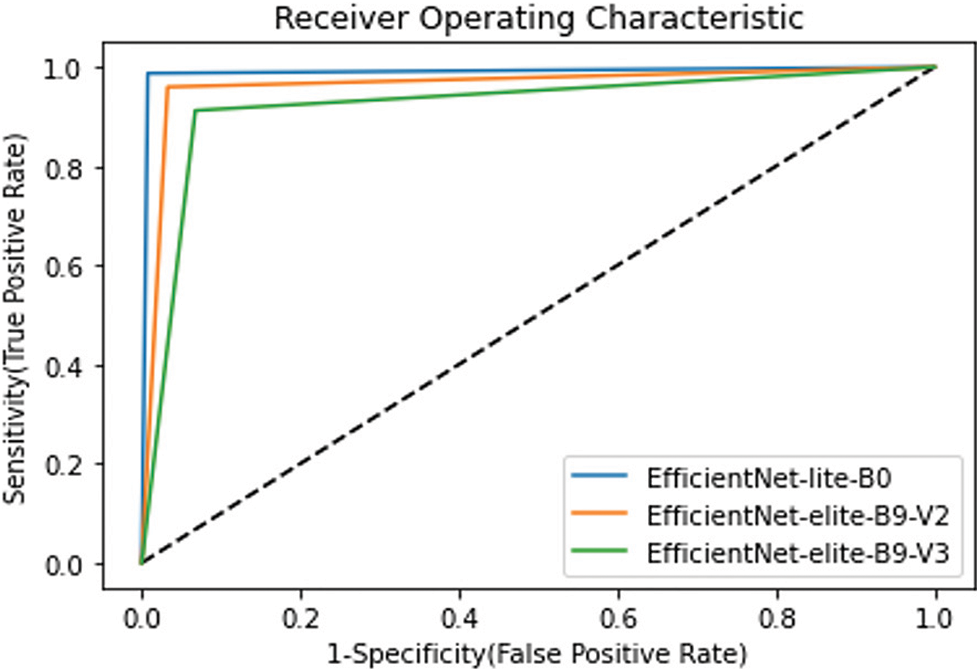
Figure 17: ROC curves for all proposed models
For the multi-class classification problem, Fig. 18 presents the confusion matrix obtained using EfficientNet-lite-B0. As one can see in Fig. 19, the positive COVID-19 class has the highest precision, sensitivity, and F1-score. Whereas for binary classification the positive COVID-19 and the negative COVID-19 classes achieved the same precision, sensitivity, and F1-score (99%) as shown in Fig. 20.
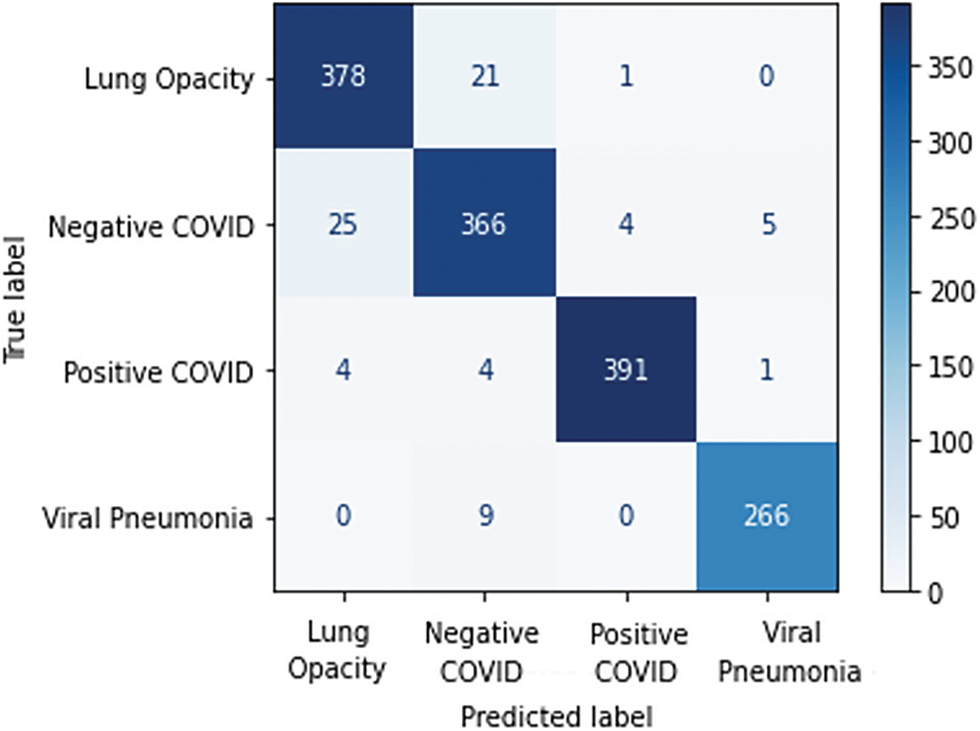
Figure 18: The EfficientNet-lite-B0 confusion matrix of the multi-class classification
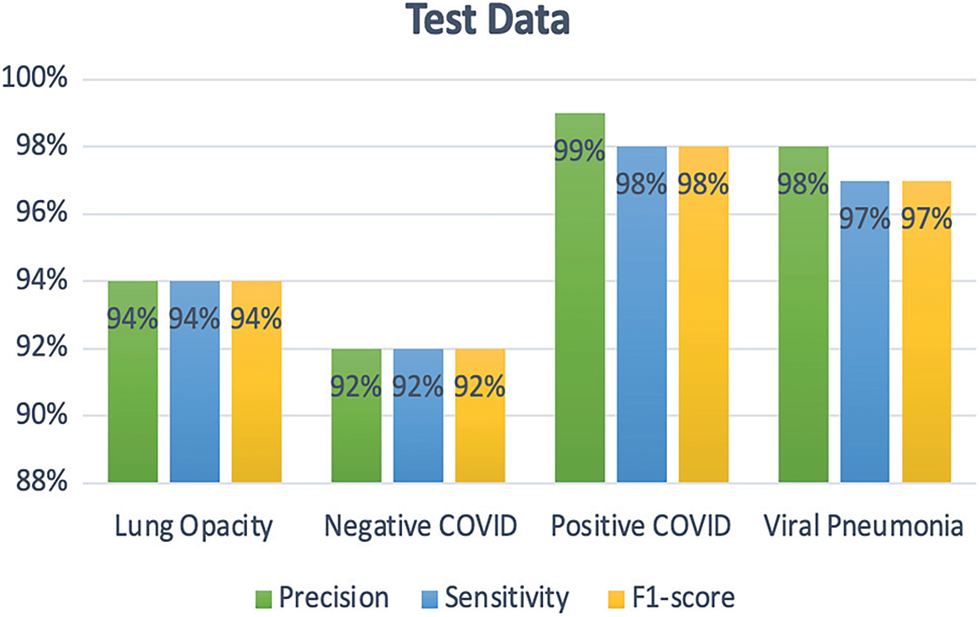
Figure 19: Precision, sensitivity, and F1-score for each class of multi-class classification
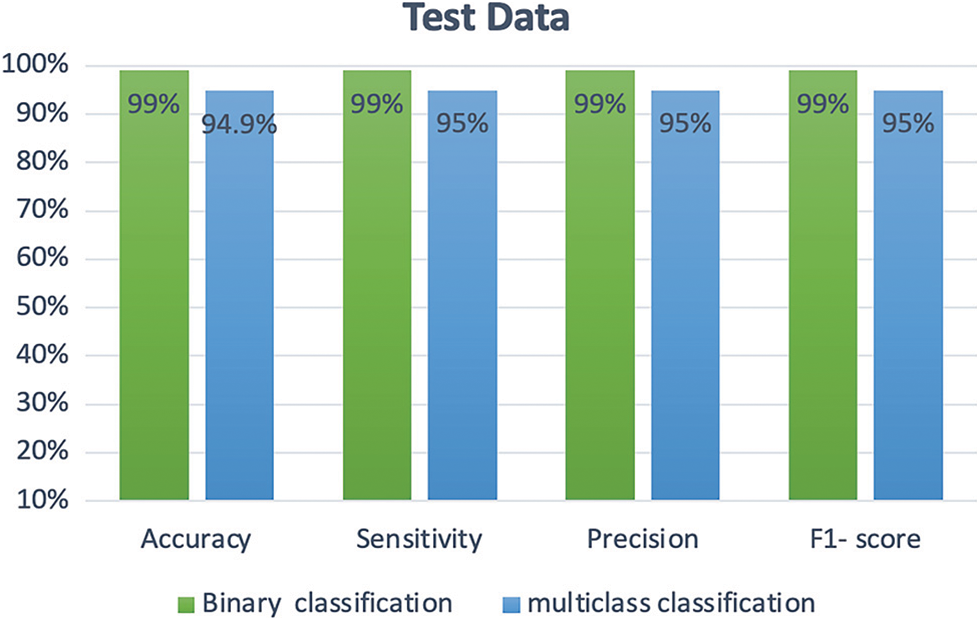
Figure 20: Comparison between the performance of binary and multi-class classification of EfficientNet-lite-B0
One can conclude based on Fig. 20 that the performance of EfficientNet-lite-B0 in addressing the binary classification problem is better than its performance when dealing with multi-class classification. Note that both models took approximately 40 min for training.
Additionally, as reported in Table 5, we compared the performance of best proposed model with relevant existing works in addressing the binary classification problem. As it can be seen, the proposed model yielded a better performance than the works in [22,26].

Table 6 depicts a comparison of the state-of-art models regarding the multi-class classification. As it can be seen, the proposed model outperformed the works in [22,26].

Unfortunately, the world is still struggling with COVID-19 pandemic. Many countries have made their utmost efforts to combat the spread of COVID-19. Early diagnosis is one of the ways to limit the spread of the COVID-19. The current diagnostic tools cannot detect disease in the early stages and requires a manual process in the laboratory. This also carries the risk of contamination and infection of medical staff. Therefore, medical imaging has been used as an alternative method to the early diagnosis of COVID-19. However, all previous approaches that used medical imaging to detect COVID-19 have limitations that are complex and heavy due to having a high computational cost, which causes it to be difficult to embedded in the medical devices.
Therefore, in this work, we built lightweight EfficientNet models using chest X-ray images divided into four classes positive COVID-19, negative COVID-19, viral pneumonia, and lung opacity. The proposed models are characterized by small number of parameters and high accuracy. Particularly, EfficientNet-lite-B0 contains 3.5 M learnable parameters and achieved an accuracy of 99% and 95% for binary and multi-class classification, respectively. Moreover, in binary classification, EfficientNet-elite-B9-V2, with a total of 751,938 parameters, yielded an accuracy of 96%. As for EfficientNet-elite-B9-V3 which requires 1.2 M learnable parameters achieved an accuracy of 92%.
As future works, we plan to collect a larger dataset in order to ensure a better generalization of EfficientNet-elite-B9-V2 model. Also, another research direction consists in designing a model able to localizing the regions of the lungs affected by COVID-19, in addition to the classification task.
Acknowledgement: This work was supported by the Research Center of the College of Computer and Information Sciences at King Saud University. The authors are grateful for this support.
Funding Statement: The authors received no specific funding for this study.
Conflicts of Interest: The authors declare that they have no conflicts of interest to report regarding the present study.
References
1. Y. Chen, Q. Liu and D. Guo, “Emerging coronaviruses: Genome structure, replication, and pathogenesis,” Journal of Medical Virology, vol. 92, no. 4, pp. 418–423, 2020. [Google Scholar]
2. C. Sohrabi, Z. Alsafi, N. O’Neill, M. Khan, A. Kerwan et al., “World health organization declares global emergency: A review of the 2019 novel coronavirus (COVID-19),” International Journal of Surgery (London, England), vol. 76, pp. 71–76, 2020. [Google Scholar]
3. “WHO coronavirus disease (COVID-19) dashboard,” Who.int. [Online]. Available: https://covid19.who.int/. (accessed on 26 Jan 2022). [Google Scholar]
4. “WHO Director-general’s opening remarks at the media briefing on COVID-19-11 March 2020,” Who.int. [Online]. Available: https://www.who.int/director-general/speeches/detail/who-director-general-s-opening-remarks-at-the-media-briefing-on-covid-19---11-march-2020. (accessed on 28 Jan 2021). [Google Scholar]
5. “COVID 19 dashboard: Saudi Arabia,” Gov.sa. [Online]. Available: https://covid19.moh.gov.sa. (accessed on 27 Jan 2022). [Google Scholar]
6. “General/Suspension of studies in all public, private, university and technical education schools in Saudi Arabia, from Monday, March 9 until further,” Gov.sa. [Online]. Available: https://www.spa.gov.sa/2044433. (accessed on 03 Feb 2021). [Google Scholar]
7. “Report/Ministry of human resources and social development. The Saudi Arabia has provided great support to the private sector and its workers during the coronavirus pandemic,” Gov.sa. [Online]. Available: https://www.spa.gov.sa/2109207. (accessed on 03 Feb 2021). [Google Scholar]
8. S. R. Nayak, D. R. Nayak, U. Sinha, V. Arora and R. B. Pachori, “Application of deep learning techniques for detection of COVID-19 cases using chest X-ray images: A comprehensive study,” Biomedical Signal Processing and Control, vol. 64, no. 102365, pp. 102365, 2021. [Google Scholar]
9. H. S. Maghdid, A. T. Asaad, K. Z. Ghafoor, A. S. Sadiq and M. K. Khan, “Diagnosing COVID-19 pneumonia from X-ray and CT images using deep learning and transfer learning algorithms,” in Multimodal Image Exploitation and Learning, Online Only, United States, SPIE, pp. 99–110, 2021. [Google Scholar]
10. M. E. H. Chowdhury, R. Tawsifur, A. Khandakar, R. Mazhar, M. A. Kadir et al., “Can AI help in screening viral and COVID-19 pneumonia?,” IEEE Access: Practical Innovations, Open Solutions, vol. 8, pp. 132665–132676, 2020. [Google Scholar]
11. S. Sajid, S. Hussain and A. Sarwar, “Brain tumor detection and segmentation in MR images using deep learning,” Arabian Journal for Science and Engineering, vol. 44, no. 11, pp. 9249–9261, 2019. [Google Scholar]
12. Z. Wang, M. Li, H. Wang, H. Jiang, Y. Yao et al., “Breast cancer detection using extreme learning machine based on feature fusion with CNN deep features,” IEEE Access: Practical Innovations, Open Solutions, vol. 7, pp. 105146–105158, 2019. [Google Scholar]
13. N. Dey, Y. -D. Zhang, V. Rajinikanth, R. Pugalenthi and N. S. M. Raja, “Customized VGG19 architecture for pneumonia detection in chest X-rays,” Pattern Recognition Letters, vol. 143, pp. 67–74, 2021. [Google Scholar]
14. E. E. -D. Hemdan, M. A. Shouman and M. E. Karar, “COVIDX-net: A framework of deep learning classifiers to diagnose COVID-19 in X-ray images,” arXiv [eess.IV], 2020. [Google Scholar]
15. K. Simonyan and A. Zisserman, “Very deep convolutional networks for large-scale image recognition,” arXiv [cs.CV], 2014. [Google Scholar]
16. G. Huang, Z. Liu, L. Van Der Maaten and K. Q. Weinberger, “Densely connected convolutional networks,” in 2017 IEEE Conf. on Computer Vision and Pattern Recognition (CVPR), Honolulu, HI, USA, pp. 2261–2269, 2017. [Google Scholar]
17. C. Szegedy, V. Vanhoucke, S. Ioffe, J. Shlens and Z. Wojna, “Rethinking the inception architecture for computer vision,” in 2016 IEEE Conf. on Computer Vision and Pattern Recognition (CVPR), Las Vegas, NV, USA, pp. 2818–2826, 2016. [Google Scholar]
18. K. He, X. Zhang, S. Ren and J. Sun, “Deep residual learning for image recognition,” in 2016 IEEE Conf. on Computer Vision and Pattern Recognition (CVPR), Las Vegas, NV, USA, pp. 770–778, 2016. [Google Scholar]
19. C. Szegedy, S. Ioffe, V. Vanhoucke and A. Alemi, “Inception-v4, Inception-ResNet and the impact of residual connections on learning,” Proceedings of the AAAI Conference on Artificial Intelligence, vol. 31, no. 1, pp. 4278–4284, 2017. [Google Scholar]
20. F. Chollet, “Xception: Deep learning with depthwise separable convolutions,” in 2017 IEEE Conf. on Computer Vision and Pattern Recognition (CVPR), Honolulu, HI, USA, pp. 1800–1807, 2017. [Google Scholar]
21. M. Sandler, A. Howard, M. Zhu, A. Zhmoginov and L. -C. Chen, “MobileNetV2: Inverted residuals and linear bottlenecks,” in 2018 IEEE/CVF Conf. on Computer Vision and Pattern Recognition, Lake City, UT, USA, pp. 4510–4520, 2018. [Google Scholar]
22. A. Rehman, S. Naz, A. Khan, A. Zaib and I. Razzak, “Improving coronavirus (COVID-19) diagnosis using deep transfer learning,” in Lecture Notes in Networks and Systems, Singapore: Springer Nature, pp. 23–37, 2022. [Google Scholar]
23. A. Krizhevsky, I. Sutskever and G. E. Hinton, “ImageNet classification with deep convolutional neural networks,” Communications of the ACM, vol. 60, no. 6, pp. 84–90, 2017. [Google Scholar]
24. S. Targ, D. Almeida and K. Lyman, “Resnet in resnet: Generalizing residual architectures,” arXiv [cs.LG], 2016. [Google Scholar]
25. C. Szegedy, W. Liu, Y. Jia, P. Sermanet, S. Reed et al., “Going deeper with convolutions,” in 2015 IEEE Conf. on Computer Vision and Pattern Recognition (CVPR), Boston, MA, USA, pp. 1–9, 2015. [Google Scholar]
26. T. Ozturk, M. Talo, E. A. Yildirim, U. B. Baloglu, O. Yildirim et al., “Automated detection of COVID-19 cases using deep neural networks with X-ray images,” Computers in Biology and Medicine, vol. 121, pp. 103792, 2020. [Google Scholar]
27. J. Redmon and A. Farhadi, “YOLO9000: Better, faster, stronger,” in 2017 IEEE Conf. on Computer Vision and Pattern Recognition (CVPR), Honolulu, HI, USA, pp. 6517–6525, 2017. [Google Scholar]
28. U. Ozkaya, S. Ozturk and M. Barstugan, “Coronavirus (COVID-19) classification using deep features fusion and ranking technique,” in Studies in Big Data, Cham: Springer International Publishing, pp. 281–295, 2020. [Google Scholar]
29. M. A. Khan, S. Kadry, Y. Zhang, T. Akram, M. Sharif et al., “Prediction of COVID-19 pneumonia based on selected deep features and one class kernel extreme learning machine,” Computers & Electrical Engineering, vol. 90, pp. 106960, 2021. [Google Scholar]
30. Q. Leng, H. Qi, J. Miao, W. Zhu and G. Su, “One-class classification with extreme learning machine,” Mathematical Problems in Engineering, vol. 2015, pp. 1–11, 2015. [Google Scholar]
31. R. Kumar, R. Arora, V. Bansal, V. Sahayasheela, H. Buckchash et al., “Accurate prediction of COVID-19 using chest X-ray images through deep feature learning model with SMOTE and machine learning classifiers,” bioRxiv, 2020. [Google Scholar]
32. A. M. Alqudah, S. Qazan and A. Alqudah, “Automated systems for detection of COVID-19 using chest X-ray images and lightweight convolutional neural networks,” Research Square, 2021. [Online]. Availble: https://doi.org/10.21203/rs.3.rs-24305/v1. [Google Scholar]
33. A. M. Alqudah, “AOCT-NET: A convolutional network automated classification of multiclass retinal diseases using spectral-domain optical coherence tomography images,” Medical & Biological Engineering & Computing, vol. 58, no. 1, pp. 41–53, 2020. [Google Scholar]
34. X. Zhang, X. Zhou, M. Lin and J. Sun, “ShuffleNet: An extremely efficient convolutional neural network for mobile devices,” in 2018 IEEE/CVF Conf. on Computer Vision and Pattern Recognition, Lake City, UT, USA, pp. 6848–6856, 2018. [Google Scholar]
35. O. Russakovsky, J. Deng, H. Su, J. Krause, S. Satheesh et al., “ImageNet large scale visual recognition challenge,” International Journal of Computer Vision, vol. 115, pp. 211–252, 2015. [Google Scholar]
36. P. K. Sethy, S. K. Behera, P. K. Ratha and P. Biswas, “Detection of coronavirus disease (COVID-19) based on deep features and support vector machine,” International Journal of Mathematical, Engineering and Management Sciences, vol. 5, no. 4, pp. 643–651, 2020. [Google Scholar]
37. T. Rahman, “COVID-19 radiography database,” [Online]. Available: https://www.kaggle.com/tawsifurrahman/covid19-radiography-database. (accessed on 01 Sep 2021). [Google Scholar]
38. M. Tan and Q. V. Le, “EfficientNet: Rethinking model scaling for convolutional neural networks,” International Conference on Machine Learning, vol. 97, pp. 6105–6114, 2019. [Google Scholar]
39. C. -C. Wang, C. -T. Chiu and J. -Y. Chang, “EfficientNet-eLite: Extremely lightweight and efficient CNN models for edge devices by network candidate search,” arXiv[cs.CV], 2020. [Google Scholar]
40. “ImageNet,” Image-net.org. [Online]. Available: https://image-net.org/. (accessed on 15 Dec 2021). [Google Scholar]
Cite This Article
 Copyright © 2022 The Author(s). Published by Tech Science Press.
This work is licensed under a Creative Commons Attribution 4.0 International License , which permits unrestricted use, distribution, and reproduction in any medium, provided the original work is properly cited.
 Downloads
 Citation Tools