
 Submit a Paper
 Propose a Special lssue
 Open Access
ARTICLE

Research on Early Warning of Customer Churn Based on Random Forest
Hunan University of Finance and Economics, Changsha, 410205, China
* Corresponding Author: Tianze Zhang. Email:
Journal on Artificial Intelligence 2022, 4(3), 143-154. https://doi.org/10.32604/jai.2022.031843
Received 28 April 2022; Accepted 29 July 2022; Issue published 01 December 2022
 View Full Text
 Download PDF
Abstract
With the rapid development of interest rate market and big data, the banking industry has shown the obvious phenomenon of “two or eight law”, 20% of the high quality customers occupy most of the bank’s assets, how to prevent the loss of bank credit card customers has become a growing concern for banks. Therefore, it is particularly important to establish a customer churn early warning model. In this paper, we will use the random forest method to establish a customer churn early warning model, focusing on the churn of bank credit card customers and predicting the possibility of future churn of customers. Due to the large data size of banks, the complexity of their customer base, and the diversity of user characteristics, it is not easy for banks to accurately predict churned customers, and there are few customer churn early warning studies suitable for banks. Compared with the traditional bank credit risk prediction algorithm, this method is proved to be useful in the early stage of churn warning, and has the advantages of high prediction accuracy, large amount of processed data, and good model interpretability, which can help to retain valuable customers in advance and thus achieve the purpose of reducing cost and increasing efficiency.Keywords
With the emergence of Internet finance, the business situation of commercial banks has changed drastically, and the competition among major banks has become more and more intense. Both the internal transformation of banks and the changes in the external environment have made the problem of customer churn more and more serious. Customer churn has a significant impact on the banking industry’s profits, and it may negatively affect the corporate image while increasing the cost of marketing new customers [1]. In a saturated market, the cost of developing new customers is much greater than the cost of retaining existing customers [2]. A 5% reduction in customer churn can result in a 3% to 80% increase in corporate profits. Retaining old customers is 16 times more difficult than marketing new customers, but the cost of retaining old customers is only 1/5 to 1/7 of the cost of marketing new customers [3].
According to the theory of life cycle of customers, the phenomenon of customer churn is inevitable. Banks can maximize the life value cycle of customers through reasonable marketing strategies, thus reducing the percentage of customer churn and increasing business revenue. Therefore, preventing customer churn and retaining old customers have become important issues of concern for major banks. Due to the large amount of data, the complexity of the customer base, and the diversity of user characteristics, it is not easy for banks to accurately predict churn, but it is urgent to accurately predict churn and propose corresponding retention measures. So far, there are few studies on the existing churn of bank customers, so it is relevant to conduct churn prediction studies for bank customers. Reducing churn not only means extending the life cycle of customers and generating profits for the company, but also improves the bank’s corporate image, builds word-of-mouth and increases loyalty.
For the customer churn prediction problem, researchers have proposed some methods. Prasad et al. [4] used Classification And Regression Tree (CART) and C5.0 classification model respectively to Two methods were used to analyze customer churn in the banking sector. In addition, to solve the problem of classifier performance deterioration due to imbalanced data and high dimensionality of customer data, Idris et al. [5] first used PSO undersampling method to deal with imbalanced data, and then used maximum correlation for dimensionality reduction, and used the processed data for random forest model. Further, to deal with the sensitivity of imbalanced data, researchers proposed cost-sensitive random forest method [6], which uses both undersampling and Cube balanced sampling methods to process the data. Richter et al. [7] overcame the limitation of lacking customer information by proposing a churn prediction model that changes the training sample dataset and the cost of misclassification that changes over time, improving make 8 the prediction performance with decision trees. In addition to using optimization algorithms for individual classifiers to solve the churn prediction problem, hybrid approaches are also an effective way. Tsai et al. [8] used a hybrid model combining reverse neural networks and self-organizing mappings for churn prediction. The literature [9] overcomes the limitation of lacking customer information by proposing a churn prediction model that varies the training sample dataset and the misspecification cost of time-varying to improve the prediction performance using decision trees. In addition to using optimization algorithms for individual classifiers to solve the churn prediction problem, hybrid approaches are also an effective way. Neslin et al. [10] constructed a churn profit contribution function based on various parameters such as churn probability, cost to the company to retain the churned customer, and success rate of retention. Yu et al. [11] proposed a customer churn early warning system and established a customer churn prediction model in order to reduce the churn rate of e-commerce customers. An improved particle swarm optimization algorithm (IPSO) was proposed by non-linearly decreasing the inertia weights and adding local perturbations. The effectiveness of IPSO is confirmed by using eight benchmark test functions as samples. The initial parameters (penalty parameter c and prismatic function parameterg) of the Support Vector Machine (SVM) model were optimized by IPSO, and the results showed that: compared with SVM and PSO-SVM models, IPSO-SVM has higher prediction accuracy and is a more effective and practical prediction model. Zhao [12] discussed some key technologies in the implementation of customer relationship management systems in the financial industry, and also studied data mining-based customer relationship management techniques for banks. A separate discussion was made on customer clustering analysis of banks, comparing the characteristics of decision tree and rough set methods, and proposing a multivariate decision clustering algorithm for bank customers based on the combination of rough set and decision tree, and the experimental results showed that this method improved the efficiency of clustering discrimination to a certain extent.
Chen et al. [13] in order to improve customer retention, to predict the lost customers, to advance the user recall time, and to reduce the customer churn rate. Firstly, the imbalance problem of data set was handled by SMOTE algorithm, and the features were selected with reference to the random forest feature importance ranking and Pearson correlation coefficient, finally 19 feature attributes were selected and the test set was trained by random forest model, and the optimal parameters were found by grid search method, and the model was evaluated by using precision rate, recall rate, F1 and ROC curve, and the area AUC value was 0.77, and the classification effect was good and could be used for prediction. Wang et al. [1] used single factor analysis and stepwise judgment analysis to identify the influencing factors on customer churn and used Cox model to make predictions on customer churn. Zhang et al. [14] analyzed corporate customer churn using C5.0. Ding et al. [15] effectively dealt with imbalance classification to improve the accuracy of high-value customer churn prediction in telecommunication industry, and proposed an improved random forest algorithm (IRFA). This algorithm improves the method of node division when generating each tree in random forest and divides nodes based on customer life value, which is a modification of information gain, not only solves the problem of unbalanced data distribution, but also improves the accuracy of prediction of high-value customers with churn tendency. He [16] compared the effectiveness of logistic regression model, linear SVM, and radial basis SVM in commercial bank customer churn prediction and concluded that linear SVM can achieve better results. He et al. [17] applied C5.0 decision tree algorithm, CART decision tree algorithm, and RBF neural network to build a revenue churn early warning model for a fixed-line operator’s customers, and then used the GMDH method to build a combined revenue churn early warning model for customers.
By comparing the existing studies, it is clear that all models have their advantages and disadvantages. Although the above studies have contributed to customer churn prediction, there are fewer existing churn studies for bank customers. Therefore, churn research on bank customers is of practical importance. Bank data are usually characterized by high data dimensionality, while random forests can handle a large number of input variables [18], have a high prediction accuracy, have a good tolerance for outliers and noise, and are less prone to overfitting [19]. Therefore, to help solve this problem of bank customer churn, this paper proposes to use the random forest algorithm for model construction to build a set of customer churn early warning models with practical implications to provide guidance strategies for bank customer retention.
Random forest is a classifier that uses multiple CART decision trees (Classification And Regression Tree) to train and predict samples. The basic idea is to select and train multiple base classifiers with weak classification ability based on a random method, so that the integrated classifier formed by their combination has strong classification ability.
Simply put, a random forest is a forest built in a random way. In the random forest model operation, randomness is the focus of the model operation, and the correlation between decision trees is reduced by randomly selecting samples and features. The randomness in random forest has two main meanings, one is to randomly select equal amount of data as training samples in the original training data with put-back, and the other is to randomly select a part of features to build decision trees when building decision trees. These two kinds of random make the correlation between each decision tree is small, further improving the accuracy of the model. The forest consists of many decision trees, and each decision tree is uncorrelated with each other. Whenever a new input sample enters the forest, each decision tree in the forest is allowed to determine the class of this sample separately. The category that predicts the result is the category that is selected the most often.
Assume that there are M objects in the training data set, and N samples are randomly selected from the sample data, each time the samples are not identical, and these samples form the training data set of the decision tree; each node of each tree is generated by randomly selecting p(p << m) attributes from all attributes (the number of all attributes is m), and selecting the attribute with the greatest information gain as the node for division. A non-pruned decision tree is generated. After repeating the above method several times, multiple decision trees are built, and these trees are grouped together to form a random forest. Finally, the final prediction type of the sample is decided by voting on the prediction results of these trees. The specific flow is shown in Fig. 1.
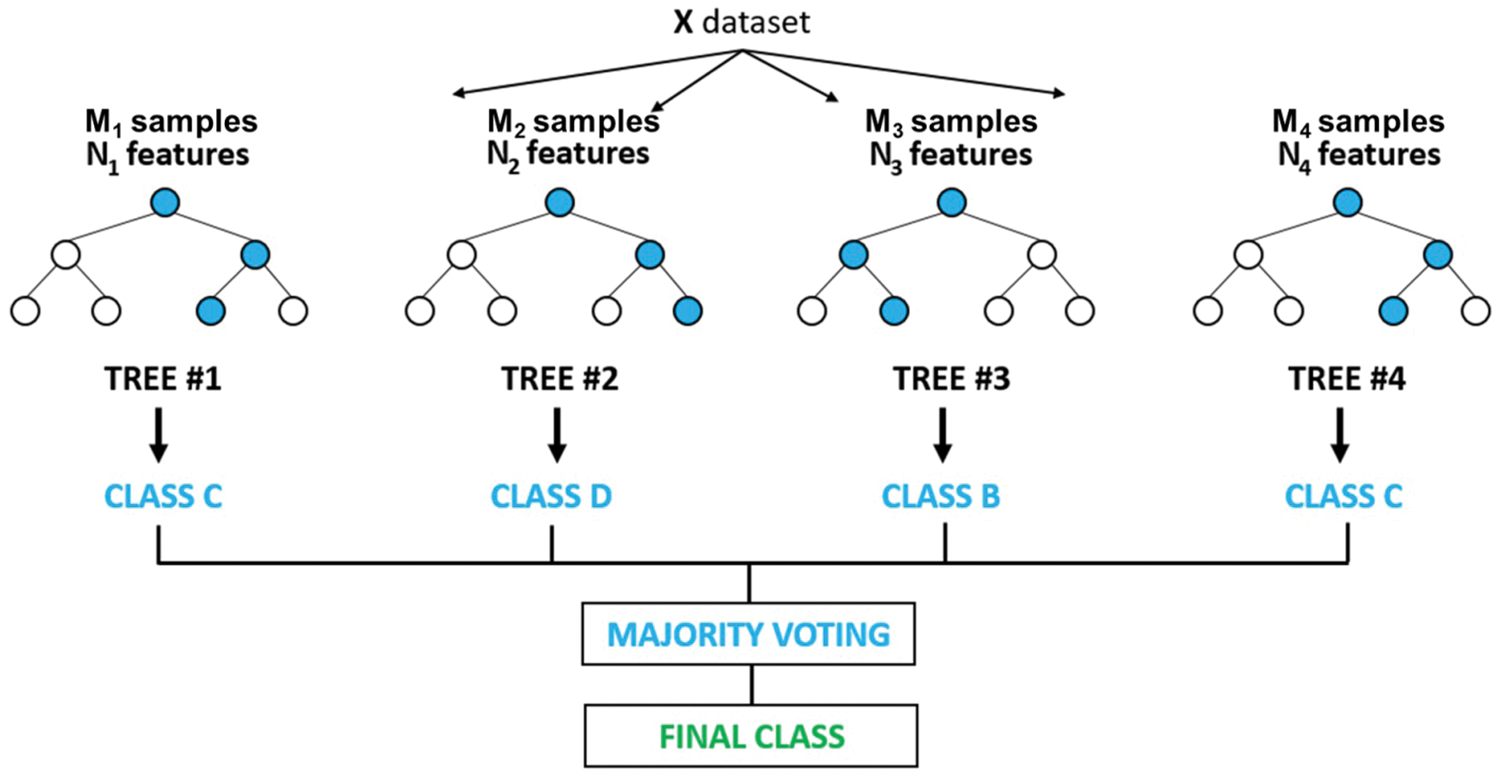
Figure 1: Diagram of random forest model operations
2.2 Synthetic Minority Oversampling Technique
SMOTE is Synthetic Minority Oversampling Technique, which is an improved scheme based on random oversampling algorithm. SMOTE is one of the methods to improve the performance of classification models for unbalanced data, because random oversampling algorithms tend to produce the problem of model overfitting, making the information learned by the model too specific and not generalization enough. Compared with the traditional simple sampling process, it analyzes samples from a few classes and adds new samples to the data set by synthesizing manually the characteristics of the few classes obtained from the analysis. In order to solve the overfitting brought by simple sampling because of the number of samples from a few classes and enhance the generalization of the model, the basic idea is as follows.
1. Obtain all minority class samples, and for each minority class sample, draw its k proximity samples (k is the number of customizations)
2. Set a sampling ratio according to the sample category ratio, and take a number of samples close to the minority class sample x_0
3. For each randomly selected sample x_1, create a new sample according to the following formula, and put the new sample into the data set
4. Expressed in the formula as follows,
2.3 Principal Component Analysis
Principal Component Analysis (PCA) is a method that uses the knowledge of linear algebra to perform data dimensionality reduction. There are certain correlations among the original variables in the dataset, and a smaller number of composite variables can be used to combine the information among the original variables. Therefore, it converts multiple variables into a few uncorrelated composite variables, thus reflecting the whole data set more comprehensively. These composite variables are called principal components, and the principal components are uncorrelated with each other, i.e., the information represented does not overlap.
The sample for this study is derived from 10,127 customer information of a commercial bank, which contains 21 fields, including customer Id, whether to churn, age, gender, education status, marriage status, income estimation, credit limit, and working balance, etc. The data is obtained from the kaggle authoritative dataset website. The details of the customer data model as well as the business category data model are shown in the Tables 1 and 2 below.


Data pre-processing is the further processing of the original data before the data is operated, checking the integrity as well as consistency of the data, and using some operations to reduce the amount of data, noise, and transforming the data into a form suitable for computer processing. In order to ensure data reliability and exclude the influence of abnormal data on the results, it is necessary to process the data and filter the features before constructing the model:
3.2.1 Missing Value Processing
Missing values may be generated due to missing data caused by data phone or saving failure due to machine reasons, or subjective human errors, etc. In order to make effective use of the data to build a good model effect, missing values in the sample data are filled with 0.
Outliers are usually considered to be data points that are significantly different from other data points or do not conform to the expected normal pattern of the phenomenon represented by the whole, and outlier detection is dedicated to solving the problem of finding patterns that do not conform to the expected behavior, finding outliers and judging whether they are reasonable according to common sense.
Some of the data are stored as textual information and need to be digitized so that the model can process the data. The attributes that are obviously irrelevant to the results such as user number are removed, textual binary attributes such as age and whether they are churned users are transformed into statistical-friendly 1 and 0 data, and non-numerical attributes such as total income, education level and marital status are uniquely coded to expand the features to a certain extent, and the columns containing empty data are cleaned up. The valid data after cleaning are 10,127 items.
3.2.4 Pre-Processed Data Model
After the above pre-processing of the data, the preliminary pre-processed data model is obtained, as shown in Table 3

3.2.5 Divide the Test Set from the Training set
To test the prediction effectiveness of the model, the training data is divided into two parts in the ratio of 7:3, a training set for training and a validation set for testing. The training set is used to train the model, and then the validation set is used to verify the validity of the model, selecting the model that achieves the best results until a satisfactory model is obtained. Finally, after the model “passes” the validation set, we then use the test set to test the final results of the model and evaluate the accuracy of the model, as well as the error. The correctness, error rate, recall rate, accuracy rate, etc. of the prediction results of the test set are used to determine the prediction effectiveness of the model.
The number of customers in the dataset is 10,127, of which churned users account for 16% of the dataset. The specified features are selected as input data, and whether or not to churn as the final prediction target. Seventy percent of the credit samples are randomly selected as the training set to train the model, and 30% of the credit samples are used as the test set for testing the model prediction effect. Please see Fig. 2.
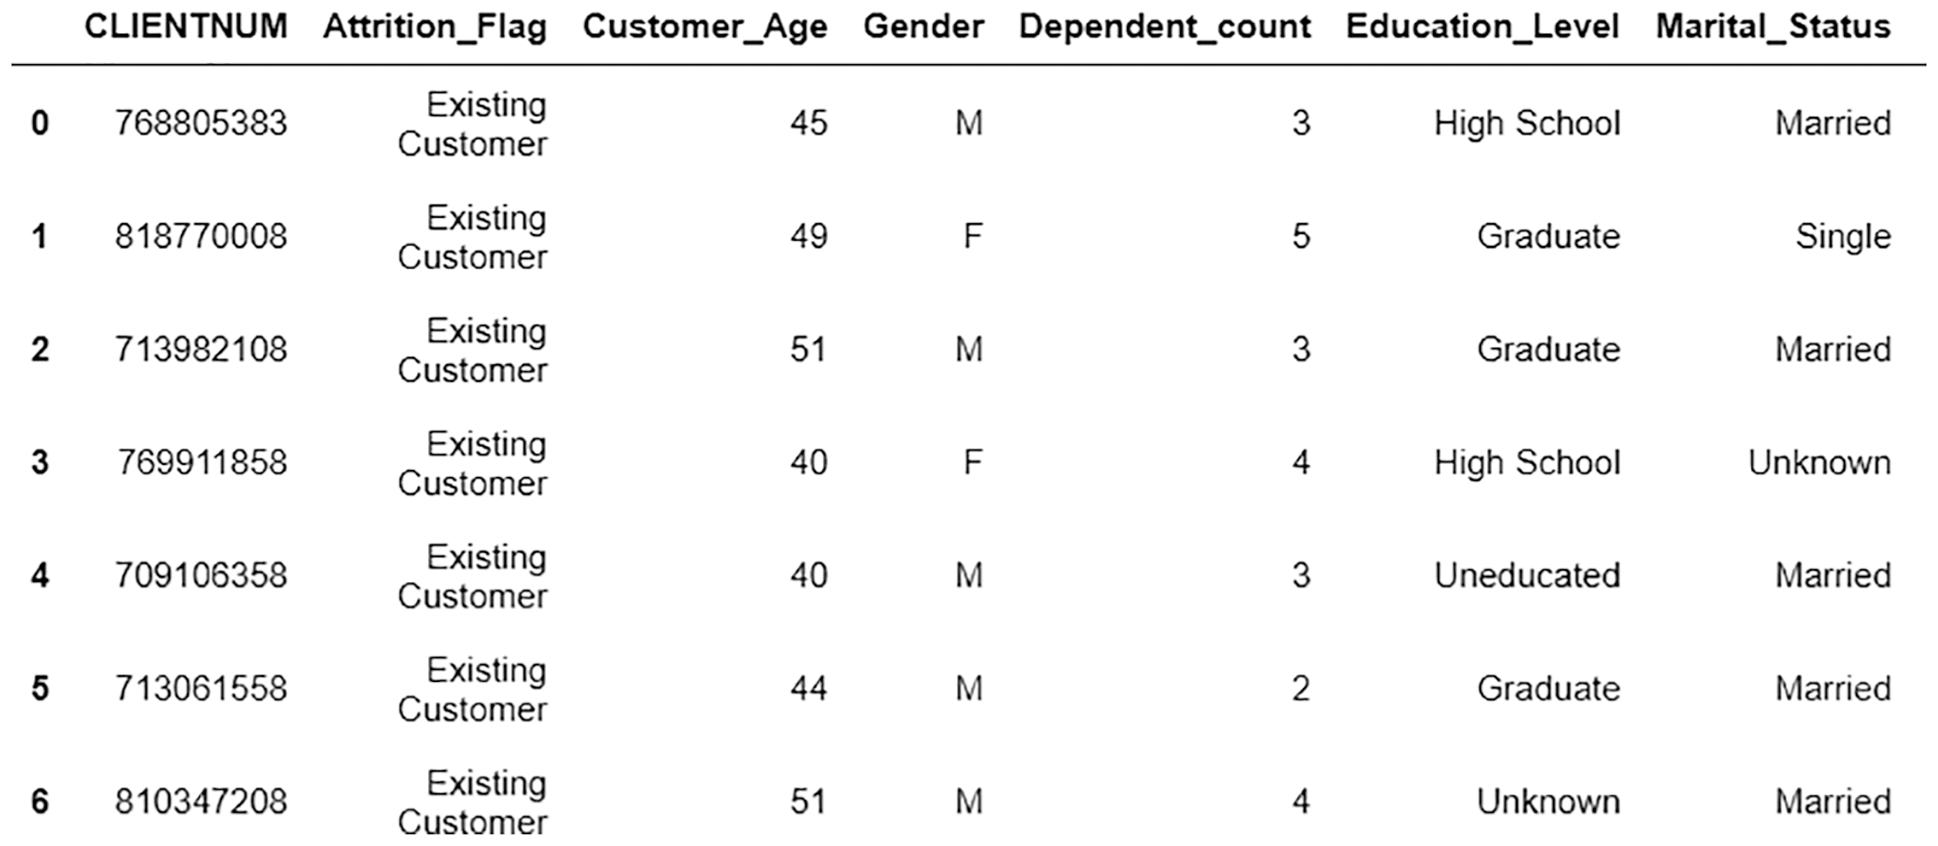
Figure 2: Variable field excerpt
The imbalanced data can easily make the classifier show high accuracy in numerical value even if the judgment is wrong. The imbalance problem of the training set is handled by SMOTE method, and the number of samples of few classes is added to make it more suitable for the operation of the model.
1. Use pandas to read the data set obtained after the previous processing
2. Divide the dataset into feature set x and target feature y
3. Divide the dataset into dataset and test set according to the ratio of 0.3
4. Use SMOTE function to transform the test set into a dataset with a 1:1 ratio of positive to negative results
5. Use principal component analysis to reduce the dimensionality of the single coded categorical variables and thus reduce the variance. Build a better model by using several principal components at the same time instead of tens of single coded features.
The model is trained using the obtained training set and the model performance is evaluated using the test set. The experimental results show that the results obtained from training using the balanced dataset have higher accuracy than the original ones.
The processed data set was analyzed for correlation coefficients and visualized to generate a heat map, in which the variables with relationship coefficients less than 0.2 were selected, and the heat map is shown in Fig. 3 below. Among them, the variables with relationship coefficients less than 0.2 are as follows. Please see Fig. 4.
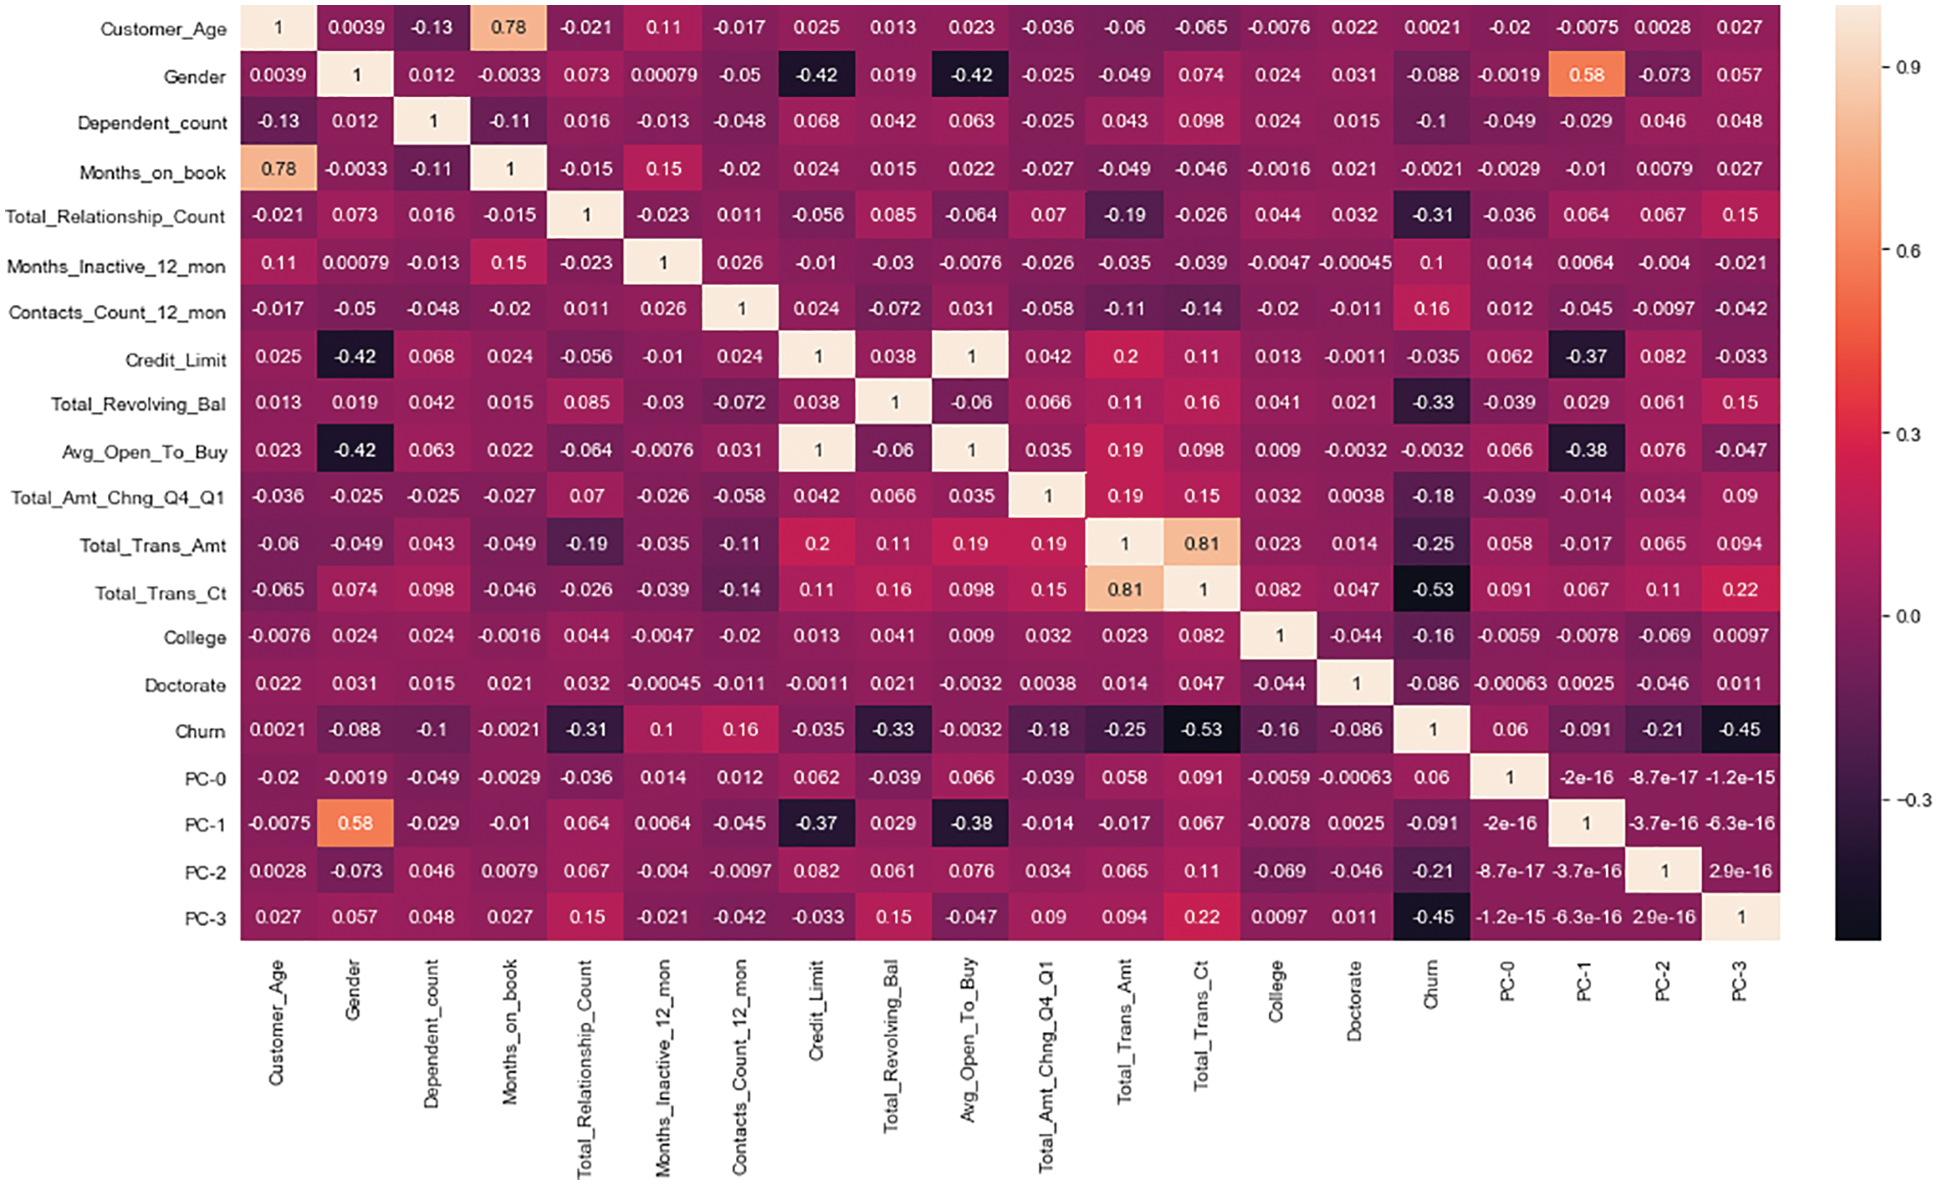
Figure 3: Heat map of variables with relationship coefficient less than 0.2
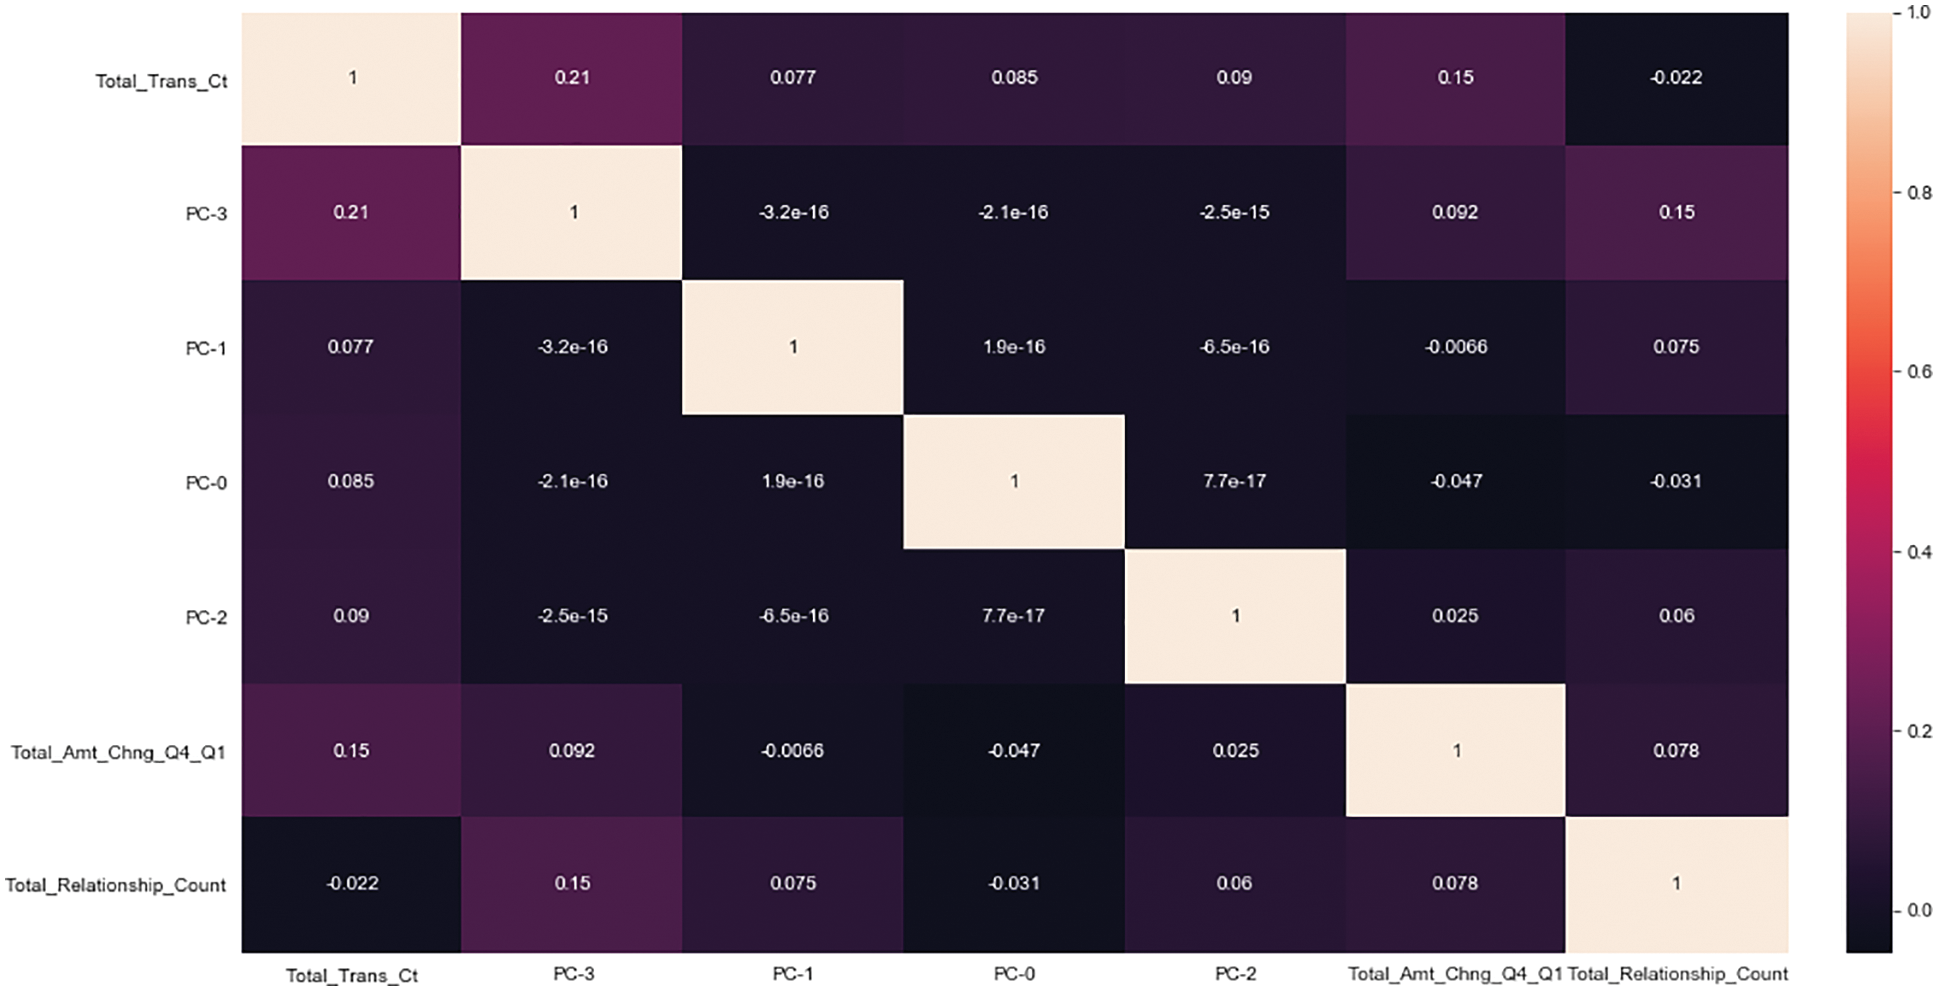
Figure 4: Heat map of variables with relationship coefficient less than 0.2
3.6 Introduction of Core Parameters
This part mainly uses the Random Forest Classifier method in python’s sklearn package to construct the model, where the important parameters are described as follows.
1. n_estimators: the number of trees in the forest
2. max_features: the number of features in the subset of features randomly selected by each base learner for slicing
3. max_depth: the maximum depth of the tree
4. min_samples_split, the minimum number of samples of the node, which means the minimum number of samples that can be further cut by the current tree node
5. criterion: cutting strategy, gini or entropy
6. min_impurity_decrease: set the stopping condition
7. class_weight: set the weight of different classes of samples in the dataset, default is None, that is, the weight of all classes of samples is 1.
A random forest with k CART decision trees is constructed, and based on the bootstrap sampling method, the input samples are sampled k times as the input samples of k CART decision trees. k = 100 is set in this paper. m = |M| determines the number of input features m for each CART decision tree, and each tree is split according to the rule of minimum Gini index until all features All splitting is finished.
Different test set divisions of the same data are selected and cross-validated five times to obtain the measure F1-score. It can be seen that the model maintains a high accuracy rate of 91.42%∼92.2%. Please see Fig. 5.
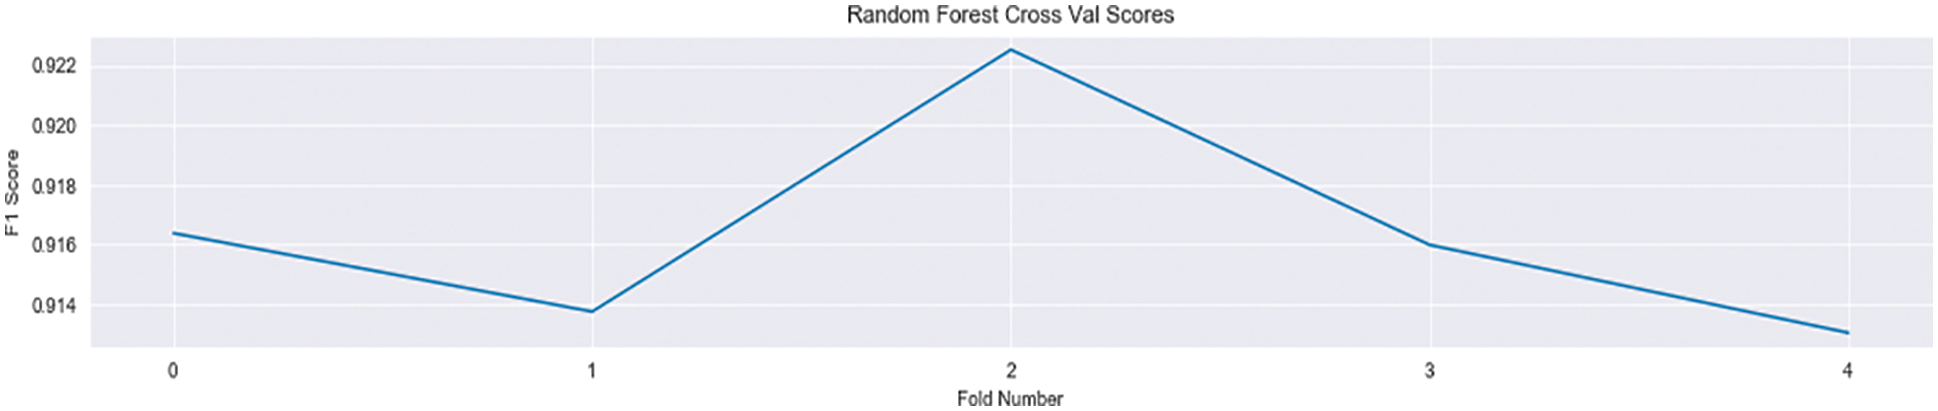
Figure 5: Random forest cross-validation F1-score results
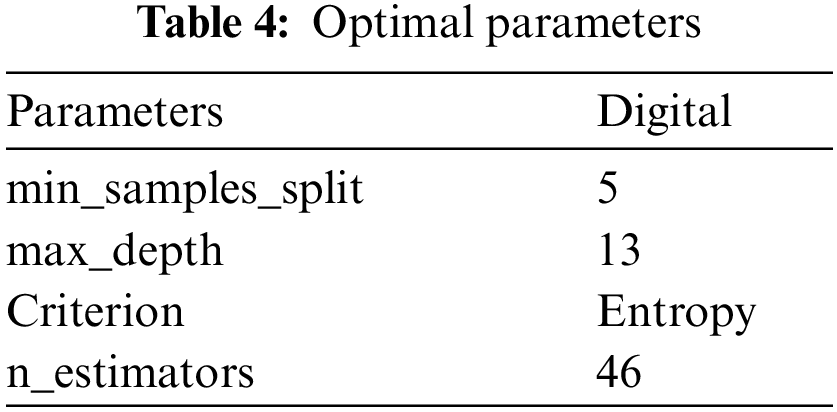
In this paper, the four parameters min_samples_split, max_depth, criterion, and n_estimators are optimized: for these parameters the parameters are tuned using the GridSearchCV grid search method. The method uses an iterative approach to bring all combinations of the parameters into the test and obtain the locally optimal parameter results. The optimal parameters obtained are listed in the following Table 4 below.
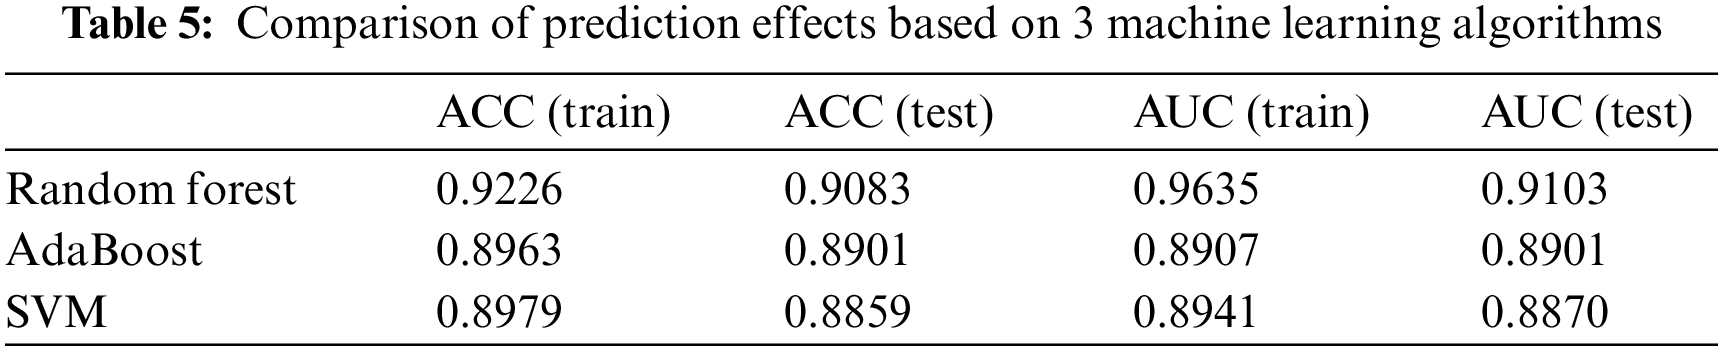
The ACC and AUC obtained using the parameter-tuned random forest model for the test set are 0.9084 and 0.9103, respectively, please see Table 5. After the optimal parameters were obtained through parameter tuning, the random forest, AdaBoost and SVM models were compared, and the final best prediction results were obtained as shown in the following. The table reflects that the random forest model has higher ACC and AUC and is more efficient compared to traditional bank credit risk prediction algorithms.
Customer churn forecasting is the process of determining potential lost customers using historical data from customer records. It is an important issue of concern for many industries, especially in the highly competitive and increasingly liberal domestic and international telecommunications, finance, passenger transportation, and newspaper industries, and has received widespread attention from both academia and the real world. The key of attrition prediction lies in the accuracy of the model built, the interpretation of the model and the quality of the data feature variables. How to build an efficient prediction model and find the effective data variables is a key problem in the field of customer churn prediction and customer relationship management. In previous studies, scholars have predicted customer churn through various algorithms and models, which have shown that customer churn prediction models are effective, can accurately discover the real situation of customer churn for enterprises, can provide better decision support for comprehensive and effective customer relationship management, and have wide application prospects. Therefore, establishing customer churn early warning has become an important way to save lost customers. In this paper, we propose a model construction using random forest algorithm, focusing on the churn of bank credit card customers, predicting the possibility of future churn, and establishing a set of customer churn early warning model with practical significance. Compared with the traditional bank credit risk prediction algorithm, it can predict churned customers more accurately and efficiently, and provide guidance strategies for banks to retain their customers height. Figures should be in the original scale, with no stretch or distortion.
Funding Statement: This work was supported by the National Natural Science Foundation of China (No. 72073041); Open Foundation for the University Innovation Platform in Hunan Province (No. 18K103); 2011 Collaborative Innovation Center for Development and Utilization of Finance and Economics Big Data Property, Universities of Hunan Province, Open Project (Nos. 20181901CRP03, 20181901CRP04, 20181901CRP05); 2020 Hunan Provincial Higher Education Teaching Reform Research Project (Nos. HNJG-2020-1130, HNJG-2020-1124); and 2020 General Project of Hunan Social Science Fund (No. 20B16).
Conflicts of Interest: The authors declare that they have no conflicts of interest to report regarding the present study.
References
1. W. Q. Wang, R. Yao, C. Cheng and C. Liu, “Influencing factors of customer churn in commercial banks: A study based on survival analysis method,” Financial Forum, vol. 19, no. 1, pp. 73–79, 2014. [Google Scholar]
2. J. Hadden, A. Tiwari and R. Roy, “Computer assisted customer churn management: State-of-the-art and future trends,” Computers & Operations Research, vol. 34, no. 10, pp. 2902–2917, 2007. [Google Scholar]
3. J. Xiao, D. H. Liu and H. Z. He, “GMDH-based one-step integrated modeling for customer churn prediction,” Systems Engineering Theory and Practice, vol. 32, no. 4, pp. 808–813, 2012. [Google Scholar]
4. D. Prasad and S. Madhavi, “Prediction of churn behavior of bank customer customers using data mining tools,” Business Intelligence Journal, vol. 5, no. 1, pp. 96–101, 2012. [Google Scholar]
5. A. Idris, M. Rizwan and A. Khan, “Churn prediction in telecom using random forest and PSO based data balancing in combination with various feature selection strategies,” Computers & Electrical Engineering, vol. 38, no. 6, pp. 1808–1819, 2012. [Google Scholar]
6. J. Burez and D. Van den Poel, “Handling class imbalance in customer churn prediction,” Expert Systems with Applications, vol. 36, no. 3, pp. 4626–4636, 2009. [Google Scholar]
7. Y. Richter, E. Yom-Tov and N. Slonim, “Predicting customer churn in mobile networks through analysis of social groups,” in The SIAM Int. Conf. on Data Mining, Columbus, USA, pp. 732–741, 2010. [Google Scholar]
8. C. F. Tsai and Y. H. Lu, “Customer churn prediction by hybrid neural networks,” Expert Systems with Applications, vol. 36, no. 10, pp. 12547–12553, 2009. [Google Scholar]
9. B. Luo, P. J. Shao and J. Liu, “Customer churn prediction based on the decision tree in personal handyphone system service,” in The Int. Conf. on Service Systems and Service Management, Chengdu, China, pp. A280145, 2007. [Google Scholar]
10. S. Neslin, S. Gupta, W. Kamakura, J. X. Lu and C. H. Mason, “Defection detection: Measuring and understanding the predictive accuracy of customer churn models,” Journal of Marketing Research, vol. 43, no. 2, pp. 204–211, 2006. [Google Scholar]
11. S. B. Yu and Y. Q. Lu, “E-commerce customer churn early warning and prediction,” Systems Engineering, vol. 34, no. 9, pp. 37–43, 2016. [Google Scholar]
12. J. Zhao, “Research on key technologies of bank customer relationships management based on data mining,” Ph.D. dissertation, Zhejiang University, Zhejiang, China, 2005. [Google Scholar]
13. J. Chen, J. B. Chen and Y. B. Li, “Research on user churn early warning based on random forest,” Precision Manufacturing and Automation, vol. 7, no. 2, pp. 21–24, 2021. [Google Scholar]
14. Y. Zhang and Z. M. Zhang, “A customer churn alarm model based on the C5.0 decision tree-taking the postal short message as an example,” Statistics and Information Forum, vol. 30, no. 1, pp. 89–94, 2015. [Google Scholar]
15. J. M. Ding, G. Q. Liu and H. Li, “The application of improved random forest in the telecom customer churn prediction,” Pattern Recognition and Artificial Intelligence, vol. 28, no. 11, pp. 1041–1049, 2015. [Google Scholar]
16. B. L. He, “A study of the application of SVM in prediction about decrease in bank’s customer,” Financial Forum, vol. 19, no. 9, pp. 70–74, 2014. [Google Scholar]
17. Y. He, Z. L. He and X. Y. Zhou, “Combined early warning of major customer lose in wireline telecom based on data mining,” Soft Science, vol. 26, no. 1, pp. 128–131, 2012. [Google Scholar]
18. A. Liaw and M. Wiener, “Classification and regression by random forest,” R News, vol. 2, no. 3, pp. 18–22, 2002. [Google Scholar]
19. L. Breiman, “Random forests,” Machine Learning, vol. 45, no. 1, pp. 5–32, 2001. [Google Scholar]
Cite This Article
 Copyright © 2022 The Author(s). Published by Tech Science Press.
This work is licensed under a Creative Commons Attribution 4.0 International License , which permits unrestricted use, distribution, and reproduction in any medium, provided the original work is properly cited.
 Downloads
 Citation Tools