
 Submit a Paper
 Propose a Special lssue
 Open Access
ARTICLE

Multi-Layer Feature Extraction with Deformable Convolution for Fabric Defect Detection
1 School of Computer Science, Nanjing University of Information Science and Technology, Nanjing, 210044, China
2 State Key Lab. for Novel Software Technology, Nanjing University, Nanjing, 210023, China
3 Engineering Research Center of Digital Forensics, Ministry of Education, Nanjing University of Information Science and Technology, Nanjing, 210044, China
4 Jiangsu Collaborative Innovation Center of Atmospheric Environment and Equipment Technology (CICAEET), Nanjing University of Information Science and Technology, Nanjing, 210044, China
5 College of Mathematics and Information Science, Nanjing Normal University of Special Education, Nanjing, 210038, China
* Corresponding Author: Jielin Jiang. Email:
Intelligent Automation & Soft Computing 2024, 39(4), 725-744. https://doi.org/10.32604/iasc.2024.036897
Received 15 October 2022; Accepted 06 December 2022; Issue published 06 September 2024
 View Full Text
 Download PDF
Abstract
In the textile industry, the presence of defects on the surface of fabric is an essential factor in determining fabric quality. Therefore, identifying fabric defects forms a crucial part of the fabric production process. Traditional fabric defect detection algorithms can only detect specific materials and specific fabric defect types; in addition, their detection efficiency is low, and their detection results are relatively poor. Deep learning-based methods have many advantages in the field of fabric defect detection, however, such methods are less effective in identifying multi-scale fabric defects and defects with complex shapes. Therefore, we propose an effective algorithm, namely multi-layer feature extraction combined with deformable convolution (MFDC), for fabric defect detection. In MFDC, multi-layer feature extraction is used to fuse the underlying location features with high-level classification features through a horizontally connected top-down architecture to improve the detection of multi-scale fabric defects. On this basis, a deformable convolution is added to solve the problem of the algorithm’s weak detection ability of irregularly shaped fabric defects. In this approach, Roi Align and Cascade-RCNN are integrated to enhance the adaptability of the algorithm in materials with complex patterned backgrounds. The experimental results show that the MFDC algorithm can achieve good detection results for both multi-scale fabric defects and defects with complex shapes, at the expense of a small increase in detection time.Keywords
Fabric is closely related to human life and industrial production. Automated textile equipment has greatly improved the production efficiency of fabric as science and technology have rapidly developed. Broadly, defects will be introduced due to the production environment, equipment faults, etc. Current statistics indicate that the price of fabrics with defects may need to be discounted by 50% [1]. Therefore, in order to bring improved economic benefits to fabric manufacturers, defect detection is an essential step to ensure fabric quality. Defect detection is traditionally performed by a skilled fabric inspector who locates and classifies the defects [2]. The efficiency of a skilled worker working by eye can evaluate fabrics with a width of about 1.8 m at a speed of around 12 m per minute. However, it is difficult to guarantee the accuracy of manual detection due to the influence of objective factors such as variable light and fabric speed and subjective factors such as worker fatigue and experience level [3]. In addition, it is highly time-consuming to train an operator to identify complex fabric defects, resulting in low production efficiency.
In recent decades, many solutions have been proposed to detect defects in specific materials including plain fabric, white gauze and single striped fabric, such as Fourier transform [4], Gabor filter [5] and Wigner distribution. These methods usually require different parameters to be set for different defects in different fabric materials. They can only detect a single fabric material or a single defect type and thus have relative limitations in terms of their defect detection and classification.
With the boom of artificial intelligence research and the arrival of big data era, deep learning methods are widely used in edge computing [6–8], data analysis [9–11], image recognition [12], object detection [13–18], image denoizing [19] and other fields. The principle of deep learning is to establish the neural network structure by simulating the operation mode of the human brain. In terms of fabrics, human vision will focus first on obvious features such as the pattern, color, shape and edge contour of the fabric, which more easily attract people’s attention. In deep learning, through the hierarchical description of fabric defect features, different convolution templates are used to gradually extract more complex visual shapes, and the fabric’s texture information can be expressed through the combination of features of these data. Overall, deep learning methods can automatically extract features from input images effectively without the need for complex hand-designed features. In recent years, deep learning has been gradually applied in the field of fabric defect detection, using methods such as region-based convolutional neural networks (RCNN) [20], which can achieve good detection results for common fabric defects. However, for multi-scale and complex shape defects, these methods usually do not achieve satisfactory detection results, thus resulting in low detection accuracy. Given the shortcomings of current fabric defect detection methods, this paper proposes a multi-layer feature extraction approach combined with deformable convolution (MFDC) for fabric defect detection. The main contributions of the study are as follows:
1. This paper proposes a generic fabric defect detection method based on deep learning. By integrating Roi Align and Cascade-RCNN approaches, the adaptability of the defect detection algorithm in patterns with complex backgrounds is enhanced by increasing the intersection over union (IOU) threshold, with a clear reduction in close false positions observed.
2. Multi-layer feature extraction is applied to improve the detection accuracy of multi-scale fabric defects by combining the semantic features of the upper and lower layers. In addition, visual information from the bottom layer fabric defect features is used to improve the algorithm’s detection ability of small defects.
3. Deformable convolution is used to enhance the generalization ability of the algorithm to handle complex shape defects and more accurately extract the characteristics of fabric defects. This approach improves the detection accuracy of fabrics with complex shapes and extreme aspect ratio fabric defects.
Considerable progress has been achieved in fabric defect detection following decades of research. Traditional methods can only identify whether the fabric has defects but cannot accurately determine the location of the fabric defects. Additionally, most traditional fabric defect detection algorithms can only deal with plain fabric without background patterns or large fabric defects. Abouelela et al. [21] used median, mean, variance and other features to detect defects based on texture segmentation; their proposed method can meet the requirements of real-time detection, however, it is ineffective for images containing irregular textures. Hu et al. [22] combined wavelet analysis with a Fourier transform for fabric defect detection. The defects identified by the Fourier transform are then denoized by wavelet shrinkage to achieve the purpose of unsupervised detection. Karlekar et al. [23] proposed a wavelet filtering method by combining morphology and a wavelet transform. This method was used to model fabric texture and fabric defects and detect defects in horizontal, vertical and diagonal lines. Zhu et al. [24] obtained the size of the image detection window through the autocorrelation function and calculated the gray level co-occurrence matrix between the image template and the fabric image; in their approach, the appropriate threshold was specified manually to achieve fabric defect detection. By extracting texture information from the gray level co-occurrence matrix, Thakare et al. [25] proposed an improved gray level co-occurrence matrix detection method that combines texture information with self-organizing mapping as the basis for fabric defect classification.
Traditional defect detection methods have high requirements for the regularity of fabric texture and background—complex fabric textures will lead to poor defect detection performance. In recent years, convolutional neural networks (CNNs) have been widely used in defect detection, and the approaches used can be divided into two categories, namely, one-stage algorithms, represented by SSD [26] and YOLO [27], and two-stage algorithms based on candidate regions represented by Faster RCNN. Li et al. [28] proposed a focal loss [29] method based on ResNet50 to solve the problem of poor detection effects caused by uneven fabric image samples. Although these two methods are feasible, they also have some limitations, such as requiring extensive computing resources, resulting in slow recognition speed and low recognition accuracy. Zhao [30] proposed an improved non-maximum suppression algorithm, which considers the similarity between defect types in the detection process.
Compared with general defect detection, fabric defect detection has unique characteristics. The size of defects within the same fabric type of fabric can vary markedly. Some defects occupy more than half of the image while others occupy only a few pixels, leading to poor detection effects in two-stage defect detection algorithms such as Faster-RCNN [31]. YOLO [27] is a typical one-stage algorithm with high detection speed but low detection accuracy; therefore, researchers have proposed many improved algorithms based on YOLO, such as using PAN-Net [32] or SPP-net [33] as the network backbone model, using a MISH activation function [34], and adding a K-mean [35] clustering algorithm to improve the detection performance. However, despite these refinements, the detection effects of YOLO and other one-stage defect detection algorithms are still poor in terms of handling small-sized defects.
3 Multi-Layer Feature Extraction Combined with Deformable Convolution
At present, although researchers have proposed many effective fabric defect detection algorithms, all such approaches have only weak ability to detect multi-scale defects and fabric defects with complex shapes. To solve this problem, in this study, multi-layer feature extraction combined with deformable convolution (MFDC) is proposed for fabric defect detection. First, the fabric image after data enhancement is passed through the ResNet50 backbone network using multi-layer feature extraction technology [36]; the upper and lower layer defect feature semantics are then combined to improve the detection accuracy of multi-scale fabric defects. Second, fusion of the deformable convolution module [37] can effectively extract features of complex-shaped defects, improving the extraction ability and detection accuracy of complex-shaped and extreme aspect ratio fabric defects. Finally, Roi Align and Cascade-RCNN [38] are integrated; by continuously increasing the IOU threshold strategy, this paper improves the Cascade-RCNN network model, thereby reducing close false positions and improving defect detection and location accuracy. The architecture of the proposed MFDC can be seen in Fig. 1.
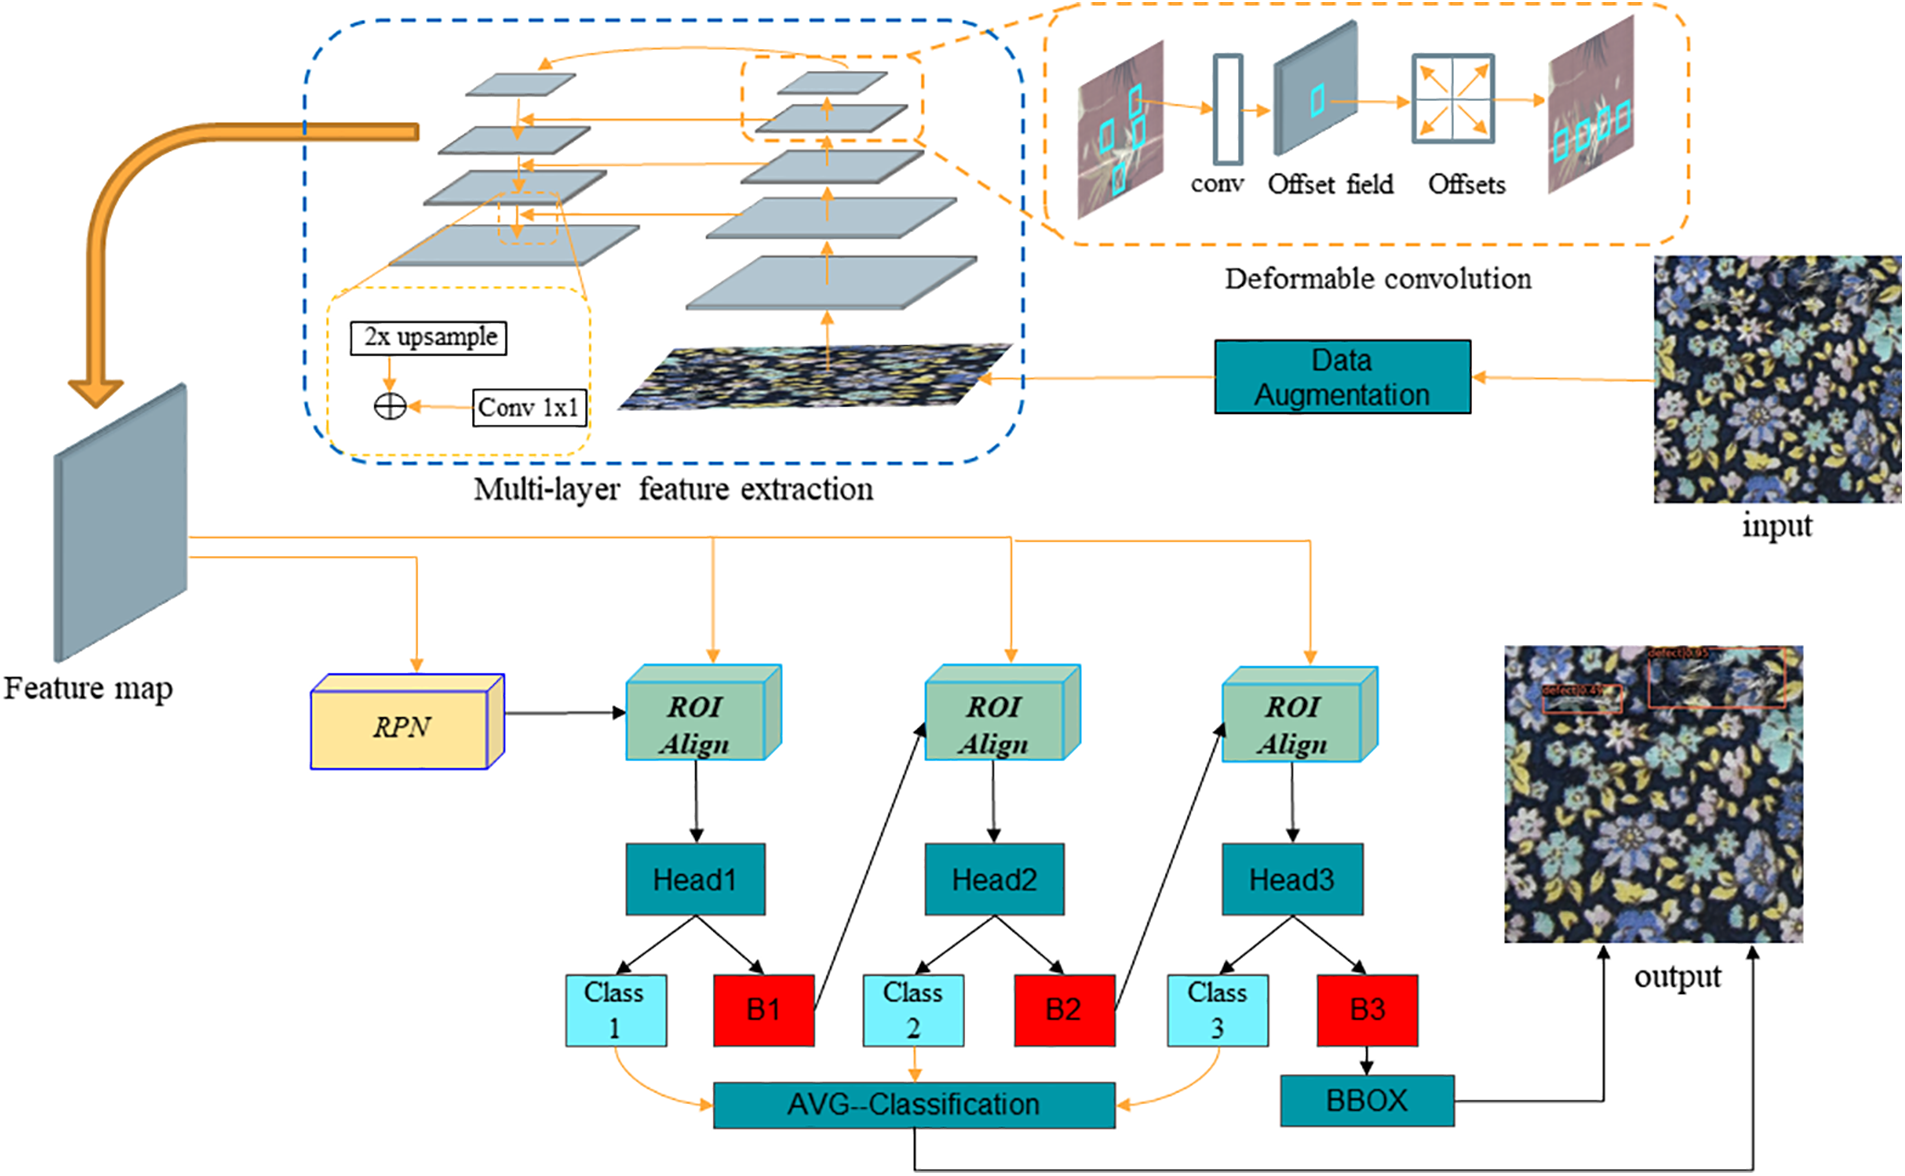
Figure 1: The architecture of the proposed MFDC
3.1 Multi-Layer Feature Extraction
Due to improper production equipment, manual operation and other related factors, various defects will be formed during the fabric production process. The size and shape of these fabric defects can differ markedly. For some small defects, the differences in pixel values between the defect and the background area are small, therefore, such defects are often not detected. Traditional CNN-based methods use featurized image pyramid or pyramidal feature hierarchy approaches [39] to solve this problem. The featurized image pyramid approach uses a set of multiple images with different resolutions generated from the same image. The image is then continuously hierarchically down-sampled to generate different features and predict them. Finally, the prediction results for all the feature sizes are counted. Although this method solves the problem of multi-scale defects through multi-scale feature extraction and can improve the detection ability of small-sized defects effectively, it also greatly increases memory usage and model computation requirements, thus increasing the difficulty of training the network. The pyramidal feature hierarchy method directly detects fabric defects on feature maps with different resolutions. Although this method will not add much computational overhead, it nonetheless causes some issues. For example, the semantic information of the underlying features is insufficient: although small defects can be detected, they are often wrongly classified. In addition, high-level feature image resolution is not enough to detect small defects. To solve these two problems, multi-layer feature extraction is applied in this work to improve the detection performance, the details of which are shown in Fig. 2.
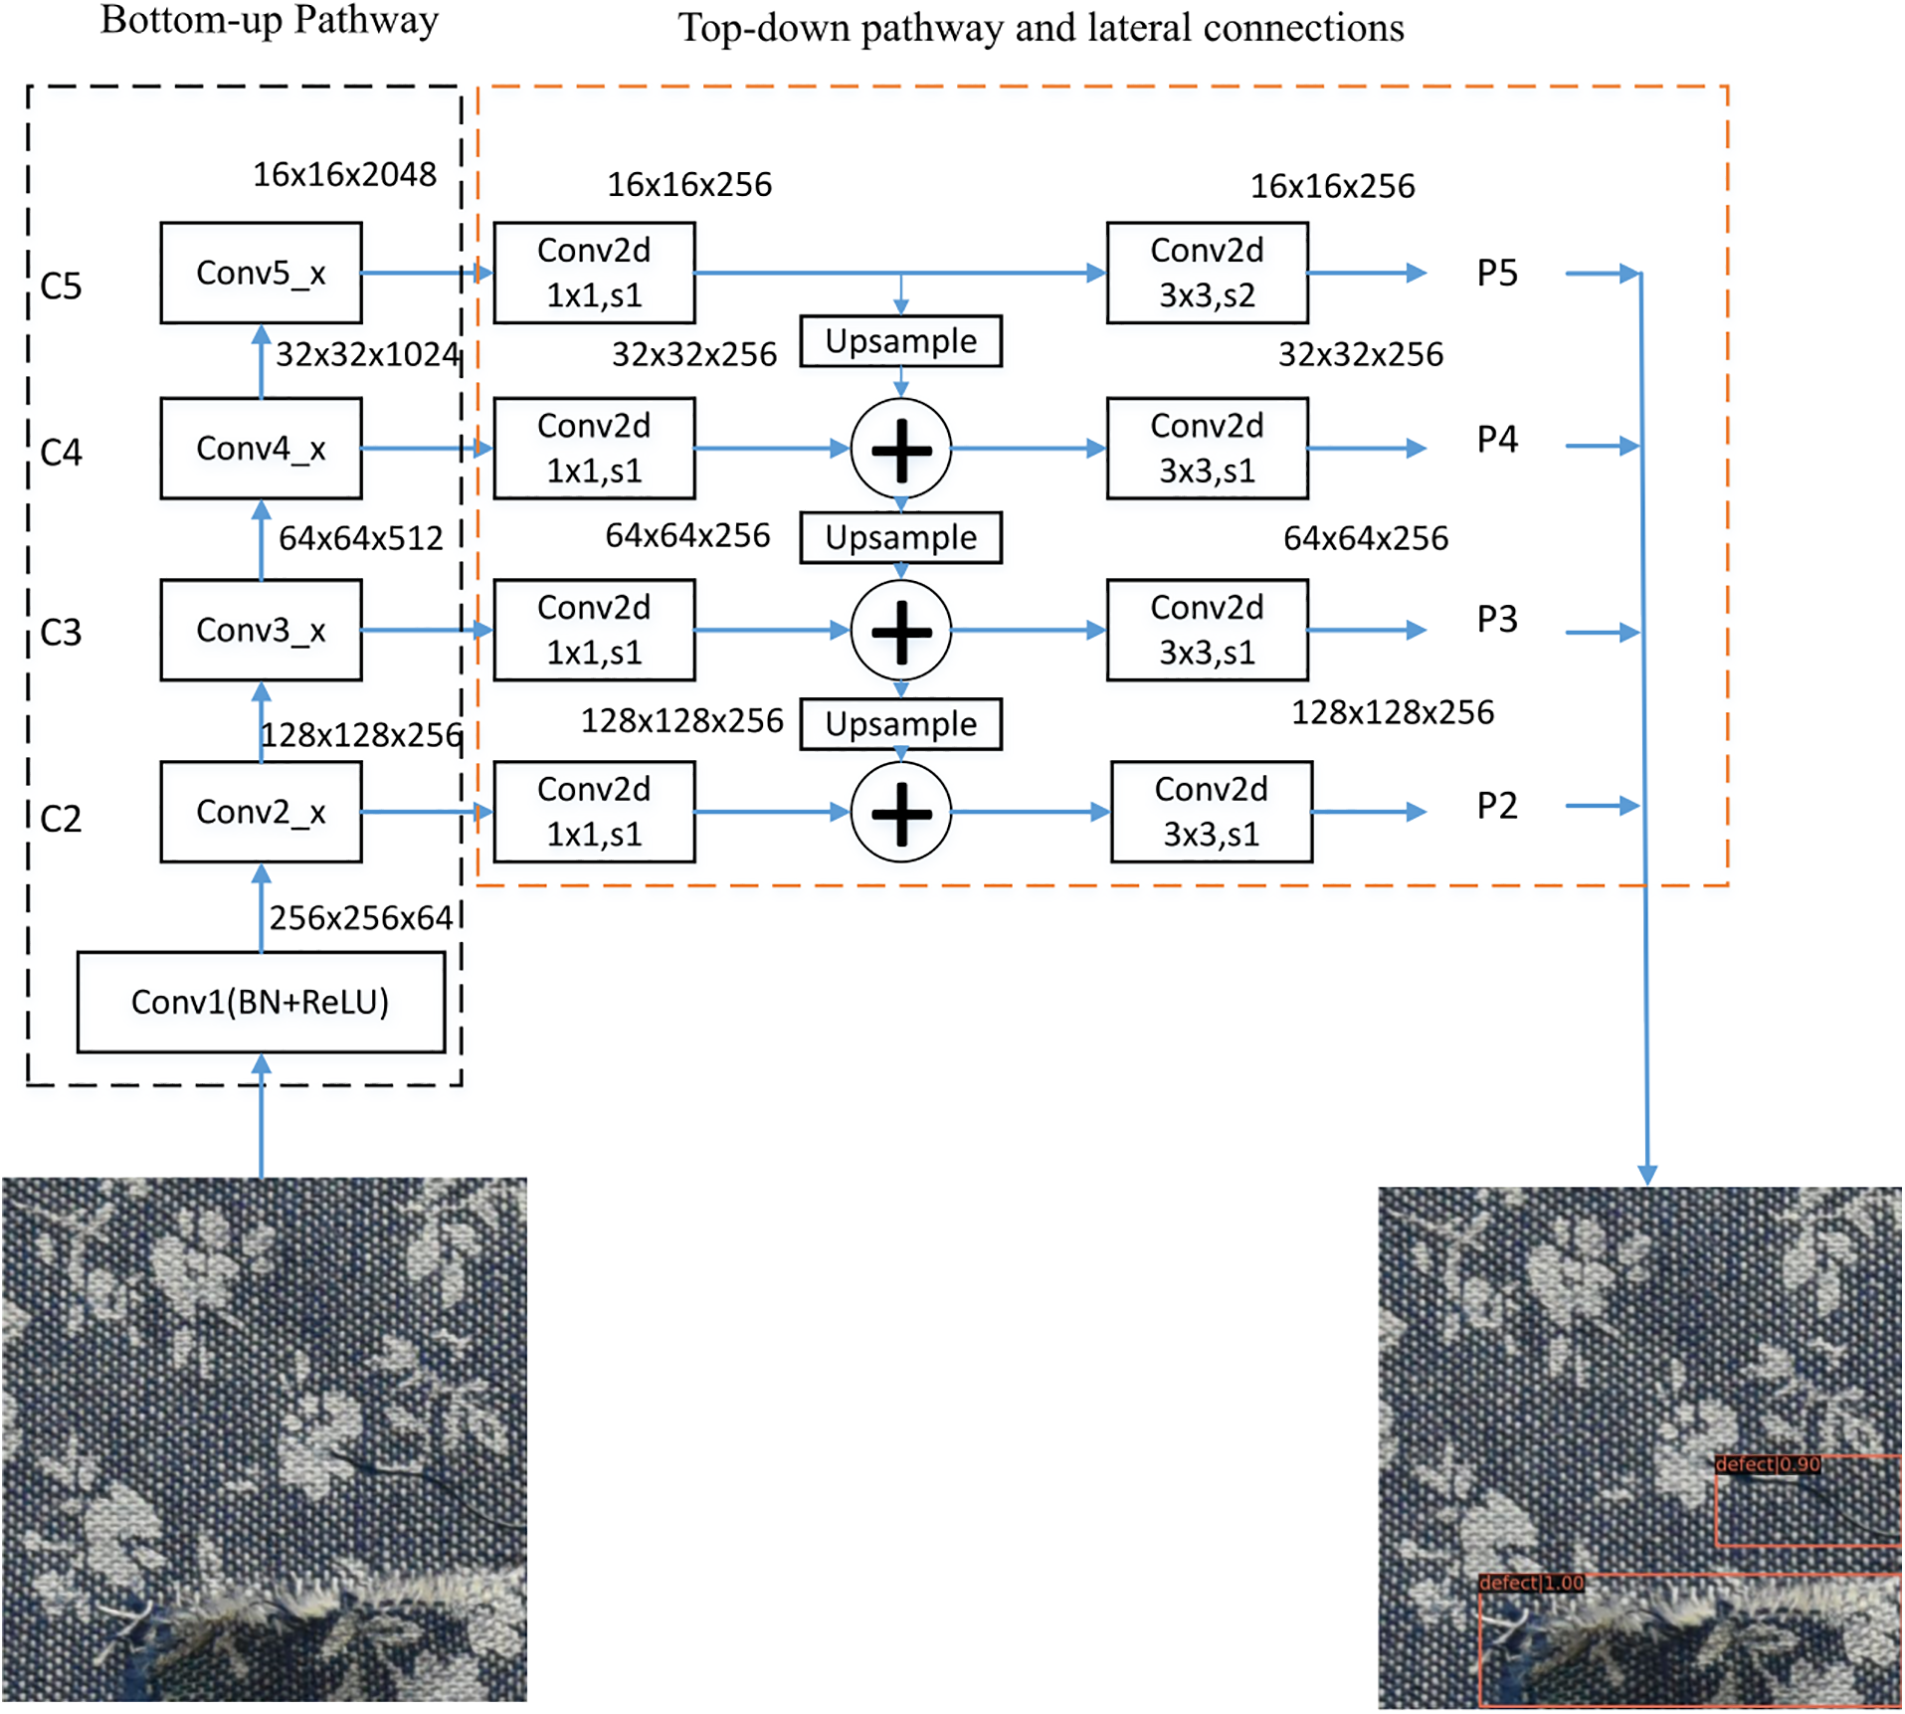
Figure 2: Multi-layer feature extraction networks
In Fig. 2, the size of the input image is 512 × 512. The first part of the multi-layer feature extraction is the backbone of the forward-propagating CNN, which calculates a feature hierarchy with a scaling step size of 2. The size of the feature map is then gradually scaled through convolution and pooling. In this process, the feature maps are arranged from large to small according to their resolution, forming a pyramid structure. Several adjacent layers may output feature maps of the same scale, so we put these feature maps in the same stage, and the last layer of each stage contains the most obvious features. We take the output of this feature layer as part of the feature extraction of fabric defects. The output of each block can be marked as {C1,C2,C3,C4,C5}, in order.
The second part of the proposed approach is a semantic fusion structure. Feature maps with higher resolution and stronger semantics can be obtained by the nearest neighbor upsampling method, and the top output C5 (
3.2 Deformable Convolution Module
Generally, the shape of fabric defects varies markedly as a result of different fabric materials and different manufacturing equipment, and fabric defects with complex shapes are commonly classified incorrectly. Traditional algorithms usually employ two strategies to solve this problem. One is to expand the number of defect samples to enhance the model’s ability to adapt to the scale transformation of fabric defects; the other is to propose feature-based algorithms for specific defect types. However, both methods have disadvantages. The first approach has low generalization ability due to the limitations of the input fabric defect samples and thus cannot be generalized to general defect detection. The second method type has difficulty in dealing with overly complex fabric defects. The convolution units of traditional defect detection algorithms sample fixed positions of the feature map, however, different positions may occur due to different defect scales or deformed objects, thus their detection performance is poor. In this paper, in order to accurately locate the defects, a deformable convolution method is applied to adapt the scale and receptive field size, thereby improving the algorithm’s ability to model complex defects.
As shown in Fig. 3, the deformable convolution [38] adds a displacement to the normal sampling coordinates of fabric defects to make the receptive field more representative of the object’s actual shape. In the traditional defect detection algorithm, the output of y (p0) for each location p0 on the feature map y can be expressed as:
where R is a convolution kernel operator (e.g., 3 × 3), and pn is the enumeration of the positions in R. In deformable convolution, R is obtained with offsets
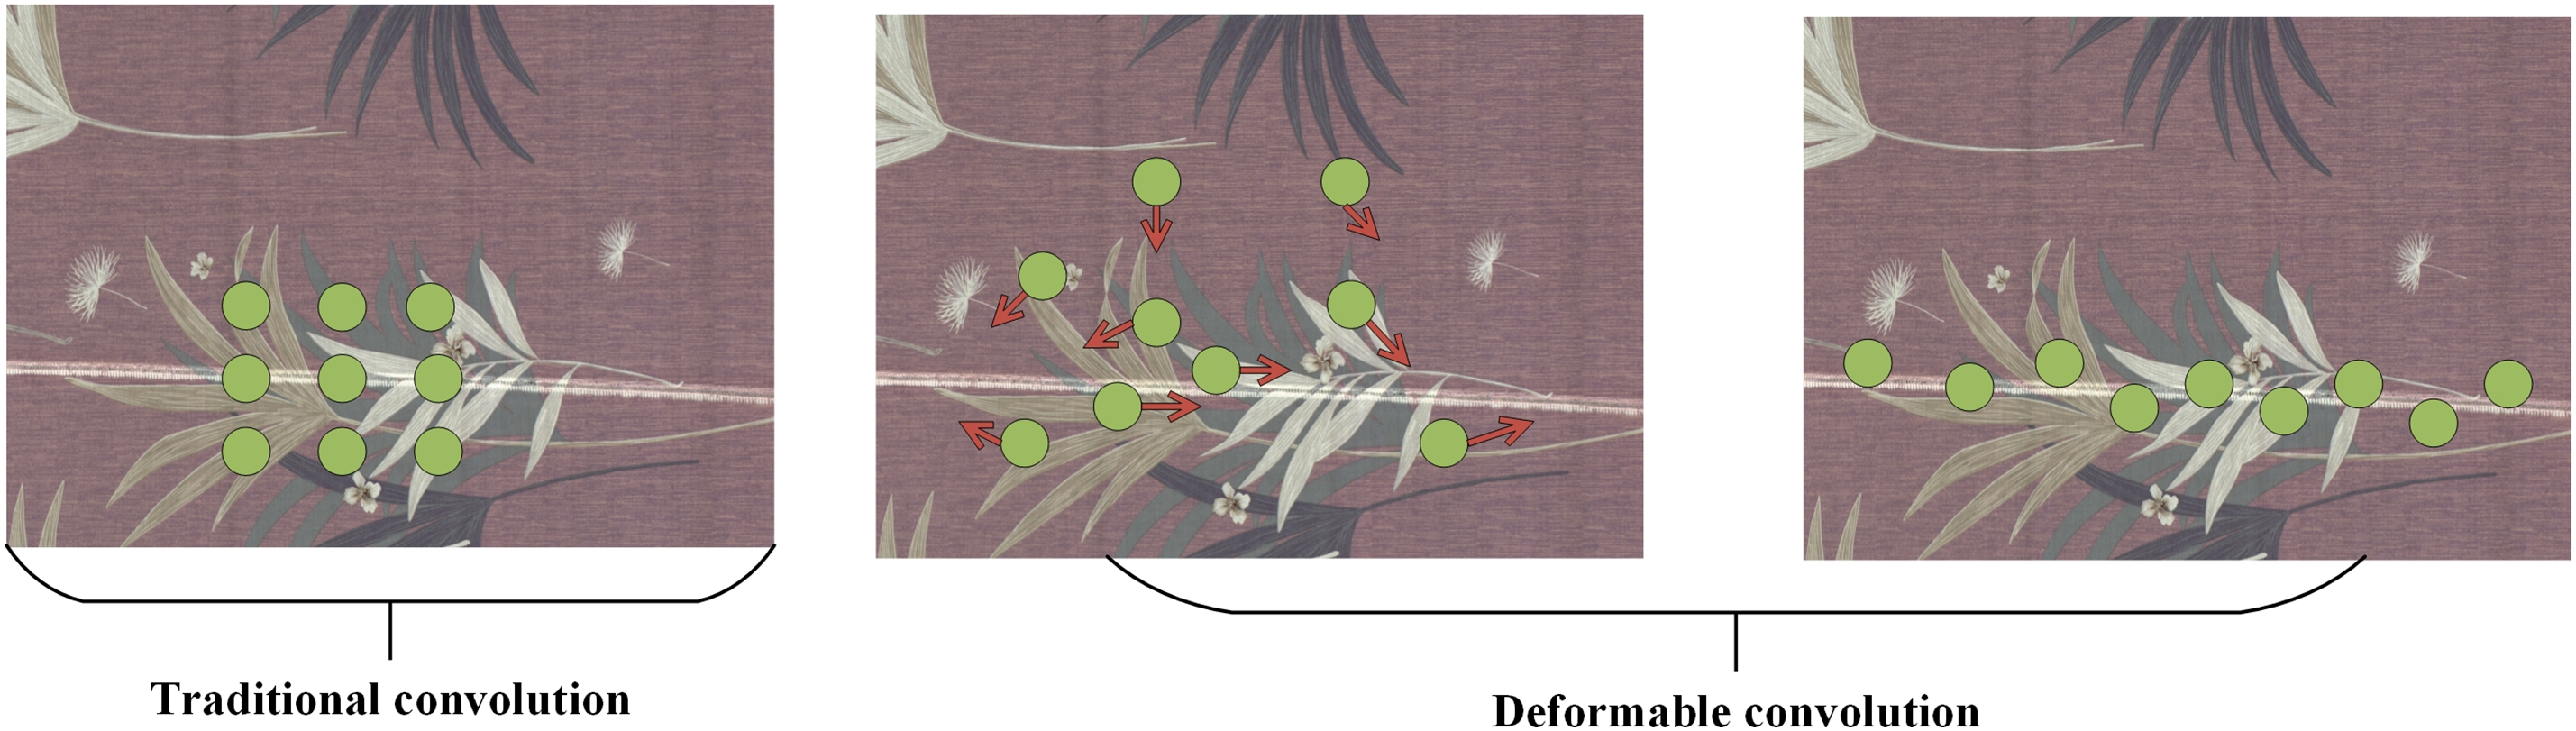
Figure 3: Deformable convolution
The fixed-scale convolution is converted into irregular convolution by this offset, and the feature sampling is carried out in the irregular and offset position
Since the offset is usually a decimal, non-integer coordinates cannot be used in such discrete data, thus the eigenvalues in Eq. (2) need to be completed by bilinear interpolation so that x(p) can be expressed by:
where
In CNN-based fabric defect detection algorithms, an IOU threshold is required to define positive or negative samples. If a lower IOU threshold is set for training, more noise will be generated. However, if a higher IOU threshold is used for training, the number of positive training examples will decrease drastically, commonly resulting in training model overfitting. In addition, detectors trained using a single IOU threshold often do not produce optimal results when tested with other IOU thresholds. The traditional method to solve these two problems is iterative bounding box regression [39], which states that a single box regression is insufficient to generate accurate positional information, thus, multiple iterations are required to fine-tune the bounding box, as shown in Eq. (4).
After each iteration, the distribution of the bounding box changes to a certain extent, however, the algorithm’s classifier is trained based on the initial bounding box, and a single IOU threshold will generate more outliers. A single regressor cannot achieve good results at all IOU thresholds; therefore, proposals of differing quality will correspond to detection branches with different abilities. Detection branches trained under different IOU thresholds can achieve superior detection results. To solve this problem, this paper proposes an improved Cascade-RCNN approach, as shown in Fig. 4.
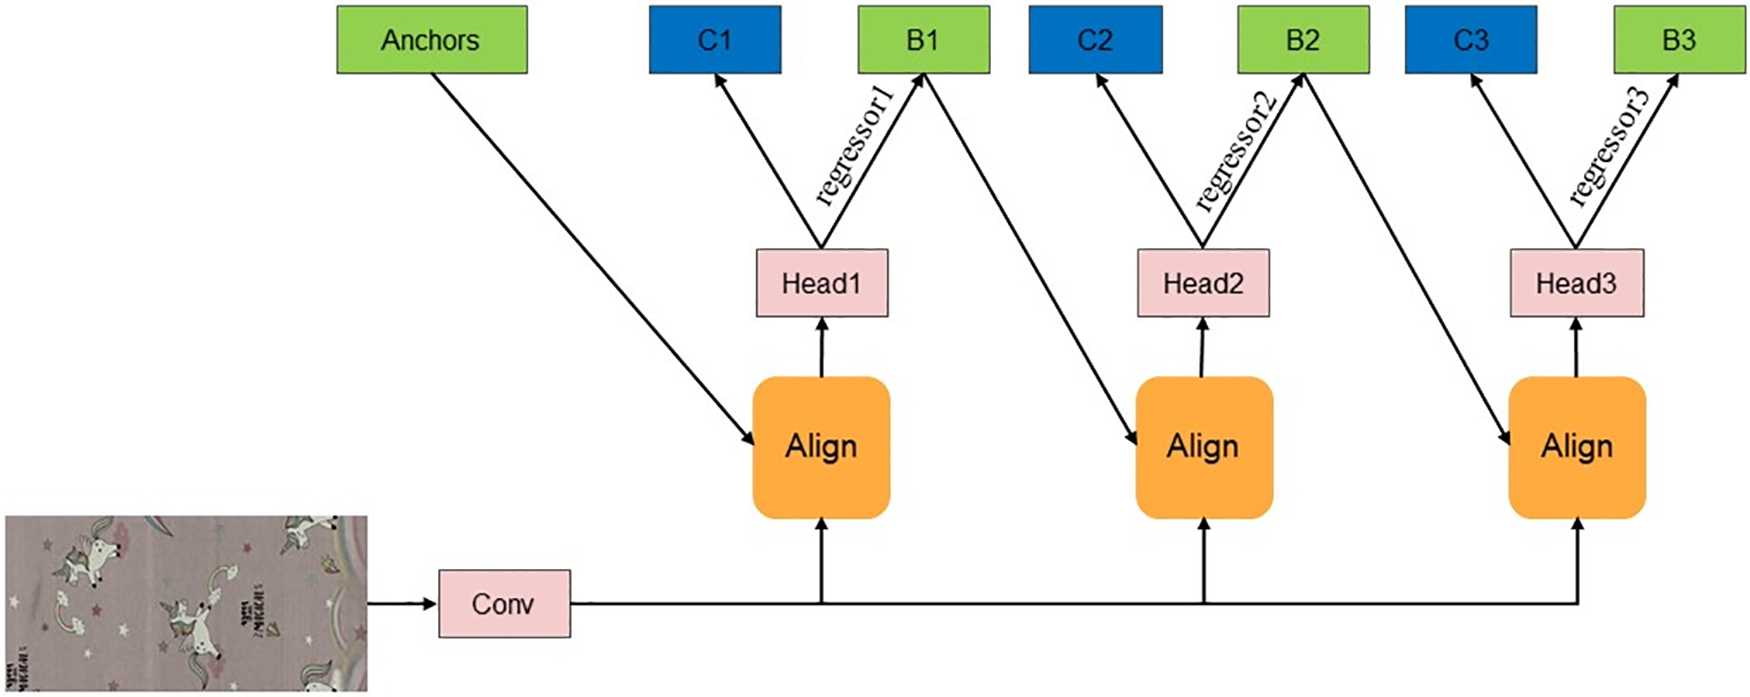
Figure 4: An improved Cascade-RCNN. Labels C1, C2 and C3 are categories, and B1, B2 and B3 are BBoxes
In Fig. 4, the regression was divided into three stages with three regressors (regressor1, regressor2 and regressor3). As shown in Eq. (5), the three detectors are trained by increasing the IOU thresholds gradually, with the different stages corresponding to different IOU thresholds. This method can help to eliminate outliers and close false positives and adapt to the new proposal distribution. The output of the previous detector is used as the input for the later higher-quality detector. In this way, we can ensure that there are sufficient positive samples on each branch to reduce overfitting. The regression function of the Cascade-RCNN can be written as:
In Eq. (5), T is the number of cascade stages, b is the data distribution of the corresponding stage, each branch
where bt is derived from the output of b1 after all branch operations and can be expressed as
In Cascade-RCNN, the role of ROI Pooling is to pool the corresponding area into a fixed-size feature map within the overall feature map based on the position coordinates of the preselected box, with subsequent classification and regression operations performed within the preselected box. The position coordinates of the preselected box obtained by regression are usually floating point numbers, and the pooled feature map requires a fixed size. Therefore, there are two quantization processes for ROI Pooling; the first is to quantify the boundaries of the candidate box into integer coordinate values, and the second is to divide the quantized boundary area into M × M units on average and quantify the coordinates of each unit. After two quantification stages, there is a certain deviation between the candidate box and the initial position of the regression process. When the fabric defect size is small, this deviation will lead to lower detection accuracy. To address this problem, ROI Align is used to replace ROI Pooling, and bilinear interpolation is used to obtain pixel values whose coordinates are floating point numbers. The candidate area is divided into M × M units such that the floating point number boundary and each unit coordinate are not quantized. Four coordinate positions are fixed in each cell—the values of these four positions are calculated by bilinear interpolation and the maximum pooling operation is then performed. The backpropagation for ROI Pooling can be expressed as:
where
where d(.) represents the distance between two points, and
To verify the effectiveness of the proposed MFDC method, this paper uses two public datasets, namely the Ali Tianchi dataset (2019 Ali Tianchi Guangdong Industrial Intelligent Manufacturing Innovation Competition dataset) and ZJU-Leaper [40], for experiments. Figs. 5 and 6 show the detailed statistics of the ZJU-Leaper and Ali Tianchi datasets, respectively.

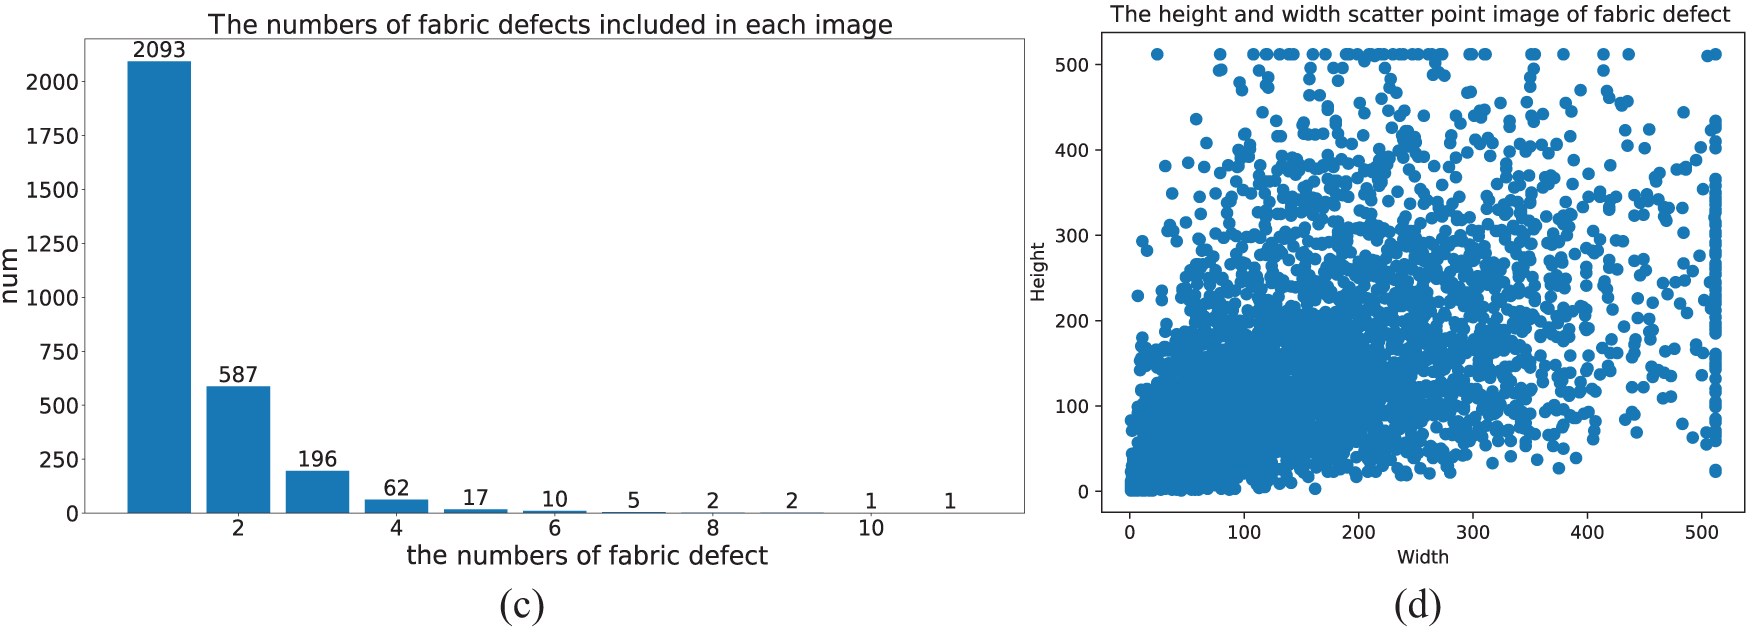
Figure 5: Data analysis (ZJU-Leaper dataset)

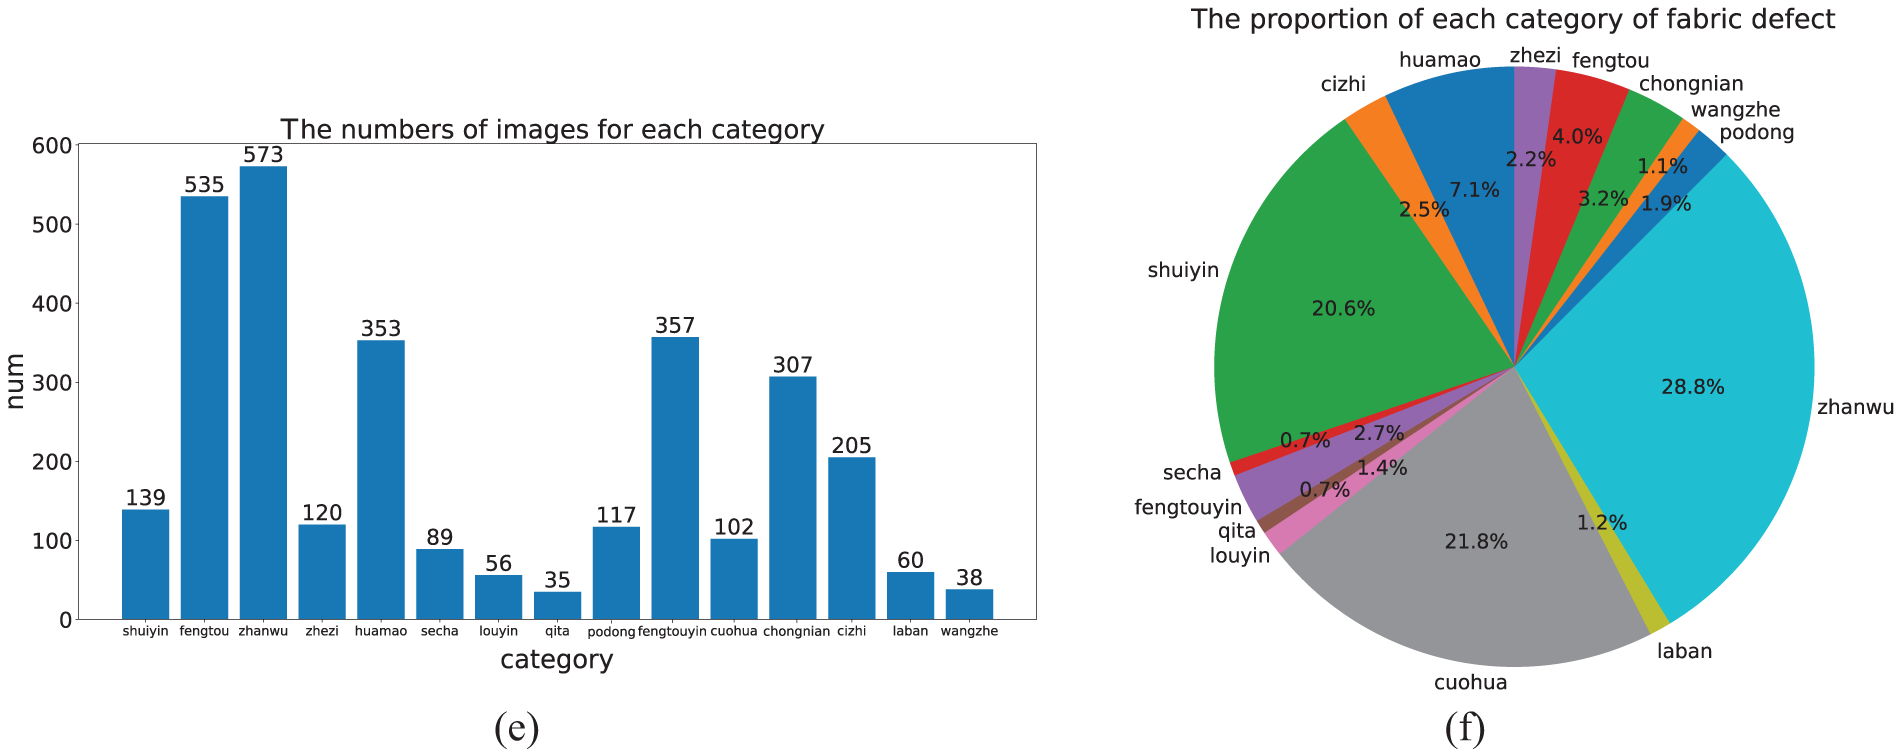
Figure 6: Data analysis (Ali Tianchi dataset)
ZJU-Leaper: Group4 of the ZJU-Leaper dataset released by Zhejiang University was used in the analysis. Group4 consists of three kinds of fabric materials, comprising 3721 defective images and 14,884 undefective images with an image resolution of 512 × 512. In our experiment, all data were randomly divided into a training set and a test set in a 4:1 ratio. Fig. 5 shows the details of the ZJU-Leaper training set. Fig. 5a shows the length–width ratio of fabric defects, and Fig. 5b shows the distribution of fabric defect area. The standard COCO dataset format is used in this paper, i.e., Small (s < 32), Medium (32 ≤ s < 96), and Large (96 ≤ s < +∞). The fabric defect area s can be expressed as:
where w and h represent the width and the height of the fabric defect, respectively. Fig. 5c shows the number of defects in the fabric images, and Fig. 5d is the height and width scatter plot of the fabric defect.
Ali Tianchi: This dataset was released by Ali company. In contrast to the ZJU-Leaper dataset, this dataset provides numerous high-resolution images with a resolution of 4096 × 1800. In addition, this dataset contains 15 fabric defect category types with more complex fabric background colors. In this paper, 3107 defective fabric images and 6000 non-defective fabric images were used, which were randomly divided into a training set and a testing set in a 4:1 ratio. The dataset statistics are shown in Fig. 6.
Fig. 6a shows the length–width ratio of fabric defects, where the horizontal axis represents the length–width ratio, and the vertical axis shows the number of images. As shown in Fig. 6, there are numerous fabric defects with length–width ratios greater than 10, which make fabric defect detection highly challenging.
Fig. 6b shows the area of the fabric defects, which is similar to that of the ZJU-Leaper dataset. Fig. 6c shows the number of fabric defects, with up to 20 defects present in each image. Fig. 6d shows the number of each category of 15 kinds of fabric defects, Fig. 6e shows the number of images showing each fabric defect type, and Fig. 6f shows a pie chart of the proportion of the various fabric defect types, illustrating that the proportion of different fabric defects varies greatly.
In the proposed MFDC model, ResNet50 is used as a backbone and pre-trained parameters in ImageNet are used for model initialization. The input images are randomly flipped and rotated for data enhancement. The learning rate of each image was set as 0.00125, the IOU thresholds were set as 0.5, 0.6, and 0.7, and the momentum factor and weight decay factor of optimization parameters were set as 0.9 and 0.0001, respectively. In this process, we hot-start the learning rate, which helps to slow down the overfitting phenomenon in the initial stages and keep the distribution stable. To accelerate the convergence speed of MFDC, the proposed network is pre-trained for a total of 20 epochs.
The IOU threshold is usually used in evaluating the performance of object detection models. When the overlap between the prediction box and the real box is greater than the IOU threshold value, the corresponding samples are called positive samples; otherwise, the samples are called negative samples. IOU can be written as:
Since the two open datasets used in the experiment include many fabric defect types, the use of visual object detection boxes alone cannot fully and objectively reflect the benefits of the MFDC model. Therefore, the common evaluation criteria of the COCO standard format data are introduced as evaluation indicators, including Precision, Recall, Accuracy (ACC) and mAP.
where FP is the number of false positive samples, FN is the number of false negative samples, TP is the number of true positive samples, and TN is the number of true negative samples. In the fabric defect detection algorithm, these indexes cannot independently evaluate the detection performance; therefore, we introduce the average precision (AP) index, which can be written as:
where R stands for recall, P stands for precision, and AP is the curve integral of P(R). To more comprehensively verify the detection performance of the proposed MFDC, the average of
To demonstrate the superiority of the proposed MFDC algorithm, this paper uses two common evaluation indicators (mAP and ACC) to estimate the performance of the MFDC. The proposed MFDC is compared with two advanced defect detection-based algorithms (Faster-RCNN and Cascade-RCNN). Fig. 7 shows the training process of the three algorithms on the Ali Tianchi dataset. In Fig. 7a, the vertical axis shows the mAP value, which ranges from 0 to 1, and the horizontal axis shows the training time; the total training process is 20 epochs. As shown in Fig. 7, the average mAP of MFDC is 0.52, which is much higher than both Faster-RCNN and Cascade-RCNN. A similar conclusion can be drawn from Fig. 8a.
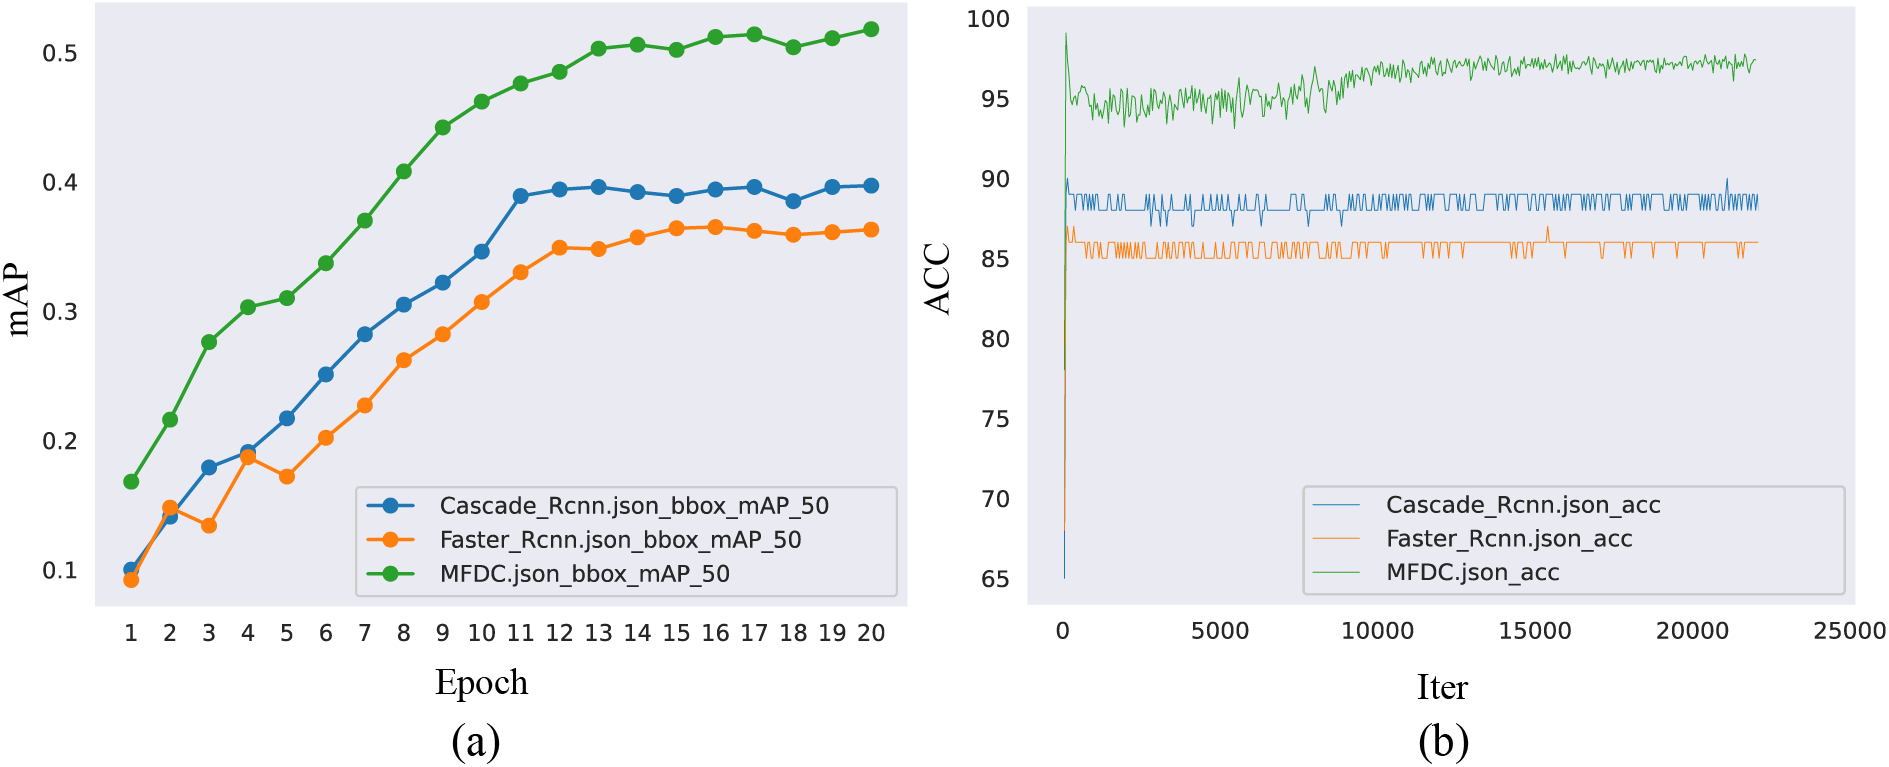
Figure 7: Comparison of experimental results of Ali Tianchi
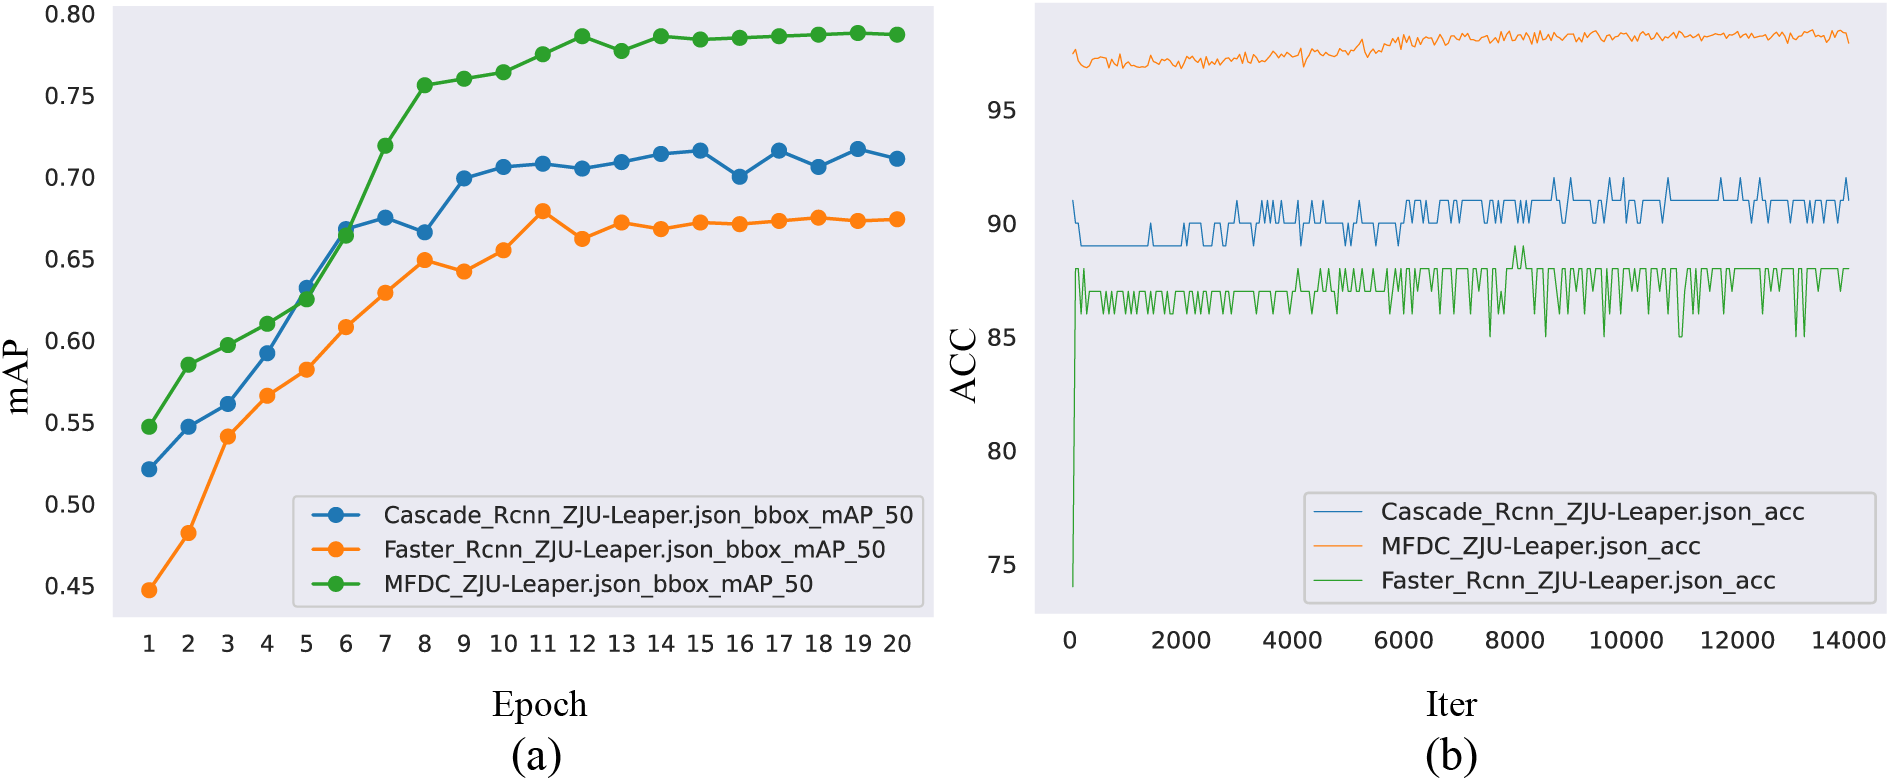
Figure 8: Comparison of experimental results of ZJU-Leaper
The ACC values range from 0 to 100. In Fig. 7b, the vertical axis shows the ACC value and the horizontal axis shows the number of iterations in the training phase. In Fig. 7, the average ACC of the MFDC algorithm is 97; this algorithm thus achieves higher ACC values than those of Faster-RCNN and Cascade-RCNN. Similar conclusions can be obtained from Fig. 8. As shown in Figs. 7 and 8, MFDC has a stronger defect detection ability.
To further demonstrate the effectiveness of the proposed FAMDC algorithm, a series of ablation experiments were conducted using three algorithms, namely multi-layer feature extraction, deformable convolution module, and the improved Cascade-RCNN. Here, we report the mean of the five results. The evaluation of these ablation experiments was performed using the Ali Tianchi and ZJU-Leaper datasets.
As shown in Table 1, on the Ali Tianchi dataset, we use Cascade-RCNN as a benchmark for comparison. For the Cascade-RCNN+A approach, multi-layer feature extraction improves the detection capability of multi-scale fabric defects by combining the semantic features of the upper and lower layers, especially in terms of the detection capability of small defects. The mAP(S) and mAP indices are improved by 0.111 and 0.061, respectively. For Cascade-RCNN+A+B, deformable convolution is applied to enhance the generalization ability when dealing with complex shape defects, and the mAP is increased by 0.033. For MFDC, the improved Cascade-RCNN is added to enhance the adaptability of the defect detection algorithm in complex pattern backgrounds. In this instance, the mAP(S) and mAP indices are improved by 0.036 and 0.024, respectively. As shown in Table 1, similar conclusions can be drawn for the ZJU-Leaper dataset.
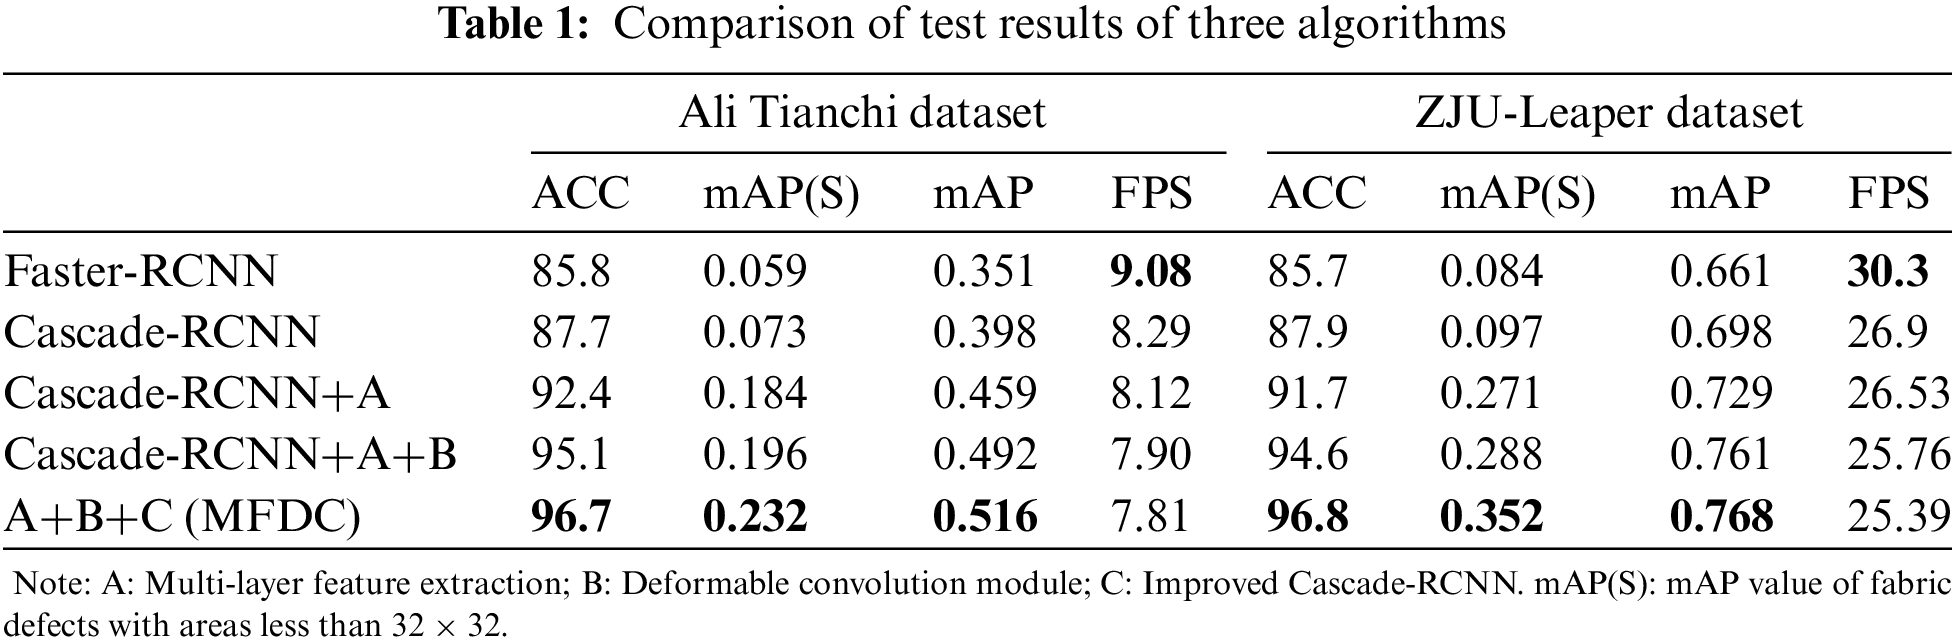
Table 1 indicates the proposed MFDC achieves significantly better mAP and ACC indices than the other two compared algorithms. In terms of the running time of the compared methods, on the Ali Tianchi dataset, MFDC achieves 7.81 FPS, a value that is 0.48 FPS and 1.27 FPS slower than the Cascade-RCNN and Faster-RCNN algorithms, respectively. On the ZJU-Leaper dataset, MFDC achieves a speed of 24.39 FPS, a value that is 0.11 FPS and 5.91 FPS slower than Cascade-RCNN and Faster-RCNN, respectively. By comparing the evaluation indexes of the training set and test set on two public datasets, our results show that the MFDC algorithm can greatly improve mAP and ACC with a small increase in calculation time. Therefore, the MFDC algorithm has significant advantages in terms of its average fabric detection accuracy and its ability to correctly identify whether fabric images contain defects.
Some typical visual results of fabric defect detection by different methods are shown in Fig. 9. The detection is divided into two parts: one part is the fabric defect type, and the other is a numerical expression of the algorithm’s confidence, as expressed by values ranging from 0 to 1. For easy to compare, Fig. 9 is artificially enlarged locally.

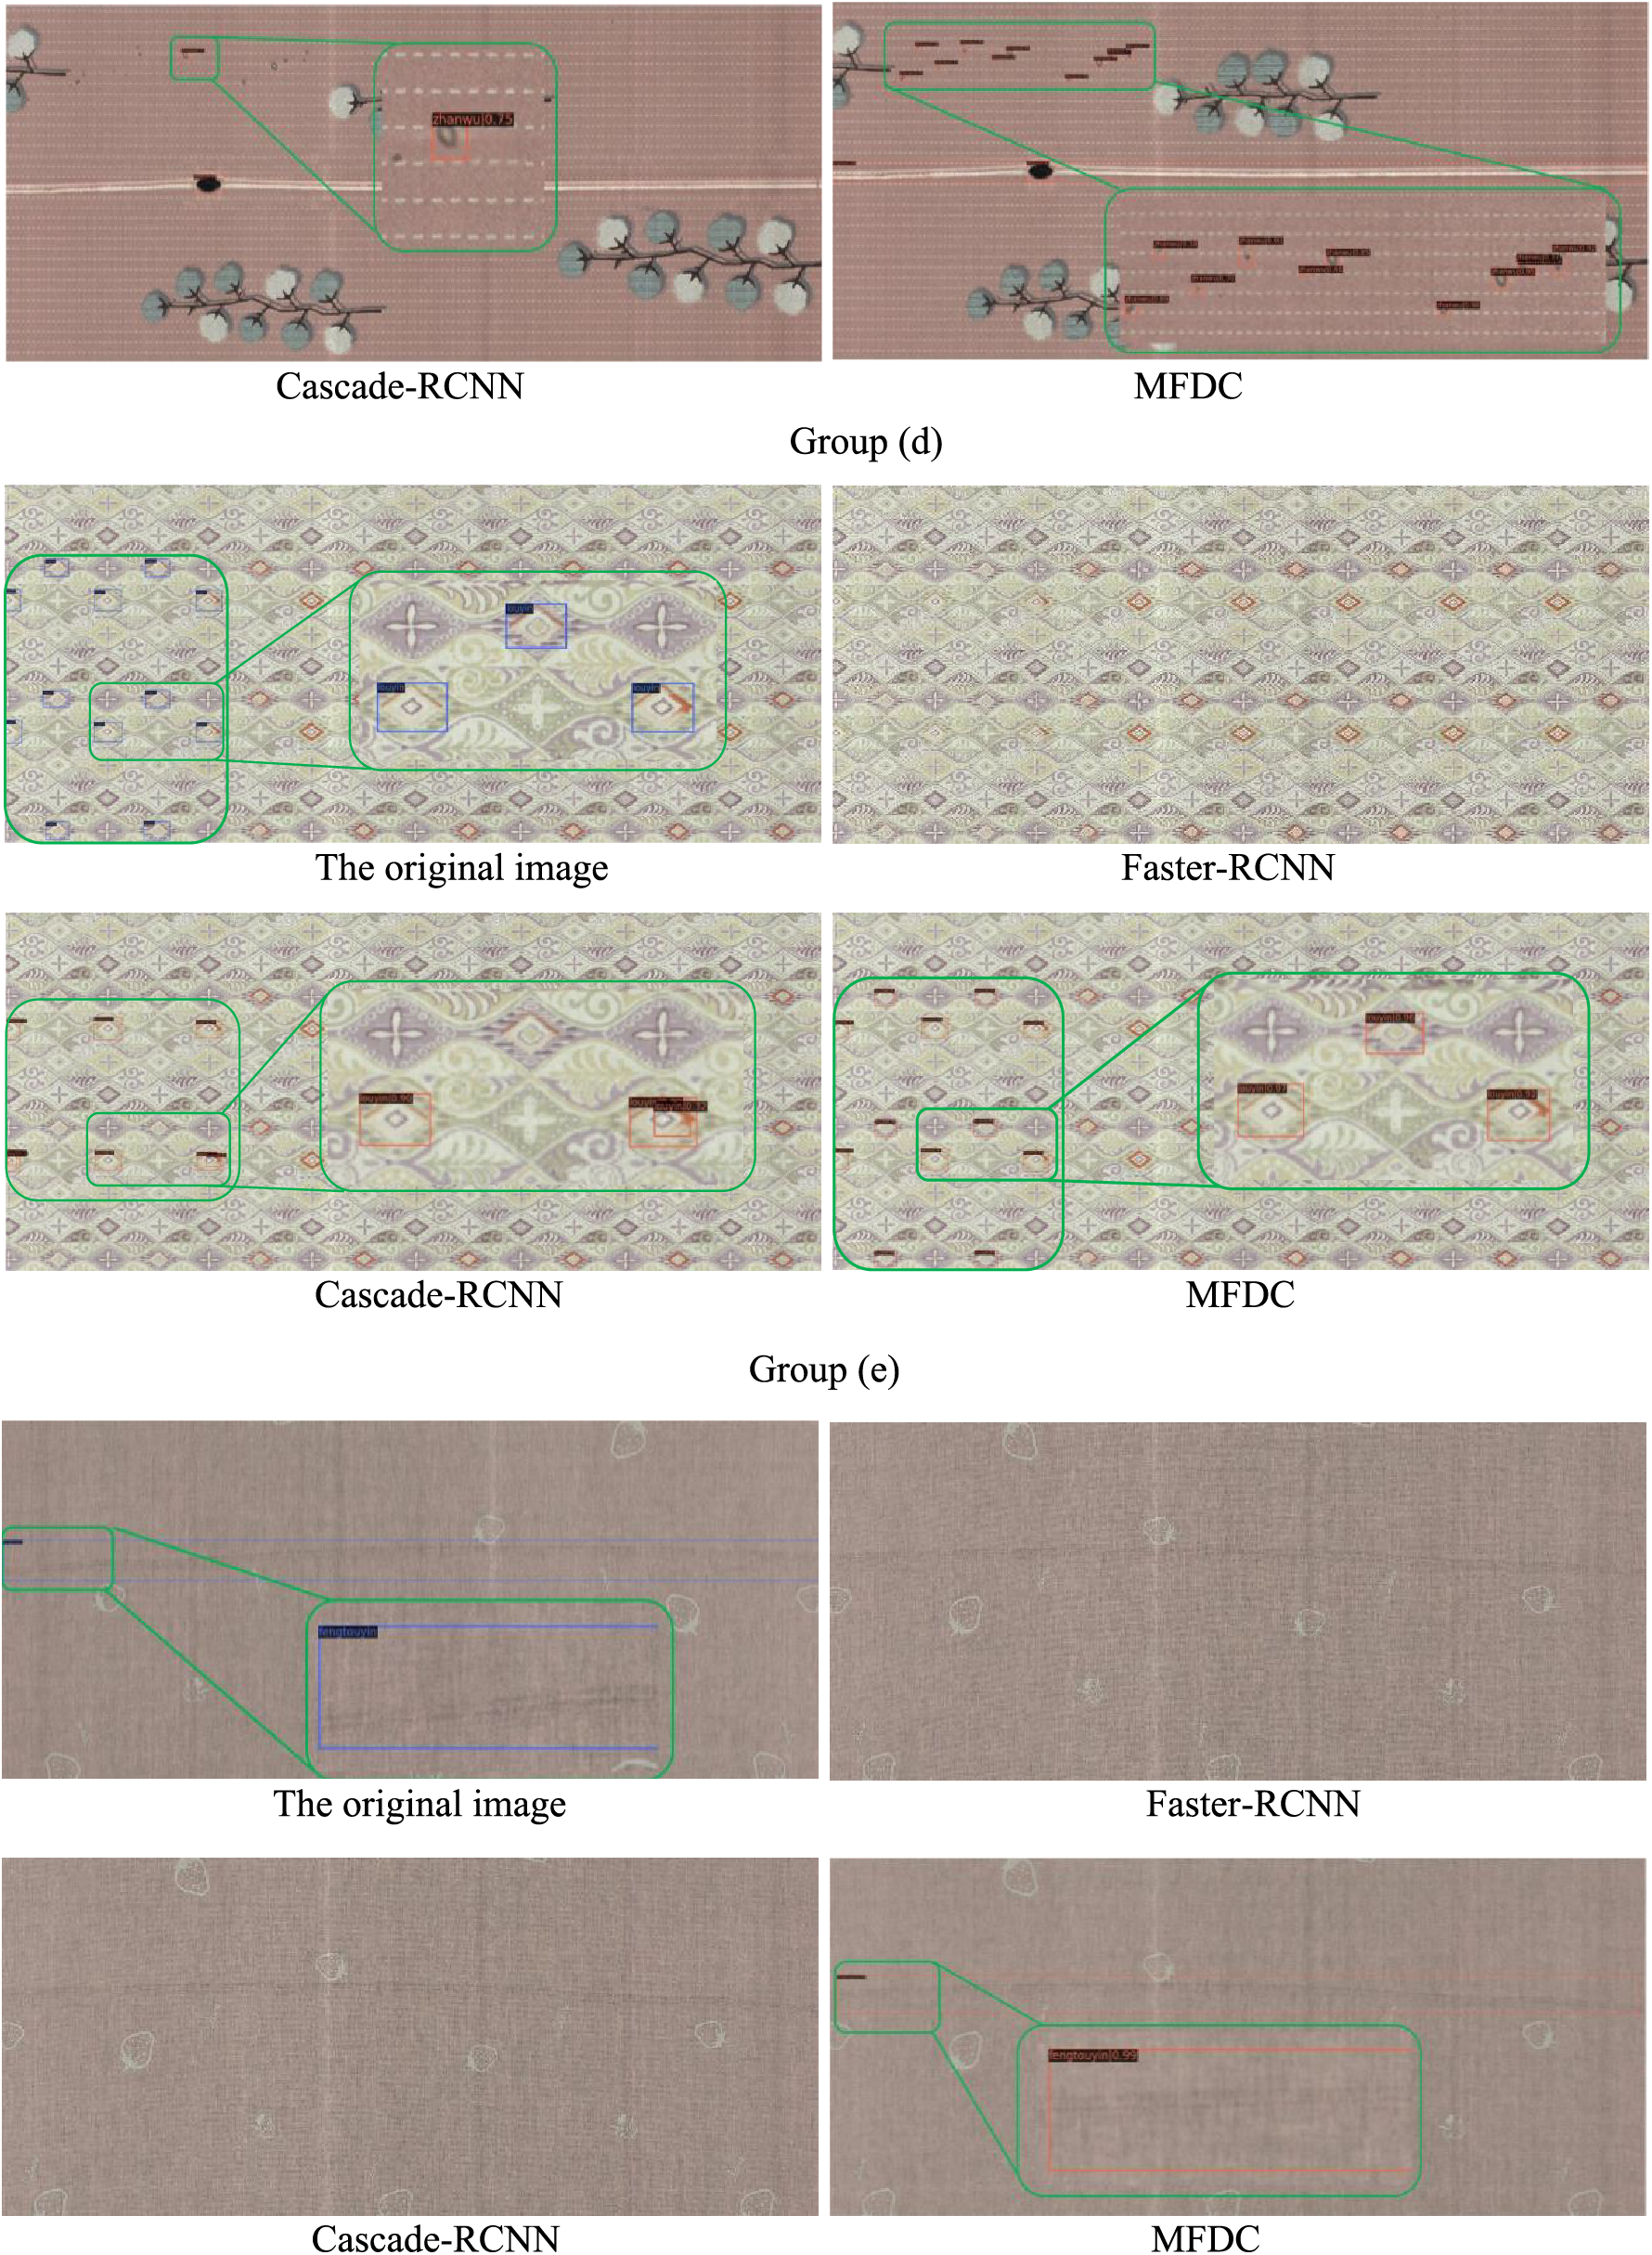
Figure 9: Visual comparison of experimental results
Fig. 9a shows a fabric image with a complex background. The results show that all the algorithms can detect large-sized defects. The Faster-RCNN algorithm fails to detect the small defect due to the high degree of integration between the defect and the fabric background. Although Cascade-RCNN can detect the small defect, its confidence level is 0.47, indicating that Cascade-RCNN has a relatively weak learning ability for such defects. The proposed MFDC algorithm can identify small defects with a much higher confidence level of 0.9; therefore, MFDC has a stronger ability to detect fabric defects against complex backgrounds.
In Fig. 9b, the defects are similar to the background of the fabric itself in both color and pattern. In this instance, Faster-RCNN only identifies one defect. Cascade-RCNN detects the leftmost and rightmost fabric defects but has serious overlapping of the detection frames, the pattern in the middle of the fabric image was wrongly detected, and the two fabric defects on the right of the fabric image are missed. The MFDC can accurately detect the two defects on the right side that are similar to the background color but can also identify the fabric defects on the fabric pattern accurately without obvious overlap box phenomenon. This outcome indicates that MFDC has a stronger detection ability for close false positions and can additionally detect fabric defects that are difficult to recognize with the naked eye.
Fig. 9c contains various scales and types of fabric defects. Faster-RCNN only detects one obvious stained defect and misses all other defects. The Cascade-RCNN algorithm detects a defect in the middle of the image and a relatively small, stained defect in the upper part and misses all other defects. The MFDC method detects most of the small fabric defects accurately, a with confidence value exceeding 0.7 in some cases. In addition, MFDC can detect fabric defects with extreme aspect ratio in the middle of the image. Similar conclusions can be drawn from Fig. 9e.
The defect in Fig. 9d involves missing printing. The shape of this type of defect is usually complex. The same background pattern has a high degree of randomness and is usually mixed with other patterns of the fabric’s background. As shown in Fig. 9d, the Faster-RCNN algorithm cannot detect any defects. Cascade-RCNN only detects defects at four positions with low confidence, with a severe overlap of frames. In contrast, the MFDC algorithm detects all defects with a confidence level of around 0.9; therefore, MFDC has a stronger detection ability for defects with complex shapes.
This paper presents a multi-layer feature extraction method combined with deformable convolution (MFDC) for fabric defect detection. Using ResNet50 as a backbone network, a multi-layer feature extraction approach is applied to improve the detection effect of multi-scale fabric defects, and deformable convolution is incorporated to detect irregularly shaped fabric defects. By integrating RoiAlign with Cascade-RCNN, close false positives are reduced through the continuously enhanced IOU threshold, and the detection accuracy is significantly improved. This study’s experimental results show that the proposed MFDC algorithm can greatly improve detection accuracy, at the expense of a small increase in detection time, and achieve better mAP and ACC indicator indices compared to other similar algorithms.
The MFDC proposed in this paper needs enough labeled data as training samples to obtain good defect detection performance. However, in practical industrial applications, obtaining high-quality labels can be a bottleneck, due to the time consuming and expensive annotation process. Therefore, the detection performance of MFDC will decrease with the insufficient data samples. In the future, this method will integrate an end-to-end semi-supervised detection framework to make it have better defect detection performance.
Acknowledgement: The authors express their heartfelt thanks to the supervisor for his direction and unwavering support during this study.
Funding Statement: This work was supported in part by the National Science Foundation of China under Grant 62001236, in part by the Natural Science Foundation of the Jiangsu Higher Education Institutions of China under Grant 20KJA520003.
Author Contributions: The authors confirm contribution to the paper as follows: Study conception and design: Jielin Jiang, Chao Cui; data collection: Chao Cui, Xiaolong Xu; analysis and interpretation of results: Jielin Jiang, Chao Cui, Yan Cui; draft manuscript preparation: Chao Cui, Jielin Jiang. All authors reviewed the results and approved the final version of the manuscript.
Availability of Data and Materials: Due to the nature of this research, participants of this study did not agree for their data to be shared publicly, so supporting data is not available.
Conflicts of Interest: The authors declare that they have no conflicts of interest to report regarding the present study.
References
1. Y. S. Normuminovich, A. F. Payziyevna, and A. N. Azimdjanovna, “Analysis of the effectiveness of the textile industry,” J. Hunan Univ. (Natural Sci. Ed.), vol. 48, no. 12, pp. 1587–1597, 2021. [Google Scholar]
2. J. Wu et al., “Automatic fabric defect detection using a wide-and-light network,” Appl. Intell., vol. 51, no. 7, pp. 4945–4961, 2021. doi: 10.1007/s10489-020-02084-6. [Google Scholar] [CrossRef]
3. H. P. Liu, “Research on nonwoven fabric defect online detection system using machine vision,” M.S. thesis, Huazhong University of Science and Technology, China, 2015. [Google Scholar]
4. R. N. Bracewell and R. N. Bracewell, The Fourier Transform and its Applications. NY, USA: McGraw-Hill, 1986. [Google Scholar]
5. J. L. Raheja, S. Kumar, and A. Chaudhary, “Fabric defect detection based on GLCM and Gabor filter: A comparison,” Optik, vol. 124, no. 23, pp. 6469–6474, 2013. doi: 10.1016/j.ijleo.2013.05.004. [Google Scholar] [CrossRef]
6. X. Wang, Y. Zhou, and C. Zhao, “Heart-rate analysis of healthy and insomnia groups with detrended fractal dimension feature in edge,” Tsinghua Sci. Technol., vol. 27, no. 2, pp. 325–332, 2021. doi: 10.26599/TST.2021.9010030. [Google Scholar] [CrossRef]
7. X. Xu et al., “Game theory for distributed IoV task offloading with fuzzy neural network in edge computing,” IEEE Trans. Fuzzy Syst., vol. 30, no. 11, pp. 4593–4604, 2022. doi: 10.1109/TFUZZ.2022.3158000. [Google Scholar] [CrossRef]
8. X. Xu, H. Tian, X. Zhang, L. Qi, Q. He, and W. Dou, “DisCOV: Distributed COVID-19 detection on X-ray images with edge-cloud collaboration,” IEEE Trans. Serv. Comput., vol. 15, no. 3, pp. 1206–1219, 2022. doi: 10.1109/TSC.2022.3142265. [Google Scholar] [CrossRef]
9. L. Qi, Y. Liu, Y. Zhang, X. Xu, M. Bilal, and H. Song, “Privacy-aware point of interest category recommendation in internet of things,” IEEE Internet Things J., vol. 9, no. 21, pp. 21398–21408, 2022. doi: 10.1109/JIOT.2022.3181136. [Google Scholar] [CrossRef]
10. Y. Liu et al., “A long short-term memory-based model for greenhouse climate prediction,” Int. J. Intell. Syst., vol. 37, no. 1, pp. 135–151, 2022. doi: 10.1002/int.22620. [Google Scholar] [CrossRef]
11. L. Qi, W. Lin, X. Zhang, W. Dou, X. Xu, and J. Chen, “A correlation graph based approach for personalized and compatible web APIs recommendation in mobile APP development,” IEEE Trans. Knowl. Data Eng., vol. 34, no. 4, 2022. doi: 10.1109/TKDE.2022.3168611. [Google Scholar] [CrossRef]
12. K. Simonyan and A. Zisserman, “Very deep convolutional networks for large-scale image recognition,” arXiv preprint arXiv:1409.1556, vol. 2014, pp. 1409–1556, 2014. [Google Scholar]
13. Z. Zhao, P. Zheng, S. Xu, and X. Wu, “Object detection with deep learning: A review,” IEEE Trans. Neural Netw. Learn. Syst., vol. 30, no. 11, pp. 3212–3232, 2019. doi: 10.1109/TNNLS.2018.2876865. [Google Scholar] [PubMed] [CrossRef]
14. M. Haque, M. Murshed, and M. Paul, “On stable dynamic background generation technique using Gaussian mixture models for robust object detection,” in Proc. IEEE Fifth Int. Conf. Adv. Video Sig. Based Surveill., Washington, DC, USA, 2008, pp. 41–48. [Google Scholar]
15. C. Stauffer and W. Grimson, “Adaptive background mixture models for real-time tracking,” in Proc. IEEE Comput. Soc. Conf. Comput. Vis. Pattern Recognit., Fort Collins, CO, USA, 1999, pp. 246–252. [Google Scholar]
16. D. K. Yadav and K. Singh, “A combined approach of kullback-leibler divergence and background subtraction for moving object detection in thermal video,” Infrared Phys. Technol., vol. 76, no. 8, pp. 21–31, 2016. doi: 10.1016/j.infrared.2015.12.027. [Google Scholar] [CrossRef]
17. M. Kumar, S. Ray, and D. Yadav, “Moving human detection and tracking from thermal video through intelligent surveillance system for smart applications,” Multimed. Tools, vol. 81, no. 18, pp. 1–20, 2022. [Google Scholar]
18. L. Sharma and D. Yadav, “Histogram-based adaptive learning for background modelling: Moving object detection in video surveillance,” Int. J. Telemed. Clin. Pract., vol. 2, no. 1, pp. 74–92, 2017. doi: 10.1504/IJTMCP.2017.082107. [Google Scholar] [CrossRef]
19. A. Buades, B. Coll, and J. Morel, “A review of image denoising algorithms, with a new one,” Multiscale Model. Simul., vol. 4, no. 2, pp. 490–530, 2005. doi: 10.1137/040616024. [Google Scholar] [CrossRef]
20. R. Girshick, “Fast R-CNN,” in Proc. IEEE Int. Conf. Comput. Vis., Santiago, Chile, 2015, pp. 1440–1448. [Google Scholar]
21. A. Abouelela, H. M. Abbas, H. Eldeeb, A. Wahdan, and S. M. Nassar, “Automated vision system for localizing structural defects in textile fabrics,” Pattern Recognit. Lett., vol. 26, no. 10, pp. 1435–1443, 2005. doi: 10.1016/j.patrec.2004.11.016. [Google Scholar] [CrossRef]
22. G. Hu, Q. Wang, and G. H. Zhang, “Unsupervised defect detection in textiles based on fourier analysis and wavelet shrinkage,” Appl. Opt., vol. 54, no. 10, pp. 2963–2980, 2015. doi: 10.1364/AO.54.002963. [Google Scholar] [PubMed] [CrossRef]
23. V. Karlekar, M. S. Biradar, and K. B. Bhangale, “Fabric defect detection using wavelet filter,” in Proc. Int. Conf. Comput. Commun. Control Autom., Jeju Island, Republic of Korea, 2015, pp. 712–715. [Google Scholar]
24. D. Zhu, R. Pan, W. D. Gao, and J. Zhang, “YARN-DYED fabric defect detection based on auto correlation function and GLCM,” Autex Res. J., vol. 15, no. 3, pp. 226–232, 2015. doi: 10.1515/aut-2015-0001. [Google Scholar] [CrossRef]
25. V. S. Thakare and N. N. Patil, “Classification of texture using gray level co-occurrence matrix and self-organizing map,” in Proc. Int. Conf. Electron. Syst. Sig. Process. Comput. Technol., Poznan, Poland, 2014, pp. 350–355. [Google Scholar]
26. W. Liu et al., “SSD: Single shot multibox detector,” in Proc. European Conf. Comput. Vis., Amsterdam, Netherlands, 2016, pp. 21–37. [Google Scholar]
27. J. Redmon, S. Divvala, R. Girshick, and A. Farhadi, “You Only Look Once: Unified, real-time object detection,” in Proc. IEEE Conf. Comput. Vis. Pattern Recognit., Las Vegas, NV, USA, 2016, pp. 779–788. [Google Scholar]
28. L. Li, “Research on fabric defect detection method based on convolutional neural network,” M.S. thesis, Huazhong University of Science and Technology, China, 2019. [Google Scholar]
29. S. Hershey et al., “CNN architectures for large-scale audio classification,” in Proc. IEEE Int. Conf. Acoust. Speech Sig. Process., LA, USA, 2017, pp. 131–135. [Google Scholar]
30. Z. Y. Zhao, “Research on recognition and detection of textile defects based on deep learning,” M.S. thesis, Huazhong University of Science and Technology, 2019. [Google Scholar]
31. S. Ren, K. He, R. Girshick, and J. Sun, “Faster R-CNN: Towards real-time object detection with region proposal networks,” IEEE Trans. Pattern Anal. Mach. Intell., vol. 39, no. 6, pp. 1137–1149, 2017. doi: 10.1109/TPAMI.2016.2577031. [Google Scholar] [PubMed] [CrossRef]
32. J. Yang, X. Fu, Y. Hu, Y. Huang, X. Ding and J. Paisley, “PanNet: A deep network architecture for pan-sharpening,” in Proc. IEEE Int. Conf. Comput. Vis., Venice, Italy, 2017, pp. 1753–1761. [Google Scholar]
33. K. He, X. Zhang, S. Ren, and J. Sun, “Spatial pyramid pooling in deep convolutional networks for visual recognition,” IEEE Trans. Pattern Anal. Mach. Intell., vol. 37, no. 9, pp. 1904–1916, 2015. doi: 10.1109/TPAMI.2015.2389824. [Google Scholar] [PubMed] [CrossRef]
34. D. Misra, “Mish: A self regularized non-monotonic neural activation function,” arXiv preprint arXiv:1908.08681, vol. 4, no. 2, pp. 10–48550, 1908. [Google Scholar]
35. A. M. Hafiz, “K-nearest neighbour and support vector machine hybrid classification,” arXiv preprint arXiv:2007.00045, vol. 19, no. 4, pp. 33–41, 2020. [Google Scholar]
36. S. Huang, X. Li, Z. Jiang, X. Guo, and A. Men, “Hyper feature fusion pyramid network for object detection,” in Proc. IEEE Int. Conf. Multimed. Expo Workshops, San Diego, CA, USA, 2018, pp. 1–6. [Google Scholar]
37. J. Dai et al., “Deformable convolutional networks,” in Proc. IEEE Int. Conf. Comput. Vis., Las Vegas, NV, USA, 2017, pp. 764–773. [Google Scholar]
38. Z. Cai and N. Vasconcelos, “Cascade RCNN: Delving into high quality object detection,” in Proc. IEEE Conf. Comput. Vis. Pattern Recognit., Salt, USA, 2018, pp. 6154–6162. [Google Scholar]
39. T. Y. Lin, P. Dollár, R. Girshick, K. He, B. Hariharan and S. Belongie, “Feature pyramid networks for object detection,” in Proc. IEEE Conf. Comput. Vis. Pattern Recognit., HI, USA, 2017, pp. 2117–2125. [Google Scholar]
40. C. Zhang, S. Feng, X. Wang, and Y. Wang, “ZJU-Leaper: A benchmark dataset for fabric defect detection and a comparative study,” IEEE Trans. Artif. Intell., vol. 1, no. 3, pp. 219–232, 2020. doi: 10.1109/TAI.2021.3057027. [Google Scholar] [CrossRef]
Cite This Article
 Copyright © 2024 The Author(s). Published by Tech Science Press.
This work is licensed under a Creative Commons Attribution 4.0 International License , which permits unrestricted use, distribution, and reproduction in any medium, provided the original work is properly cited.
 Downloads
 Citation Tools