
 Submit a Paper
 Propose a Special lssue
 Open Access
ARTICLE

Multi-Scale Location Attention Model for Spatio-Temporal Prediction of Disease Incidence
1 College of Computer, National University of Defense Technology, Changsha, 410073, China
2 Technical Service Center for Vocational Education, National University of Defense Technology, Changsha, 410073, China
3 School of Computing and Communications, Lancaster University, Lancaster, LA1 4WA, UK
* Corresponding Author: Zhiping Cai. Email:
Intelligent Automation & Soft Computing 2024, 39(3), 585-597. https://doi.org/10.32604/iasc.2023.030221
Received 21 March 2022; Accepted 15 June 2022; Issue published 11 July 2024
 View Full Text
 Download PDF
Abstract
Due to the increasingly severe challenges brought by various epidemic diseases, people urgently need intelligent outbreak trend prediction. Predicting disease onset is very important to assist decision-making. Most of the existing work fails to make full use of the temporal and spatial characteristics of epidemics, and also relies on multivariate data for prediction. In this paper, we propose a Multi-Scale Location Attention Graph Neural Networks (MSLAGNN) based on a large number of Centers for Disease Control and Prevention (CDC) patient electronic medical records research sequence source data sets. In order to understand the geography and timeliness of infectious diseases, specific neural networks are used to extract the geography and timeliness of infectious diseases. In the model framework, the features of different periods are extracted by a multi-scale convolution module. At the same time, the propagation effects between regions are simulated by graph convolution and attention mechanisms. We compare the proposed method with the most advanced statistical methods and deep learning models. Meanwhile, we conduct comparative experiments on data sets with different time lengths to observe the prediction performance of the model in the face of different degrees of data collection. We conduct extensive experiments on real-world epidemic-related data sets. The method has strong prediction performance and can be readily used for epidemic prediction.Keywords
Infectious diseases so far are still one of the diseases that seriously endanger human health [1,2]. Especially in recent years, various new infectious diseases have emerged, such as Corona Virus Disease 2019 (COVID-19) [1], severe acute respiratory syndrome, and highly pathogenic avian influenza [2]. Therefore, it poses a higher challenge to the prevention and control of infectious diseases in the 21st century.
However, it is difficult for doctors to determine the outbreak trend of infectious diseases in a region through limited data. One reason is that the case data and information between different hospitals are usually not shared, so less data is used for analysis [3]. Another reason is that accurate outbreak trend prediction requires considerable clinical expertise and years of experience [4]. For some emerging infectious diseases, it is challenging for doctors to predict the outbreak trend. In the regions and countries where expert doctors are lacking, human predictions are difficult to meet the needs of disease surveillance. In addition, the security of medical data sharing is also challenging [3].
Therefore, for infectious diseases such as influenza, it is urgent to build an intelligent outbreak prediction method. Early prediction of infectious diseases provides the best opportunities for timely intervention and resource distribution [5]. It not only helps the health care department to prepare the corresponding vaccine in time but also would alleviate the financial burden. In addition, it is possible to predict whether the incidence of infectious diseases has reached the highest point so that the auxiliary policy can be dynamically adjusted.
However, most models [6–14] require a large number of multivariate data sets to train, but the data of various hospitals are often not sufficient. In addition, information such as weather, and geography is not integrated with the data set of the Centers for Disease Control and Prevention. On the other hand, because of the privacy of the patient’s medical record, the data between hospitals usually do not make unified standardization and are also not allowed for information sharing.
Recently, some researchers [15–18] have attempted to use time-series data to predict. For instance, IeRNN [16] simulates time information by propagating the power model. And Long Short-Term Memory (LSTM) [19,20] is used to extract space information. However, there is still no sufficient consideration of time and spatial properties enhanced predictions.
• Therefore, such a research challenge remains: how to use a small amount of data to predict the incidence of infectious diseases in different regions? In this paper, we propose the MSLAGNN. In summary, it contributes to the community in the following aspects.
• We propose a depth learning framework that combines graph neural networks with attention mechanisms. Based on the time and space of infectious diseases, the model is used for the prediction of infectious disease incidence.
• We conduct morbidity prediction experiments in patients with infectious diseases such as epidemic colds and Hand-Foot-Mouth Disease (HFMD). The results show that this method is better than the baseline method under the evaluation indicator, especially when the processing data is set. In addition to the popular cold, in order to verify the applicability of different clinical tasks on different data sets on different data sets, we also predict the incidence of hand and foot disease. A large number of experiments show that the prediction of the disease monitoring and the number of incidences can be conducive to judging the risk and explosive period of infectious diseases.
• As proof of this framework to assist in infectious disease monitoring, we also build an interface for the short-term forecast of infectious diseases, which can reveal the number of new diseases in various regions.
The remainder of this paper is organized as follows. Section 2 reviews machine learning and depth learning methods recently predicted in infectious diseases. In Section 3, the problem and model prediction targets for this paper are set forth. Section 4 introduces the analysis method for designing predictive models. Section 5 shows and discusses the results of the experiment. Section 6 concludes the paper.
2.1 Infectious Disease Prediction
In many studies, the number of infectious diseases predictions is expressed as a time series regression problem, wherein the self-return model is widely used. Qi et al. [7] adopted a SARFIMA model that simultaneously considers short memory and a long memory for hemorrhagic fever complicated with renal syndrome (HFRS) sequences to fit and predict. In addition, the propagation of the dynamic model of infectious diseases is predicted. Wang et al. [8] expanded the classic standardized incidence ratio (SIR) model of infectious disease propagation to consider the time-dependent parameters, including diffusion rates. Time-dependent explains the changing characteristics of the detection, quarantine, and treatment regimen, and the diffusion rate contains the floating population. Zou et al. [9] proposed a new epidemic model (SUEIR) to predict the spread of new crown viruses-19, including the diagnosed cases and death cases at the US and state levels. It considers the unpredictable/unreported COVID-19 cases and training through the machine learning algorithm based on the historical data report.
2.2 Infectious Disease Prediction Based on Deep Learning
Due to the lack of reporting and delay, it is difficult to take action on infectious diseases. Recently, in consideration of large data forecasting, infectious diseases are predicted by optimizing the parameters of the depth learning algorithm. When three infectious diseases are predicted in the next week, Chae et al. [4] compared the performance of the depth neural network (DNN) and LSTM learning model and self-regression integrated mobile average (ARIMA) learning model. The prediction method based on deep learning is more excellent.
Ma et al. [10] proposed a migration learning framework DistCare, which utilizes existing public online electronic diseases to improve the prognosis of new infectious diseases in hospitals. It learning to embed new crown virus-related medical characters based on a large number of existing electronic medical records. Through imitation teacher model, more comprehensive learning data. In addition, there is a model to relies on more diverse data to achieve higher precision rates. SAAIM [11] uses multi-source electronic data, including the history of China’s Chongqing influenza disease, weather data, Baidu search index, and Sina Weibo data to predict the Chongqing influenza-like illness (ILI). Retrospective transverse surface regression analysis evaluation temperature and relative humidity on new crown virus-19 cross-community spread. However, such multivariate data is difficult to accurately acquire and has limitations.
Time and space prediction (such as people flow forecast) is of great significance in intelligent urban applications such as urban planning, intelligent transportation, and public safety. The large death case data behind infectious diseases indicates the importance of infectious diseases protection and prediction. At the same time, the occurrence and spread of infectious diseases have strong geographical and timeliness, for example, influenza will run periodically in a certain region. Nuraini et al. [15] proposed a SiQRD model that predicts the spatial and space evolution of Germany in the resolution of the county and the city and accurately predicts the accumulated infection and death of each county. On the other hand, some researchers consider the time characteristics and spatial features of infectious disease propagation and then combine the two features. Li et al. [16] developed an integrated time and space model based on epidemic differential equation (SIR) and recursive neural network (RNN). The former is simplified and discrete is a compact model of a regional time infection trend, and the latter is the most recent neighbor area, impact model. The latter captures potential spatial information. Deng et al. [17] designed a chart nerve network based on the intersection, combined with graphical structures (such as geographic location) and time sequence features (such as time series) during dynamic propagation, for learning embedded in long-term ILI prediction time series.
Many infectious diseases spread fast, and they need to monitor the number of people in the hospital. In addition, due to the characteristics of infectious diseases, the number of patients increases during the peak period, and the hospital’s medical resources are not necessarily sufficient. It is predicted that the number of incidents in various regions can help assess the peak period of the disease in the peak period in order to make a response measures. In addition, it is also crucial to hospital scheduling and resource management. We officially define our research issues and provide a list of symbols used in MSLAGNN in Table 1.
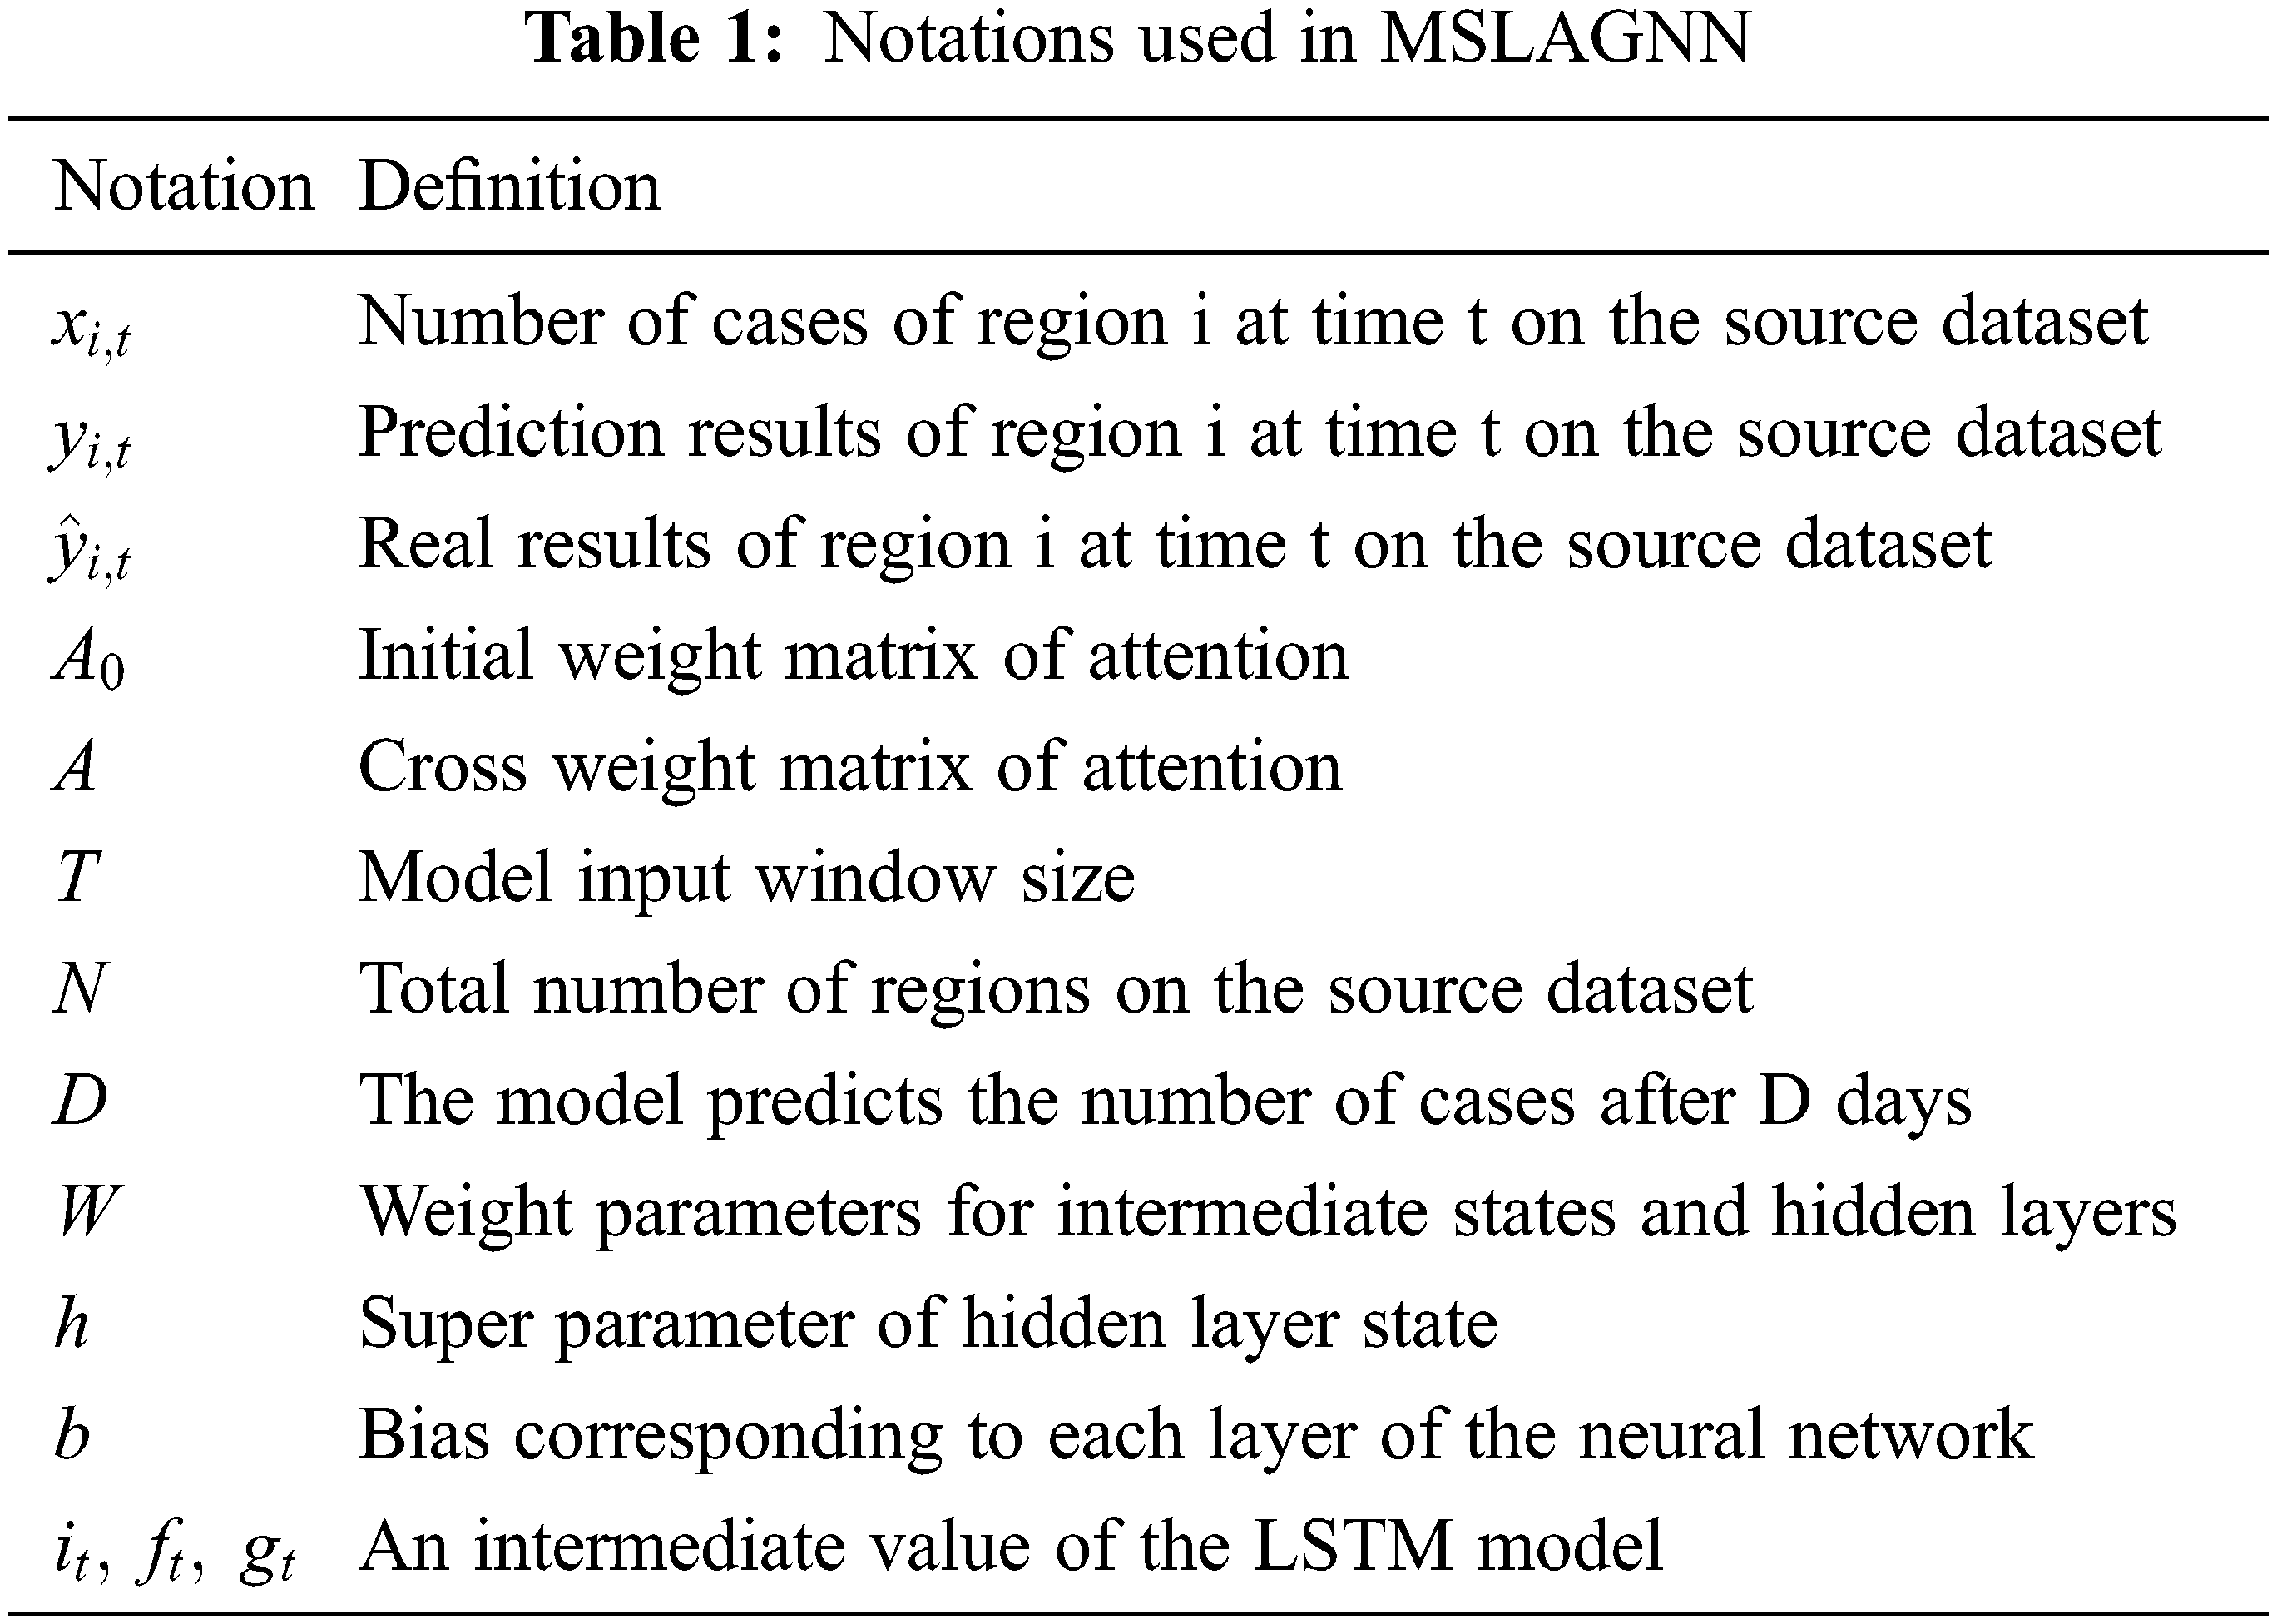
We obtain the patient’s electronic medical record through the local disease control center. Extracting the number of incidence of time sequences per day in N-regions, performing input time sequences in T size, for example, a set of time sequences in the
MSLAGNN studies a sequence source data set based on a large number of disease control center patient electronic medical records. To learn the geographical and timeliness of infectious disease spread, use specific neural networks to extract the geographical and timeliness of infectious diseases, respectively. Fig. 1 shows the proposed MSLAGNN framework, which contains three key steps:
• Model framework results from different time cycles by extended convolution model.
• The model framework extracts the spatial relevance between the regions through the RNN and attention mechanism and uses the extension convolution model to get the characteristics of different time cycles.
• Each region is used as a node and then integrates the characteristics through the message passing of the common network.
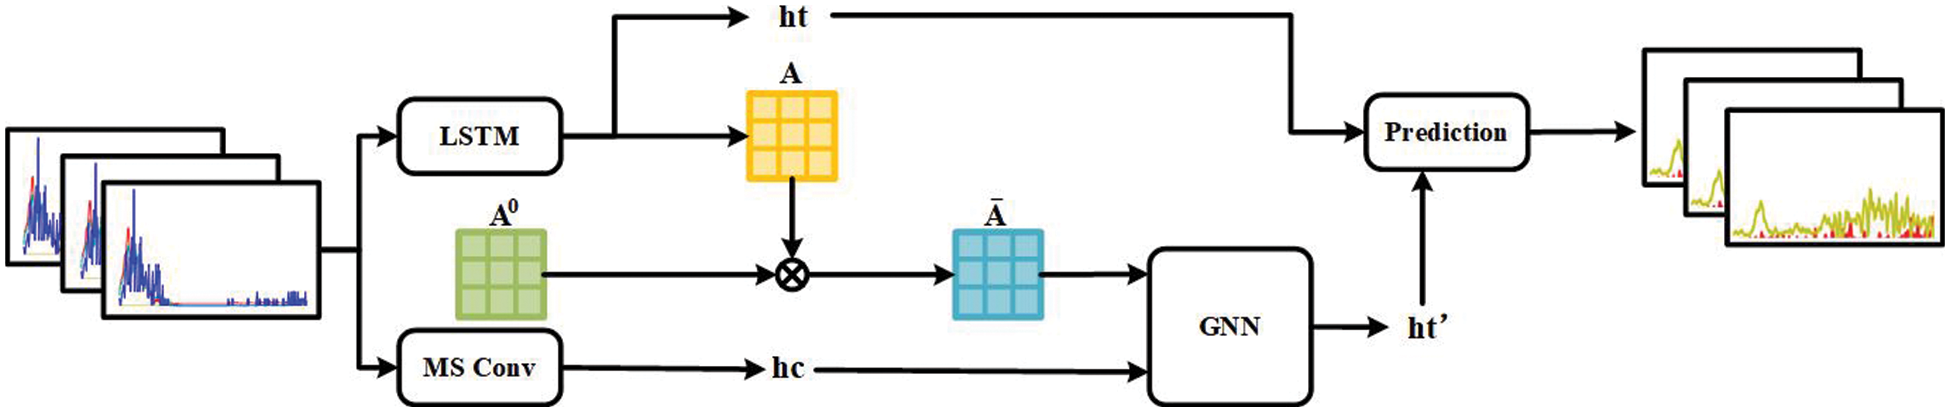
Figure 1: MSLAGNN model frame map
4.1 Multi-Scale Time Feature Learning
Due to the accumulation of susceptible people, certain infectious diseases often have periodic prevalence. For example, due to the climate, it is easy to breed some influenza viruses in China, and among patients during the winter and spring season are more. Therefore, it is possible to predict the time characteristics of infectious diseases. This work [21] demonstrated the effectiveness of expansion convolution to extract image local mode. Therefore, this article is used to draw on the model of AdaCare. AdaCare demonstrates the excellent ability to capture long-term trends and short-term abnormal changes in biomarkers. In this module, the expanded convolution module extends, and the multi-scale receiving domain is extended by a plurality of parallel consolidation branches, with the same filter size and peak, but different expansion rates k1, k2, …, K. In the framework of this article, the source data set
The epidemic of infectious diseases is usually geographically. While considering the popular relevance between adjacent regions, we consider whether there is no correlation between infectious diseases without adjacent regions. This is due to the current convenience of transportation and the climate, the range of personnel flows is more increased, and the infectious disease infection is also expanded. In this paper, we extract spatial correlation characteristics in two steps.
First, the LSTM neural network is used in the characteristics extraction of each region, and the effect of LSTM achieves excellent results in this work. This article uses a modified LSTM neural network. Each row of source data x is input into LSTM, which extracts the characteristics of the j area at each time node. Mathematically, the LSTM extraction process:
where
In the study, the attention mechanism explains the relationship between regions. The correlation between the various regions is studied by the resulting intermediate state
where
The geographical distribution between the regions is considered while extracting the influence between the region. The initial weight matrix
In the study, each region is considered as a node, and N regions form a picture of N nodes. The time characteristics of the different cycles of multi-scale CNN, the popular features of the LSTM extracted, and the spatial relevance between the attention mechanism extraction. The modeling neural network combines these features, each epoch iteration is used to calculate the time and space characteristics of each region.
where
In this section, we use the medical record resource from the CDC of one city in central China, which is called as Cangtha in the following. We conduct experiments on the data set of 42 infectious diseases in the nine cities in Cangtha to assess network performance. We answer the following questions:
• Q1. Can MSLAGNN be applied to a wider range of time and space prediction tasks and steadily improve performance compared to the most advanced networks?
• Q2. Is the proposed search space more effective than the searching space in the image domain?
• Q3. What is the impact of the number of layers and channels of MSLAGNN’s architecture?
A brief introduction to the dataset is shown in Table 2:

We divide the data into the training set, verification set, and test set according to the proportion of 5:2: 3 according to the time order. In the search phase, we use the verification set to learn the neural structure. In the training phase, we use the training set to train models and verification sets to perform early stop strategies. Finally, through the test set, the prediction effect of the model is obtained.
Details are as follows: Records of 42 infectious diseases in 9 urban areas between 2019 and 2021 are obtained. ILI cases are reported in Cangtha CDC all year round. The experiment focuses on the disease prediction of influenza and HFMD. It can be seen from the gray part of Fig. 2 that the epidemic outbreak begin on October 31, 2019. In the experimental part of this paper, this period is called the outbreak period.
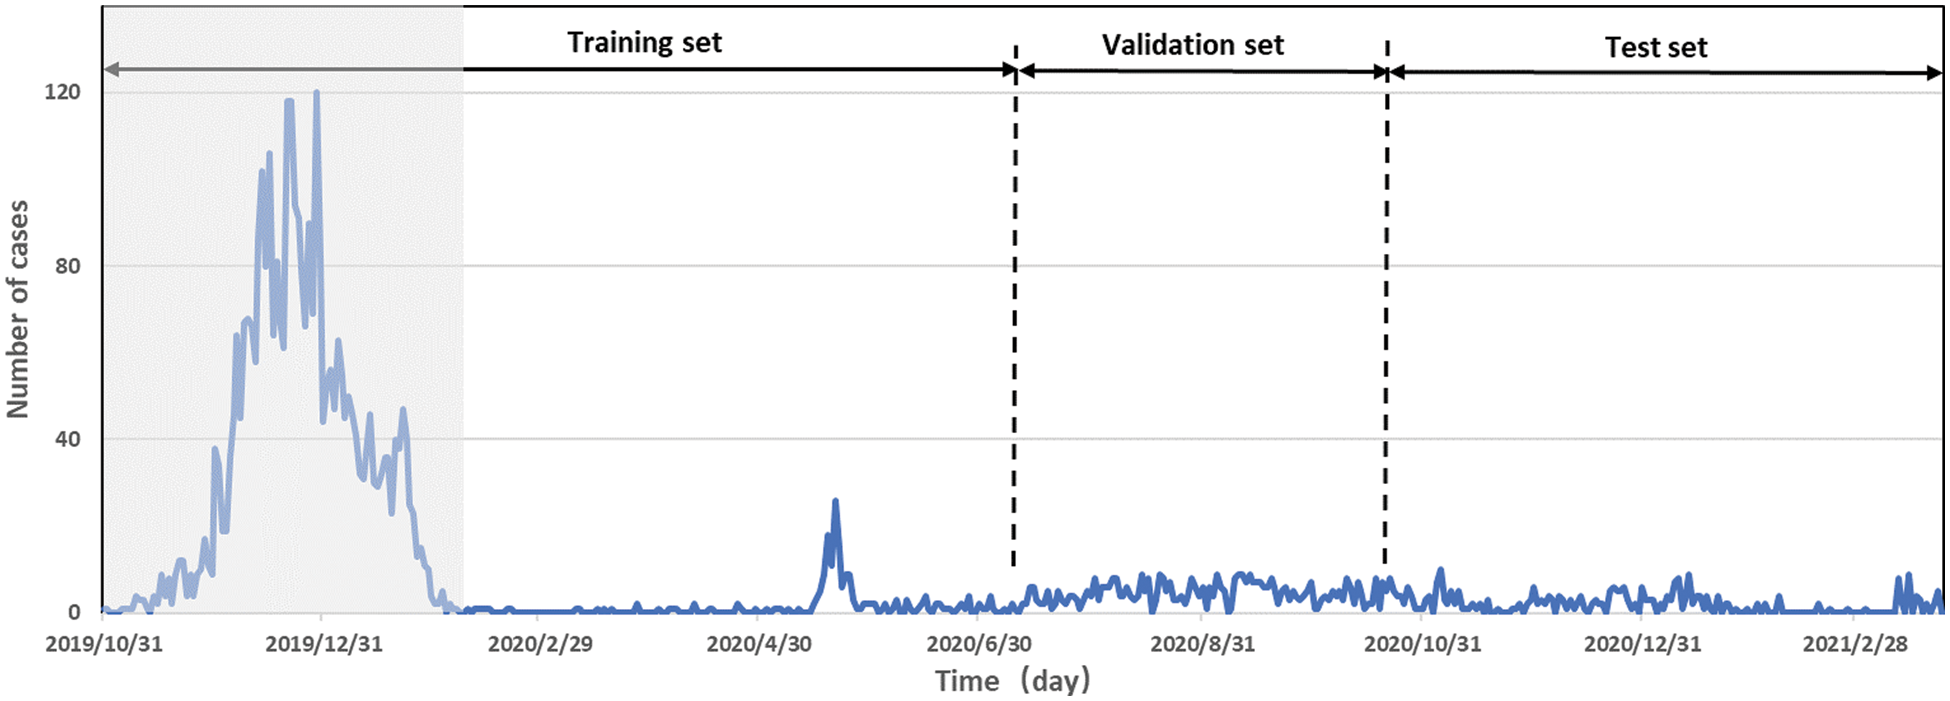
Figure 2: Time series of influenza-like illness percentages
Three precision indicators are used to evaluate the performance of the model: Root Mean Squared Error (RMSE), Mean Absolute Error (MAE), and Mean Square Error (MSE).
We introduce several advanced models as our baseline method, without additional label data or external body resources, as shown below:
• Recurrent neural network (RNN) demonstrates a powerful ability to predict time-dependent. For our question, we adopt a global RNN, that is, the parameters are shared in different locations.
• λ Long short-term memory (LSTM) is an RNN variant that effectively solves the traditional circulating neural network gradient explosion, and can handle long-term sequence data, with a long memory.
• λ AdaCare captures long-term and short-term changes of biomarkers as clinical features, predicting multiple time scales.
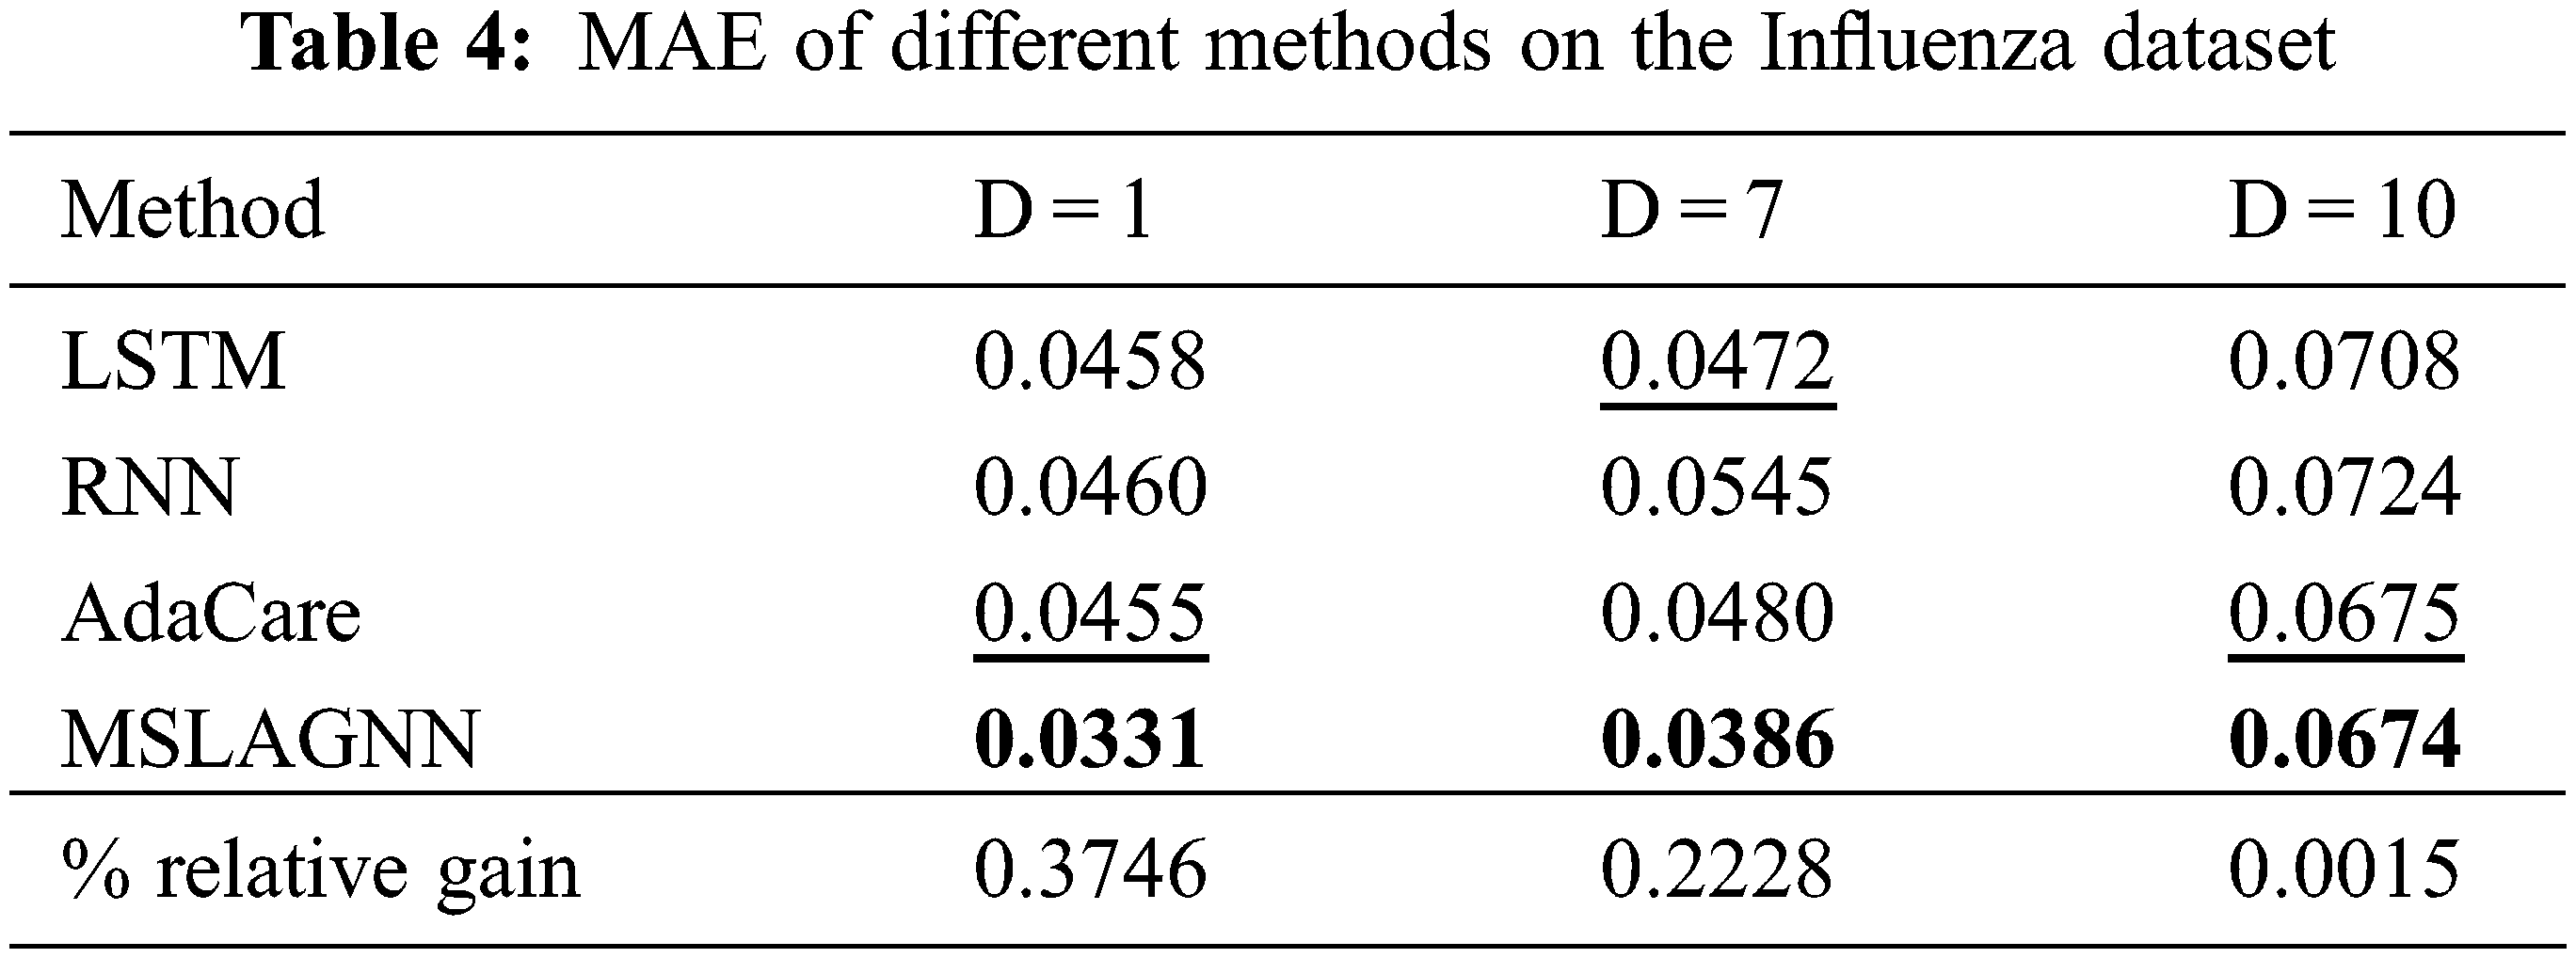
Tables 3 and 4 show the performance of all methods on the Cangtha dataset. MSLAGNN is always superior to the transfer and non-transfer baseline, which proves the ability of MSLAGNN to learn robust and healthy. Specifically, compared with the optimal method. MSLAGNN reduces RMSE of 2% in Cangtha HFMD dataset, MSLAGNN reduces MAE of 27% in Cangtha Influenza dataset.

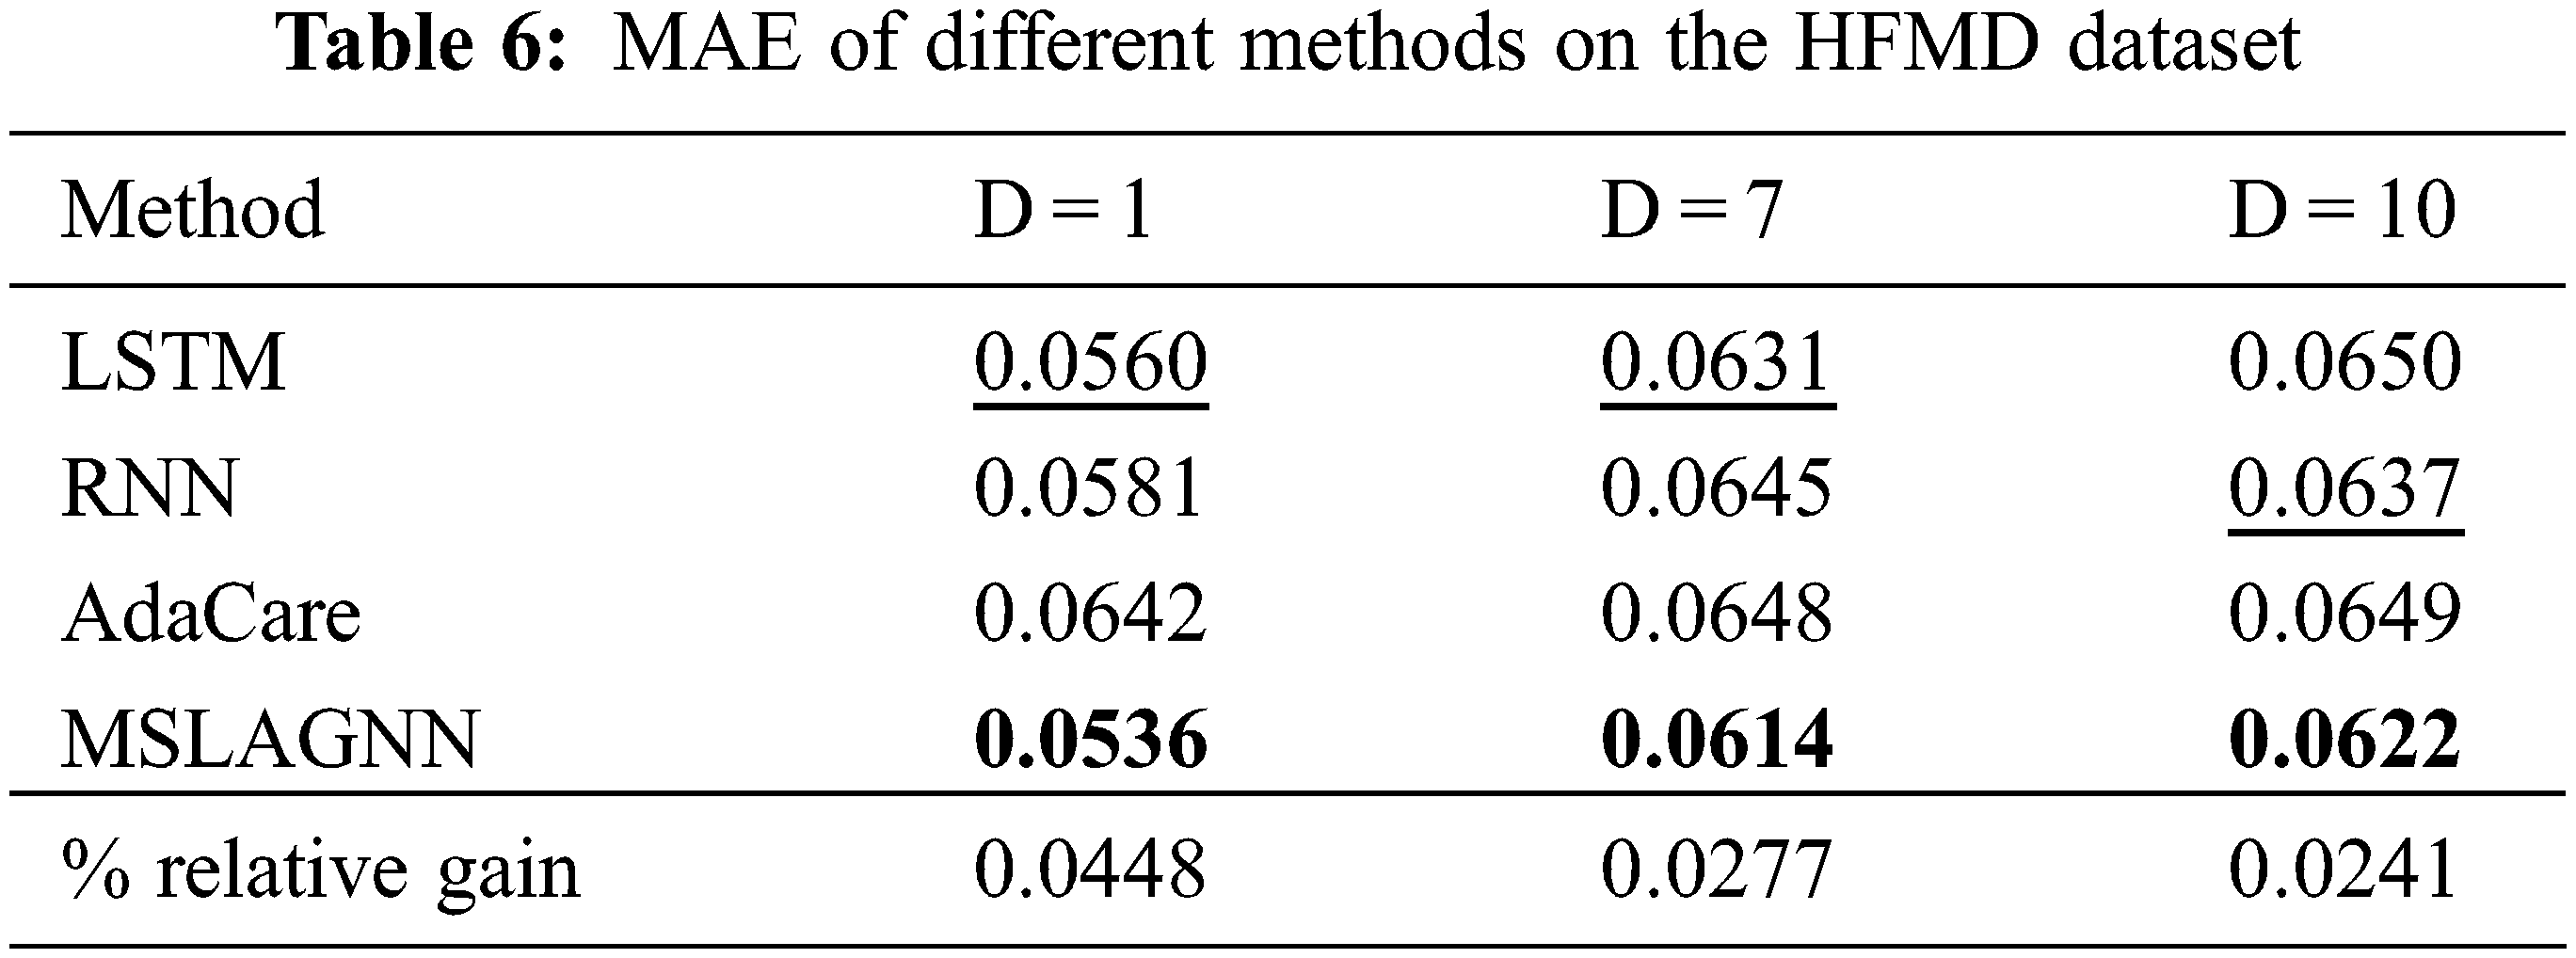
To test the general use of MSLAGNN, we compare it with other baseline models on the HFMD dataset. Tables 5 and 6 show the performance of the model is still excellent. Compared to another optimal baseline method LSTM, MSLGNN achieves a 4% lower MAE relatively to the HFMD dataset.

As shown in Fig. 3, overall, MSLAGNN produces smaller prediction errors. In addition, in the influenza dataset (see Fig. 3b), the estimated value of MSLAGNN fits the real value better than other existing models. It can be seen that MSLAGNN has the least lag. At the same time, MSLAGNN can accurately predict the peak on the HFMD dataset (see Fig. 3a).
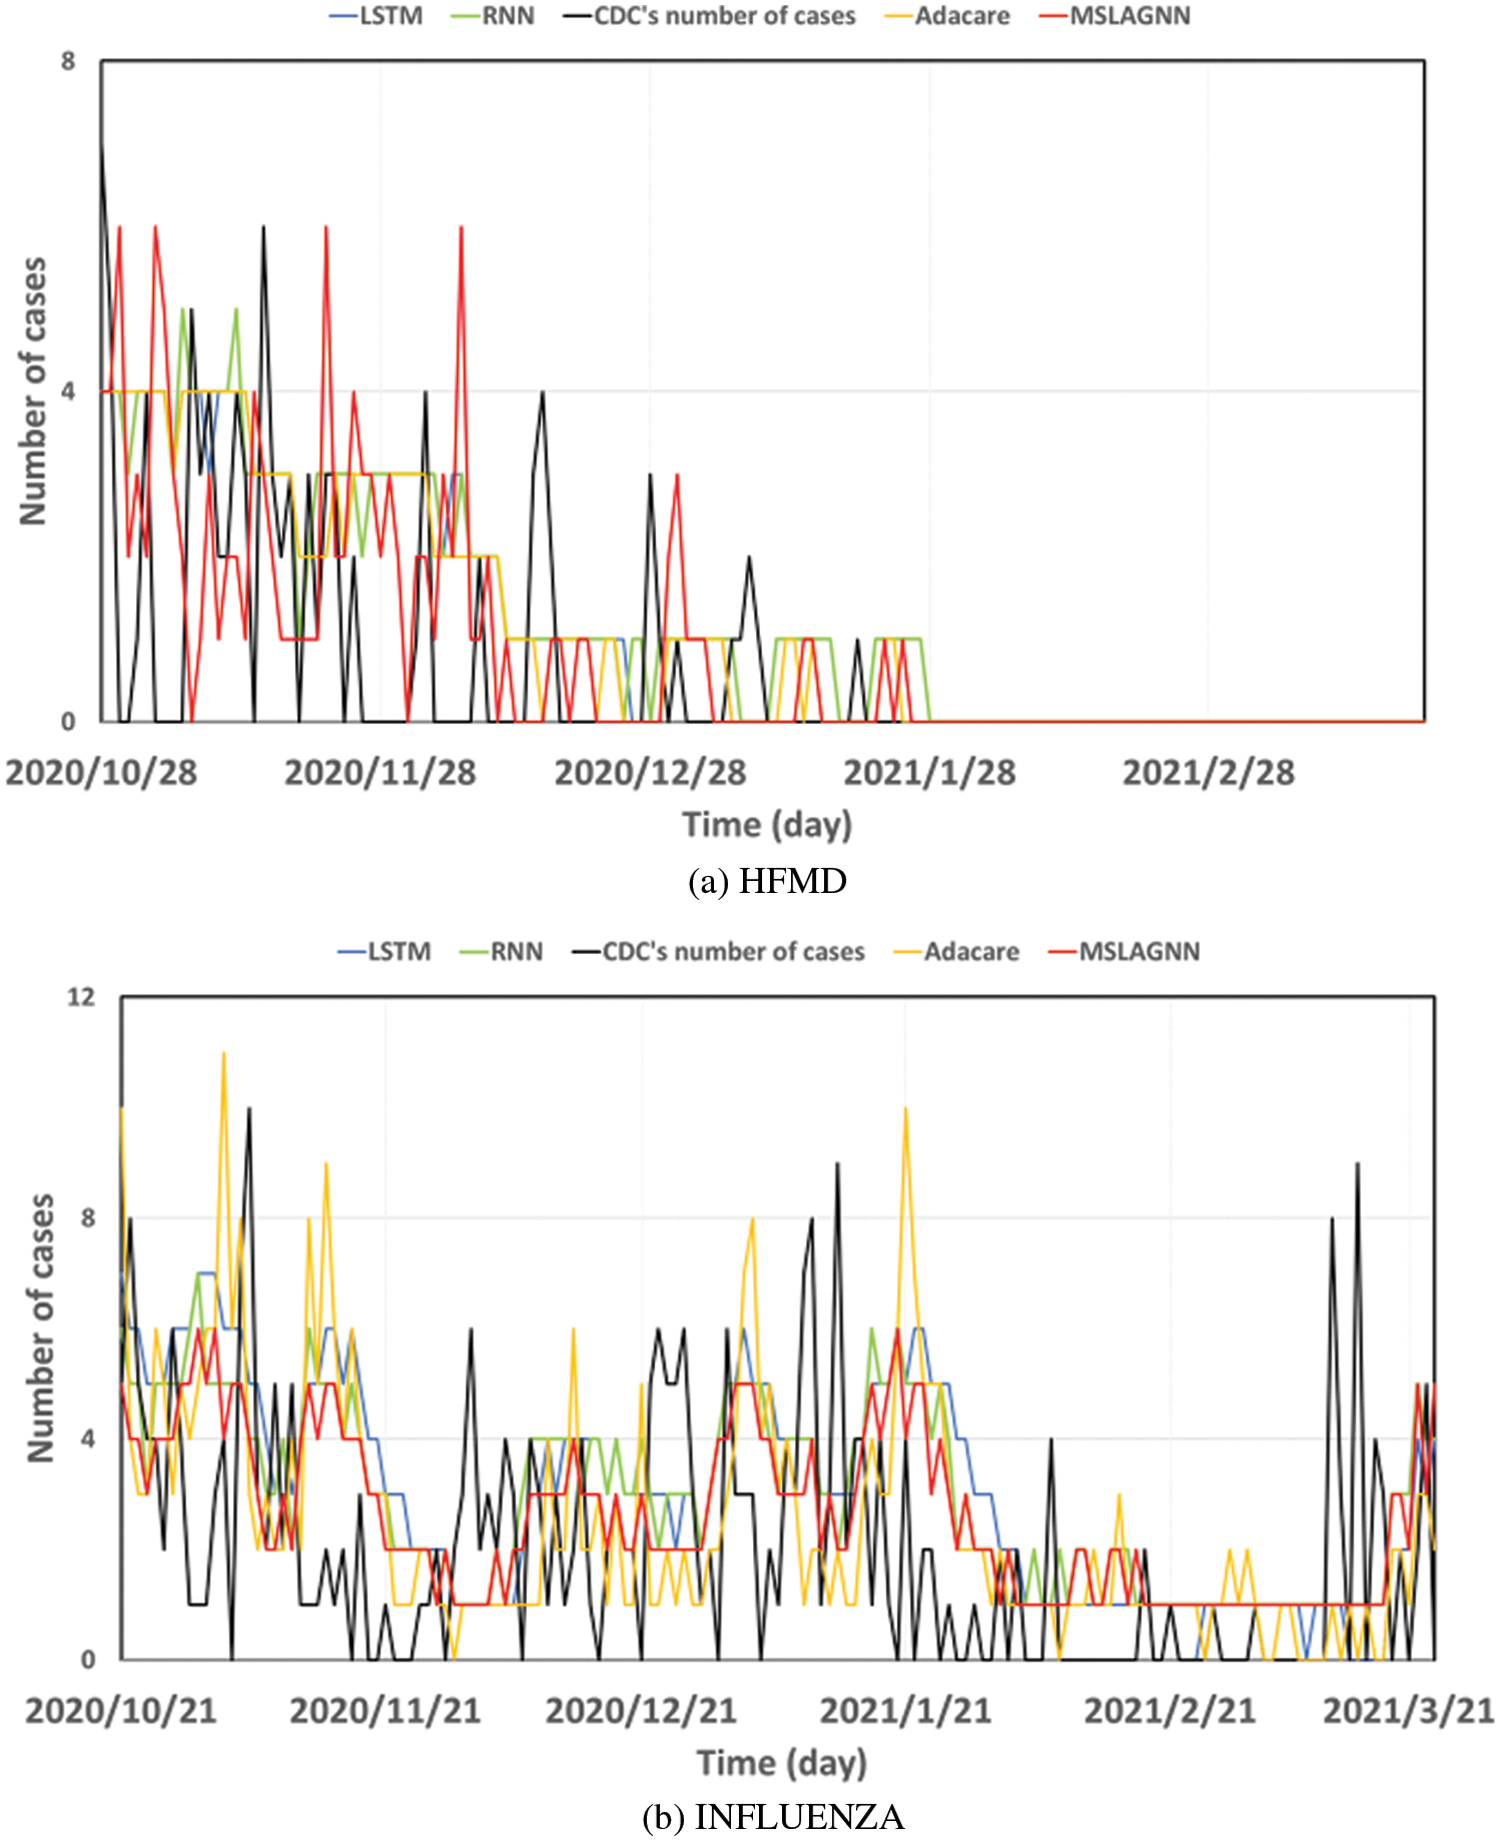
Figure 3: Estimation results of MSLAGNN in comparison to reference models
In this experiment, as shown in Table 7, it is necessary to test each module of MSLAGNN. MSLAGNN_MS is not suitable for multi-scale convolution modules. MSLAGNN_Atten does not use the attention mechanism but uses
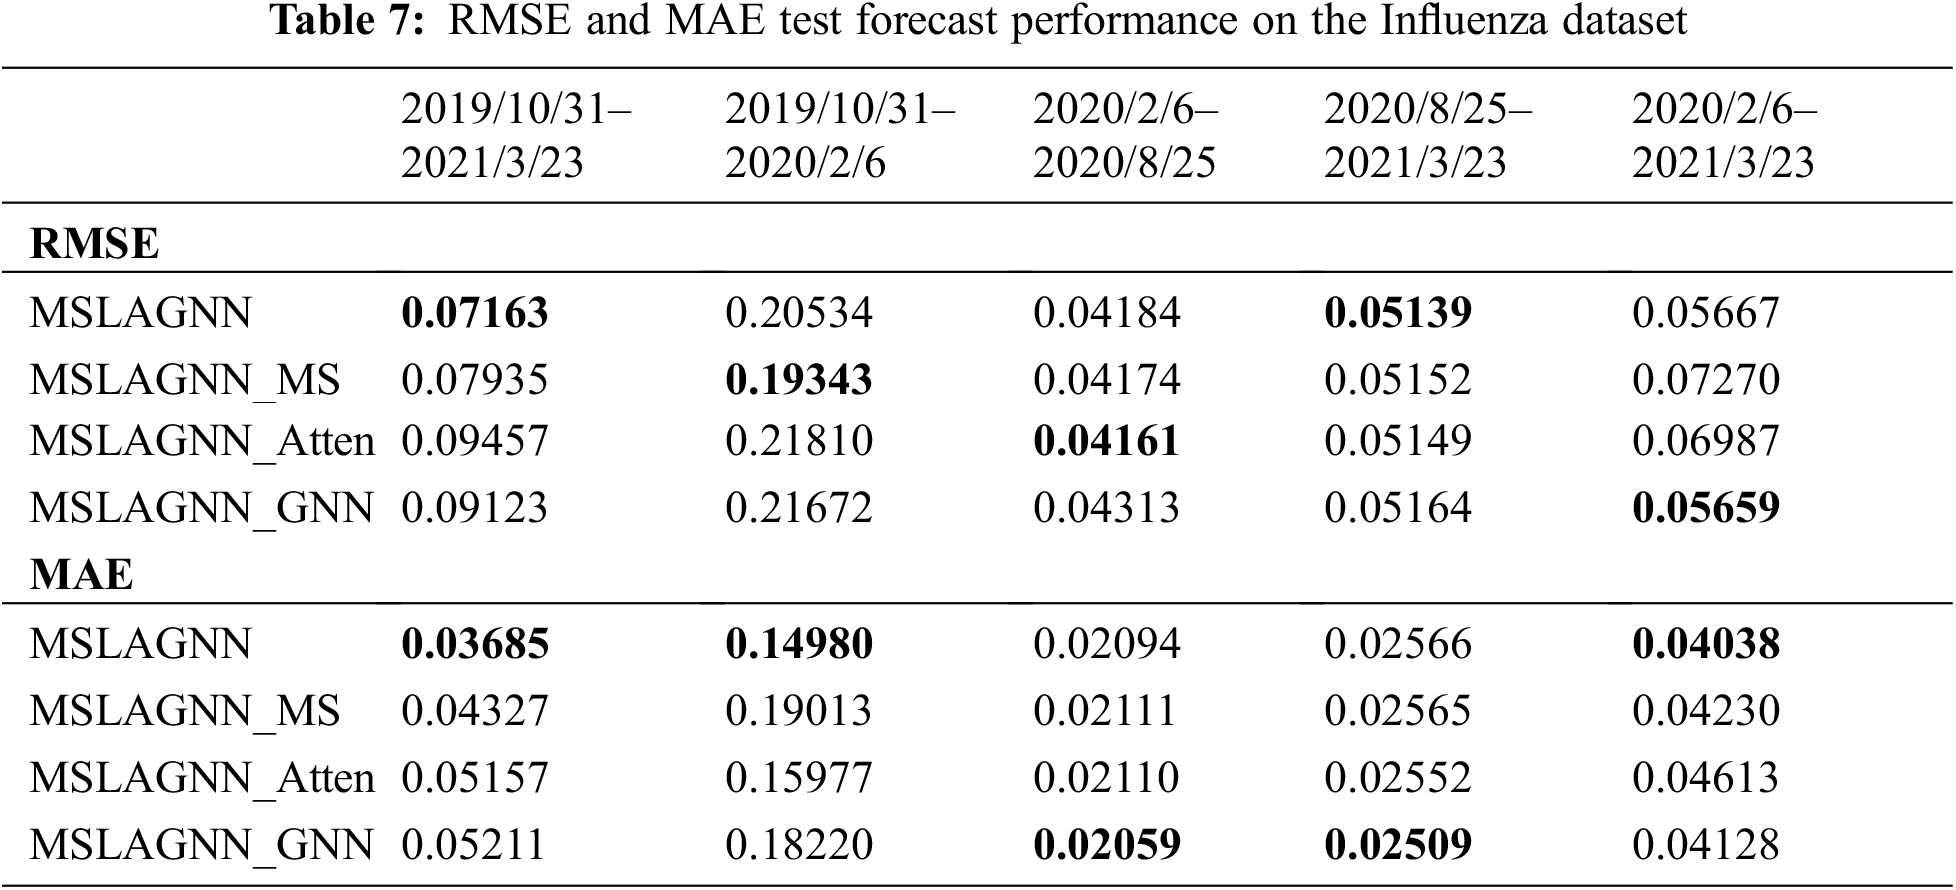

MSLAGNN uniformly outperforms all other tested models in the performance metrics consisting of RMSE and MAE. During the period from 2019 to 2021, MSLAGNN (RMSE = 0.113, MAE = 0.056) reduces 73% RMSE, 72% MAE compared to the MSLAGNN_Atten (RMSE = 0.426, MAE = 0.205), and 50% RMSE, 43% MAE compared to MSLAGNN_MS (RMSE = 0.228, MAE = 0.098). In large data sets, MS_Conv and the attention mechanism significantly improve the prediction performance of the model. Meanwhile, the GNN mechanism also improves performance. With the gradual reduction of data sets, the performance of each model is gradually similar, but MSLAGNN still maintains the optimal prediction effect. During the outbreak period, MSLAGNN still has good accuracy metrics and performed best among all the tested models.
As shown in Table 8, each module still shows a performance improvement. Because the change in the HFMD dataset is relatively stable, the impact of the change in data set size is not obvious. The model shows the best performance from 06 February, 2020, to 25 August, 2020. The analysis of the data set shows that the incidence is rising slowly with a small amplitude fluctuation, with strong linear characteristics. At the same time, MSLAGNN is good at handling such data.
In order to test the effect of MSLAGNN’s input window size on prediction performance, t was set to 7 days, 14 days, and 21 days. The results of RMSE and MAE are shown in Fig. 4. On the HFMD dataset, the window increases, MAE and RMSE decrease (see Fig. 4a), and the prediction performance is better. We can avoid using very long sequences for training and achieve relatively comparable results. On the influenza dataset (see Fig. 4b), MAE and RMSE are similar when windows are 14 and 21. In addition, this comparative experiment also shows the performance of MSLAGNN in predicting the number of onset (y) in the time span. Overall, the effect of prediction after 2 days is the best, and the effect of prediction after 7 days and 10 days is similar. MSLAGNN has good prediction results on different scales.
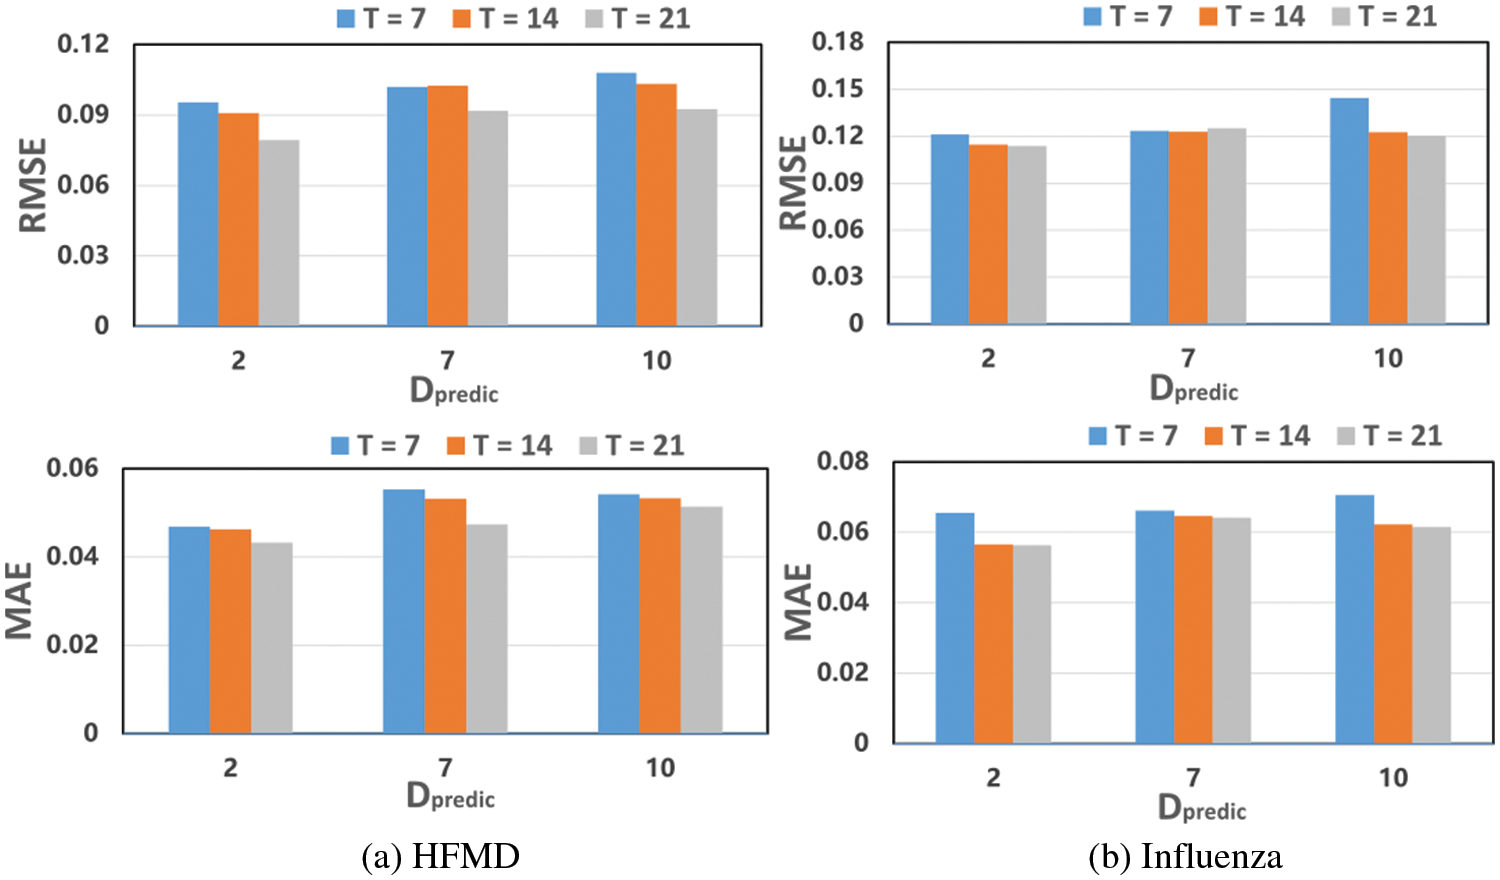
Figure 4: Impact of the window size on performance
In this paper, we propose a framework based on graph neural networks MSLAGNN for space-time prediction time of infectious diseases. In order to effectively extract the time and spatial features of the disease, MSLAGNN is trained by the region attention and MS module. Then the influence of each region in propagation is simulated by GNN. Experimental results on the real-world flu dataset and the HFMD dataset show that MSLAGNN is better than several baseline methods and promotes the epidemic prediction of infectious diseases in the future.
Acknowledgement: Not applicable.
Funding Statement: The authors received no specific funding for this study.
Author Contributions: Youshen Jiang: Conceptualization, Methodology, Validation, Writing-original draft. Tongqing Zhou: Methodology, Data curation, Formal analysis, Writing-review & editing. Zhilin Wang: Investigation, Validation, Writing-review & editing. Zhiping Cai: Supervision, Methodology, Data curation, Writing-review & editing. Qiang Ni: Writing-review & editing.
Availability of Data and Materials: Not applicable.
Conflicts of Interest: The authors declare that they have no conflicts of interest to report regarding the present study.
References
1. S. A. Lauer, K. H. Grantz, Q. Bi, F. K. Jones, Q. Zheng et al., “The incubation period of coronavirus disease 2019 (COVID-19) from publicly reported confirmed cases: Estimation and application,” Annals of Internal Medicine, vol. 172, no. 9, pp. 577–582, 2020. doi:10.7326/M20-0504. [Google Scholar] [PubMed] [CrossRef]
2. R. Lin, L. Lu, S. Lycett, W. Liu and J. Li, “Dealing with highly pathogenic avian influenza: An impending crisis,” The Innovation, vol. 2, no. 1, pp. 100084, 2021. doi:10.1016/j.xinn.2021.100084. [Google Scholar] [PubMed] [CrossRef]
3. A. Gkoulalas-Divanis and G. Loukides, Medical Data Privacy Handbook, pp. 549–567, 2015. [Google Scholar]
4. S. Chae, S. Kwon and D. Lee, “Predicting infectious disease using deep learning and big data,” International Journal of Environmental Research and Public Health, vol. 15, no. 8, 2018. [Google Scholar]
5. W. Sun, F. Liu, Z. Cai, S. Fang and G. Wang, “A survey of data processing of EMR (electronic medical record) based on data mining,” Preprints, vol. 2017, pp. 2017080055, 2017. [Google Scholar]
6. S. Wang, M. Li, N. Hu, E. Zhu, J. Hu et al., “K-means clustering with incomplete data,” IEEE Access, vol. 7, pp. 69162–69171, 2019. [Google Scholar]
7. C. Qi, D. Zhang, Y. Zhu, L. Liu, C. Li et al., “SARFIMA model prediction for infectious diseases: Application to hemorrhagic fever with renal syndrome and comparing with SARIMA,” BMC Medical Research Methodology, vol. 20, no. 1, pp. 1–7, 2020. [Google Scholar]
8. Z. Wang, X. Zhang, G. H. Teichert, M. Carrasco-Teja and K. Garikipati, “System inference for the spatio-temporal evolution of infectious diseases: Michigan in the time of COVID-19,” Computational Mechanics, vol. 66, no. 5, pp. 1153–1176, 2020. doi:10.1007/s00466-020-01894-2. [Google Scholar] [PubMed] [CrossRef]
9. D. Zou, L. Wang, P. Xu, J. Chen, W. Zhang et al., “Epidemic model guided machine learning for COVID-19 forecasts in the United States,” medRxiv, pp. 1–15, 2020. [Google Scholar]
10. L. Ma, X. Ma, J. Gao, X. Jiao, Z. Yu et al., “Distilling knowledge from publicly available online EMR data to emerging epidemic for prognosis,” in The Web Conf. 2021–Proc. of the World Wide Web Conf., WWW 2021, pp. 3558–3568, 2021. [Google Scholar]
11. K. Su, L. Xu, G. Li, X. Ruan, X. Li et al., “Forecasting influenza activity using self-adaptive AI model and multi-source data in Chongqing, China,” eBioMedicine, vol. 47, pp. 284–292, 2019. [Google Scholar] [PubMed]
12. J. Wang, K. Tang, K. Feng, X. Lin, W. Lv et al., “Impact of temperature and relative humidity on the transmission of COVID-19: A modelling study in China and the United States,” BMJ Open, vol. 11, no. 2, pp. 1–16, 2021. [Google Scholar]
13. J. B. Shukla, S. Singh, J. Singh and S. K. Sharma, “Modelling and analysis of bacteria dependent infectious diseases with variable contact rates,” Computers, Materials & Continua, vol. 68, no. 2, pp. 1859–1875, 2021. doi:10.32604/cmc.2021.012095. [Google Scholar] [CrossRef]
14. W. Alosaimi, H. Alyami and M. I. Uddin, “PeachNet: Peach diseases detection for automatic harvesting,” Computers, Materials & Continua, vol. 67, no. 2, pp. 1665–1677, 2021. doi:10.32604/cmc.2021.014950. [Google Scholar] [CrossRef]
15. N. Nuraini, K. K. Sukandar, P. Hadisoemarto, H. Susanto, A. I. Hasan et al., “Mathematical models for assessing vaccination scenarios in several provinces in Indonesia,” Infectious Disease Modelling, vol. 6, pp. 1236–1258, 2021. doi:10.1016/j.idm.2021.09.002. [Google Scholar] [PubMed] [CrossRef]
16. Z. Li, Y. Zheng, J. Xin and G. Zhou, “A recurrent neural network and differential equation based spatiotemporal infectious disease model with application to COVID-19,” in IC3 K 2020-Proc. of the 12th Int. Joint Conf. on Knowledge Discovery, Knowledge Engineering and Knowledge Management, vol. 1, pp. 93–103, 2020. [Google Scholar]
17. S. Deng, S. Wang, H. Rangwala, L. Wang and Y. Ning, “Cola-GNN: Cross-location attention based graph neural networks for long-term ILI prediction,” in Int. Conf. on Information and Knowledge Management, pp. 245–254, 2020. [Google Scholar]
18. X. Shao, “Accurate multi-site daily-ahead multi-step PM2.5 concentrations forecasting using space-shared cnn-LSTM,” Computers, Materials & Continua, vol. 70, no. 3, pp. 5143–5160, 2022. doi:10.32604/cmc.2022.020689. [Google Scholar] [CrossRef]
19. S. Zhao, M. Hu, Z. Cai and F. Liu, “Dynamic modeling cross-modal interactions in two-phase prediction for entity-relation extraction,” IEEE Transactions on Neural Networks and Learning Systems, pp. 1–10, 2021. [Google Scholar]
20. S. Zhao, M. Hu, Z. Cai, Z. Zhang, T. Zhou et al., “Enhancing Chinese character representation with lattice-aligned attention,” IEEE Transactions on Neural Networks and Learning Systems, pp. 1–10, 2021. [Google Scholar]
21. L. Ma, J. Gao, Y. Wang, C. Zhang, J. Wang et al., “AdaCare: Explainable clinical health status representation learning via scale-adaptive feature extraction and recalibration,” in AAAI 2020–34th AAAI Conf. on Artificial Intelligence, pp. 825–832, 2020. [Google Scholar]
Cite This Article
 Copyright © 2024 The Author(s). Published by Tech Science Press.
This work is licensed under a Creative Commons Attribution 4.0 International License , which permits unrestricted use, distribution, and reproduction in any medium, provided the original work is properly cited.
 Downloads
 Citation Tools