
 Submit a Paper
 Propose a Special lssue
 Open Access
ARTICLE

Predicting 3D Radiotherapy Dose-Volume Based on Deep Learning
1 Institute of Information Technology, Vietnam Academy of Science and Technology, Hanoi, 10072, Vietnam
2 Faculty of Information Technology, Lac Hong University, Bien Hoa, Dong Nai, 76120, Vietnam
* Corresponding Author: Do Nang Toan. Email:
Intelligent Automation & Soft Computing 2024, 39(2), 319-335. https://doi.org/10.32604/iasc.2024.046925
Received 19 October 2023; Accepted 20 December 2023; Issue published 21 May 2024
 View Full Text
 Download PDF
Abstract
Cancer is one of the most dangerous diseases with high mortality. One of the principal treatments is radiotherapy by using radiation beams to destroy cancer cells and this workflow requires a lot of experience and skill from doctors and technicians. In our study, we focused on the 3D dose prediction problem in radiotherapy by applying the deep-learning approach to computed tomography (CT) images of cancer patients. Medical image data has more complex characteristics than normal image data, and this research aims to explore the effectiveness of data preprocessing and augmentation in the context of the 3D dose prediction problem. We proposed four strategies to clarify our hypothesis in different aspects of applying data preprocessing and augmentation. In strategies, we trained our custom convolutional neural network model which has a structure inspired by the U-net, and residual blocks were also applied to the architecture. The output of the network is added with a rectified linear unit (Re-Lu) function for each pixel to ensure there are no negative values, which are absurd with radiation doses. Our experiments were conducted on the dataset of the Open Knowledge-Based Planning Challenge which was collected from head and neck cancer patients treated with radiation therapy. The results of four strategies show that our hypothesis is rational by evaluating metrics in terms of the Dose-score and the Dose-volume histogram score (DVH-score). In the best training cases, the Dose-score is 3.08 and the DVH-score is 1.78. In addition, we also conducted a comparison with the results of another study in the same context of using the loss function.Keywords
In recent times, cancer is currently one of the most dangerous diseases for people all over the world. According to the report [1], cancer is responsible for approximately 10 million deaths in 2020. Particularly in Vietnam in 2019 and 2020 [2], 182,563 new infections and 122,690 deaths were recorded, ranking 50/185 in mortality worldwide. According to [1], about a third of all cancer deaths are due to tobacco use, alcohol use, and unhealthy lifestyles. However, many cancers that are detected and treated early are successfully cured. By definition, cancer is a disease that occurs when abnormal cells appear, grow out of control, and form a tumor. These cells gradually destroy and invade healthy tissues in the body, from nearby organs to the whole body. Currently, there are many methods of cancer treatment that can be mentioned such as chemotherapy, radiation therapy, conventional surgery, immunotherapy using drugs, etc. Among them, radiation therapy is one of the most popular methods.
Radiation therapy is the use of radiation therapy beams to destroy cancer cells and prevent them from dividing and growing, this is done by special and professional radiation machines. One of the main reasons that radiation therapy is so popularly used for cancer treatment is that it can be treated in almost any part of the body. According to the report [3], radiation therapy is a very time-consuming undertaking not only in planning but also in the treatment process. It can take many hours to calculate and determine the distribution of radiotherapy concentrations that achieve optimal clinical criteria. In addition, performance and accuracy are highly dependent on the experience and skill of the planners and practitioners.
One of the most important problems in radiotherapy is dose prediction. Today, deep learning methods have been widely applied in the process of radiotherapy dose prediction. In 2019, Jiao et al. [4] proposed a dose-volume histograms prediction method on data from nasopharyngeal cancer patients. In the paper, the authors combined dosimetric and geometric information and built a generalized regression neural network for the prediction task. In 2020, Babier et al. [5] presented a study on radiotherapy dose prediction based on the Generative Adversarial Networks (GAN) model. The study used region-marked CT images from the data of 127 oropharyngeal cancer patients with accepted treatment plans. In 2021, Ahn et al. [6] applied a convolutional neural network based on the U-net model to the radiotherapy dose prediction problem. The authors used 50 volumetric modulated arc therapy plans for breast cancer patients in the experiment of the paper and the results were also compared with the solution using RapidPlan™. Also in 2021, Liu et al. [7] proposed a 3D Dense-U-Net model and obtained 2.42% and 2.93% of the average deviations from the average and maximum dose values of Planning target volume (PTV) and Organ at risk (OAR), respectively. All experiments were performed with an annotated CT dataset of 124 nasopharyngeal carcinoma patients who were treated with tomotherapy. Another study with the aim of dose prediction is DeepDoseNet [8] by Hussain et al. The authors combined Resnet and Dilated Densenet into one model and experimented with the dataset from the Open knowledge based planning (OpenKBP) Challenge [9]. The authors’ model was trained with many different loss functions and the results were evaluated through two measures of DVH-score and Dose-score. Also with the OpenKBP Challenge dataset, Gronberg et al. [10] tested about 90 different variations of convolutional neural networks along with selections of hyper-parameters and augmentation methods. The results were evaluated with a dose score measure and the authors obtained 2.4996 of the mean validation dose score and 2.5635 of the mean test dose score. Another study is the use of a variant of the U-net network combined with the One Cycle Learning training technique of Zimmermann et al. [11]. The authors also make many adjustments such as using the Mish activation function and the loss function with the L1 metric. Experiments were also conducted with the OpenKBP Challenge dataset and the results earned 2nd and 4th place respectively on the OpenKBP Challenge’s DVH-score and dose score rankings at that time.
In this study, we focus on the problem of dose prediction based on CT image data to serve cancer treatment with radiation therapy. We use the deep learning approach and the experimental data was collected from head and neck cancer patients treated with radiation therapy.
The accuracy of deep learning models depends mainly on the quality and quantity of the trained data. In the case of medical image data, on the one hand, medical image data has more complex characteristics than normal image data. A common case is that a medical image has 1 channel and 32 bits per pixel, and a normal image has 3 channels and 24 bits per pixel, i.e., 1 channel has 8 bits. Therefore, the display value domain of medical images is more complex. In fact, there are many cases where it is difficult to distinguish between regions of internal organs due to poor contrast and different configurations of imaging machines. On the other hand, medical images are generally morescarce than regular images due to privacy and security constraints. Even if we can access the data with the permission of the hospital, we still need the cooperation of doctors to be able to understand the medical problems in medical images. Relating to the difficulties of medical data, Toan et al. [12] researched the role of local sample data when using combined training data to evaluate the local test dataset. Another study is [13], the authors tried to enroll data from multiple sources by converting Magnetic Resonance Imaging (MRI) spine imaging. In this study, on the one hand, we need normalization techniques to reduce noise to get normalized data. On the other hand, we also have to deal with the scarcity of data by applying data augmentation.
Data preprocessing and augmentation for CT images also are topics, interested researchers. For example, in 2017, Kallel et al. [14] proposed an adaptive algorithm to enhance CT images. The idea of the authors is to apply discrete wavelet transform with singular-value decomposition to correct gamma adaptively. In 2018, Tang et al. [15] researched a data preprocessing method for CT images to support the segmentation task. The authors applied stacked generative adversarial networks to reduce noise, enhance contrast and boundaries. In 2019, Sandfort et al. [16] presented a CycleGAN for CT image augmentation. The authors experimented and saw performance improvement with CT images of several organs such as kidneys, liver, and spleen. In 2022, Toda et al. [17] proposed an augmentation method to create free-form lesion lung CT images with a pix2pix-based model. In the experiment, the authors generated images from 20 tumor sketches that were created by a doctor.
In this work, we designed different strategies of data preprocessing and augmentation to build the autonomous dose prediction solution with our custom convolutional neural network model. From the experiment, we analyze the effect of each strategy and select the best solution which is fit for our task. The major contributions are listed as follows:
• We propose different data preprocessing and augmentation strategies for training task.
• We design a custom convolutional neural network for dose prediction.
• We analyze the effect of each strategy in several aspects to clarify the best solution.
The structure of the paper is arranged as follows: Section 2 presents the material and methods, Section 3 is about the details of four strategies, Section 4 is the results and evaluation, and the final content is the conclusion.
This study used data from 340 head and neck cancer patients treated with radiation therapy. Data were obtained from TCIA, an open-access database of medical images for cancer research operated by the US University of Arkansas. A competition called OpenKBP purportedly cleaned and normalized the data in terms of structure and file names, 340 patients were divided into 200, 40, and 100 for training, testing, and validation sets, respectively. In detail, each patient will include a 128 × 128 × 128 CT image, labels for the locations of organs at risk (OAR), planning target volumes (PTV), and an image containing the dose distribution corresponding to the CT image. All those files are saved as Comma separated values (CSV). In particular, OAR includes labeled parts including the brain stem, spinal cord, right parotid gland, left parotid gland, larynx, esophagus, and mandible. PTV includes target regions of 70 Gy, 63 Gy, and 56 Gy.
This dataset has been restructured to facilitate the construction and evaluation of radiotherapy dose prediction models. Each CT image will have its own pixel size, approximately 3.5 mm × 3.5 mm × 2 mm, and the exact size is also provided specifically in the data of each patient. The data of each patient is stored as a CSV file and is divided into folders corresponding to the patient number. Detailed information for each patient includes:
• Distribution of radiation concentrations needed to treat the patient in Gy units.
• The 3D grayscale image of the patient. The pixel value ranges from 0–4095.
• The size of the voxel in millimeters.
• The binary volume specifies the radiotherapy-receiving pixels in the CT image.
• Binary volumes represent whether the pixel belongs to the respective target organ or region.
A sample of the dataset was described in Fig. 1.
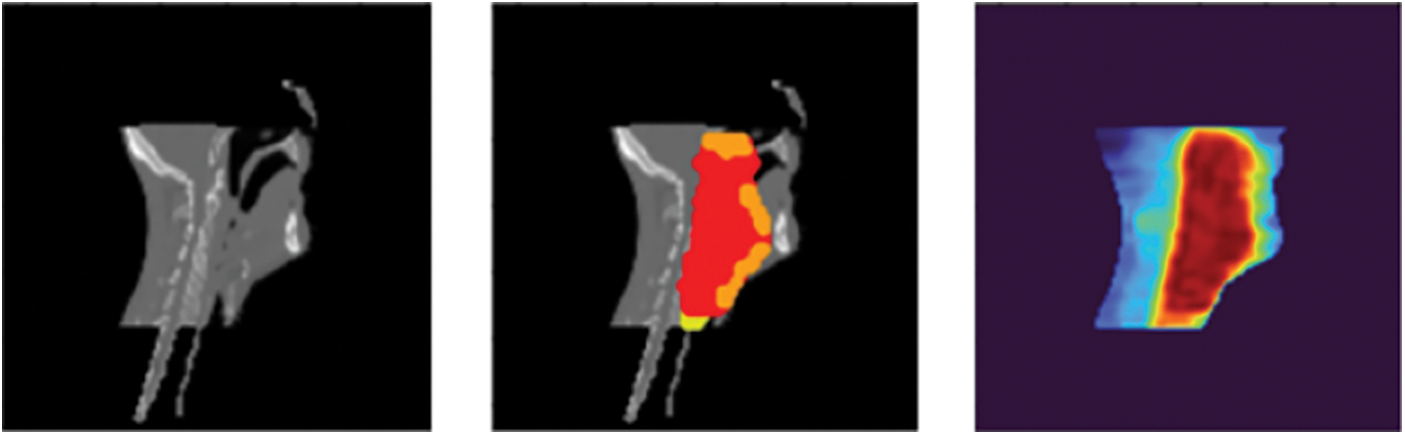
Figure 1: A data example: CT image (left), target regions visualization (middle), and dose visualization (right)
In this study, the data were CT images of patients with head and neck cancer receiving radiation therapy. This data has quite different characteristics from normal image data and thus also influences the choice of preprocessing techniques. First, CT scan data have fixed capturing poses to accommodate medical treatment procedures. Therefore, the distortion caused by the capturing poses is not as much as that of the normal image. Second, the pixel data is complex with 1 channel having a 4-byte data domain. This is quite different from the normal image which has 3 channels and the data domain of each channel is only 1 byte. The range of pixel values usually corresponds to different types of body parts such as bony areas, high-fat areas, etc. as described in Hounsfield units [18]. Furthermore, the CT images were collected from different CT scanners from different hospitals. A patient when being scanned with two different CT machines can completely produce two results with different levels of pixel contrast due to factors in the configuration and hardware of the scanner.
From the analysis of the features of the CT data, we do not use geometrical preprocessing methods and only affect the pixel values. Normalization will bring the CT images to the same scale so that the model can work more effectively on the dataset. In this study, we use a simple normalization method that transforms the image to get a mean of 0 and a standard deviation of 1.
Z is the new pixel value, x is the old pixel value, µ is the mean and σ is the standard deviation.
In the data, the parts that do not capture the body often carry a value close to zero and are distinct from the parts of the body. With the characteristics of position in space, when the body volumes rotate or translate, the 3D image content of the body is still relatively preserved. Another feature is that the image acquisition pose is usually fixed due to medical indications for CT scans, so the size of the subjects in the image is usually relatively stable. Therefore, in this work, we choose methods that do not change the size and scale of the original image. The two methods used to apply are image translation and image flipping.
Image translation performs image displacement with a random distance without losing the patient’s body part. This translation helps the model to be learned more generally when the body part is not in a fixed position. Similarly, this technique is rather simple and can be performed quickly. The algorithm is described as follows:
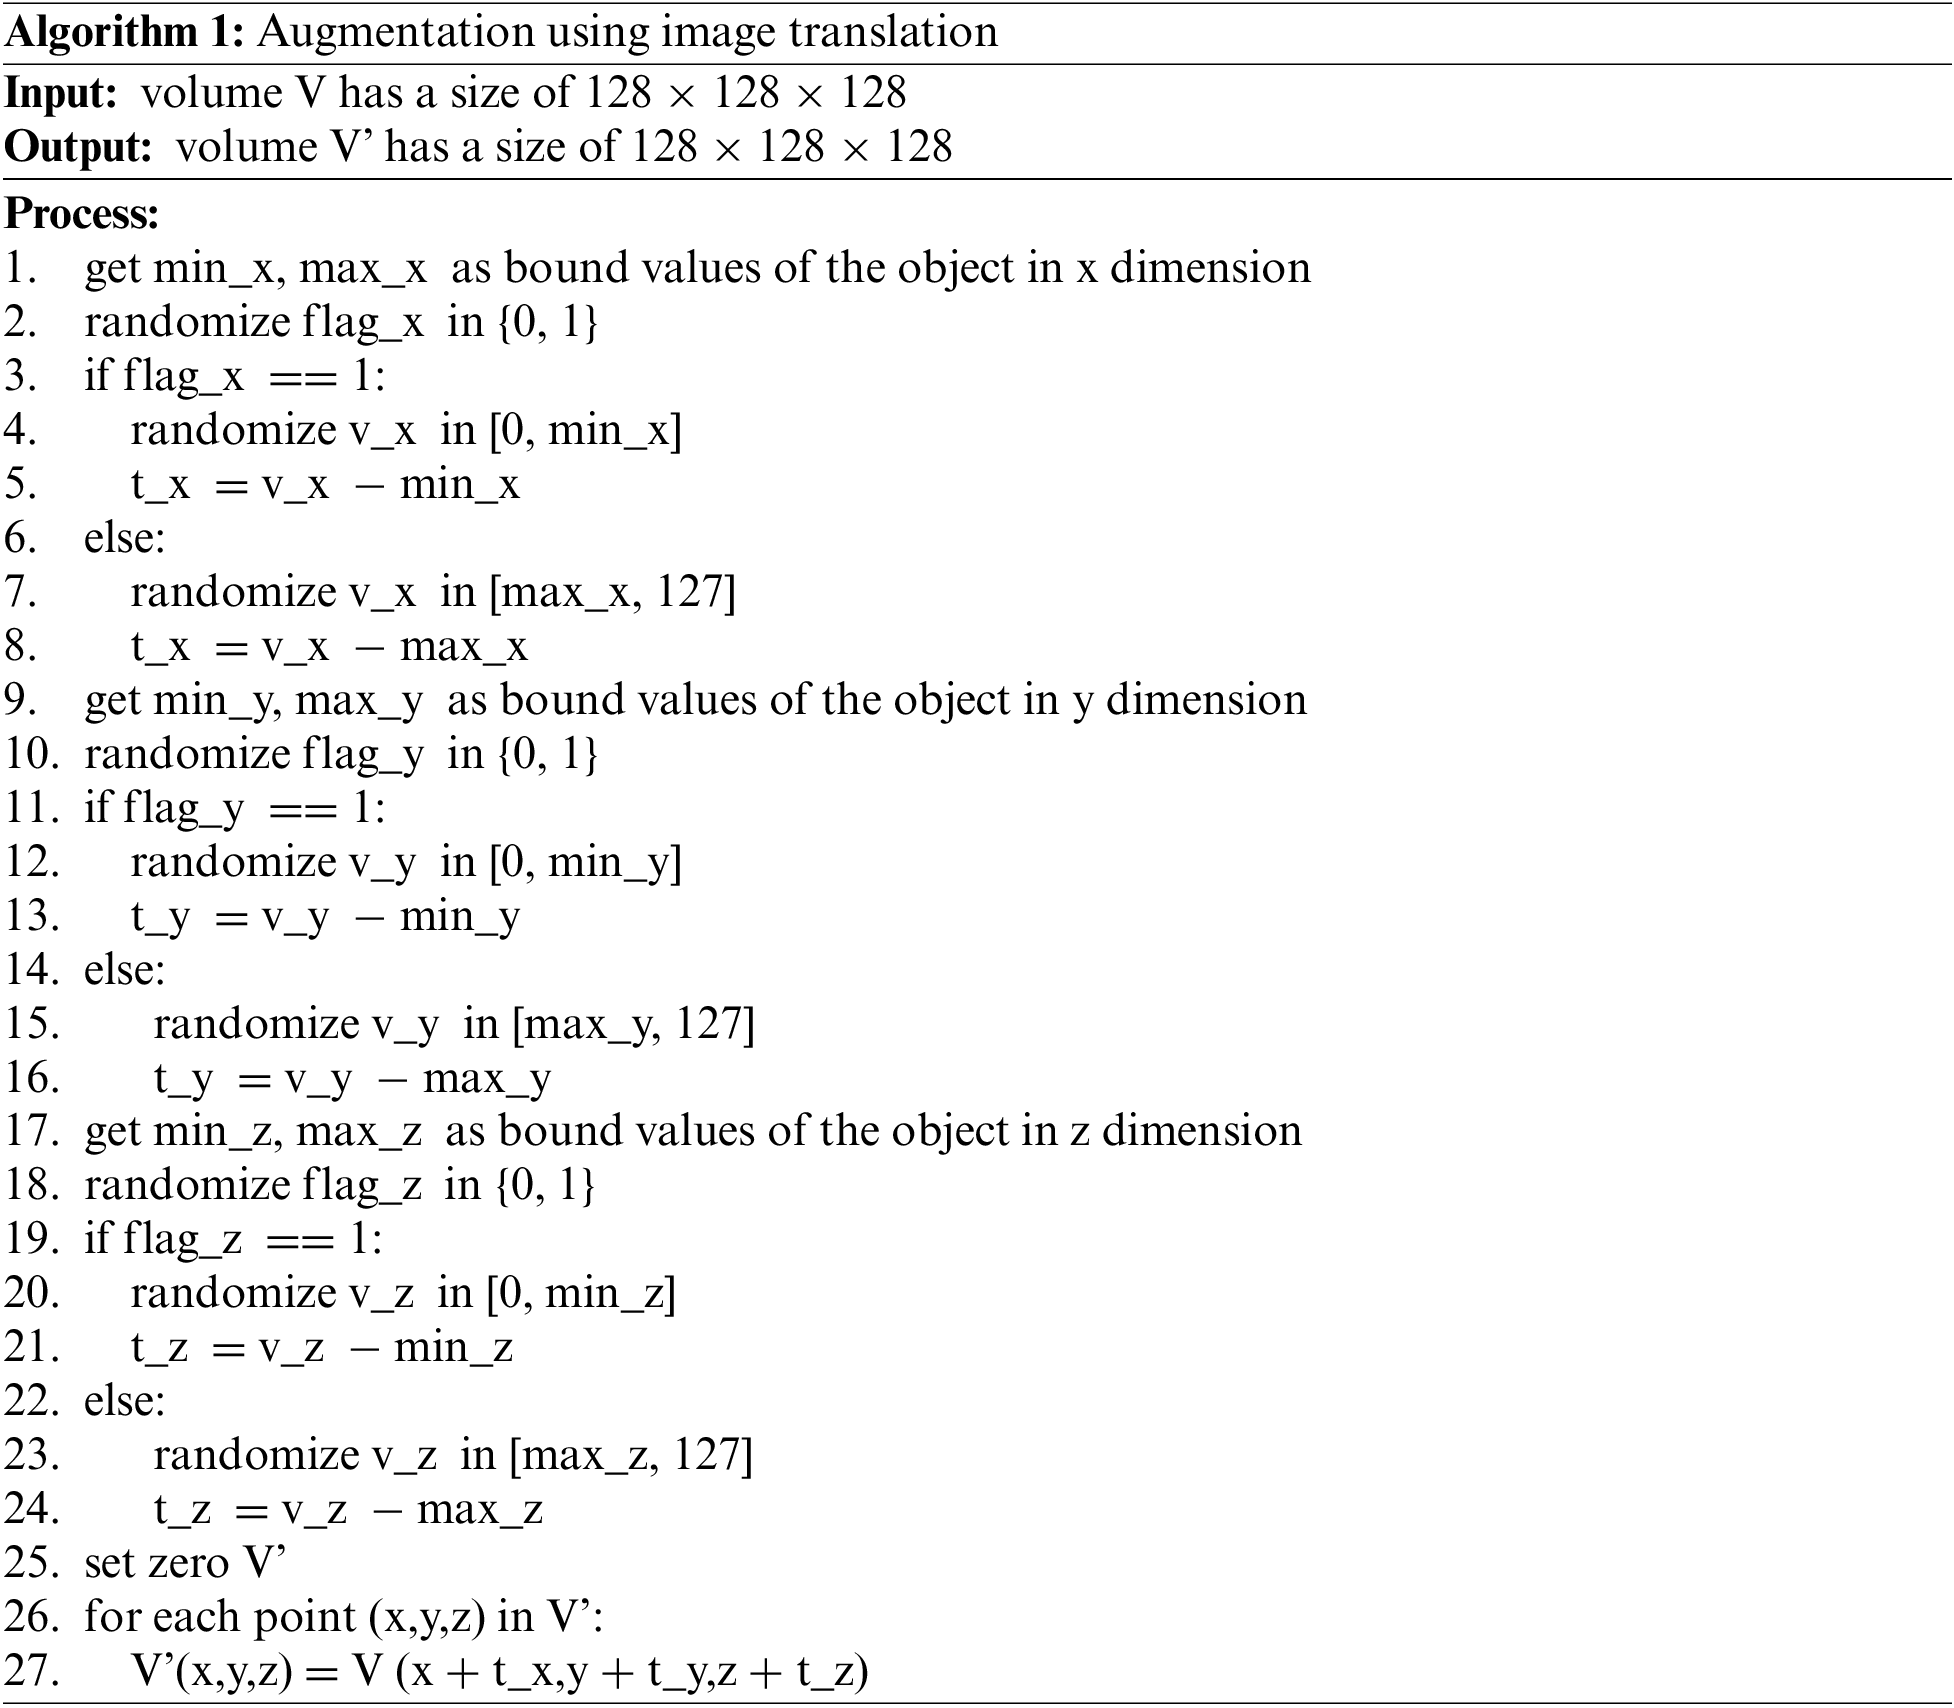
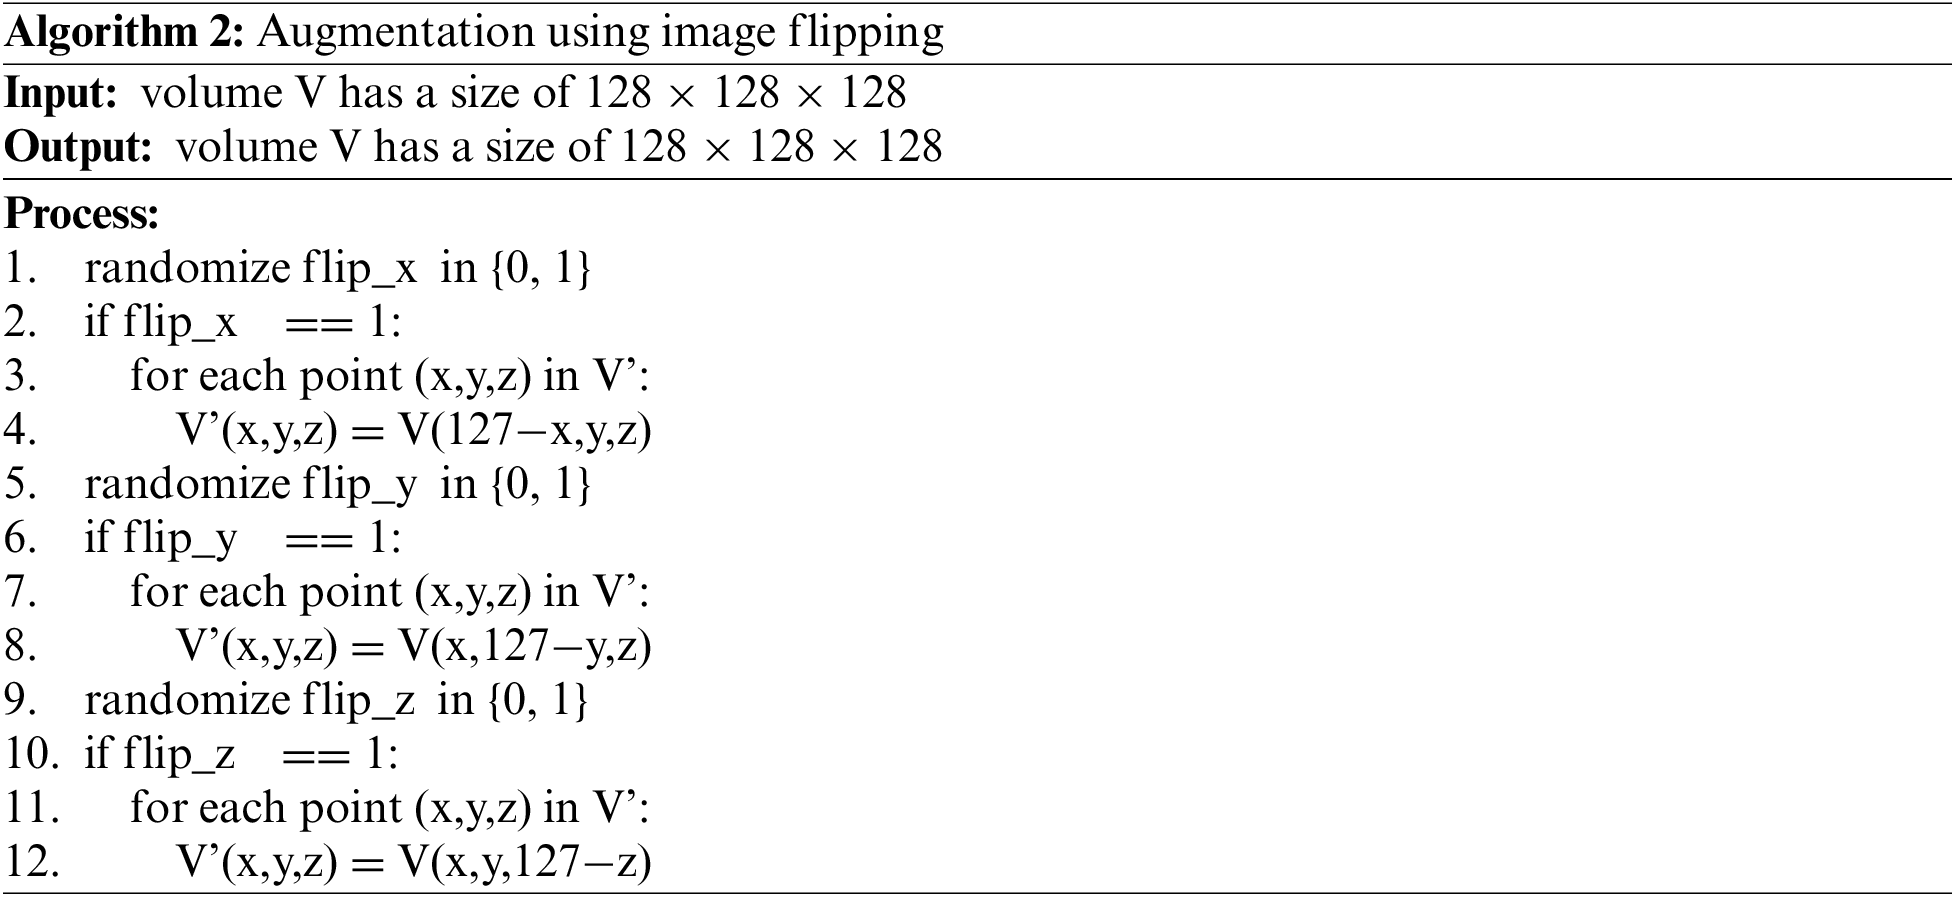
Image flipping performs rotating images randomly by 180 degrees over axes. This technique will change the pose of the 3D volume of the body part. Since the 3D volume is generated from CT slices, this technique can be performed quickly and without the need to interpolate the data at gaps in the corner regions. The algorithm is described as follows:
2.4 The Custom Convolutional Neural Network
The structure of the network is inspired by the U-net [19], a type of convolutional neural network popular in the image segmentation problem. The original network architecture was proposed by Ronneberger et al. in 2015. Besides, the architecture also uses residual blocks [20] proposed by He et al in a neural network architecture for the image recognition problem. He et al. showed that using residual blocks gives the ability to train deeper networks and thus achieve better performance. The special element in this mechanism is that skip-connection will add input to the output of the block. It helps to preserve and keep the features from the previous layers, the features are reused and propagated with successive layers. This mechanism helps the model limit the vanishing gradient descent in the optimization process.
In this work, the network model is designed with the structure shown in Fig. 2. Basically, the network consists of two parts, down-sampling and up-sampling. Residual blocks will be applied to both two parts.
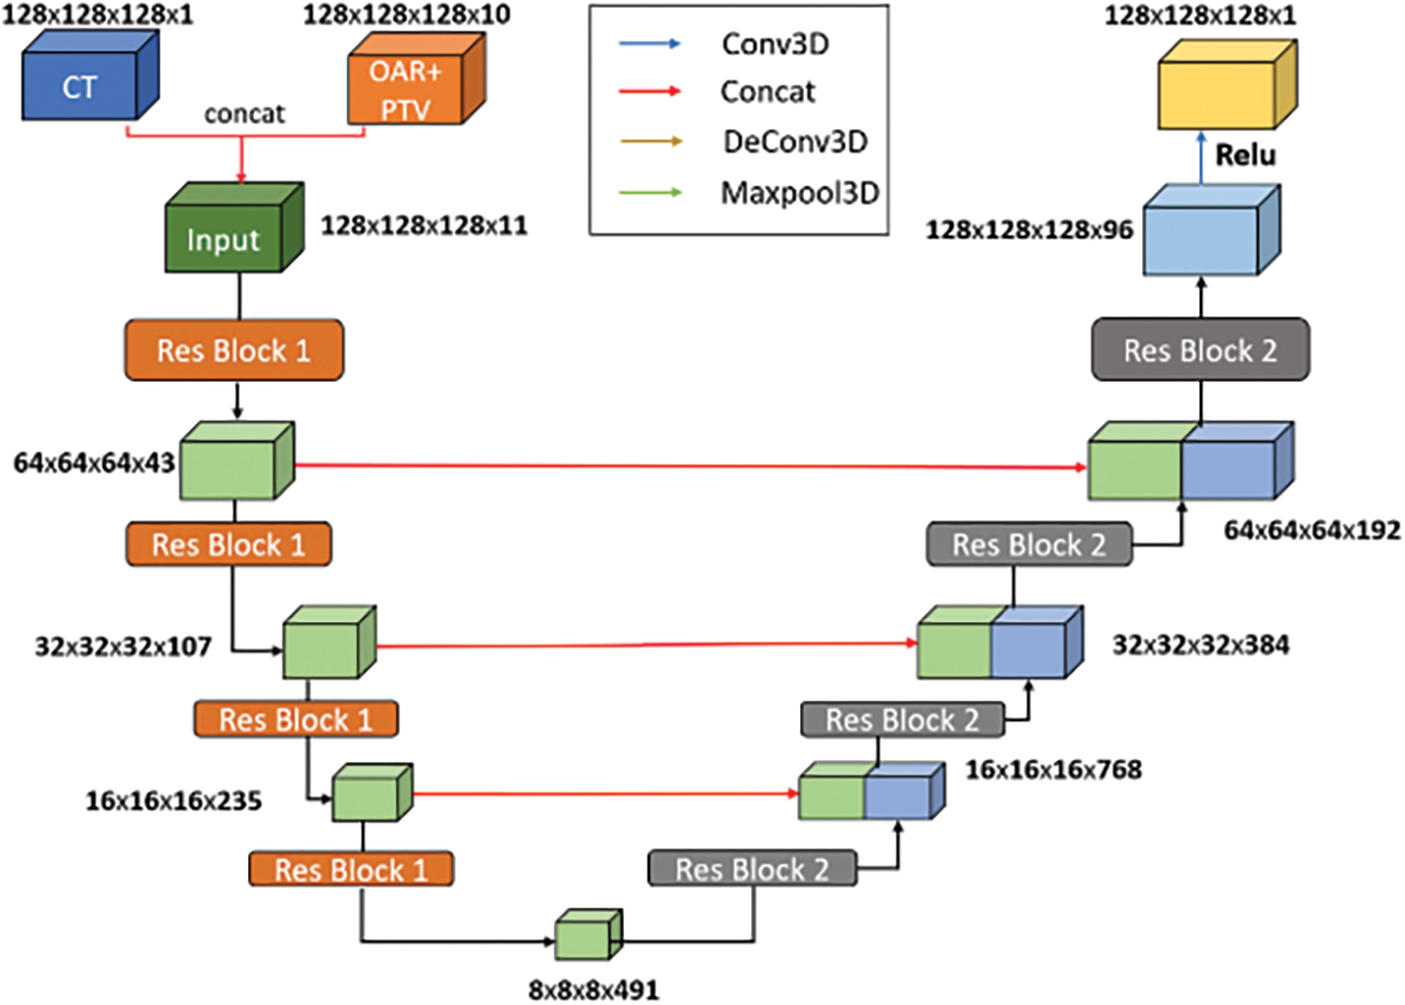
Figure 2: Our custom convolutional neural network (CNN) architecture
The input data has a dimension of 128 × 128 × 128 × 11 with the first three being the size of the image and the last being the number of channels. Of those 11 channels, 1 channel is CT image, 7 channels are information of OARs and the remaining 3 channels are information of PTVs.
Those residual blocks consist of two convolution layers with the same sliding window size of 3 × 3 × 3, stride equal to 1, and padded to preserve the output size. Following each convolution layer is a LeakyRelu function. After each residual block in the down-sampling part, a Max-pooling layer is used. This layer directly shrinks the output size of the feature map and thereby extracts the feature. And after each residual block in the up-sampling part is a deconvolutional layer to decode the information and enlarge the feature map size.
The output of the network is added with a Re-LU function for each pixel to ensure there are no negative values, which are absurd with radiation doses, and a final output of size 128 × 128 × 128 is obtained at last.
In comparison, the network in this paper is improved based on the U-net network, which is used in the problem of two-dimensional medical image segmentation. Therefore, some parts of its architecture were changed to solve the problem of predicting radiotherapy. Firstly, to be able to work with three-dimensional data, the 2D convolution, 2D pooling, and 2D convolution-transpose layers are transformed into 3D convolution, 3D pooling, and 3D convolution-transpose, respectively. Secondly, the input to the original U-net is a two-dimensional image but the input of our network is a 128 × 128 × 128 three-dimensional image with 11 channels representing data of CT images, 7 of OARs, and 3 of PTVs. Lastly, the output of the original U-net network is a two-dimensional image. The output of our network is a three-dimensional image with 128 × 128 × 128 in size which represents the corresponding radiotherapy dose of each pixel location. So, we applied the Re-LU activation function at the last layer so the pixel value would fit the real dose value, a positive real number.
In general, the predicted dose results are in the form of 3-dimensional raster data. Thus, the data will be displayed as slices of a 1-channel 2-dimensional image. Normally, 1-channel images will be displayed as grayscale. Humans are not well aware of the changes in image data in grayscale. Our vision is more sensitive to distinguishing between colors. Therefore, to provide a better view when observing the results, we apply the color map technique to display the results. For details, we used the look-up table of 256 colors. A slice of dose data would be converted into grayscale form before applying the look-up table. The algorithm can be described as follows:
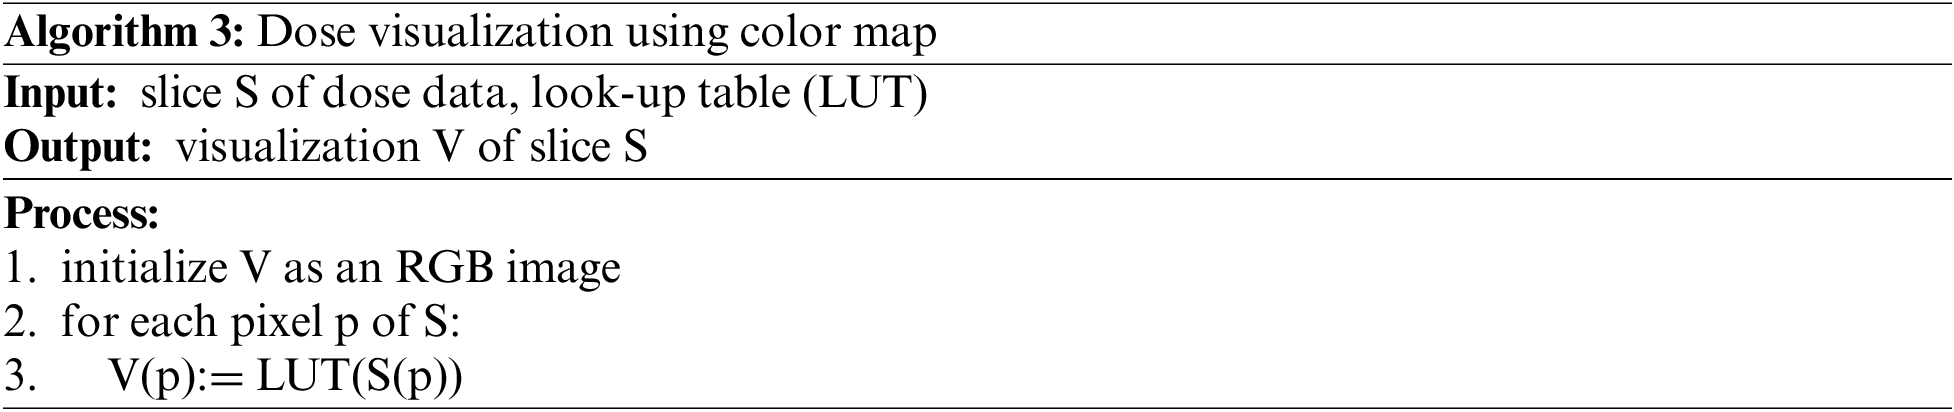
In the experiment, we used the implementation of the color map technique in Matplotlib [21]. The Matplotlib library also supports several built-in color map types that we can use directly.
In our work, we constructed experiment strategies as follows: direct training on original dataset, training on dataset applied data preprocessing, training on dataset applied augmentation, training on dataset applied data preprocessing and augmentation. From the experiments, the evaluation scores would point to the effect of data preprocessing and augmentation on medical images, especially the CT images of head and neck cancer patients treated with radiation therapy.
3.1 Strategy 1: Direct Training on Original Dataset
Firstly, we tried to train a CNN model directly on original dataset without any data processing manipulations as described in Fig. 3. The training process must deal directly with the complexity of the texture in medical images. When evaluating the trained model, the testing performance should be the lowest in all experiment strategies.
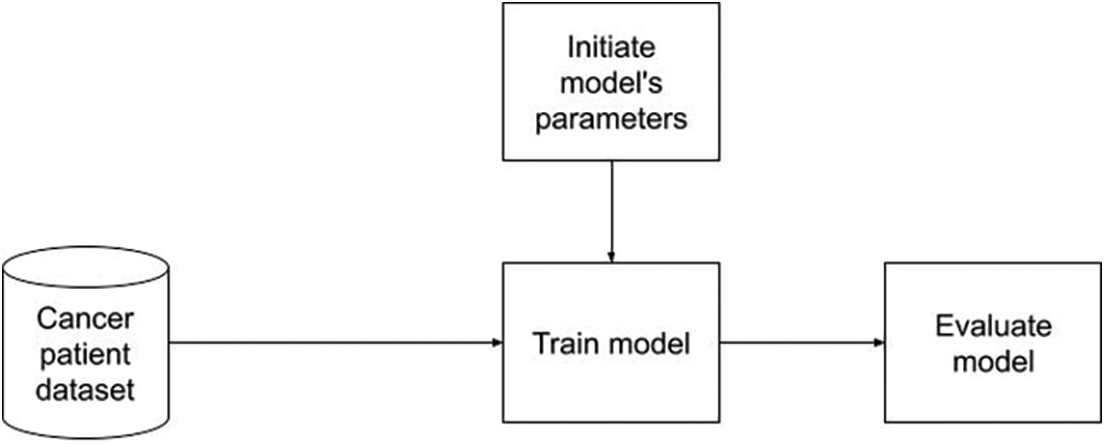
Figure 3: Direct training on original dataset flowchart
3.2 Strategy 2: Training on Dataset Applied Data Preprocessing
Secondly, a model would be trained on dataset which was applied data preprocessing as described in Fig. 4. Similar to the strategy 1, no augmentation was performed. By the effect of data preprocessing, the experiment result in the first experiment should be lower than this strategy.
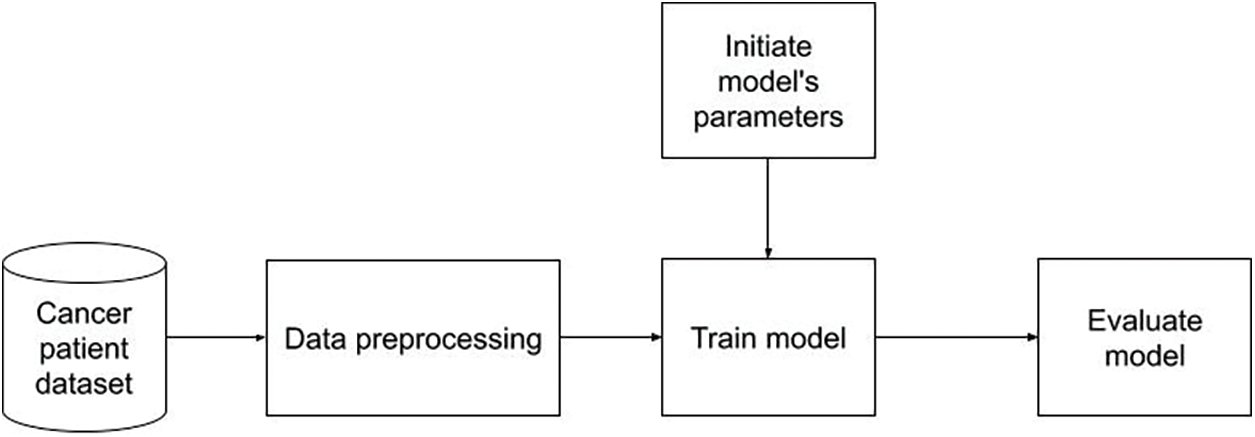
Figure 4: Training on dataset applied data preprocessing flowchart
3.3 Strategy 3: Training on Dataset Applied Augmentation
Next, we trained a model on dataset which was applied augmentation as described in Fig. 5. Similar to the strategy 1, no data preprocessing was performed. By the effect of data preprocessing, we expected that scores in this strategy would be better than strategy 1.
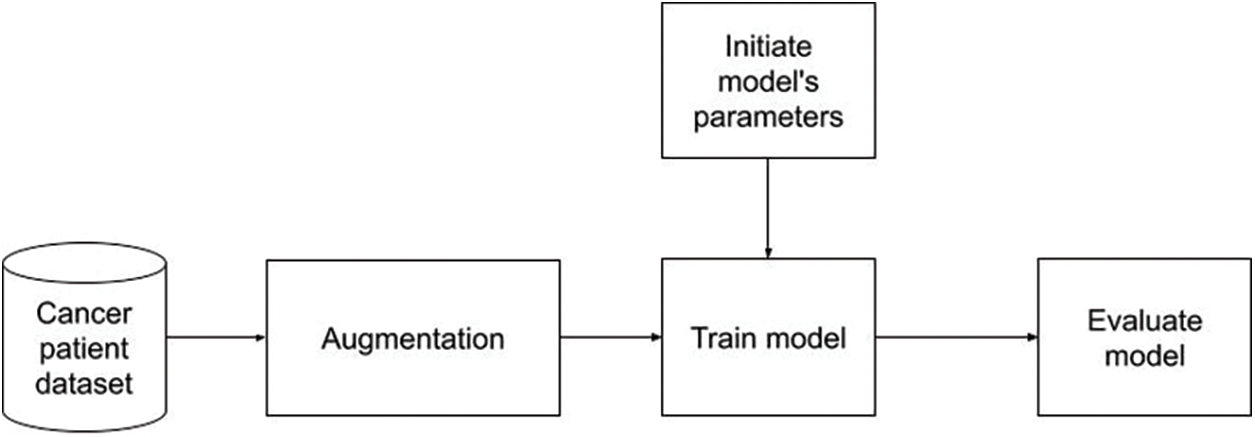
Figure 5: Training on dataset applied augmentation flowchart
3.4 Strategy 4: Training on Dataset Applied Data Preprocessing and Augmentation
Lastly, we conducted the experiment with the dataset applied data preprocessing and augmentation as described in Fig. 6. In our hypothesis, the trained data is better on both the quality and quantity. Therefore, this strategy should achieve the best performance among four options.
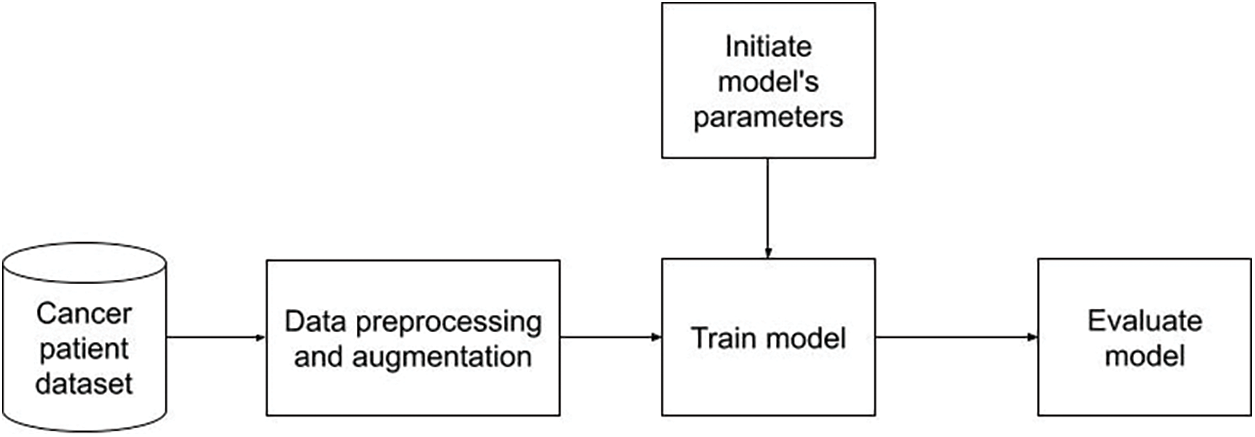
Figure 6: Training on dataset applied data preprocessing and augmentation flowchart
To evaluate the performance of dose prediction for each patient, we use two metrics as dose-score and DVH-score. For calculation, we will compare the predicted dose versus the true dose.
Dose-score of a patient is the average of the absolute difference between the predicted value and the true value over the volume of interest receiving radiation therapy. The absolute difference of each sample is calculated from every voxel.
The formula is calculated as follows:
In which, p is patient,
DVH-score is the absolute distance between the two corresponding DVH values of the predicted radiation dose and the actual required radiation dose. DVH is a radiotherapy dose-related value in a radiotherapy treatment plan calculated over the OAR and the PTV. For OAR, we need to calculate the average dose received for each organ, and the maximum dose is received in 0.1cc of each organ. For PTV, we need to calculate the radiotherapy dose received by the voxels in each target area at the given rates. Here, the rates are 1%, 95%, and 99%. The DVH-score is a clinically standard measure of the quality of predicted radiotherapy dose in radiotherapy. The formula is calculated as follows:
In which, p is patient,
In this section, we would discuss the experiment results. For training and scoring the model, we used the training set with 200 volume samples and the testing set with 100 volume samples. For strategies applied data augmentation, the training set size increased four times. In detail, the training set had 800 volume samples in those strategies. The optimization process would be stopped when the model has no signal of improvement or over fitting occurs. After that, we would analyze the effectiveness of each strategy based on the figures on both the training set and the testing set.
We conducted experiments using Nvidia Tesla K80 Graphics processing unit (GPU) of the Google Colab platform [22] combined with Nvidia Tesla P100 GPU of the Kaggle platform [23]. The true radiotherapy dose distribution provided by the dataset will be used as the reference value for the model. The model uses the mean absolute error loss function, Adam’s algorithm [24] with parameters learning rate = 0.001, decay = 0.0001, momentum β1 = 0.9, and β2 = 0.99. These parameters are used to minimize the loss function between the predicted dose and the true dose. The program of the study was coded in Python language and based on the deep-learning library Tensor-flow [25].
Firstly, we observe the training results of four strategies.
Fig. 7 gives information about the changes in training loss values and validation loss values of four training strategies during the training period. Overall in training loss values, what stands out from the graph is that there was a considerable downward trend in the training losses of all strategies while the validation losses not only reduced but also fluctuated clearly during the whole period.
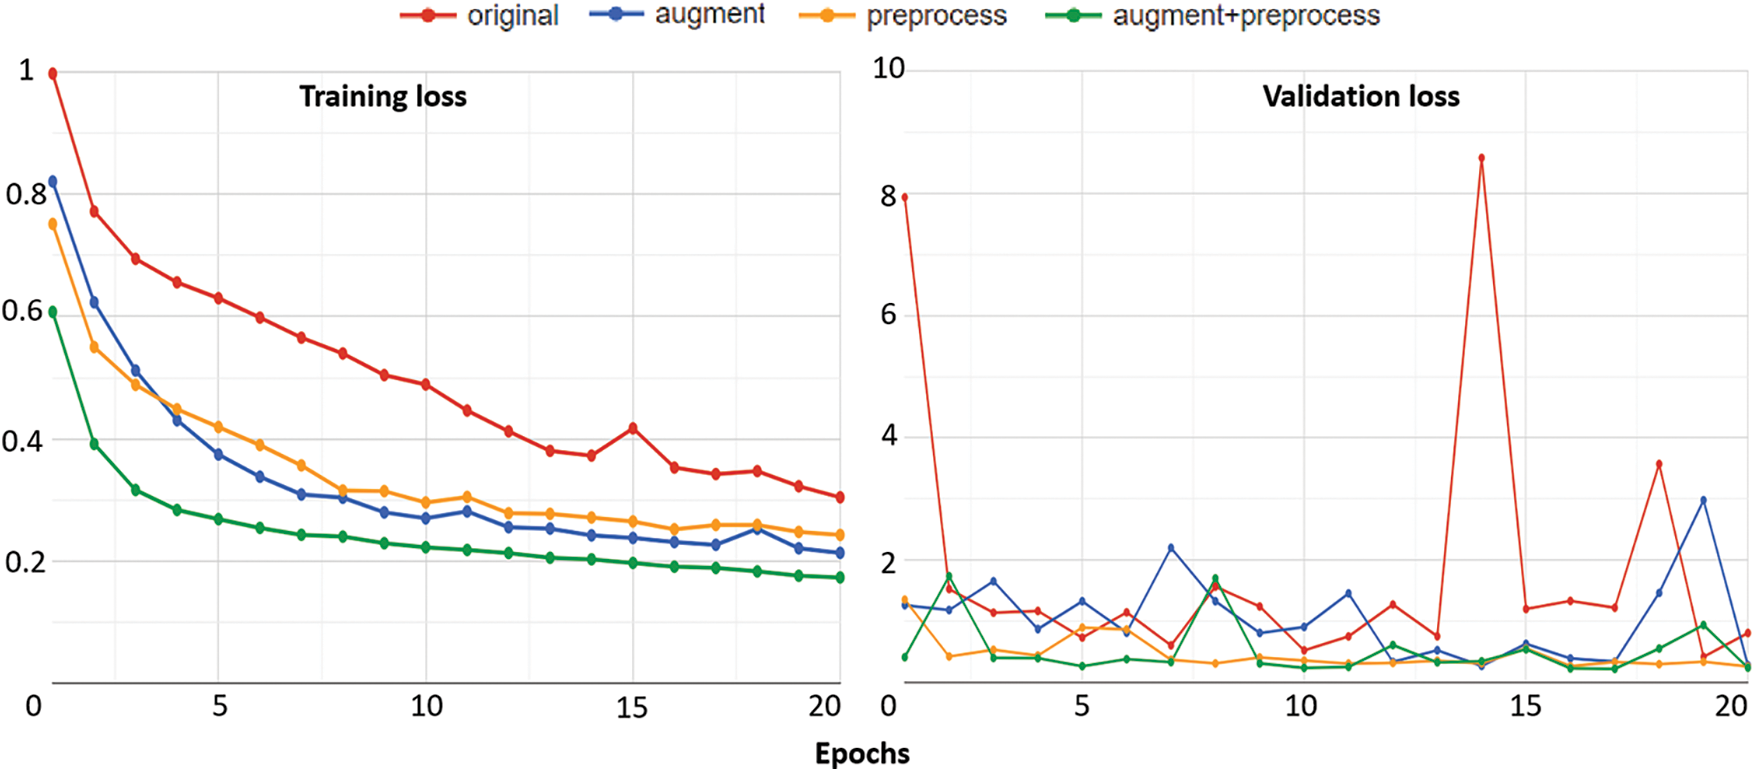
Figure 7: The training results of four strategies: training loss (left) and validation loss (right)
Looking at the details of strategy 4 which combines data preprocessing and augmentation, as regards the training loss, the figure started at 0.607552 at epoch 1 then there was a sharp decline to 0.316148 over the next 2 epochs. Subsequently, the figure went down slowly, finishing at around 0.173049 at epoch 20. Similarly, the training loss of strategy 4 also reduced rapidly from 0.997431 at epoch 1 to 0.694314 at epoch 3. Thereafter, this value mainly decreased over the remaining epochs and had a slight fluctuation at the four ending epochs of the period. Similarly, for validation losses, the value of strategy 4 started at 0.414333 at epoch 1 and then reached 0.243568 at last after the reducing and fluctuating process.
Another interesting point is that the training loss of strategy 4 always remained at the lowest value while that of strategy 1 always remained at the highest value during the whole period. Similarly for validation losses, the value of strategy 4 also mainly remained at the bottom while that of strategy 1 mainly remained at the top during the whole period. The training losses and the validation losses of strategy 2 and strategy 3 had an unclear difference. There were times when the value of strategy 2 was higher than strategy 3 and vice versa.
The reason for the best quality of strategy 4 is that it combines data preprocessing and augmentation. Besides, the worst strategy is strategy 1, which only used original samples. By using better-quality training data, the model in strategy 4 achieved higher training results. So, we can see obviously the role of data processing techniques in the training phase.
After finishing the training phase, we conducted the testing phase, and all trained models were evaluated with 100 test samples. The testing phase uses Dose-score and DVH-score. All figures were described in Table 1.
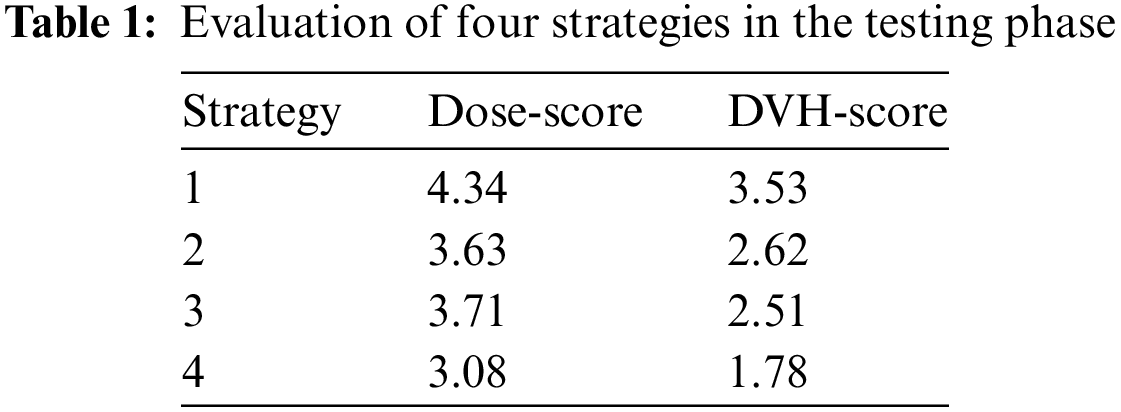
What stands out from Table 1 is that strategy 4 is the best strategy with the lowest values in both Dose-score and DVH-score while strategy 1 is the worst strategy with the highest values in both Dose-score and DVH-score. In detail, Dose-score in strategy 1 is 4.34, and in strategy 4 is 3.08. DVH-score in strategy 1 is 3.53, and in strategy 4 is 1.78. Generally, it is similar to information from Fig. 7. It also accurately reflects our opinion when designing four strategies.
In other strategies, strategy 2 is better than strategy 3 regarding the Dose-score and vice versa regarding the DVH-score. So it is difficult to compare the effect of the Dose-score to the effect of the DVH-score or vice versa. It is also rather similar in the training loss values of strategy 2 and strategy 3.
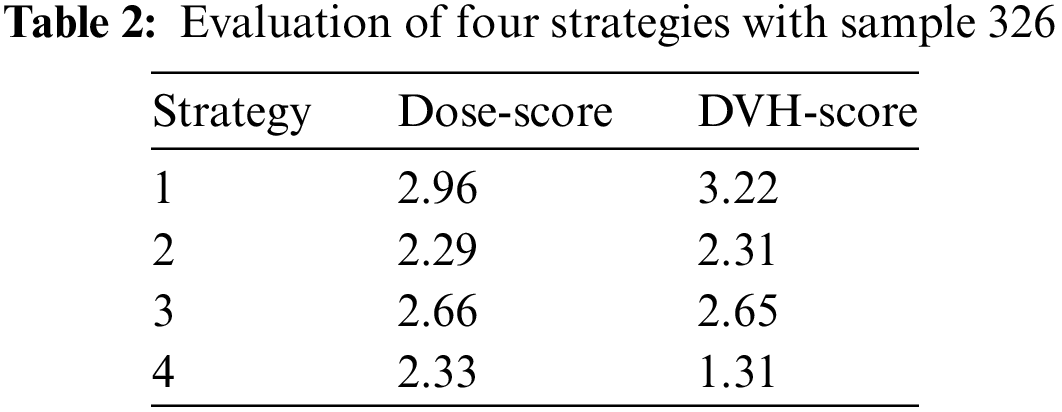
Next, we provided the evaluation when focusing on the result of one sample prediction. Here, we analyzed the result prediction of the trained model in strategy 4 which has our custom architecture, and applied the data preprocessing and augmentation. The results were almost discussed in visualization information. Because of the result as the 3D dose volume, we would observe data as slices viewing in dimensions. We randomly chose sample 326 in the dataset. In strategy 4, the result of this sample was scored 2.33 in terms of Dose-score and 1.31 in terms of DVH-score. We could see the detail in other strategies in Table 2.
As presented in Subsection 2.5, we would visualize predicted dose volume as a heat map for each slice viewing. Here, we also displayed the result of sample 326 in Fig. 8.
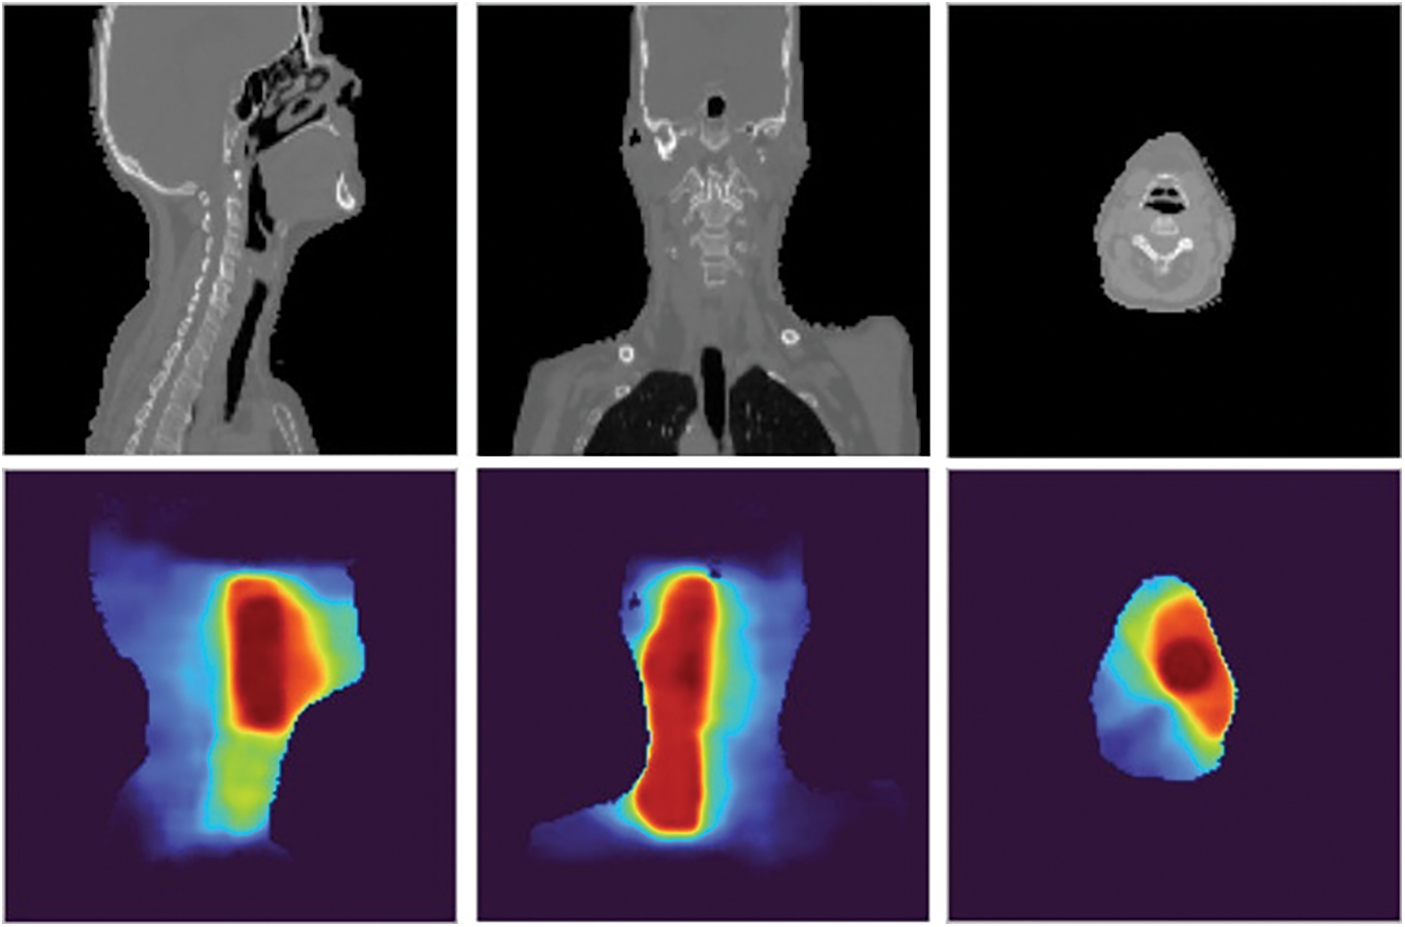
Figure 8: Three views of the prediction result of sample 326: the CT images (first row) and the dose visualizations (second row)
On the second row of Fig. 8, the redder the color of the heat map, the higher the intensity of the radiation dose and vice versa. To compare to the ground truth data, we provided more information as rows in Fig. 9.
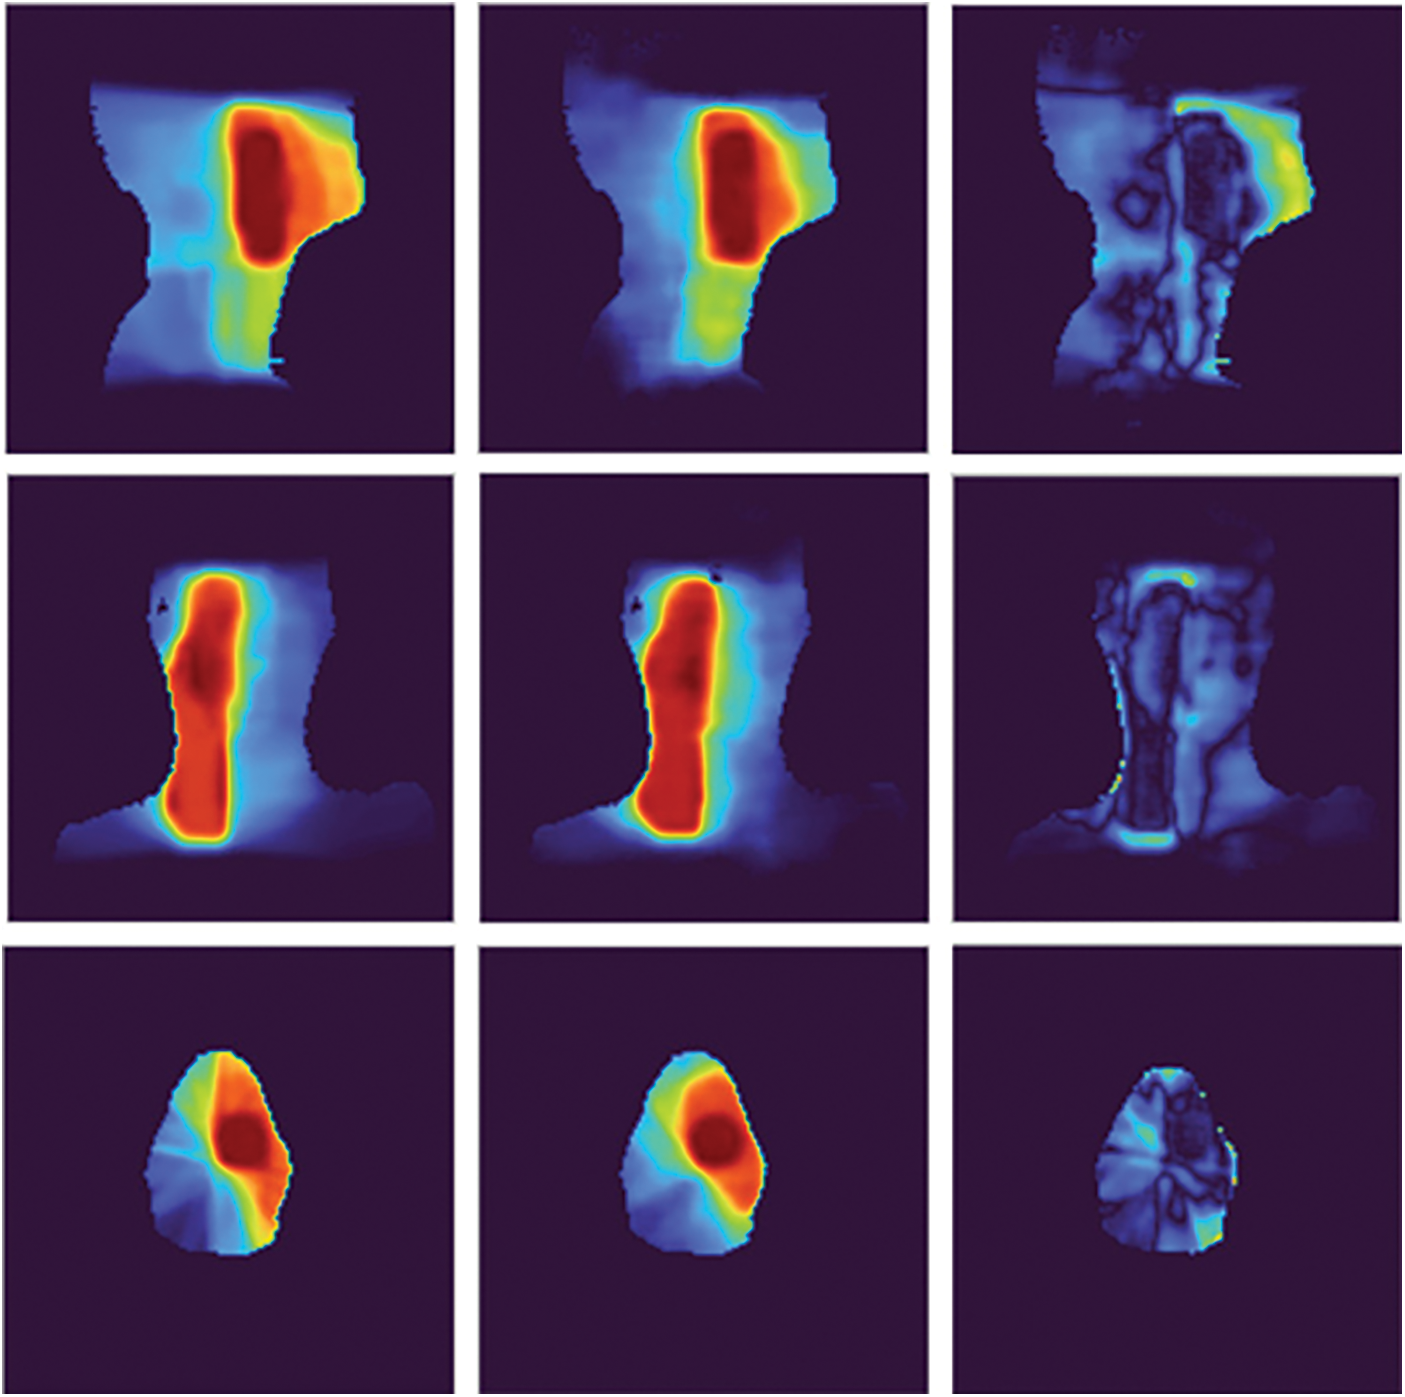
Figure 9: The comparison of the prediction results with the ground truth data of sample 326: the ground truth (left), the predicted dose (middle), and the difference image (right)
In Fig. 9, on the one hand, we would sense the similar of the prediction results and the ground truth data by see images in the first column and the second column. On the other hand, we would analyze the difference images in the third column. Each pixel in a difference image is computed by getting an absolute value of subtraction result between the corresponding pixels in the prediction results and the ground truth data. We could see intensities in each difference image are low in almost area of the image, especially in the red and orange regions of ground truth data. For the comparison between strategies, we provided information on each strategy in Fig. 10.
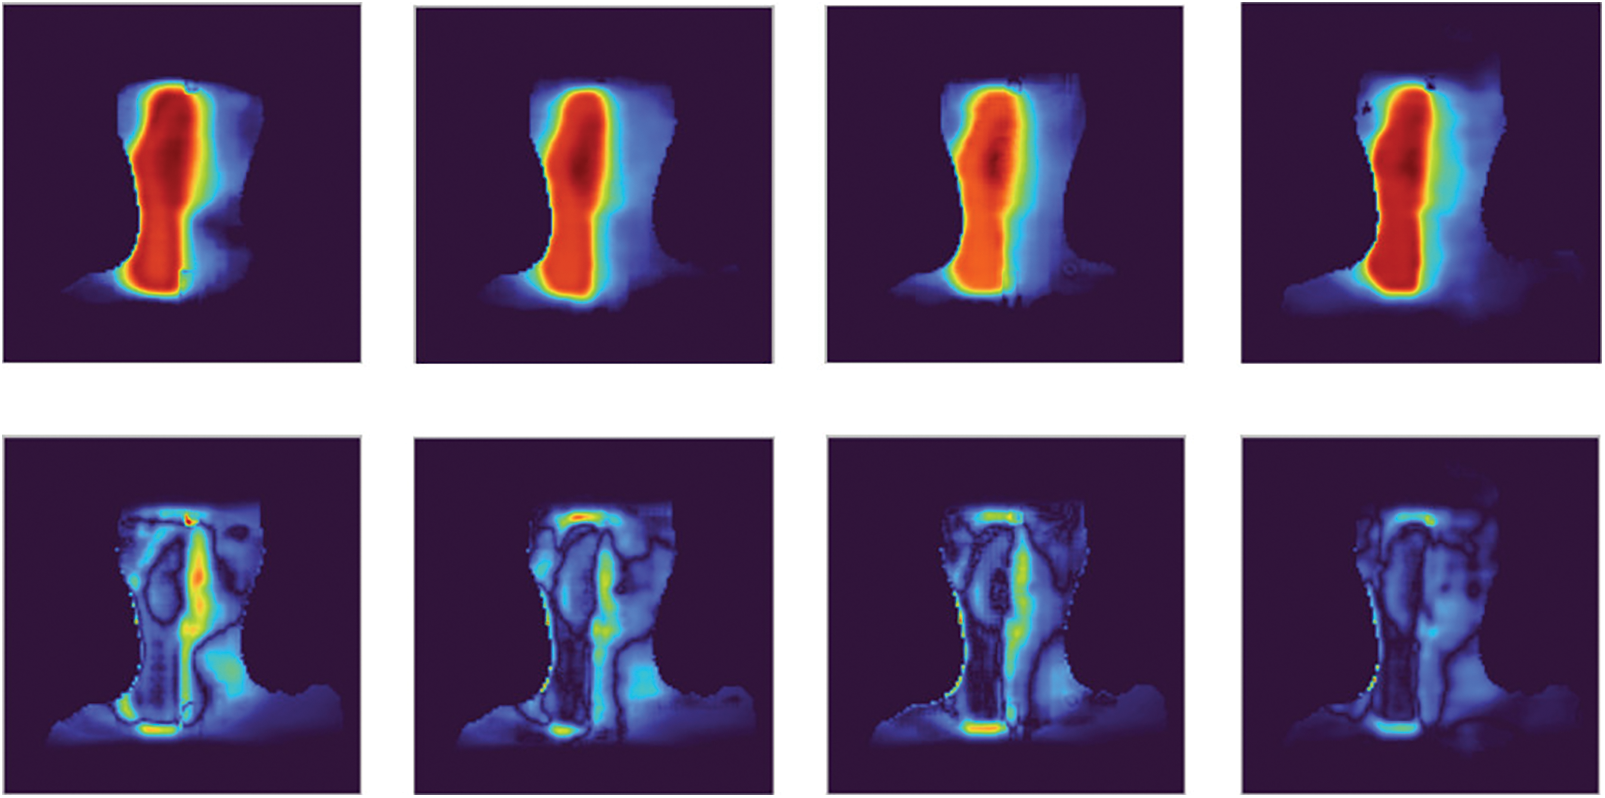
Figure 10: The comparison between strategies of sample 326: strategy 1 to strategy 4 from left to right, each column includes the predicted dose visualization and the difference image
In Fig. 10, the first column is the predicted dose visualization and the difference image of strategy 1, and the fourth column is the predicted dose visualization and difference image of strategy 4. It is easy to see the difference image of strategy 1 has more high-intensity regions than the difference image of strategy 4. It reflects the predicted dose in strategy 1 has lower quality than the predicted dose in strategy 4 when we compare the predicted doses to the ground truth.
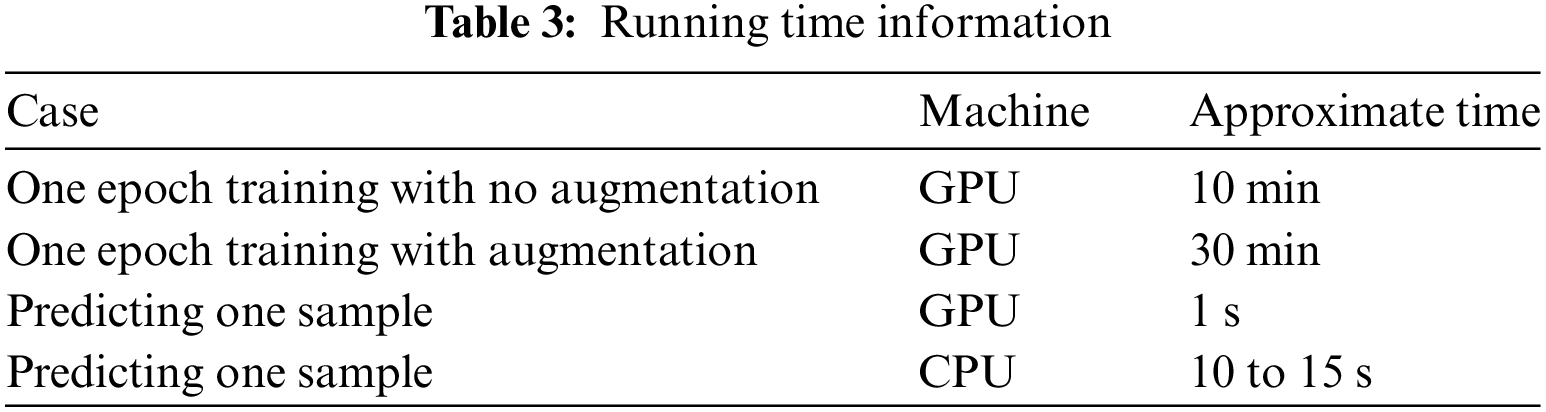
In addition, we provided the running time with the training time of one epoch and the prediction time with 1 sample. The prediction times were evaluated both in terms of GPU and Central processing unit (CPU). In detail, we tested in the server GPU of the Google Colab platform with the configuration of Intel Xeon CPU @2.20 GHz 13 GB RAM Tesla K80 GPU and in the personal machine with the configuration of Intel I5 8265U @1.60 GHz 12 GB RAM. All figures were described in Table 3.
Lastly, we conducted the comparison with the DeepDoseNet [8]. The authors of the DeepDoseNet practiced their model with several cases of the loss function. In Table 4, we compared our result to the DeepDoseNet in case of the same loss function as the mean absolute error loss.
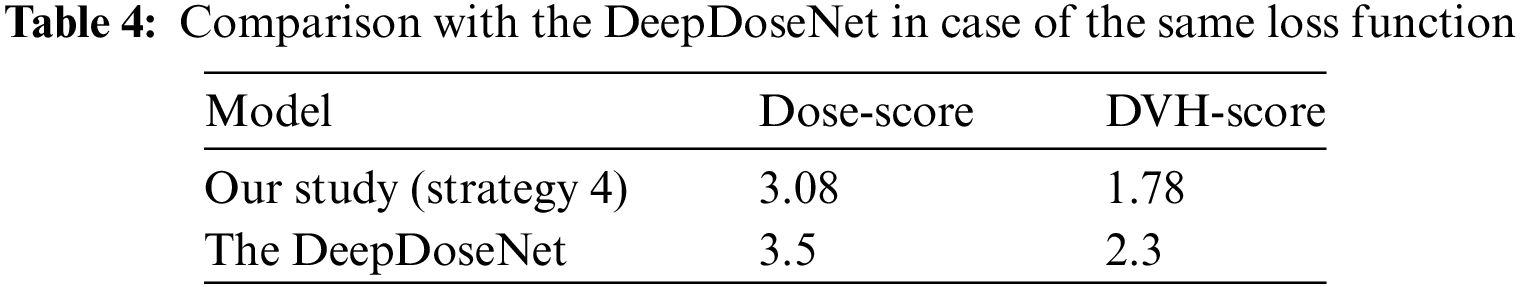
The DeepDoseNet also used the residual mechanism. But compared to our model, the authors of the DeepDoseNet designed fewer layers. Especially, they did not apply any data augmentation technique and also did not discuss the data preprocessing technique.
In this paper, we focused on predicting radiation dose from medical images and analyzed the influence of data preprocessing and augmentation. In the experiment, we used data from head and neck cancer patients treated with radiation therapy of The Open Knowledge-Based Planning Challenge. The effectiveness of our hypothesis was pointed out clearly in the results of four strategies. The best solution also was compared to another study to prove the performance. Cancer is a dangerous disease so requires a lot of attempts to prevent it and radiotherapy is one of the main treatments for cancer by applying radiation therapy beams to eliminate disease cells. We have achieved some success in the dose prediction problem in the radiotherapy field but there is a lot of work to do to fill the gap between the abilities of the artificial intelligent model and the medical requirements in reality. This study is one of our initial steps aiming to create artificial intelligent systems in the medical industry for cancer prevention.
Acknowledgement: None.
Funding Statement: The research content in this article is sponsored by the Institute of Information Technology (Vietnam Academy of Science and Technology) with Project Code “CS24.01”.
Author Contributions: Study conception and design: Do Nang Toan, Ha Manh Toan; analysis and interpretation of results: Do Nang Toan, Nguyen Trong Vinh, Pham Trung Hieu, Lam Thanh Hien; draft manuscript preparation: Do Nang Toan, Ha Manh Toan. All authors reviewed the results and approved the final version of the manuscript.
Availability of Data and Materials: Not applicable.
Conflicts of Interest: The authors declare that they have no conflicts of interest to report regarding the present study.
References
1. World Health Organization, “Cancer,” 2022. Accessed: December 12, 2023. [Online]. Available: https://www.who.int/news-room/factsheets/detail/cancer [Google Scholar]
2. The Global Cancer Observatory, “Vietnam,” 2021. Accessed: December 12, 2023. [Online]. Available: https://gco.iarc.fr/today/data/factsheets/populations/704-viet-nam-fact-sheets.pdf [Google Scholar]
3. S. Gianfaldoni, R. Gianfaldoni, U. Wollina, J. Lotti, G. Tchernev, and T. Lotti, “An overview on radiotherapy: From its history to its current applications in dermatology,” Open Access Maced. J. Med. Sci., vol. 5, no. 4, pp. 521–525, 2017 [Google Scholar] [PubMed]
4. S. X. Jiao, L. X. Chen, J. H. Zhu, M. L. Wang, and X. W. Liu, “Prediction of dose-volume histograms in nasopharyngeal cancer IMRT using geometric and dosimetric information,” Phys. Med. Biol., vol. 64, no. 23, pp. 23NT04, 2019. doi: 10.1088/1361-6560/ab50eb [Google Scholar] [PubMed] [CrossRef]
5. A. Babier, R. Mahmood, A. L. McNiven, A. Diamant, and T. C. Y. Chan, “Knowledge-based automated planning with three-dimensional generative adversarial networks,” Med. Phys., vol. 47, no. 2, pp. 297–306, 2020. doi: 10.1002/mp.13896 [Google Scholar] [PubMed] [CrossRef]
6. S. H. Ahn et al., “Deep learning method for prediction of patient-specific dose distribution in breast cancer,” Radiat Oncol, vol. 16, no. 1, pp. 1–13, 2021. doi: 10.1186/s13014-021-01864-9 [Google Scholar] [PubMed] [CrossRef]
7. Y. Liu et al., “Dose prediction using a three-dimensional convolutional neural network for nasopharyngeal carcinoma with tomotherapy,” Front. Oncol., vol. 11, pp. 752007, 2021. doi: 10.3389/fonc.2021.752007 [Google Scholar] [PubMed] [CrossRef]
8. S. M. Hussain, L. A. V. Gabriel, N. Hamidreza, and V. S. Jeffrey, “DeepDoseNet: A deep learning model for 3D dose prediction in radiation therapy,” 2021. Accessed: December 12, 2023. [Online]. Available: https://arxiv.org/abs/2111.00077 [Google Scholar]
9. A. Babier et al., “OpenKBP: The open-access knowledge-based planning grand challenge and dataset,” Med. Phys., vol. 48, no. 9, pp. 5549–5561, 2021. Accessed: December 12, 2023. [Online]. Available: https://github.com/ababier/open-kbp [Google Scholar]
10. M. P. Gronberg et al., “Dose prediction for head and neck radiotherapy using a three-dimensional dense dilated U-net architecture,” Med. Phys., vol. 48, no. 9, pp. 5567–5573, 2021. doi: 10.1002/mp.14827. [Google Scholar] [CrossRef]
11. L. Zimmermann, E. Faustmann, C. Ramsl, D. Georg, and G. Heilemann, “Dose prediction for radiation therapy using feature-based losses and one cycle learning,” Med. Phys., vol. 48, no. 9, pp. 5562–5566, 2021. doi: 10.1002/mp.14774. [Google Scholar] [CrossRef]
12. H. M. Toan, L. T. Hien, N. D. Vinh, and D. N. Toan, “Detecting tuberculosis from vietnamese x-ray imaging using transfer learning approach,” Comput. Mater. Contin., vol. 74, no. 3, pp. 5001–5016, 2023. doi: 10.32604/cmc.2023.033429. [Google Scholar] [CrossRef]
13. C. Le Van, V. Puri, N. T. Thao, and D. Le, “Detecting lumbar implant and diagnosing scoliosis from vietnamese x-ray imaging using the pre-trained api models and transfer learning,” Comput. Mater. Contin., vol. 66, no. 1, pp. 17–33, 2021. doi: 10.32604/cmc.2020.013125. [Google Scholar] [CrossRef]
14. F. Kallel and A. B. Hamida, “A new adaptive gamma correction based algorithm using DWT-SVD for non-contrast CT image enhancement,” IEEE Trans. Nanobiosci., vol. 16, no. 8, pp. 666–675, 2017. doi: 10.1109/TNB.2017.2771350 [Google Scholar] [PubMed] [CrossRef]
15. Y. Tang et al., “CT image enhancement using stacked generative adversarial networks and transfer learning for lesion segmentation improvement,” in Int. Workshop Mach. Learn. Med. Imaging, Granada, Spain, 2018, pp. 46–54. [Google Scholar]
16. V. Sandfort, K. Yan, P. J. Pickhardt, and R. M. Summers, “Data augmentation using generative adversarial networks (CycleGAN) to improve generalizability in CT segmentation tasks,” Sci. Rep., vol. 1, no. 1, pp. 16884, 2019. doi: 10.1038/s41598-019-52737-x [Google Scholar] [PubMed] [CrossRef]
17. R. Toda et al., “Lung cancer CT image generation from a free-form sketch using style-based pix2pix for data augmentation,” Sci. Rep., vol. 12, no. 1, pp. 12867, 2022. doi: 10.1038/s41598-022-16861-5 [Google Scholar] [PubMed] [CrossRef]
18. Radiopedia, “Hounsfield unit,” 2023. Accessed: December 12, 2023. [Online]. Available: https://radiopaedia.org/articles/hounsfield-unit [Google Scholar]
19. O. Ronneberger, P. Fischer, and T. Brox, “U-net: Convolutional networks for biomedical image segmentation,” in Int. Conf. Med. Image Comput. Comput.-Assist. Interv., Munich, Germany, 2015, pp. 234–241. [Google Scholar]
20. K. He, X. Zhang, S. Ren, and J. Sun, “Deep residual learning for image recognition,” in Proc. IEEE Conf. Comput. Vis. Pattern Recognit., Las Vegas, NV, USA, 2016. [Google Scholar]
21. Matplotlib, “Choosing colormaps,” 2023. Accessed: December 12, 2023. [Online]. Available: https://matplotlib.org/stable/tutorials/colors/colormaps.html [Google Scholar]
22. Google, “Colaboratory,” 2023. Accessed: December 12, 2023. [Online]. Available: https://colab.research.google.com [Google Scholar]
23. Kaggle, “Kaggle: Your home for data science,” 2023. Accessed: December 12, 2023. [Online]. Available: https://www.kaggle.com [Google Scholar]
24. D. P. Kingma, and J. Ba, “Adam: A method for stochastic optimization,” 2014. Accessed: December 12, 2023. [Online]. Available: https://arxiv.org/abs/1412.6980 [Google Scholar]
25. M. Abadi et al., “TensorFlow: Large-scale machine learning on heterogeneous systems,” 2016. Accessed: December 12, 2023. [Online]. Available: https://arxiv.org/abs/1603.04467 [Google Scholar]
Cite This Article
 Copyright © 2024 The Author(s). Published by Tech Science Press.
This work is licensed under a Creative Commons Attribution 4.0 International License , which permits unrestricted use, distribution, and reproduction in any medium, provided the original work is properly cited.
 Downloads
 Citation Tools