
 Submit a Paper
 Propose a Special lssue
 Open Access
ARTICLE

Tuberculosis Diagnosis and Visualization with a Large Vietnamese X-Ray Image Dataset
1 Faculty of Information Technology, Lac Hong University, Bien Hoa, Dong Nai, 76120, Vietnam
2 Institute of Information Technology, Vietnam Academy of Science and Technology, Hanoi, 10072, Vietnam
3 Faculty of Information Technology, Hanoi University of Industry, Hanoi, 11915, Vietnam
* Corresponding Author: Do Nang Toan. Email:
Intelligent Automation & Soft Computing 2024, 39(2), 281-299. https://doi.org/10.32604/iasc.2024.045297
Received 23 August 2023; Accepted 24 January 2024; Issue published 21 May 2024
 View Full Text
 Download PDF
Abstract
Tuberculosis is a dangerous disease to human life, and we need a lot of attempts to stop and reverse it. Significantly, in the COVID-19 pandemic, access to medical services for tuberculosis has become very difficult. The late detection of tuberculosis could lead to danger to patient health, even death. Vietnam is one of the countries heavily affected by the COVID-19 pandemic, and many residential areas as well as hospitals have to be isolated for a long time. Reality demands a fast and effective tuberculosis diagnosis solution to deal with the difficulty of accessing medical services, such as an automatic tuberculosis diagnosis system. In our study, aiming to build that system, we were interested in the tuberculosis diagnosis problem from the chest X-ray images of Vietnamese patients. The chest X-ray image is an important data type to diagnose tuberculosis, and it has also received a lot of attention from deep learning researchers. This paper proposed a novel method for tuberculosis diagnosis and visualization using the deep-learning approach with a large Vietnamese X-ray image dataset. In detail, we designed our custom convolutional neural network for the X-ray image classification task and then analyzed the predicted result to provide visualization as a heat-map. To prove the performance of our network model, we conducted several experiments to compare it to another study and also to evaluate it with the dataset of this research. To support the implementation, we built a specific annotation system for tuberculosis under the requirements of radiologists in the Vietnam National Lung Hospital. A large experiment dataset was also from this hospital, and most of this data was for training the convolutional neural network model. The experiment results were evaluated regarding sensitivity, specificity, and accuracy. We achieved high scores with a training accuracy score of 0.99, and the testing specificity and sensitivity scores were over 0.9. Based on the X-ray image classification result, we visualize prediction results as heat-maps and also analyze them in comparison with annotated symptoms of radiologists.Keywords
Nowadays, tuberculosis is still one of the leading public health problems in the world. Significantly, in the COVID-19 pandemic, tuberculosis progress has been majorly impacted. On the one hand, the positive effect is a considerable global drop in new patients. On the other hand, the negative impact is a significant rise in tuberculosis deaths because of the difficulty in approaching tuberculosis diagnosis and treatment services. According to the WHO tuberculosis report 2021 [1], the HIV-negative community has had 1.3 million tuberculosis deaths vs 1.2 million in 2019. Among HIV-positive people, there are also an additional 214,000 deaths comparing 209,000 in 2019. These figures pointed out the requirement to stop and reverse, especially the improvement in tuberculosis diagnosis methods.
In Vietnam, the government has created the Vietnam National Tuberculosis Control Program as a strong action to prevent and remove tuberculosis. In 2020, the United States Agency for International Development (USAID) and the Vietnam National TB Program (NTP) expanded the Ministry of Health/NTP’s “Double X” Strategy for TB case identification, intending to end TB in Vietnam by 2030.
In this paper, we presented a study on tuberculosis diagnosis and visualization. Firstly, we proposed a convolutional neural network architecture for the X-ray image classification task. With the best strategy from [2], this model was trained in several cases to prove the performance. Secondly, the predicted results of the trained model were visualized as heat-map type. We also evaluated theheat-map in the context of the locations of the lung lesions relating to tuberculosis. To support the experiment, we collected data from the Vietnam National Lung Hospital by using the VRPACS system [3], and all data would be annotated with specific tuberculosis lesions by the radiologists. Our paper has main contributions:
- We prepare a ready-to-use Vietnamese X-ray image dataset annotated with 13 symptoms of tuberculosis.
- We design and evaluate the convolutional neural network model to diagnose tuberculosis.
- We visualize the predicted results and analyze them in comparison with the locations of tuberculosis symptoms.
The rest of the paper is introduced as follows: Section 2 presents the proposed study with the detail for data collection and annotation, the deep learning model, and the visualization method. Section 3 provides the experiment’s result and evaluation of the proposed study. Lastly, Section 4 concludes this study.
There are some data types that can be used for diagnosing tuberculosis, and there were also many studies on tuberculosis diagnosis based on them. In 2010, Dongardive et al. [4] had some attempts to use examination parameters to diagnose pulmonary tuberculosis by applying an identification tree. Their research data have 45 parameters including 9 from preliminary examinations, 6 from sputum examinations, 8 from blood examinations, 11 from urine examinations and 11 from bio-chemistry from Group of T.B Hospital, Mumbai. In 2011, Elveren et al. [5] proposed a model combining multilayer neural networks and a genetic algorithm for tuberculosis diagnosis on data from preliminary examination and laboratory tests described in the patients’ epicrisis reports from Diyarbakir Chest Disease Hospital. Another study on patient discharge reports belonged to Yahiaoui et al. [6] in 2017. They researched 38 properties in the reports from the chest diseases department of a hospital in the south of Turkey. The authors applied support vector machines and achieved 96.68% classification accuracy. Another data type is the microscopic image. In 2012, Chang et al. [7] presented an algorithm that included three stages for automated tuberculosis detection using fluorescence microscopic images from digital microscopes. Their result using IKSVM reached average precision of 89.2% ± 2.1%.
The chest X-ray image is the data type that received a lot of attention from deep learning researchers. In 2017, Lopes et al. [8] published an article about using pre-trained CNNs as extractors for tuberculosis detection with multiple instance learning and ensemble learning. In the case of the simple CNN feature, the authors achieved 0.782 accuracy on the Montgomery dataset and 0.834 accuracy on the Shenzhen dataset. The same year, Hooda et al. [9] had a study about normal and abnormal classification on chest X-ray images from Montgomery and Shenzhen datasets. Over the experiment, the authors get 94.73% training accuracy and 82.09% validation accuracy. In 2018, Yadav et al. [10] applied the Coarse-to-Fine knowledge transfer approach. They tried techniques such as noise and blur masks, zooming, rotating, and flipping on datasets including Montgomery, Shenzhen, and NIH [11]. Yadav et al. achieved 94.89% accuracy on an augmented version of the validation set. Evalgelista et al. [12] also published deep-learning research relating to tuberculosis in 2018. The authors tried nine different models with Montgomery County X-ray Set, Shenzhen Hospital X-ray Set, and JSRT Database [13]. In the experiment results, a single convolutional layer using 32 kernels reached 88.76% accuracy. In 2019, Hernandez et al. [14] proposed an ensemble algorithm for tuberculosis classification on a set of 800 chest X-ray images. By applying voting by the majority and the sum of probabilities, the authors achieved no false positives and 85% overall accuracy.
Also in 2019, Meraj et al. [15] applied transfer learning on VGG16, VGG19, GoogLenet, and RestNet50 for tuberculosis diagnosis. With data from the Montgomery dataset, Shenzhen dataset, and Indiana University, they received results of 71.42 AUC on two models ResNet50 and GoogLenet, and 77.14 on two models VGG-16 and VGG-19. Also using the transfer learning approach, Ahsan et al. [16] constructed a generalized model with a conventional decision tree. The authors received 80% accuracy without augmentation and 81.25% with augmentation for their experiments on Montgomery and Shenzhen datasets. Another tuberculosis diagnosis study in 2019 is from Pasa et al. [17] with a proposed simple CNN and applying grad-CAM. The authors implemented a 5-fold cross-validation method on NIH, Montgomery, Shenzhen, and Belarus Tuberculosis Portal datasets. Because of simple architecture, their network has only about 230,000 parameters and can be deployed on some low-cost computers. In 2020, Rahman et al. [18] tried to test nine different deep CNNs to detect tuberculosis from chest X-ray images by applying the transfer learning approach from their pre-trained initial data. In detail, these CNNs are ChexNet, InceptionV3, ResNet18, ResNet50, ResNet101, VGG19, DenseNet201, SqueezeNet, and MobileNet. Besides Montgomery, Shenzhen, and Belarus datasets, the authors also used the NIAID dataset [19] and the RSNA pneumonia dataset [20]. In 2021, Duong et al. exploited EfficientNet and Vision Transformer to build a tuberculosis detection system. This study used Montgomery, Shenzhen, Belarus, RSNA pneumonia, and some COVID-19 datasets [21,22]. Their work reached a maximum accuracy of 97.72%.
Table 1 presents a view of datasets, data types, and AI methods. In recent years, with the explosion of deep learning development on image data, there have been many tuberculosis diagnosis studies on chest X-ray images. The summarization is described below in Table 2.


There have been some limits to the analysis of tuberculosis in chest X-ray images. To begin with, the publicly available datasets have no specific annotations for pulmonary tuberculosis from the radiologist’s perspective. In [23], the authors presented and discussed tuberculosis’s clinical and radiologic features. Pulmonary tuberculosis manifests as parenchymal disease, lymphadenopathy, miliary disease, pleural effusion, cavitation, pneumothorax, and pleural extension at radiology. Some popular datasets such as Montgomery and Shenzhen only support information about the infected or normal states. And then, from the perspective of radiologists, they lack evidence about different lesion regions, which is essential information for medical experts. The reports of radiologists often provide information about abnormalities on which to base the conclusion of the patient’s condition. In addition, in the Vietnamese context, there have been a few deep-learning studies on Vietnamese chest X-ray images or tuberculosis diagnoses on Vietnamese data. There has also been no specific Vietnamese tuberculosis X-ray dataset. Some studies can be mentioned as the research of Amano et al. [24] for classifying tuberculosis bacteria on data collected by Hanoi Medical University or the research of Pham et al. [25] for abnormalities localization on the VinDr-CXR dataset [26]. Amano et al. experimented on the bacterial dataset which includes sRGB images with a resolution of 3000 × 3000. In the bacterial images, the Petri dishes with several bacterial colonies were captured from a Sony ILCE-6000. For the study of Pham et al., they conducted their work on Vietnamese chest X-ray images but their interest was the identification of chest abnormalities. At the beginning of 2023, Toan et al. [2] published a study about tuberculosis diagnosis from Vietnamese tuberculosis X-ray images. In this work, the authors analyzed four strategies of training configuration and evaluated the Vietnamese imaging dataset to clarify their hypothesis and aim to create the base to create the tuberculosis diagnosis systems. The experiment results pointed out the suitability of transfer learning in the case of Vietnamese chest X-ray images and the importance of collecting more and more data. The study used a dataset from a Vietnamese local hospital in Hanoi and KaggleTB, which is a dataset published on the Kaggle platform by Rahman et al. [18].
The data collection task was conducted in the Vietnam National Lung Hospital. The X-ray imaging room is a special room, installed to prevent X-rays from affecting others. A patient would move to a position following the technician’s instructions. After imaging, images will be recorded on a computer. The standard workflow would have some requirements in standing posture and breath holding. All machines and devices are connected to the PACS system. All X-ray images would be captured and stored in the PACS database. When radiologists practice annotation tasks, they would choose X-ray images in the list queried from the database.
All tuberculosis annotation specification was analyzed and designed following the doctor’s comments as described in Table 3. Firstly, the radiologists listed all symptoms of tuberculosis on the chest X-ray image based on the knowledge they use when they examine patients. These symptoms would be the annotation types in the annotation software. Secondly, the software interface would be designed so radiologists can conveniently annotate. The doctors would open the chest X-ray image, use a mouse to choose regions of symptoms and select the annotation type.

There are some difficulties when designing the annotation specification also the annotation software. Software engineers and radiologists have a difference in their knowledge. On the one hand, software engineers need to learn the causes and progression of tuberculosis. On the other hand, several radiologists are not proficient in using computer software and are even quite old. It is rather difficult for them to use a mouse and keyboard to select exactly the boundary of symptoms on the chest X-ray images. Sometimes, they have to sit together and a software engineer manipulates the annotation software under instructions from a radiologist.
According to radiologist instructions, the main task is to annotate all the boundaries of symptoms in each chest X-ray image. In the dataset, if an image contains at least one of the symptoms, it belongs to a tuberculosis patient. This is the indication to build and evaluate the tuberculosis diagnosis model.
All chest X-ray images would be preprocessed before being pushed into the model and the augmentation techniques would be also applied to images before they are used in the training phase. About the data preprocessing, we applied resizing and pixel value normalization. The network model only accepts images in a uniform size, so we resize images to the same size, which is 512 × 512 in the experiment implementation. Pixel values are normalized by using the mean and the standard deviation. Besides, we also use augmentation techniques to increase the diversity of images when training. Details, we applied rotation, cropping, and light transform. So, training images would be rotated, cropped, and linear adjusted in pixel values with randomized parameters.
3.2 Convolutional Neural Network
Our study aims to research the deep-learning model in the tuberculosis diagnosis problem. Tuberculosis is a complex disease with different stages and manifestations. Still, in the diagnosis result, one of the most important pieces of information is whether the patient is infected with tuberculosis or not. So, we design the study to make that decision and we also support the spatial information of the interested locations relating to tuberculosis. In detail, this task is a binary classification problem. The input is a chest X-ray image and the output is a label pointing out whether the patient’s state is tuberculosis or not. Besides, our study also indicates the locations of the lung lesions relating to tuberculosis. These regions are the basis to refer to the radiologist’s task.
Our architecture is presented in Fig. 1. A chest X-ray image would be pushed to the pre-trained architecture part. This part is the position for placing the pre-trained model. In our system, we choose the candidate pre-trained models which were trained with the ImageNet dataset and can be downloaded from the PyTorch library [27]. The choice used in the experiment implementation of the pre-trained architecture part shown in Fig. 1 is ResNet50. ResNet [28] is the network designed to deal vanishing gradient problem, which is an important problem when networks have a large number of layers. In Fig. 2, the main idea of ResNet is “shortcut connections” which is implemented in Residual Block. This is the famous architecture whose performance has been proven on chest X-ray data in several papers [10,14,15,18]. ResNet50 also achieved the best evaluation metrics in [2] in the experiment of tuberculosis diagnosis from chest X-ray images. Importantly, the experiment in that study also used a small Vietnam chest X-ray image dataset.
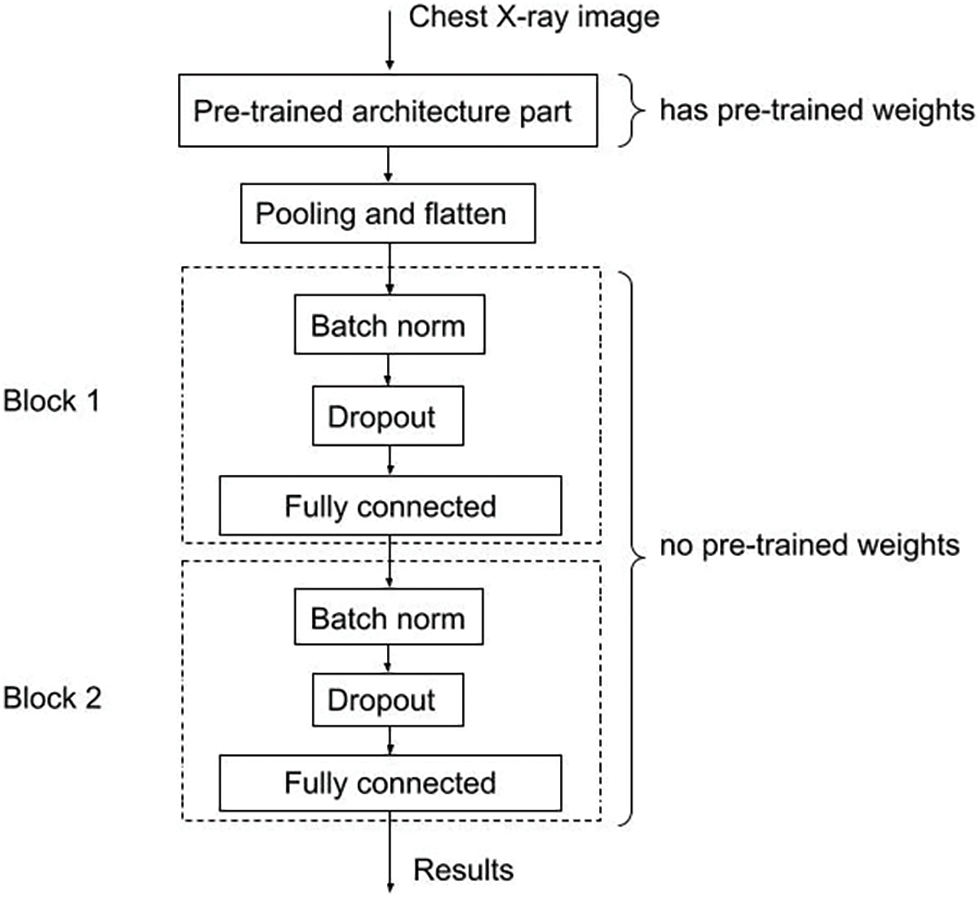
Figure 1: Our convolutional neural network architecture
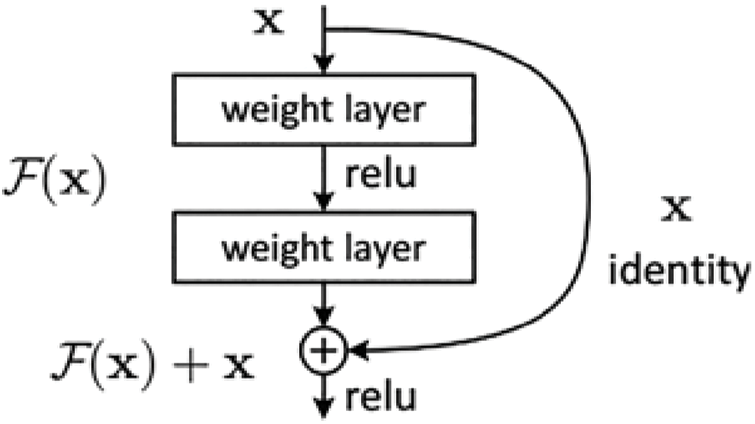
Figure 2: Residual block
When data passes the pre-trained architecture part, it would enter Pooling and flatten steps. After that, every single data record would be transformed from 2D format to 1D format. From here, the architecture has only two main blocks. Each block has three processing steps including Batch norm, Dropout andfully connected. The second block plays the role of the output module, so the size of output from there is 2. The value size corresponds with our problem-binary classification problem for diagnosing tuberculosis. The first block has a 512 output size and is an inference step. In each block, the Batch norm layer helps to normalize input data, and the Dropout layer helps to prevent the network from over-fitting. After that, data is pushed to the fully connected layer. In the implementation, the network is programmed to accept images in the size of 512 × 512. We set up the batch size of image data as 4 in the training phase.
We applied the Grad-CAM technique [29] to our trained model to indicate the locations of the lung lesions relating to tuberculosis. In CNN architecture, convolutional layers explore and retain spatial features calculated from an input image. These spatial features do not exist when data is flattened to push into fully connected layers because a single data is in 1D format at these places. Moreover, among convolution layers, the first layers analyze basic features, and the last layers analyze semantic features. In other words, the last layers generate high-level visual features which reflect class-specific information about an object in the input image.
Fig. 3 describes Grad-CAM overview from the study [29]. From the input as an image and a specified class, the algorithm will compute the heat-map which shows where the model has to look to make the decision. In our context, we used the Grad-CAM technique to explore the visual features of tuberculosis at the last convolution layer of our CNN model. This task brought us the heat-map result of tuberculosis. These results are the evidence to compare to the doctor’s annotation about tuberculosis regions in chest X-ray images.
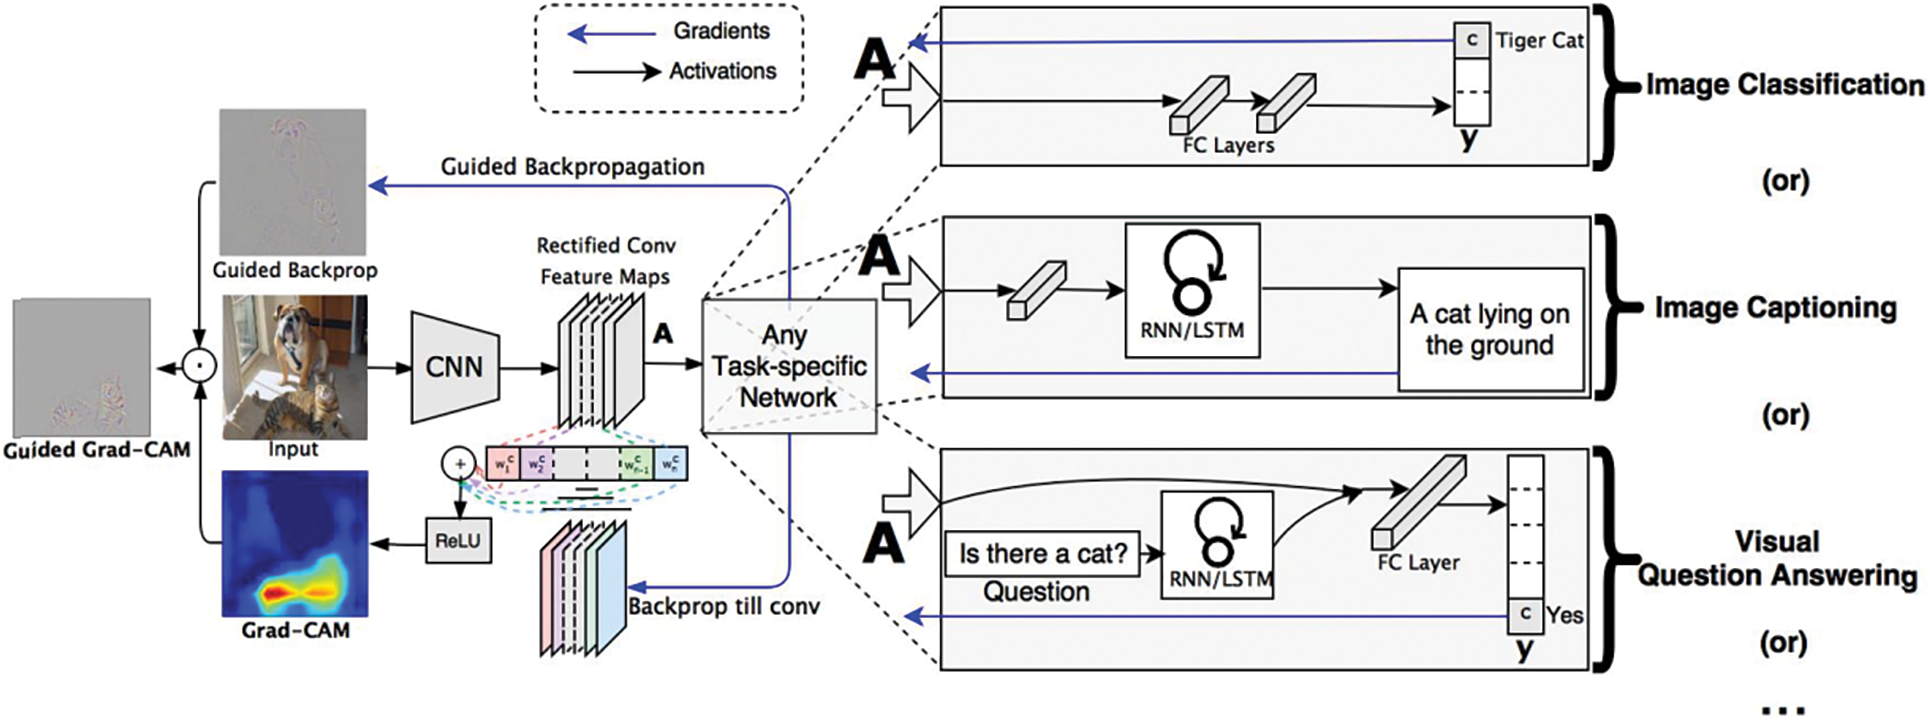
Figure 3: Grad-CAM overview [29]
To support the radiologist’s annotation task, we built the annotation software. This software connects to the VRPACS server at the Vietnam National Lung Hospital. The radiologists choose chest X-ray images from this dataset to annotate. In the beginning, each image has a “NO READ” state. After the radiologists annotate, the state changes to “COMPLETED”. In the software interfaceas described in Fig. 4, there are controllers to indicate specific information about tuberculosis. The radiologists would use a computer mouse to choose the specific lesion type and draw the boundaries of that region.
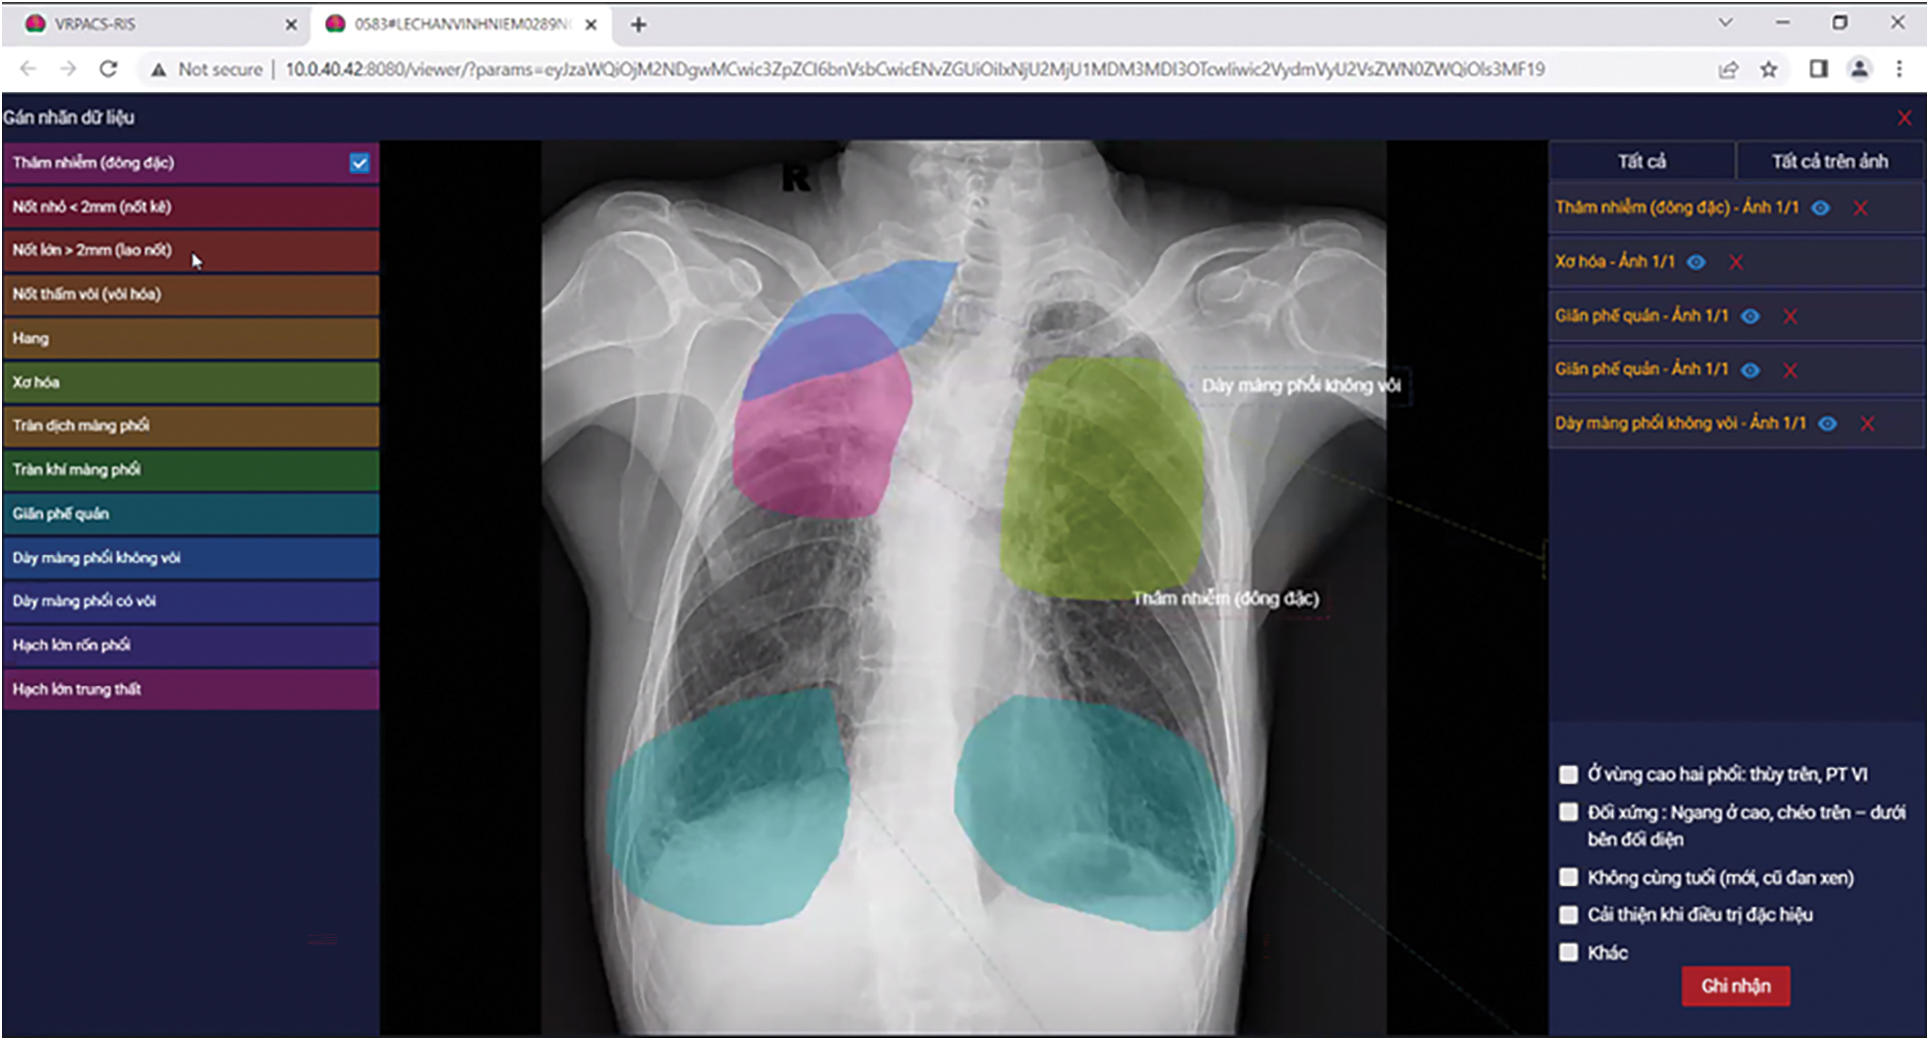
Figure 4: Our annotator software interface
After collecting and annotating, we had a total of 29,456 tuberculosis chest X-ray image samples. Each sample was annotated with at least one symptom type and details are described in Table 4.

Besides data collected from NLH, we also used another chest X-ray image dataset for our experiment. It is VinDr-CXR [26]. VinDr-CXR consists of chest X-ray studies provided by two Vietnamese hospitals, Hanoi Medical University Hospital and Hospital 108. The authors annotated thoracic abnormalities from chest radiographs, so VinDr-CXR is not a specific dataset for tuberculosis. In our study, we collect “No finding” samples in VinDr-CXR to get Vietnamese chest X-ray images of people who have no tuberculosis.
To estimate the quality of the model, we need measures. In our experiment, we used measures of AUC, sensitivity, specificity, and accuracy. AUC is the area under the Receiver Operating Characteristic curve and is used for measuring the performance of a binary classifier.
From the medical perspective, doctors are interested in using sensitivity and specificity scores. Sensitivity points out the ratio between the number of correctly classified patients and the number of people who are sick. Specificity aims at the rate of the number of people who are diagnosed as healthy and the number of really healthy people. These scores are computed by comparing the predicted results with the annotated information. Because of our binary classification problem, the comparison result is the confusion matrix 2 × 2 which consists of True Positive (TP), True Negative (TN), False Positive (FP), and False Negative (FN). Sensitivity and specificity scores are computed as that:
From the confusion matrix, the next score which can be calculated is accuracy.
For other measures, Precision is defined as the ratio of the True Positive value to the number of samples that are classified as positive, which means the sum of the True Positive value and the False Positive value. Recall is defined as the ratio of the True Positive value to the number of samples that are actually positive, which means the sum of the True Positive value and the False Negative value. So, the Recall value is equal to the Sensitivity value. Mathematically, Precision and Recall are two fractions with equal numerators but different denominators. F1-score is the harmonic mean of the Precision value and the Recall value when we assume that these two quantities are non-zero. These measures are computed as that:
Our experiments were practiced on a server with NVIDIA GeForce RTX 3080, 1TB Hard Disk, and 64 GB RAM. The operating system is Ubuntu 20.04 and the deep learning code was written with the support of PyTorch Library. In the experiment environment, the network is configured to accept images with 512 × 512 size and the training phase uses batch size as 4. These parameters are related to the limitation of hardware resources and the network architecture. They also affect the amount of calculation each time and the memory needs to be allocated.
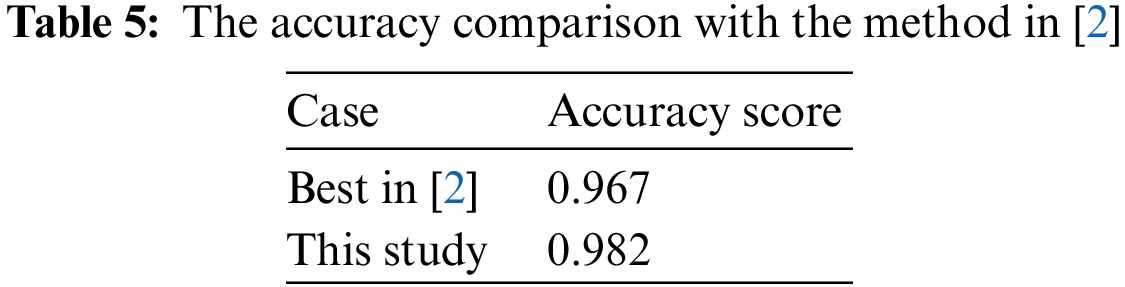
The first experiment evaluates our custom CNN model in the case of Strategy 4–the best strategy in [2] with applying transfer learning from ImageNet and training on VRTBCombineTrain Dataset. Therefore, we also conducted the training task on the VRTBCombineTrain dataset and then tested the trained model on the VRTBTest dataset. As above, the choice used in the experiment implementation of the pre-trained architecture part shown in Fig. 1 is ResNet50, an instance of ResNet [28], because ResNet50 achieved the best evaluation metrics in [2] in the experiment of tuberculosis diagnosis from chest X-ray images.The accuracy comparison is presented in Table 5.
For more details on all measures used in [2] as AUC, sensitivity, specificity, and accuracy, the bar chart comparing the scores is plotted in Fig. 5.
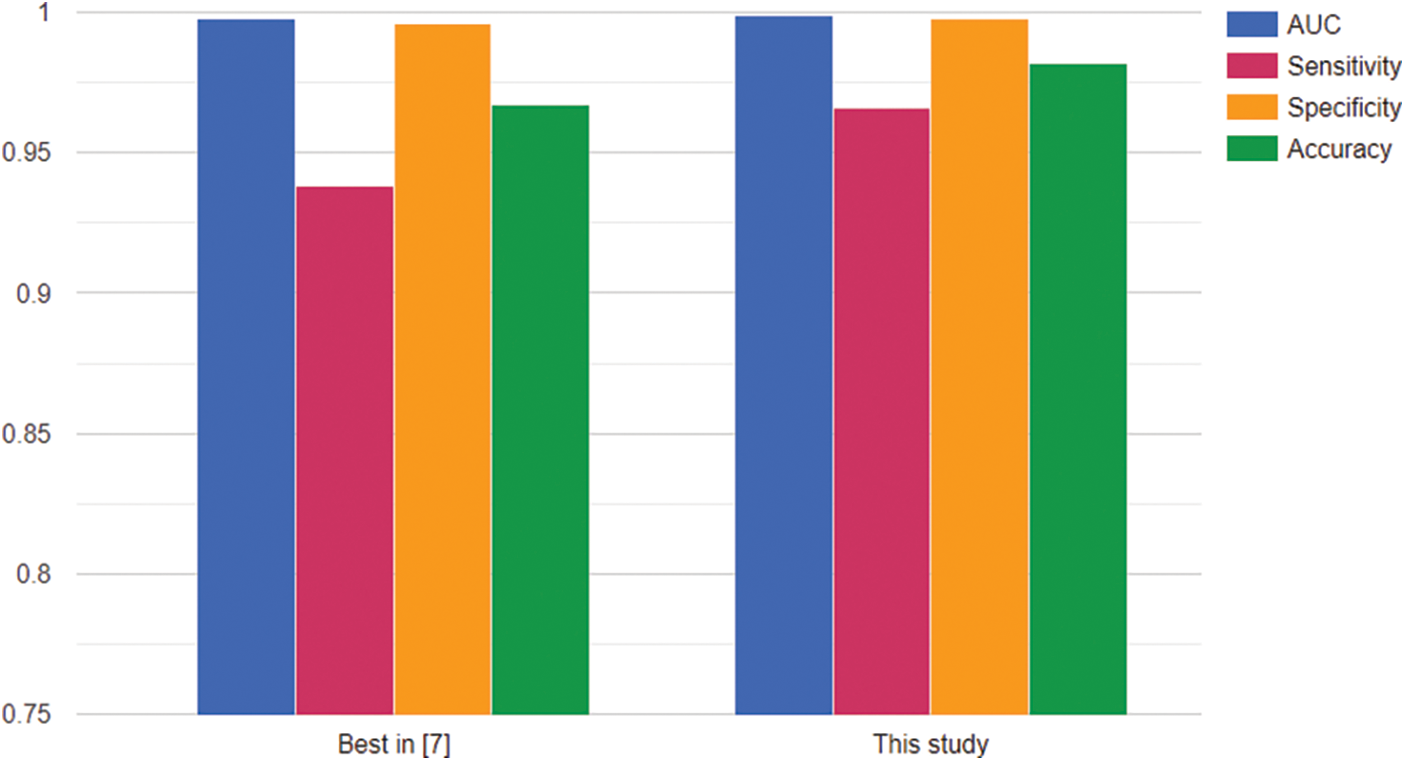
Figure 5: Comparison with the method in [2]
From Fig. 5, the figures in this study were slightly higher than the scores of ResNet50 in the case of Strategy 4 in [2]. It might not be the evidence to prove that our architecture is better in all cases but it presented its performance with all scores higher than 0.96. In this situation, the experiment was conducted with both international chest X-ray images and Vietnamese chest X-ray images. So it can be also potential for the generalizability of the proposed model to other populations or regions. In detail, the result reached an AUC score of 0.998784, a sensitivity score of 0.966, a specificity score of 0.998, and the accuracy score of 0.982. Therefore, this model was a good choice in our problem’s context.
The next task was conducting an experiment on our full dataset. All Vietnamese data is split into two parts supporting the training phase and the testing phase as described in Table 6. The split rate is 80:20. The data part used in the training phase is VrTbCXRTrainSet with 8485 normal samples and 23,646 tuberculosis samples. The data part used in the testing phase is VrTbCXRTestSet with 2021 normal samples and 5810 tuberculosis samples. This dataset is rather larger than the dataset used in the previous task. So all scores on the full dataset also would point out the importance of the data-collecting task. Gathering more and more data is a vital task in deep learning applications.

When we trained the model, the VrTbCXRTrainSet is randomly split 80:20 to get training data and validation data. In the training process, the optimization algorithm would try to minimize the value of the loss function on training data. However, the final aim is the quality of classifying X-ray images to diagnose tuberculosis. Therefore, we tracked the accuracy of validation data to save the best results during the training process. Whenever a better validation accuracy is updated, the state of the model’s weights will become a new checkpoint.
In Fig. 6, we also evaluated the model with other measures, such as sensitivity, and specificity. All measures are going to converge at high values at the end of the training period. By analyzing multiple types of measures, we want to get more views on the data generalization ability of the trained network. For more detail, we would see in Tables 7 and 8. Table 7 describes the values of accuracy, sensitivity or recall, specificity, precision, and F1-score evaluated on the training set at each checkpoint during the training process.
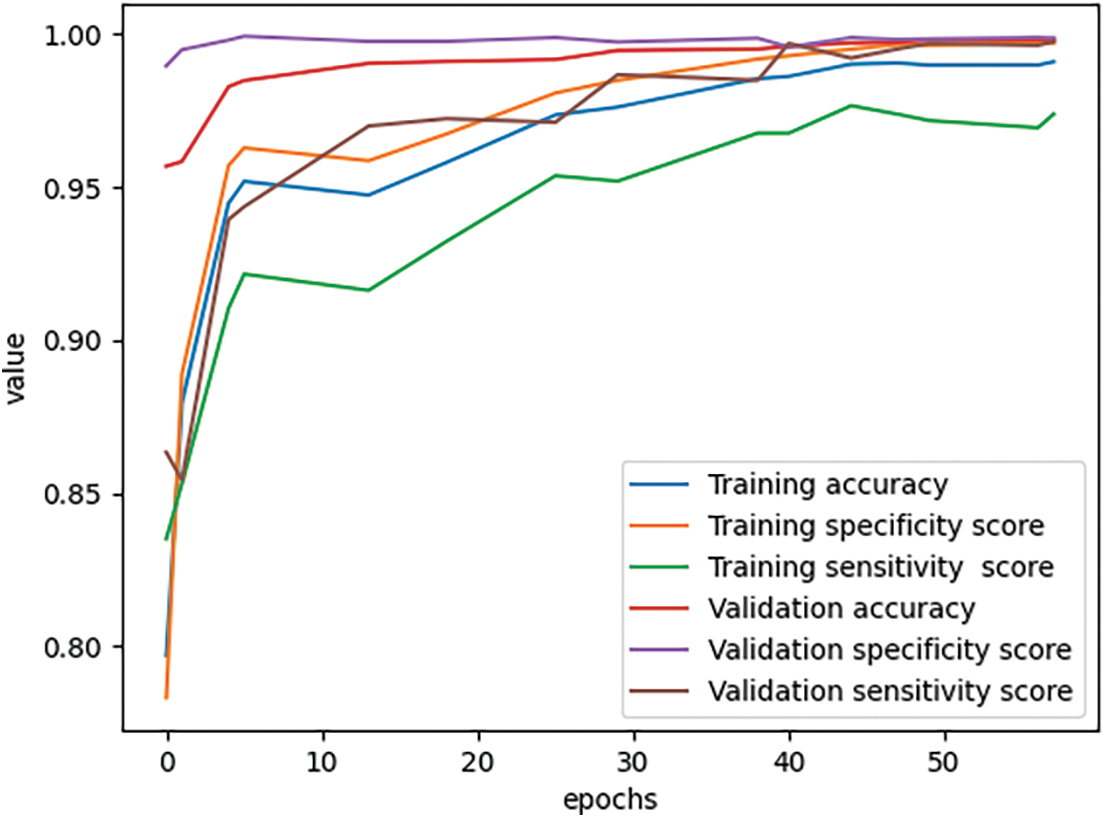
Figure 6: Scores during the training process


Table 8 describes the values of accuracy, sensitivity or recall, specificity, precision, and F1-score evaluated on the validation set at each checkpoint during the training process.
As we see in Tables 7 and 8, the training accuracy reached 0.991013 and the validation accuracy reached 0.998444 at the final state. The results all reached a sensitivity of more than 0.97, specificity of more than 0.99, and accuracy of more than 0.99 on both training data and validation data.
With the experiment on the VrTbCXRTestSet, we had the confusion matrix:
From the confusion matrix in Fig. 7, we could see our model correctly classified 2120 among 2121 normal X-ray images. It means the specificity score on VrTbCXRTestSet is 0.999529. In the case of 5810 tuberculosis samples, there are 5775 X-ray images that were correctly recognized. From that, the sensitivity score is 0.993976. So we achieved both a specificity score and a sensitivity score over 0.9 in the testing phase.
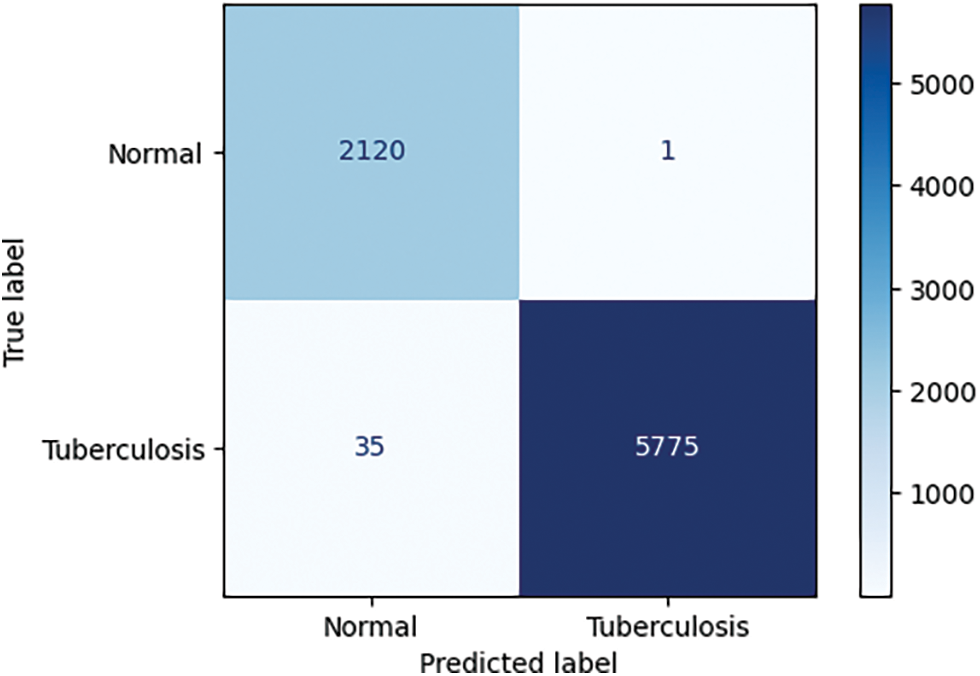
Figure 7: The confusion matrix of the testing phase
Another evaluation is the heat-map. We applied GradCAM on the trained model to generate heat-maps which would be material to discuss the locations of interest in the whole chest X-ray images. We display them beside the rendering results of annotations.
Fig. 8 describes the visualization of annotation data and heat-map. In each row, from left to right, a sample was present as a pair of annotation rendering and heat-map. In each annotation picture, the green region is Infiltration, the blue region is large nodules, the yellow region is Calcified pleural thickening, the red region is Pleural effusion, the cyan region is Non-calcified pleural thickening, and the pink region is Fibrosis.
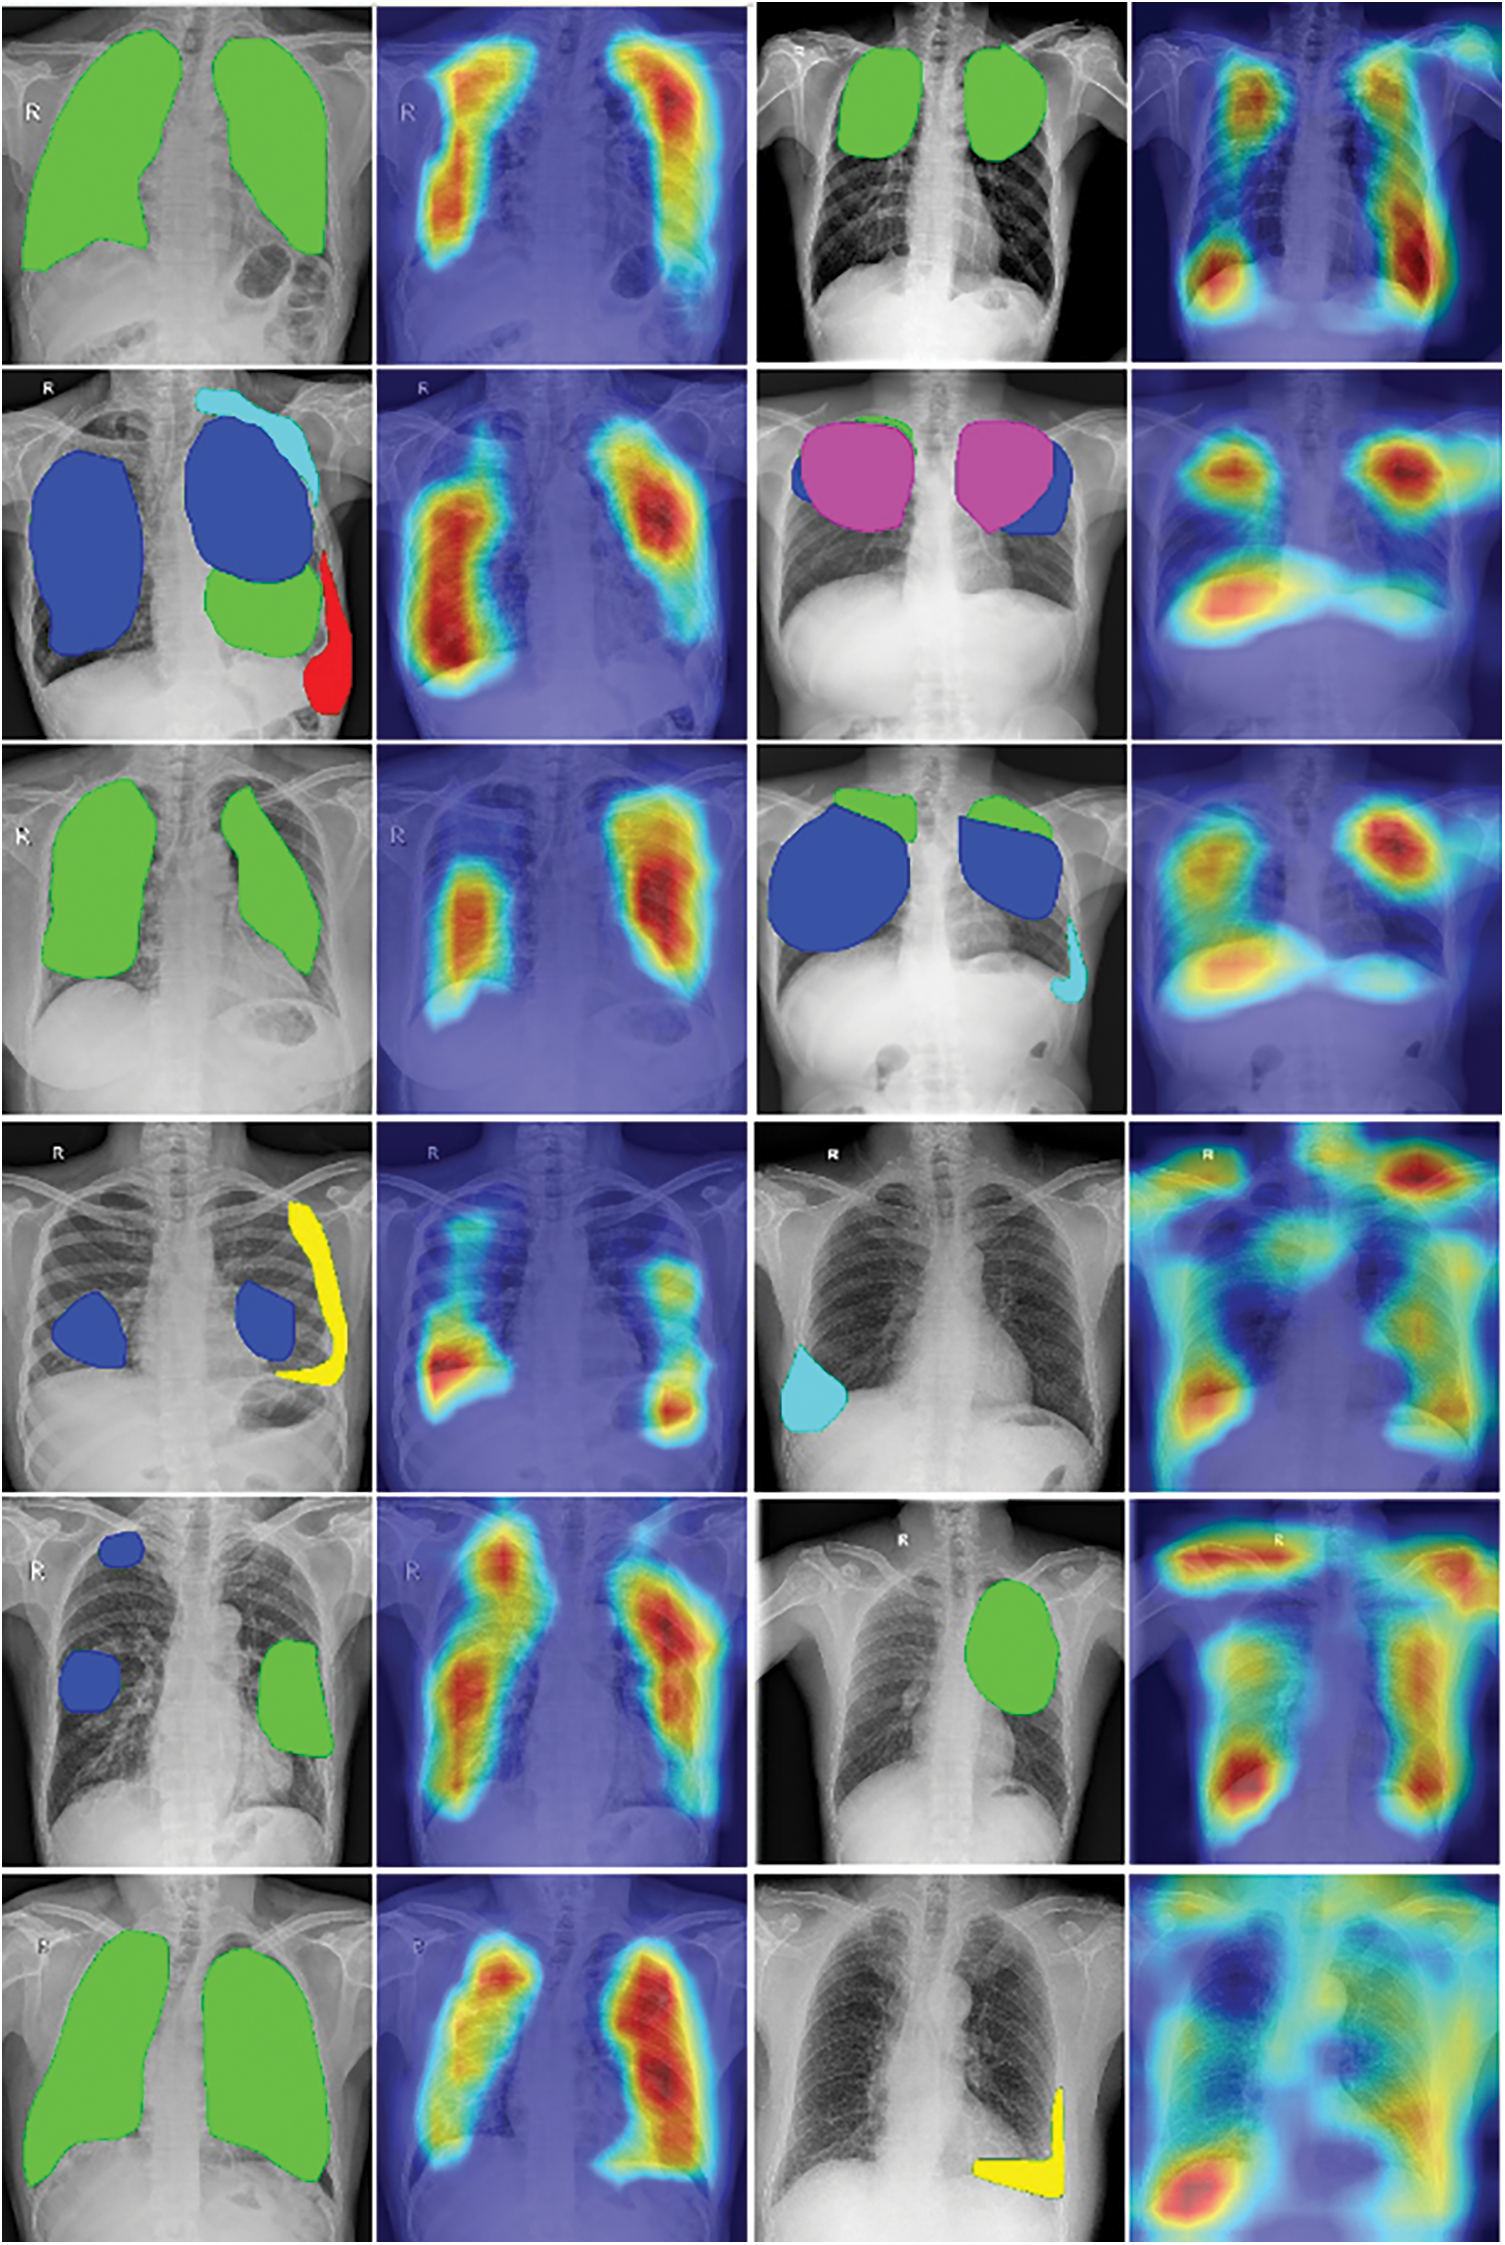
Figure 8: The visualization of annotation data and heat-map
From each pair in Fig. 8, we can compare the heat-map vs the display of annotated data. As we can see in the first and second columns in this figure, the heat-maps generated by the Grad-CAM algorithm pointed out lesion regions rather correctly in chest X-ray images. This might be some good visual evidence for the radiologist’s viewpoint. But in the third and fourth columns, the focused regions are more complex. Some heat-maps present not only the locations of annotated data but also the other regions in the lung of patients, the other heat-maps give diffused information around the chest X-ray images.
Based on the professional opinion of radiologists, tuberculosis has various visual influences on the chest X-ray image, which come from different causes. The diagnosis result might also depend on the relationship between locations of influences, for example, symmetry, inside. Moreover, different regions also can overlap and the distribution of lesions is unbalanced. Another is the difference if we compare with visual information in normal images, such as the cars, and dogs in photos. In short, the complex visualization of heat-maps could come from many reasons. So in our opinion, the heat-maps, which presented the focused locations of trained models, have achieved some initial success in indicating the visual tuberculosis features in chest X-rays but there were not enough and it has still needed more studies to be able to explain suitably with the radiologist knowledge.
The last evaluation is running time. We statistics the training time and run time with 1 sample as described in Table 9.

We tested on the CPU machine which has Intel(R) Core(TM) i7-4790 CPU processor at 3.6 GHz and 8 GB RAM. The average running time of 0.529403 s is acceptable. This is the basis for us to widely test the model in real life. The GPU machine is not always ready when deploying in hospitals. In reality, the hardware’s ability in different hospitals may be very different, such as computers, network configuration, etc. To provide the scalability for real-world deployment, especially in resource-constrained healthcare settings, we also prepare to deploy in some scenarios, such as building a central AI processing server or packing the system in a portable machine that easily be installed on a car. In addition, we also combined all components of this study in a demo for diagnosing tuberculosis from Vietnamese chest X-ray images as described in Fig. 9. This demo uses a DICOM as input. After that, it outputs the conclusion of tuberculosis infection and the heat-map to support visual information.
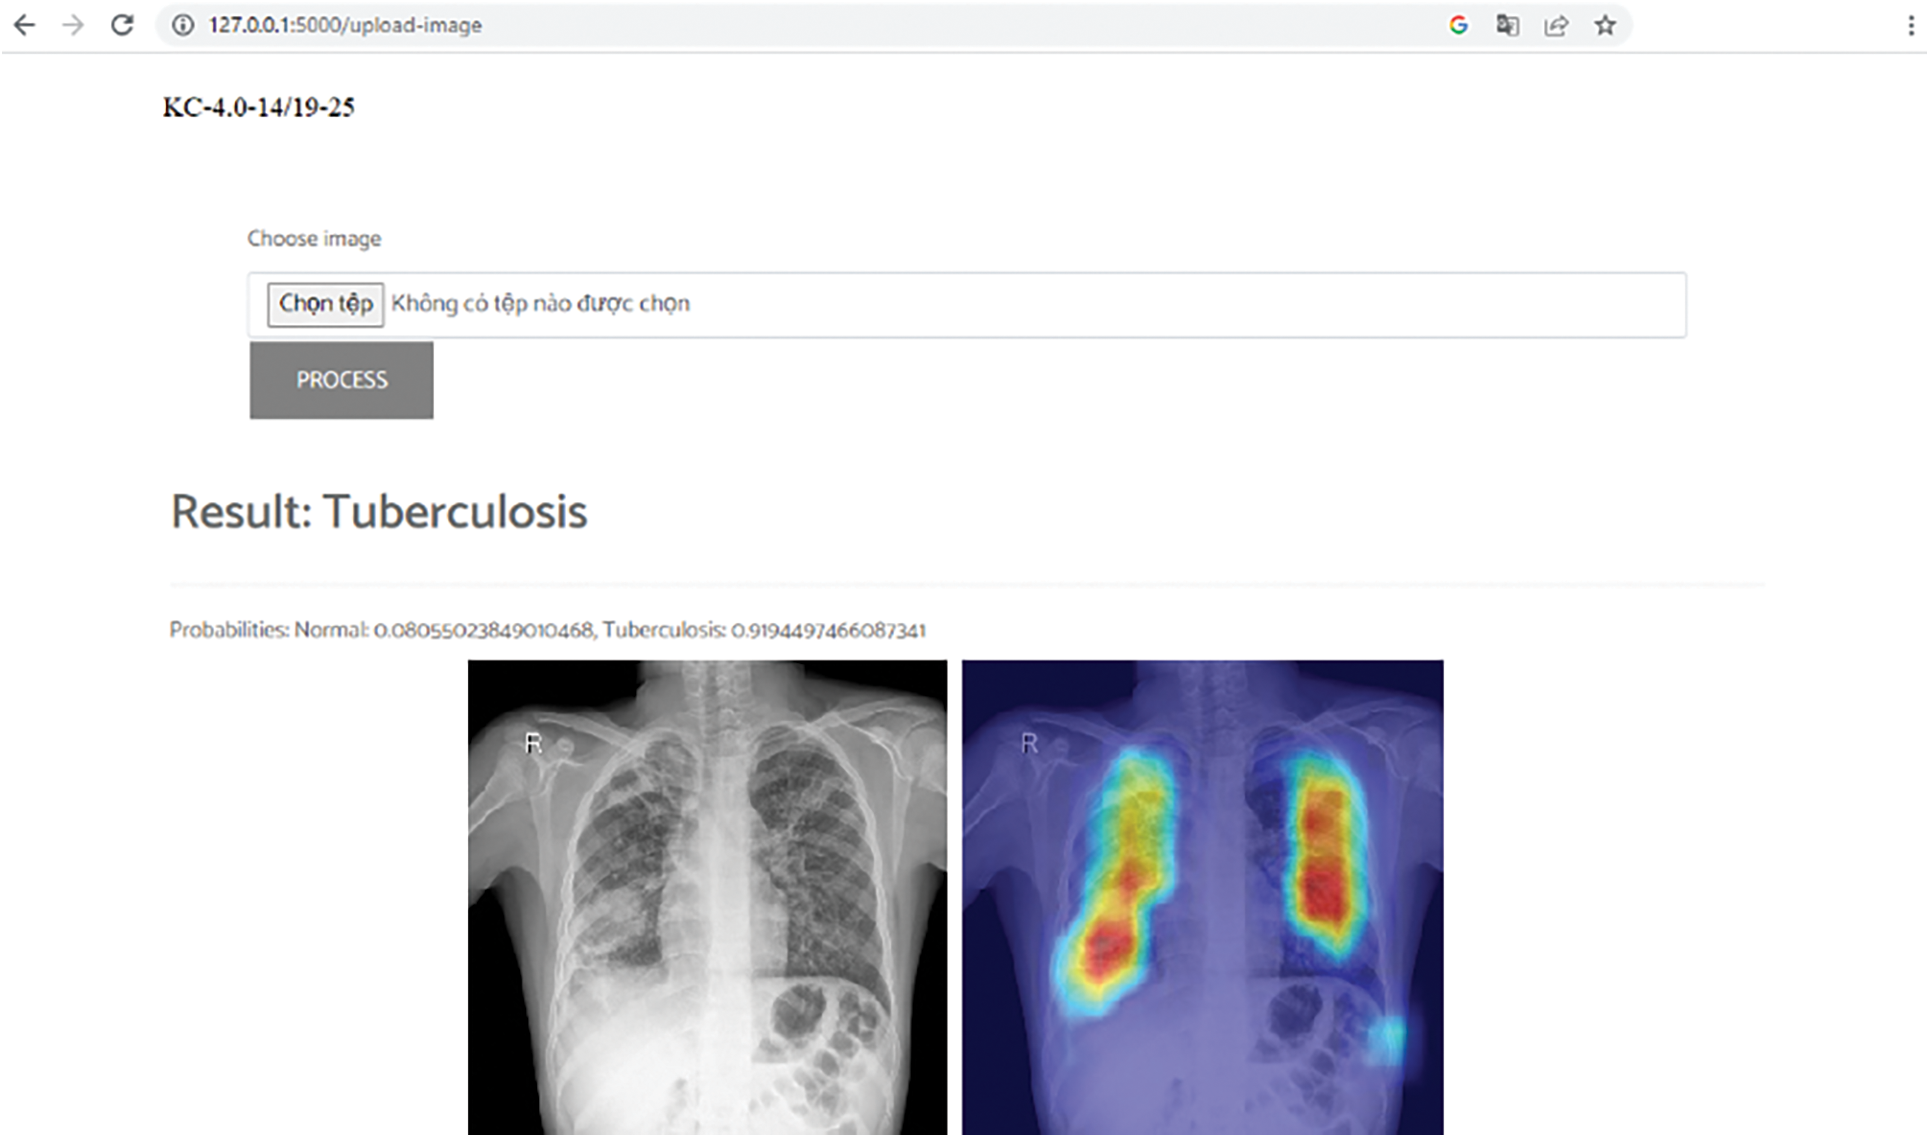
Figure 9: Vietnam tuberculosis diagnosis demo
This study presented a novel method for tuberculosis diagnosis and visualization from X-ray images in the Vietnamese context. Our work involved several steps of collecting and annotating data, designing the convolutional neural network, estimating the network throughout experiments, and analyzing the heat-map of predicted results. For the experiment, large X-ray images were collected and annotated with the support of radiologists from the Vietnam National Lung Hospital. The experiment results pointed out that the proposed method was efficient and robust in the context of this study.
In this paper, this study was conducted to output the result of tuberculosis diagnosis and the heat-map from a chest X-ray image. The heat-map only describes the interested locations in the chest X-ray image, so it cannot point out clearly the locations corresponding to each symptom. This may be the limitation of the heat-map method in this study, and we will continue to improve following this direction in the next research.
In the future, we will have many things to do for an out-of-box product and aim to fill the gap between the activities of the artificial intelligent model and the radiologist’s knowledge in the healthcare industry. On the one hand, we are preparing the scenario for building the central AI processing server at a big hospital which would collect and process X-ray images from small hospitals linked to it. This scenario is planned to be implemented by integrating this study as an artificial intelligence module into a PACS system. On the other hand, we are also preparing a scenario for deploying a compact system on cars with chest X-ray machines installed. Such cars will be easily deployed throughout regions in Vietnam to screen for tuberculosis.
Acknowledgement: Not applicable.
Funding Statement: This research is funded by the Project KC-4.0.14/19-25 “Research on Building a Support System for Diagnosis and Prediction Geo-Spatial Epidemiology of Pulmonary Tuberculosis by Chest X-Ray Images in Vietnam”.
Author Contributions: Study conception and design: Nguyen Trong Vinh, Do Nang Toan, Ha Manh Toan; analysis and interpretation of results: Nguyen Trong Vinh, Lam Thanh Hien; draft manuscript preparation: Do Nang Toan, Ha Manh Toan, Ngo Duc Vinh. All authors reviewed the results and approved the final version of the manuscript.
Availability of Data and Materials: Due to the nature of this research, participants of this study did not agree for their data to be shared publicly, so supporting data is not available.
Ethics Approval: This study was approved by Vietnam National Lung Hospital Research Ethics Committee (approval no. 48/20/CN-HDDD).
Conflicts of Interest: The authors declare that they have no conflicts of interest to report regarding the present study.
References
1. “Global tuberculosis report 2021,” Accessed: Jan. 23, 2024. [Online]. Available: https://apps.who.int/iris/handle/10665/346387 [Google Scholar]
2. H. M. Toan, L. T. Hien, N. D. Vinh, and D. N. Toan, “Detecting tuberculosis from vietnamese X-Ray imaging using transfer learning approach,” Comput. Mater. Contin., vol. 74, no. 3, pp. 5001–5016, 2023. doi: 10.32604/cmc.2023.033429. [Google Scholar] [CrossRef]
3. “VRPACS,” Accessed: Jan. 23, 2024. [Online]. Available: http://vnpacs.vn [Google Scholar]
4. J. Dongardive, A. Xavier, K. Jain, and S. Abraham, “Classification and rule-based approach to diagnose pulmonary tuberculosis,” in ACC 2011: Advances in Computing and Communications, Kochi, India, 2011, pp. 328–339. [Google Scholar]
5. E. Elveren and N. Yumuşak, “Tuberculosis disease diagnosis using artificial neural network trained with genetic algorithm,” J. Med. Syst., vol. 35, no. 3, pp. 329–332, 2011. doi: 10.1007/s10916-009-9369-3 [Google Scholar] [PubMed] [CrossRef]
6. Y. A. Yahiaoui, E. Orhan, and N. Yumusak, “A new method of automatic recognition for tuberculosis disease diagnosis using support vector machines,” Biomed. Res., vol. 28, no. 9, pp. 4208–4212, 2017. [Google Scholar]
7. J. Chang et al., “Automated tuberculosis diagnosis using fluorescence images from a mobile microscope,” in Med. Image Comput. Comput.-Assist. Int.-MICCAI 2012: 15th Int. Conf., Nice, France, 2012, pp. 345–352. [Google Scholar]
8. U. K. Lopes and J. F. Valiati, “Pre-trained convolutional neural networks as feature extractors for tuberculosis detection,” Comput. Biol. Med., vol. 89, pp. 135–143, 2017 [Google Scholar] [PubMed]
9. R. Hooda, S. Sofat, S. Kaur, S. Mittal, and F. Meriaudeau, “Deep-learning: A potential method for tuberculosis detection using chest radiography,” in 2017 IEEE Int. Conf. Signal Image Processing Appl. (ICSIPA), Kuching, Malaysia, 2017, pp. 497–502. [Google Scholar]
10. O. Yadav, K. Passi, and C. K. Jain, “Using deep learning to classify X-ray images of potential tuberculosis patients,” in 2018 IEEE Int. Conf. Bioinformatics and Biomedicine (BIBM), Madrid, Spain, 2018, pp. 2368–2375. [Google Scholar]
11. X. Wang, Y. Peng, L. Lu, Z. Lu, M. Bagheri and R. M. Summers, “ChestX-ray8: Hospital-scale chestX-ray database and benchmarks on weakly-supervised classification and localization of common thorax diseases,” in Proc. IEEE Conf. Comput. Vis. Pattern Recognit., Honolulu, HI, USA, 2017, pp. 2097–2106. [Google Scholar]
12. L. G. C. Evalgelista and E. B. Guedes, “Computer-aided tuberculosis detection from chest X-ray images with convolutional neural networks,” in Proc. 15th National Meeting Artif. Comput. Intell., São Paulo, Brazil, 2018, pp. 518–527. [Google Scholar]
13. J. Shiraishi et al., “Development of a digital image database for chest radiographs with and without a lung nodule: Receiver operating characteristic analysis of radiologists’ detection of pulmonary nodules,” J. Roentgenol., vol. 174, no. 1, pp. 71–74, 2000. doi: 10.2214/ajr.174.1.1740071 [Google Scholar] [PubMed] [CrossRef]
14. A. Hernández, Á. Panizo, and D. Camacho, “An ensemble algorithm based on deep learning for tuberculosis classification,” in Intell. Data Eng. Autom. Learn.–IDEAL 2019: 20th Int. Conf., Manchester, UK, 2019, pp. 145–154. [Google Scholar]
15. S. S. Meraj et al., “Detection of pulmonary tuberculosis manifestation in chest X-rays using different convolutional neural network (CNN) models,” Int. J. Eng. Adv. Technol. (IJEAT), vol. 9, no. 1, pp. 2270–2275, 2019. [Google Scholar]
16. M. Ahsan, R. Gomes, and A. Denton, “Application of a convolutional neural network using transfer learning for tuberculosis detection,” in 2019 IEEE Int. Conf. Electro Inform. Technol. (EIT), Brookings, SD, USA, 2019, pp. 427–433. [Google Scholar]
17. F. Pasa, V. Golkov, F. Pfeiffer, D. Cremers, and D. Pfeiffer, “Efficient deep network architectures for fast chest X-ray tuberculosis screening and visualization,” Sci. Rep., vol. 9, no. 1, pp. 6268, 2019. doi: 10.1038/s41598-019-42557-4 [Google Scholar] [PubMed] [CrossRef]
18. T. Rahman et al., “Reliable tuberculosis detection using chest X-ray with deep learning, segmentation and visualization,” IEEE Access, vol. 8, pp. 191586–191601, 2020. doi: 10.1109/ACCESS.2020.3031384. [Google Scholar] [CrossRef]
19. A. Rosenthal et al., “The TB portals: An open-access, web-based platform for global drug-resistant-tuberculosis data sharing and analysis,” J. Clin. Microbiol., vol. 55, no. 11, pp. 3267–3282, 2017. doi: 10.1128/JCM.01013-17 [Google Scholar] [PubMed] [CrossRef]
20. “RSNA Pneumonia Detection Challenge,” Accessed: Jan. 23, 2024. [Online]. Available: https://www.kaggle.com/c/rsna-pneumonia-detection-challenge [Google Scholar]
21. J. P. Cohen, P. Morrison, L. Dao, K. Roth, T. Q. Duong and M. Ghassemi, “COVID-19 image data collection: Prospective predictions are the future,” arXiv preprint arXiv:2006.11988, 2020. [Google Scholar]
22. M. E.Chowdhury et al., “Can AI help in screening viral and COVID-19 pneumonia?,” IEEE Access, vol. 8, pp. 132665–132676, 2020. doi: 10.1109/ACCESS.2020.3010287. [Google Scholar] [CrossRef]
23. J. Burrill, C. J. Williams, G. Bain, G. Conder, A. Hine and R. R. Misra, “Tuberculosis: A radiologic review,” Radiographics, vol. 27, no. 5, pp. 1255–1273, 2007. doi: 10.1148/rg.275065176 [Google Scholar] [PubMed] [CrossRef]
24. M. Amano et al., “Deep learning approach for classifying bacteria types using morphology of bacterial colony,” in 2022 44th Annu. Int. Conf. IEEE Eng. Med. & Bio. Society (EMBC), Glasgow, Scotland, UK, 2022, pp. 2165–2168. [Google Scholar]
25. V. T. N. Pham, Q. C. Nguyen, and Q. V. Nguyen, “Chest X-rays abnormalities localization and classification using an ensemble framework of deep convolutional neural networks,” Vietnam. J. Comput. Sci., vol. 10, no. 1, pp. 55–73, 2023. [Google Scholar]
26. H. Q. Nguyen et al., “VinDr-CXR: An open dataset of chest X-rays with radiologist’s annotations,” Sci. Data, vol. 9, no. 1, pp. 429, 2022 [Google Scholar] [PubMed]
27. “Pytorch library,” Accessed: Jan. 23, 2024. [Online]. Available: https://pytorch.org [Google Scholar]
28. K. He, X. Zhang, S. Ren, and J. Sun, “Deep residual learning for image recognition,” in Proc. IEEE Conf. Comput. Vis. Pattern Recognit., Las Vegas, NV, USA, 2016. [Google Scholar]
29. R. R. Selvaraju, M. Cogswell, A. Das, R. Vedantam, D. Parikh and D. Batra, “Grad-CAM: Visual explanations from deep networks via gradient-based localization,” in Proc. IEEE Int. Conf. Comput. Vis., Venice, Italy, 2017, pp. 618–626. [Google Scholar]
Cite This Article
 Copyright © 2024 The Author(s). Published by Tech Science Press.
This work is licensed under a Creative Commons Attribution 4.0 International License , which permits unrestricted use, distribution, and reproduction in any medium, provided the original work is properly cited.
 Downloads
 Citation Tools