
 Submit a Paper
 Propose a Special lssue
 Open Access
ARTICLE

Forecasting the Academic Performance by Leveraging Educational Data Mining
Department of Computer Science, Prince Sattam bin Abdulaziz University, Al Kharj, 11912, Saudi Arabia
* Corresponding Author: Mozamel M. Saeed. Email: Array
Intelligent Automation & Soft Computing 2024, 39(2), 213-231. https://doi.org/10.32604/iasc.2024.043020
Received 19 June 2023; Accepted 25 March 2024; Issue published 21 May 2024
 View Full Text
 Download PDF
Abstract
The study aims to recognize how efficiently Educational Data Mining (EDM) integrates into Artificial Intelligence (AI) to develop skills for predicting students’ performance. The study used a survey questionnaire and collected data from 300 undergraduate students of Al Neelain University. The first step’s initial population placements were created using Particle Swarm Optimization (PSO). Then, using adaptive feature space search, Educational Grey Wolf Optimization (EGWO) was employed to choose the optimal attribute combination. The second stage uses the SVM classifier to forecast classification accuracy. Different classifiers were utilized to evaluate the performance of students. According to the results, it was revealed that AI could forecast the final grades of students with an accuracy rate of 97% on the test dataset. Furthermore, the present study showed that successful students could be selected by the Decision Tree model with an efficiency rate of 87.50% and could be categorized as having equal information ratio gain after the semester. While the random forest provided an accuracy of 28%. These findings indicate the higher accuracy rate in the results when these models were implemented on the data set which provides significantly accurate results as compared to a linear regression model with accuracy (12%). The study concluded that the methodology used in this study can prove to be helpful for students and teachers in upgrading academic performance, reducing chances of failure, and taking appropriate steps at the right time to raise the standards of education. The study also motivates academics to assess and discover EDM at several other universities.Keywords
Abbreviations
| AI | Artificial Intelligence |
| ANN | Artificial Neural Networks |
| CNN | Convolutional Neural Networks |
| DL | Deep Learning |
| DT | Decision Tree |
| EDM | Educational Data Mining |
| GA | Genetic Algorithm |
| GBM | Gradient Boosting Machines |
| GPA | Grade Point Average |
| GWO | Grey Wolf Optimizer |
| GWP | Graph Width Parameters |
| LR | Linear Regression |
| M-RNNGWO | Multi Hidden Recurrent Neural Network |
| PSO | Particle Swarm Optimization |
| RF | Random Forest |
| RNN | Recurrent Neural Network |
| SVM | Support Vector Machine |
Educational data mining is an evolving interdisciplinary area of research connecting both the field of informatics and education. It offers many benefits to the educational institute such as predicting student performance. Moreover, several techniques of data mining have been utilized to enhance outcomes of learning by examining data of large scale that came from educational institutes. Educational Data Mining when integrated into technologies such as Deep Learning (DL) and Artificial Intelligence (AI) develops such skills that predict students’ academic performance with higher efficiency. The impact of algorithms helps the concept building of deep learning, which works with the neural network process and represents multiple dimensions for data representation. Artificial Neural Networks represent effective classification outcomes compared to other conventional classifiers based on prediction accuracy. Emphasis on student academic performance in educational institutions is of great interest to most researchers and parents, institutions, and governments worldwide. Educational institutions should monitor student learning outcomes and take appropriate improvement initiatives. An enormous amount of data is kept in many formats, including papers, records, files, sound, videos, photos, and other data formats, due to the introduction of information technology in various industries [1]. An appropriate method of extracting knowledge is required for collecting data from different applications designed for effective decision-making. Data mining helps in assembling the information from data repositories and also from the technique of databases [2]. The core data mining functions implement other methods and algorithms for finding and extracting trends of stored data. The rich applications of data mining and knowledge discovery significantly emphasize effective decision-making and thus become an essential element in different organizations [3].
Educational data mining techniques have the capability to extract patterns of behavior for the purpose of enhancing the academic performances of students with the help of prediction models. Prior prediction of the academic performance of students allows the detection of students who are at risk, which gives chances for early intervention to support these students and simultaneously motivates those students who are at risk to get more achievements with the help of suggestions and recommendations [4]. It employs techniques on academic information about students, including their names, academic histories, exam results, class participation, and how often they are questioned can be categorized in the data mining pool. To explore the educational data design, in terms of building a skillful environment in academics and its successful projection in the field of education, EDM has been inculcated professionally [5].
The current study offers a framework for comprehending several variables that affect students’ performance and projecting future performance based on student data and prior performance. This will help spot students who cannot meet institutional expectations and should be offered a special course to enhance their performance. Therefore, the study aims to recognize how Educational Data Mining (EDM) techniques such as Deep Learning and AI predict students’ performance. The most popular subfield of machine learning, called “Deep Learning” (DL), uses a sophisticated deep neural network algorithm that draws its inspiration from how the human brain functions. Without being taught specific data features to account for, deep learning models may generate reliable results from enormous amounts of input data.
This study aims to comprehend how various clustering algorithms may be applied to analyze educational data. The most common method used by academics from 2010 to 2020, strategic machine learning has evaluated student performance based on a chosen factor. It is essential in higher education, development is required for data-driven, decision-making, in the analytics of learning framework. Educational data mining in many organizations is one of the aspects which is very helpful in the collection of large and enormous data in many fields, like in the health department, and public organizations, for making the data hub corner [6].
The present study helps to understand the numerous factors and essentials that help to motivate the students’ performance. The academic record of student data for all semesters on a subject basis can be analyzed easily by this tool. The appropriate eligibility of the candidate in the institution can be identified and with time, more information about the student can be added to any level of academics. This research also aids in the earlier identification of students who are more likely to struggle academically. EDM provides new development in hidden corners of education sectors such as teaching, training, and technical-based educators. This research also highlights the earlier identification of students who are more likely to struggle academically by exposing the hidden patterns in educational data; EDM gives educators new knowledge. To ensure the quality of education, various areas of the educational system may be examined and improved using the research design used in this study.
The rest of the paper is organized as follows: Section 2 reviews the related literature. In Section 3, the methodology and the experimental setup, and datasets used in this paper are discussed. In Section 4, the results of the experiments are analyzed and discussed. A general discussion of the approach and found results are presented in Section 5. The implication and conclusion are discussed in Sections 6 and 7, respectively.
Learning analytics has been revolutionized by the versatile dimension of EDM. Learning analytics encompasses numerous areas of gathering student data to better comprehend the learning environment by evaluating, assessing, and displaying the greatest teacher-student performance [7]. The reporting data on student settings needs more improvement in specific areas of understanding, evaluating, and gathering information [8]. Research by Cruz-Jesus et al. [9] used 16 demographic factors, including Internet access, male-female ratio, availability, age factor, the number of skill learning programs, and computer handling management to predict their academic success. Random Forest, Support Vector Machine (SVM), Logistic Regression (LR), and K-Nearest Neighbor (KNN) techniques predicted the students’ performance which resulted in an accuracy that ranged from 50% to 80%.
Alternatively, in a study conducted by Sadiq et al. [10], four algorithms which were Random Forest, Support Vector Machine, Decision Tree C4.5, and Naïve Bayes were used to classify and predict students’ performance. The data for the study was mined through interviews with the academic staff of three universities in Duhok province, Kurdistan, Iraq. The data set comprised a record of 73 students. The researchers also interviewed 30 academic staff to acquire their thoughts on selecting the most achieved features on students’ performance. Furthermore, each record of the student had 9 characteristics and one class label. The results revealed that the improved Decision Tree C4.5 overtook the traditional C4.5 methodology. Moreover, the improved Decision Tree C4.5 succeeded better in comparison to C4.5 (J48) in the Weka technique.
In line with this, to create a model, Fernandes et al. [11] took into account the student population’s demographics and the grades received for participation in in-term activities. According to the study, the student performance classifier is based on a forecast of the Gradient Boosting Machine (GBM). According to the study, demographic factors, including age, school, and neighbourhood, might be used to predict success or failure. Additionally, Hoffait and Schyns [12] utilized the registration data they requested from students and contextual variables to predict students’ likelihood of failing. They discovered that applying data mining techniques allowed them to classify students who could have issues. Their strategy can assist in classifying kids based on risk levels. Rebai et al. [13] highlighted the most important essential charters that influence school performance and determine the connections between these variables. In their study’s conclusion, the important variables of regression trees were the size of the school, the proportions of males and females, the size of classes, racial competition, and parental pressure. The Random Forest algorithm’s findings further revealed that the prediction accuracy model was more strongly influenced by the size of the school and the proportion of female students.
Recent changes have influenced EDM in the educational area. Therefore, researchers have explored fresh options and opportunities for technology-integrated education systems based on the students’ demands and needs. Modern EDM methodologies and application strategies are essential for improving the learning environment. To assess educational settings and machine learning approaches, EDM is crucial for comprehending students’ learning environments [14]. To develop discipline in the classroom machine learning and data mining methodology were developed. It examined data from educational settings and employed data mining and machine learning approaches to identify the prediction pattern that represented students’ performance and behaviour. Many techniques are used to mine educational data like K-Nearest Neighbour, Decision Trees, Machine Learning tools, Naive Bayes, and others [15,16]. Clustering, association rules, and classifications are examples of several types of knowledge that may be investigated. The information gained may be used to forecast student enrollment in a particular course, identify unusual values in student result sheets, forecast student performance, identify unfair test practices, and improve the traditional classroom teaching approach [17].
A study by Akour et al. [18] researched EDM, stating that it has taken a significant place in research as it has helped to reveal some data about academic records to predict students’ performance. The study explains how well deep learning algorithms, such as Convolutional Neural Networks (CNN), predict students’ success and offer potential interventions for academically struggling individuals. Furthermore, in response to the situation of the educational systems, as they currently stand, this forecast may be useful in developing and implementing numerous improvements in the academic environment. A new model based on machine learning techniques was proposed by Yagci [19] in a study to forecast undergraduate students’ final grades using data from their midterm grades. One thousand eight hundred fifty-four students were enrolled in a Turkish language-I course at a Turkish public institution during the autumn 2019–2020 academic year made up the study’s sample. The study analyzed the effectiveness of machine learning techniques known as Random Forest, Logistic Regression, K-Nearest Neighbor, Naive Bayes, and nearest support vector machines and then compared them to predict the grades for the final examinations. According to the study’s findings, the suggested model had a classification accuracy of between 70 and 75 percent. Research conducted by Hussain and Khan [20] emphasized students’ grades and marks prediction by applying the controlled ML methods. The data set employed in the study was obtained from the Board of Intermediate & Secondary Education (B.I.S.E) Peshawar, Khyber Pakhtunkhwa. The Decision Tree (DT) method was used for the actual data set involving 126 attributes and the Genetic Algorithm (GA) optimized the data set containing 30 characteristics. Grades were forecasted by the classification system and marks were predicted by the regression model. The classification accuracy for grade prediction was 96.64% and the marks predicting system centered on the regression model that had a Root Means Square Error of 5.34. The results revealed that Machine Learning (ML) technology is effective for students’ performance prediction. Marks and Grade prediction of students is an essential information source that could be applied to improve the standard of education globally.
A study by Marquez-Vera et al. [21] conducted two studies employing high school students’ data from Mexico’s high schools that adopted EDM applications that have recently focused on identifying examples of higher education.
The use of educational data mining tools to forecast student academic failure has been advocated in several publications. The focus is on predicting student achievement based on the footprints they left while completing a course [8,22–27]. From this course, the student’s progress is identified by combining different tools of data mining and machine learning that may not be meeting course requirements [28].
2.1 Contribution to Literature
This study helps the organization of every part of the world to modify the departmental and organizational infrastructure of the department with the aspect of the requirement of the technology and should work on the educational framework for a better understanding for the students. The achievement of educational data mining should take the deep root of the academics that survive in the pandemic situation, and this methodology has many variances to be adopted at any need of the time. The strategy to work with the mechanism of humans and the architect of the technology should be integrated into all models of life. This generation gap in technology can be reduced, and this gap is identified by this study. The modification in the method of modified understanding mechanism is required for all the categories of the organization. The modified support vector machine with the schematic network of education grey wolf optimization is one of the useful models and will have a hugely beneficial impact in the future.
3 Methodology and Experimentation
3.1 Study Structure, Sample, and Setting
The current study employed a quantitative approach that considered the student’s past academic achievement and individual characteristics. The Raosoft sample size calculator suggests using 306 samples with a 95% confidence level and a 5% margin of error. Fifteen hundred survey forms were delivered via Google to Al Neelain University students enrolled in the last year of the graduate program, students were instructed to fill out google forms accordingly.
3.2 Reliability of the Questionnaire
A reliability testing was carried out and the internal consistency reliability was shown to examine the consistency of the responses on the items of the instrument. A Cronbach’s alpha coefficient was employed to examine the degree of consistency amongst the items. The coefficient alpha was over 0.7 which was estimated to be 0.936 as evidence of a high-quality questionnaire, indicating that the survey had good internal consistency. Moreover, for latent variables such as educational, personal, behaviour and co-curricular, the value of Cronbach alpha was 0.901, 0.912, 0.899 and 0.920, respectively.
3.3 Sampling Methodology, Equipment, and Data Gathering
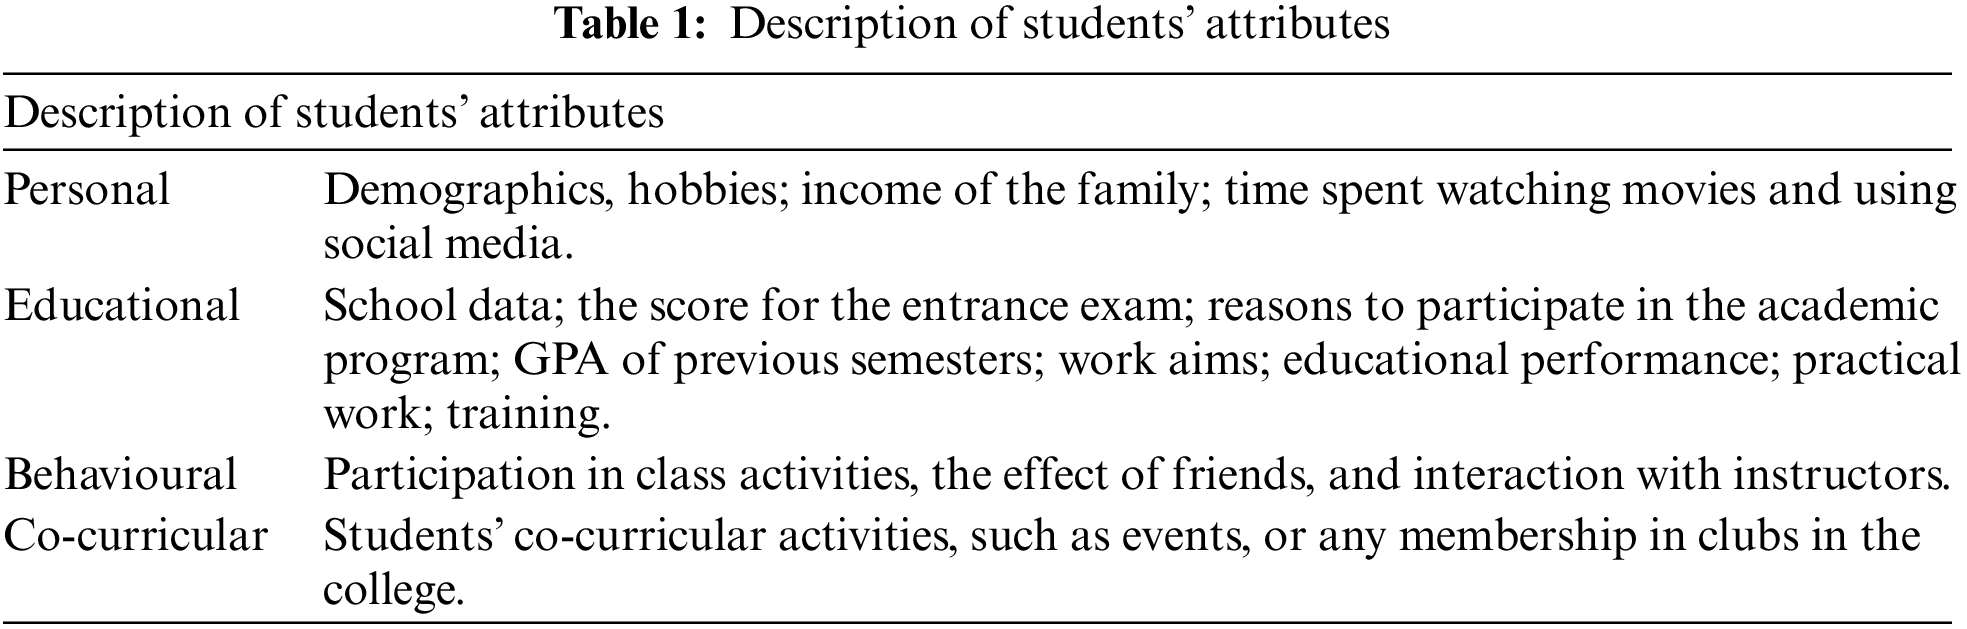
The method to collect the data was designed by surveying through a self-designed questionnaire which was later checked by experts to meet the research standards. The Neelain University undergraduate students were asked to fill out these questionnaires through Google Forms which had 89 attributes and 100 questions on educational, personal, behavioural, and co-curricular activities, as shown in Table 1. Themes related to personal details included demography, the income of the family, hobbies, time spent using social media, and time spent watching movies were included in the questionnaire. In addition, information associated with students’ behavioural attitudes such as interaction with instructors, interaction with friends and effects on the students, and participation in class activities was also extracted. Moreover, the institution’s academic department collected specific information regarding the average Grade Point Average (GPA), entrance exam score, and admission details to achieve better accuracy. The respondents were given a free space instead of a Likert scale to answer these questions.
About 400 forms were filled out by the participants, and 100 forms were excluded because of incomplete details. Therefore, the final sample size of the study was 300. Participants were recruited using convenience sampling.
The following flow chart depicts the prediction of student performance using machine algorithms (Fig. 1).
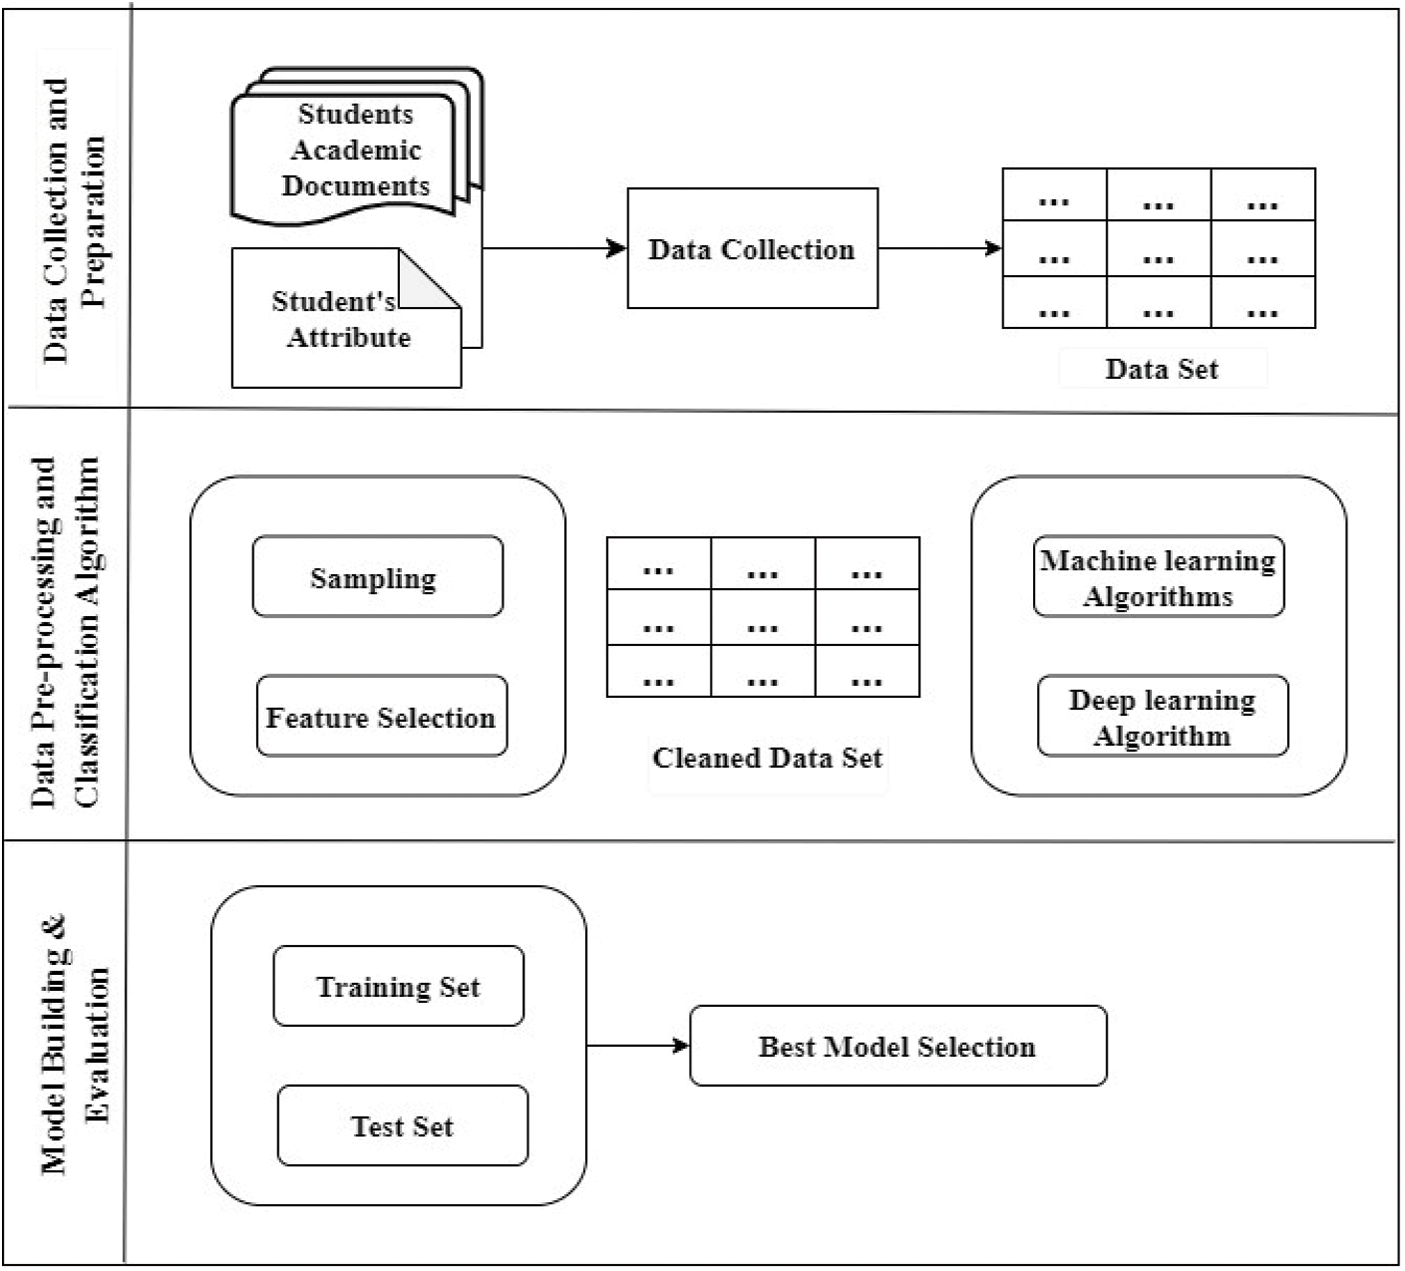
Figure 1: Prediction of student performance using machine algorithms
The respondents were made aware of the objective of the study. The confidentiality of each participant was ensured by assigning them a code for identification. Further, the privacy of information was made sure by keeping the information safe in a password-protected device only to be used by the authors. No physical or physiological harm was permitted due to the assessment. The researcher has followed ethical practices of academic writing and acknowledged all sources of the data and information collected for this research.
Educational data mining helps the students of the organization in many aspects; it is one of the tools that categorizes the methodologies of educational methods and algorithms. Many applications are developed to make the students able and capable of categorizing their achievements for exploring themselves in the field of education. The student adopts many modes of learning, like distance learning, and uses many open and conventional platforms to improve their quality of knowledge. The EDM research project works on this strategic cycle for the extraction of large data and analysis of algorithms (Fig. 2) [29].
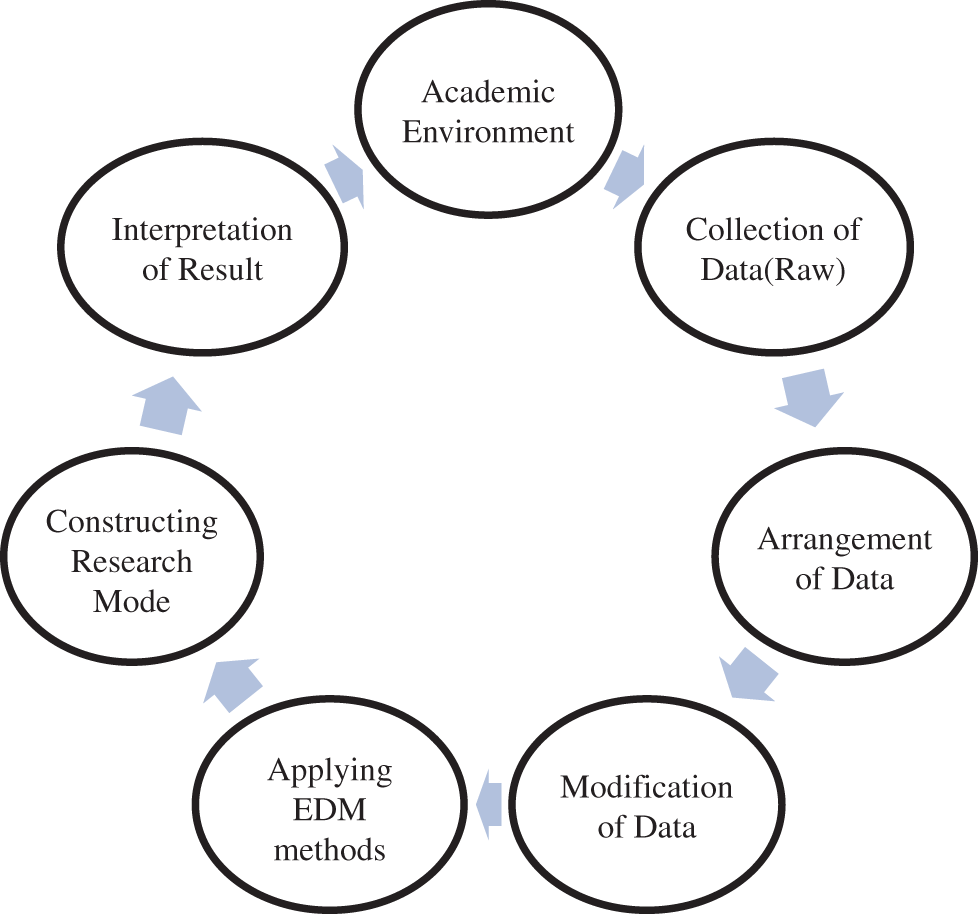
Figure 2: Strategic cycle of EDM in an educational environment
The improved Educational Grey Wolf Optimization (EGWO) Support Vector Machine (SVM) methodology is proposed and consists of two important parts. The first step’s initial population placements were created using Particle Swarm Optimization (PSO). Then, using adaptive feature space search, Educational Grey Wolf Optimization (EGWO) was employed to choose the optimal attribute combination. The second stage uses the SVM classifier to forecast classification accuracy. The EGWO is primarily used to explore the feature space for useful feature combinations adaptively. The smallest number of carefully chosen features with the highest classification accuracy make up the ideal feature combination. Using EGWO’s fitness function, the chosen features are assessed for their 10-fold cross-validation scheme on average classification accuracy. According to the study, the proposed model of EGWO has been proven to be functional in balance orientation for the practical implication using the PSO tool and supporting vector machine (SVM) for improving the knowledge of the student. These methods are working on the experimental approach and the concept building with their influencer’s mechanism [30].
The method which is adopted by the student to get education from computational studies and practical experience gave better results, and this gave long-term benefits. The final grades of students were taken as the outcome variable as the main aim of the study was to depend on the improvement of student’s final grades, and the remaining factors were taken as independent variables. The dataset was standardized for processing and preparation using questionnaires to collect data. Since cross-validation was utilized, a structure’s data arrangement comprises five groups. For each group, the number of passed and failed students is equal. One of the basic components of educational mining is Deep learning. This technology is modifying and entering every field of the industry, it has gained more importance to be implemented in the root of every system with deep mechanisms. It is helping the origin to develop the methods and to identify the base cause of the processing of language of information technology. It is very helpful to create the databases of the system [31].
Data cleaning for the present study was done by verifying the data, which was stored in a spreadsheet. Also, other tools such as Python, particularly packages like pandas, matplotlib, and seaborn, were used. These tools helped in visualizing and cleaning the students’ data. Irrelevant and/or unnecessary variables were removed. Also, some labels were generalized, such as the one for hobbies and interests. One-hot encoding and integer encoding techniques were used to transform the categorical attributes into numerical values after being divided into two groups, nominal and ordinal data.
The feature scaling is used to regularize the independent variables. This step is usually done in a pre-processing step. In this method, we subtract each present value from the minimum value and then we divide the result by the difference between the maximum value and minimum value. This technique is performed so we can get comparable scale, values of numerical instability can be prevented and the function of the algorithm can be enhanced. Data reduction was used to minimize data dimensionality by reducing the number of features while retaining those features. It includes modifying, scaling, encoding, and sorting. Data visualization is made more accessible, and machine learning algorithms perform better when the dimensionality of the data is reduced without losing its usefulness. This level of categorization is crucial. The best characteristics are selected for categorization. Specifically, attributes with no contribution are removed from the classification output. The features were assessed using the correlation attribute evaluation in Weka by computing the correlation between the class and the characteristics. Eighteen input qualities make up the dataset and class label.
Various conventional methods are categorized in EDM. The deep learning method is adopted as a recurrent neural network is created to classify student results in a course using a modified Educational Grey Wolf Optimization (GWO). The redesigned recurrent neural networks using the GWO model were created by changes to the GWO and Recurrent Neural Network (RNN) models. A recent GWO-based algorithm is created by making two small adjustments to the original GWO aiming to improve the classification of students by adjusting parameters of the recurrent neural network. The results show that the changes had a favourable impact on categorization accuracy.
The population is divided into the Global Warming Potentials (GWP) algorithm into four sets. The three most physically fit wolves, alpha, beta, and delta, arrange the omega wolves to create the ideal search space. Compared to the usual algorithm, the omega wolves update their current positions with the best-found positions. Including another top solution for an alpha, beta, and delta, known as gamma, is the model’s first modification. The second adjustment specified the omega wolves’ step size. In the proposed system, the student’s data are saved in the form of spreadsheets, and then pre-data is processed for selected attributes. After these 3 types of classification techniques are used which are likely GWO, RNN, and GWP. The accuracy measurement is made once they run through these techniques individually. The variables were determined in each case (Table 2 and Fig. 3).
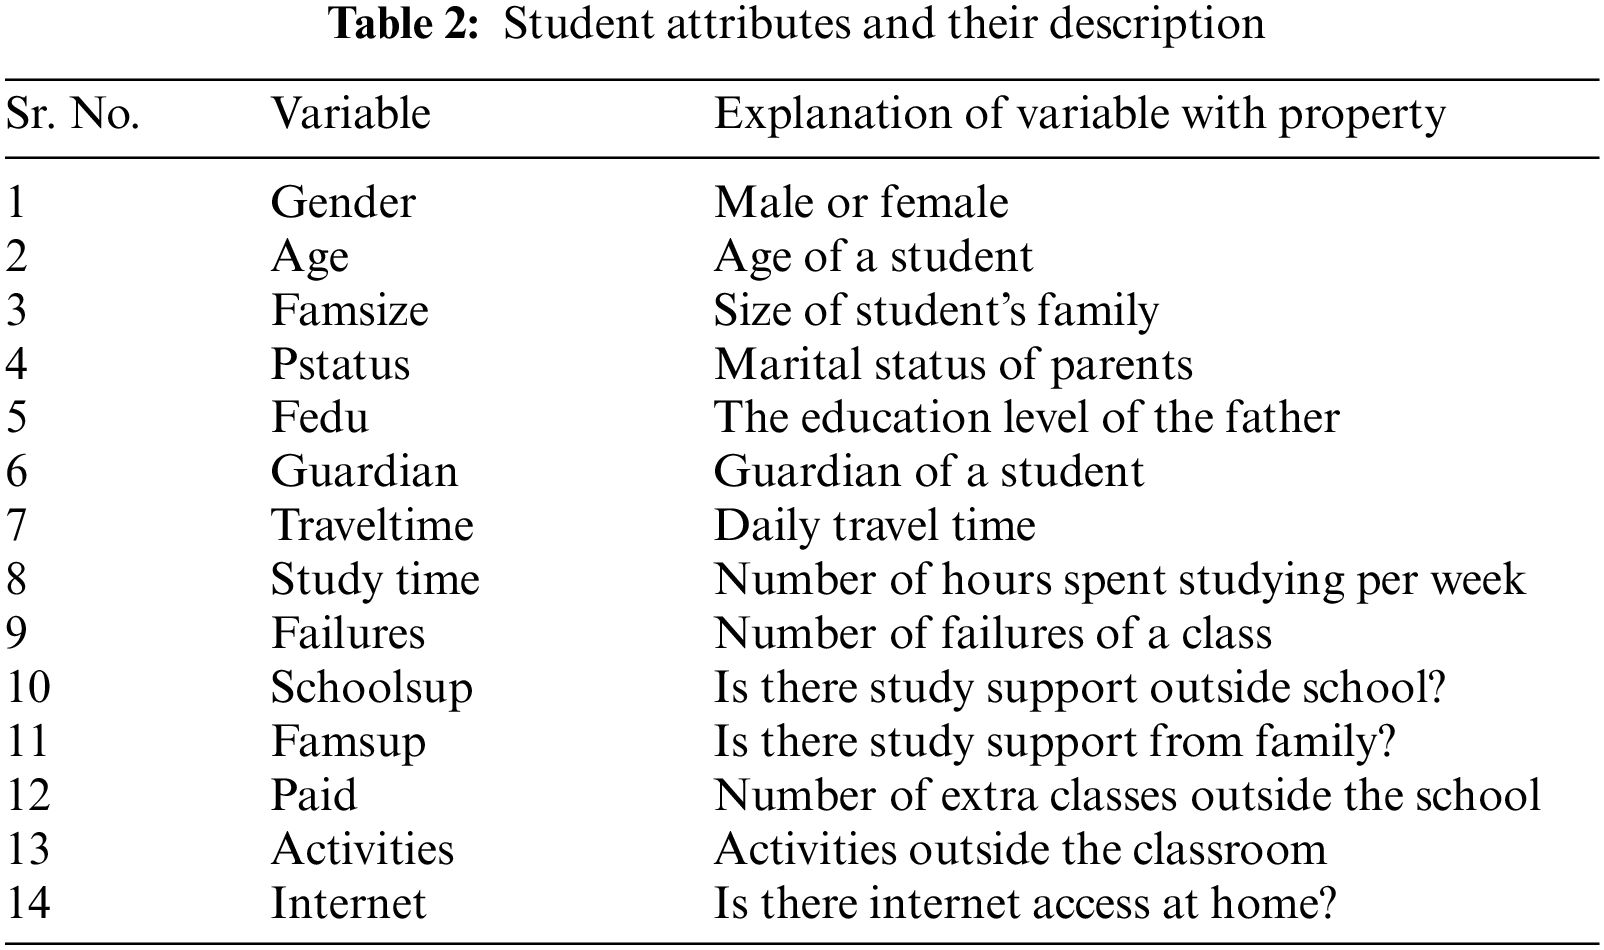
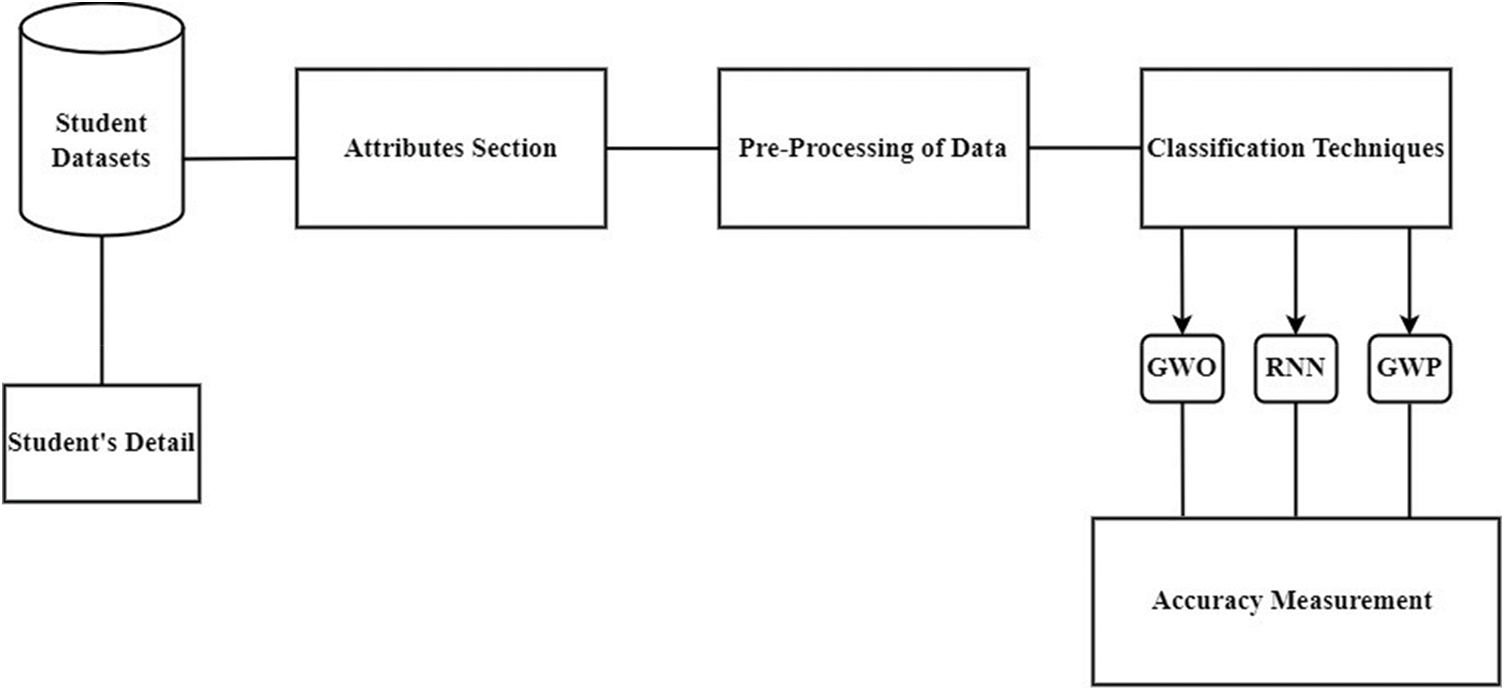
Figure 3: Proposed system
The evaluation criterion is elaborated below:
In diagnosed causes resulting positive, precision measures the accuracy of the result
It is classified as:
Further, it can be classified as,
precision for a subclass:
where,
The percentage predicted by the actual value of true positives is stated as recall. Below are the formulas to calculate the value of recall:
For subclasses recall uses a similar representation as precision, as shown below:
F1 Score displays the equilibrium between precision and recall. This mathematical statement is used to evaluate the F1 Score per class.
To elaborate on the matter, the F1 Score signifies the efficiency of a model in detecting all positive cases in a diagnosis.
It gives the probability of identifying correctly classes in each class (
Mathematically,
A Recurrent Neural Network (RNN) has a modified structure based on two hidden and two context layers. The model has the following structure: The input layer has the following number nodes: 18, 10-10, 10-10, 1, and 18. The nodes in the first and second hidden layers, respectively, have duplicate values from previous layers.
The categorization was validated using the 5-fold cross-validation approach. Each fold processes the training phase. The modified GWO and the modified RNN in the developmental phase make up the Recurrent Neural Network with a Modified Grey Wolf Optimizer (M-RNNGWO). Through the modified GWO, the hyperparameters are first established as a vector. As a result, variables that represent a bias or weight in the Modified Grey Wolf Optimizer with Recurrent Neural Network (M-RNNGWO) are included in the vector.
A sample is an input to M-RNNGWO followed by an output from the first hidden layer. The Recurrent Neural Network model learns and maintains a set of states representing a summary of previous inputs. The subsequent training samples are fed to the redesigned RNN using comparable initialized biases and weights to continue the process repeatedly.
3.5.6 Calculating Weight Completion
The user may define hidden layers, neurons, and context layers at each layer in all models. The main activity is to choose the fewest possible values for the factors above, maybe identifying the most likely organization given the needs. In contrast, this is not straightforward in practice since many trials must be conducted with various model structures before it can be determined which one performs the task best.
The flowchart illustrates the steps for the method and experimentations (Fig. 4). Firstly, the structure of the study and sample size are finalized, after that reliability test for the questionnaire is performed and finally data is stored with ethical considerations. After the data is stored, it is pre-possessed for cleansing data, and then classification and tool evaluation are done to find recall, precision, accuracy, and F1 Score values. The model is trained with modified RNN with a 5-fold cross-validation process with calculating weight to find the influence of input into output.
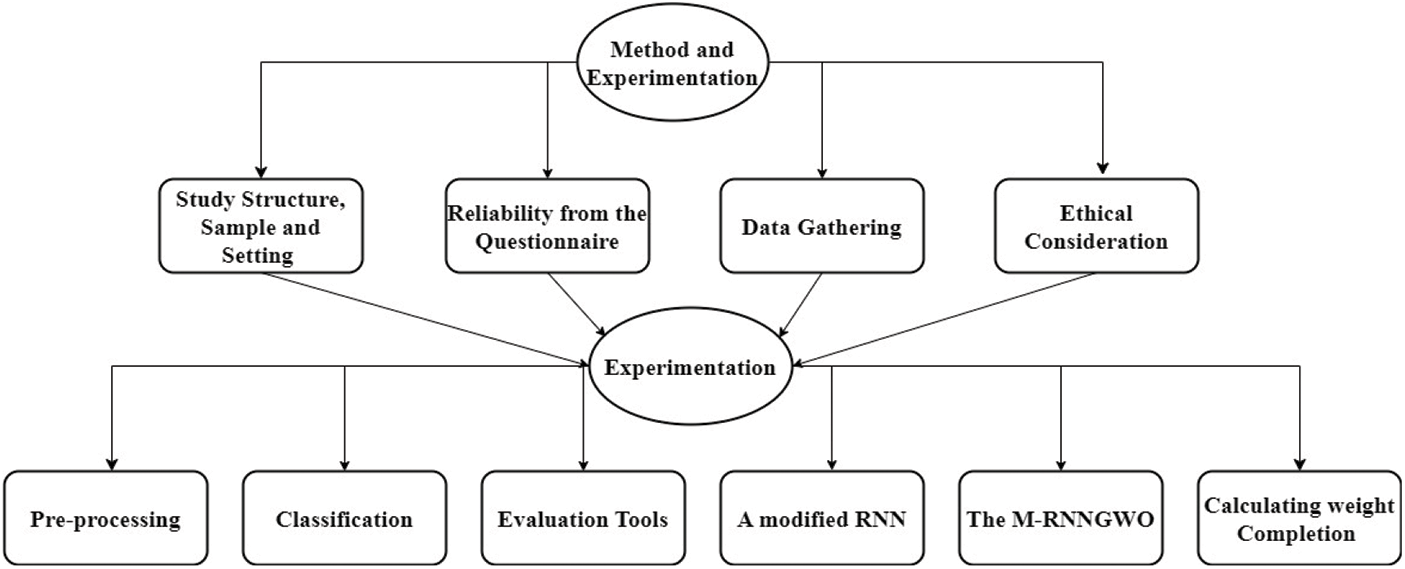
Figure 4: Methodology
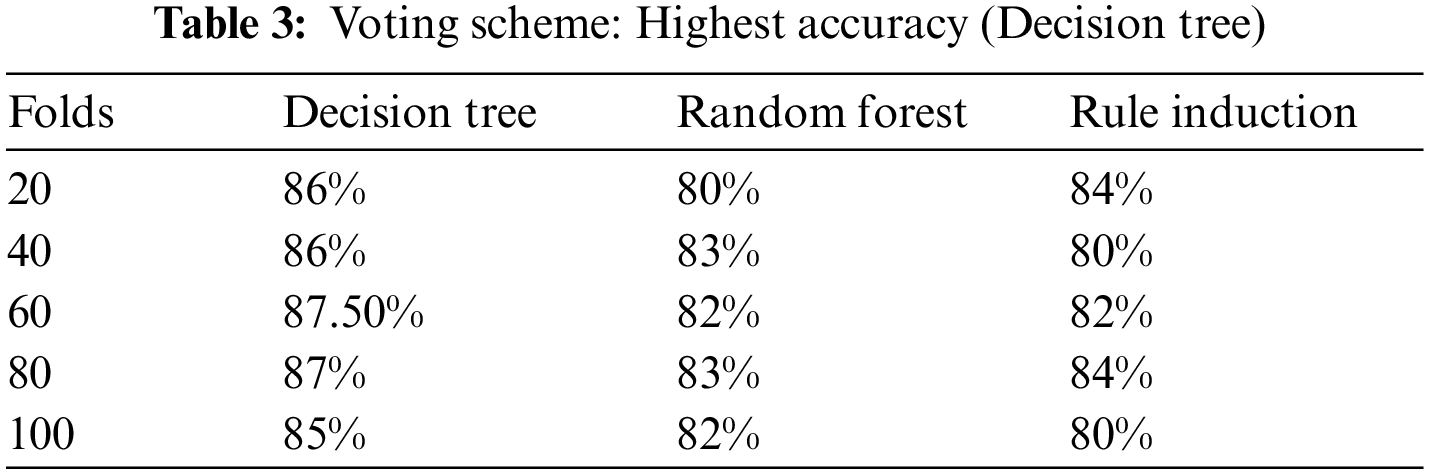
With the help of questionnaires, two datasets were extracted and used in this study: One for the predicting phase and one for the training phase after ethical consideration. The training data was investigated by different classifiers in the training phase, and each classifier provided the accuracy percentages at different folds. Three different classifiers including Decision Tree, Random Forest, and Rule Induction provided the accuracy percentage fivefold (Table 3). The findings indicated that the decision tree at 60 folds provided the highest accuracy percentage (87.50%). The outcome also specified that the Random Forest algorithm provided the highest accuracy percentage (83%) at 40 and 80 folds. The results indicated that the Rule Induction algorithm at 20 and 80 folds provided the highest accuracy percentage (84%).
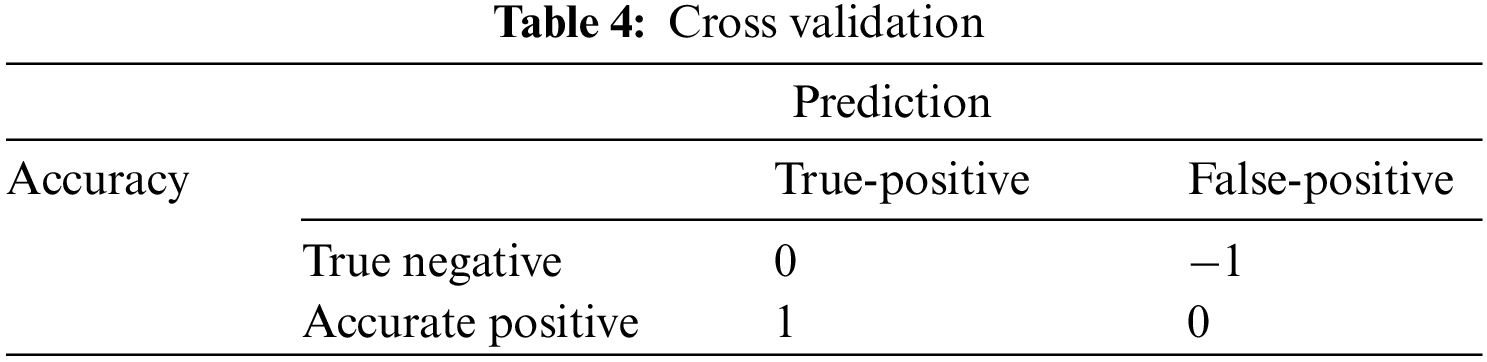
Different prediction of the grades was provided through different classifiers. Test results were used to forecast the students’ final semester grades in the testing phase. A ratio of the total number of cases was accurately forecasted, such as true negative and accurate positive, to illustrate accuracy in all cases. In contrast, the true positive case ratio represented the true positive and false-positive aggregate precision. The true positive ratio is indicated from recall to the true positive and false negative aggregate (Table 4).
In addition, F-measure was used to combine precision and recall, which is assumed to be a better predictor of their association. Training made up about 80% of the data while testing made up almost 20% of the total data. First, the model was trained on training data and then evaluated on test data. The training dataset confusion matrix is represented in (Table 5).
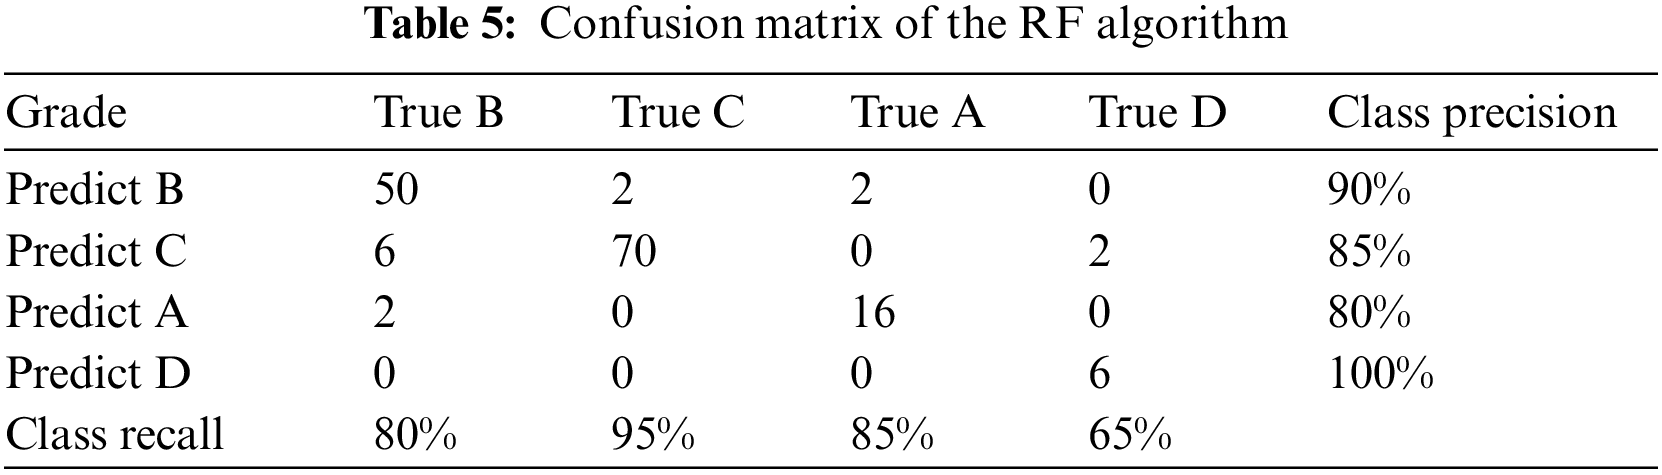
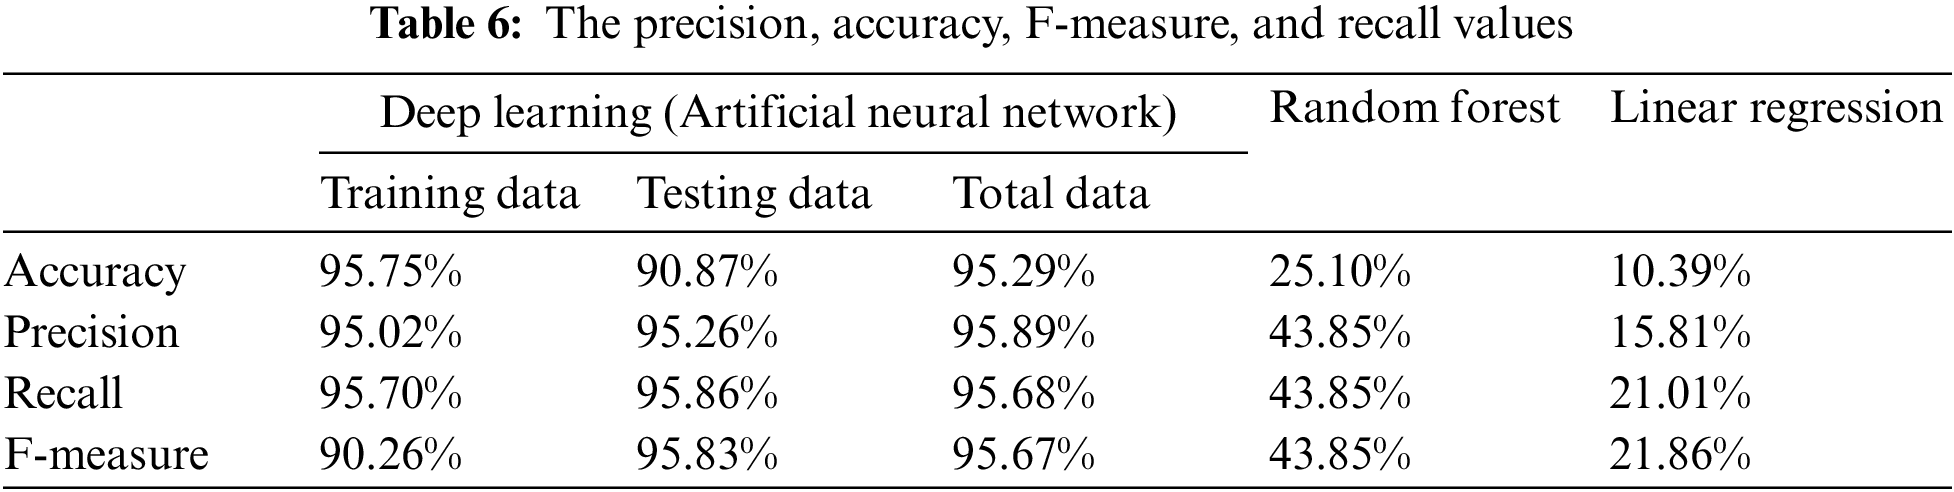
A multitude of decision trees is built by random forest, an ensemble learning classification method at training time, and generating output that is the individual trees’ mean prediction or class mode. The model was created using an algorithm, and the final grades were then predicted using that method. A Random Forest (RF) package was used and compared with the actual grades and the Root Mean Squared Error (RMSE) value to forecast the accuracy of the prediction of final grades. The precision, accuracy, F-measure, and recall values are presented in Table 6. Linear regression helped in predicting new values with the help of existing data. The present study, helped in comparing the baseline by undertaking final grades as the outcome variable, and the remaining variables were considered independent variables to find the final grade of student as it is the study’s main aim.
The model summary portrayed the significance of the model at a 0.05% significance level. The estimated grades were computed based on coefficients and revealed root mean square error, representing an almost measure of fit, which came to be 2.000. The model forecasted 156 cases accurately, and the remaining 744 cases were indicated inaccurately when coefficients were attained from the linear regression for predicting the final grades. When tested, the absolute grade value was forecasted through the model, an outcome variable, and the actual value and the predicted value of the final grade were utilized to prepare the confusion matrix.
Prediction accuracy was improved through an artificial neural network and deep learning, whereas prediction accuracy was revealed through a confusion matrix.
The study aimed to recognize how EDM techniques such as DL and AI predict students’ performance. Academic accomplishment worldwide is the top priority for any institution. Therefore, it is essential to predict students’ performance via different methods accurately. The institutions might be facilitated to forecast and additionally emphasize students having a low likelihood of performing to improve their performance. Standard methods of ensembles were studied in earlier studies, including boosting, random forest, and bagging. The study enhanced the model’s performance using artificial neural networks and prediction accuracy. The impact of algorithms helps the concept building of deep learning, which works with the process of neural network process and also represents the multiple dimensions for the representation of data. Deep learning methodologies work on the graphical vector of the concept building of the educational model framework. The data mining of the brain nerves with the development of machine learning will increase the knowledge of capacity learning. Deep learning methodology helps to access the availability of large data completion with integrity. Additionally, large data is also used on the parallel trigger flow mechanism based on the models [32].
The student prediction model’s effectiveness was assessed using various techniques, including random forest, linear regression, and artificial neural networks. It was noted that linear regression could merely produce an accuracy of 12% when comparing the accuracy of different methods such as random forest and, deep learning. A slightly higher accuracy of 28% was produced by Random Forest, whereas deep understanding made the accuracy of 96% on the overall dataset.
It has been revealed in this study that Artificial Neural Networks portray more consistent attitudes and effective classification outcomes compared to other conventional classifiers based on prediction accuracy. It was reported that deep learning could forecast the final grades with an accuracy rate of 97% on the test dataset that was not utilized for preparing the model since another dataset can also be predicted with almost the same accuracy. Moreover, Tarik et al. [33] also discussed how an intelligent solution helps predict Moroccan students’ performance through a suggested system of AI techniques. Also, this finding is similar to the results of [18,19], as they used a deep learning algorithm to predict students’ performance which can help work on those students who are struggling with their grades. Another study by Korzh et al. [34] elaborates on the method of acquiring and maintaining informational data from higher educational institutes to form a catalogue of units in their study. The procedure comprises several stages of achieving positive information: Forming a directory of educational units for performing an informational activity, formation of an inclusive thematic description of the educational institute, formation of the inclusive register of the possible information of the educational institute, exploring an image generator and identifying image fragments of existing information, structural formation of social interface for information, planning generator entrance, information resource formation, generator entrance, the realization of social interface for information, solidify informational activity, inclusively verifying results. This method resulted in delivering a one-year cycle of informational activity in higher education institutes which is forecasted to last for three years in some scenarios [34]. Fedushko et al. [35] used the data mining technique to obtain the best results for free course certification on online platforms. They analyzed the most popular educational videos on YouTube worldwide based on their quality of content and visuals. Further, the paper evaluated the most popular educational videos viewed in Ukraine media. The study laid forward the leading video that increases educational activity scope or the development of specific questions or problems. The advisory system for the finest educational service online was proposed with the rate determination of the finest and the most secure educational platform online [35]. Fig. 5 depicts the comparative analysis between the findings of previous studies and present study results in the form of a flow chart for better understanding.
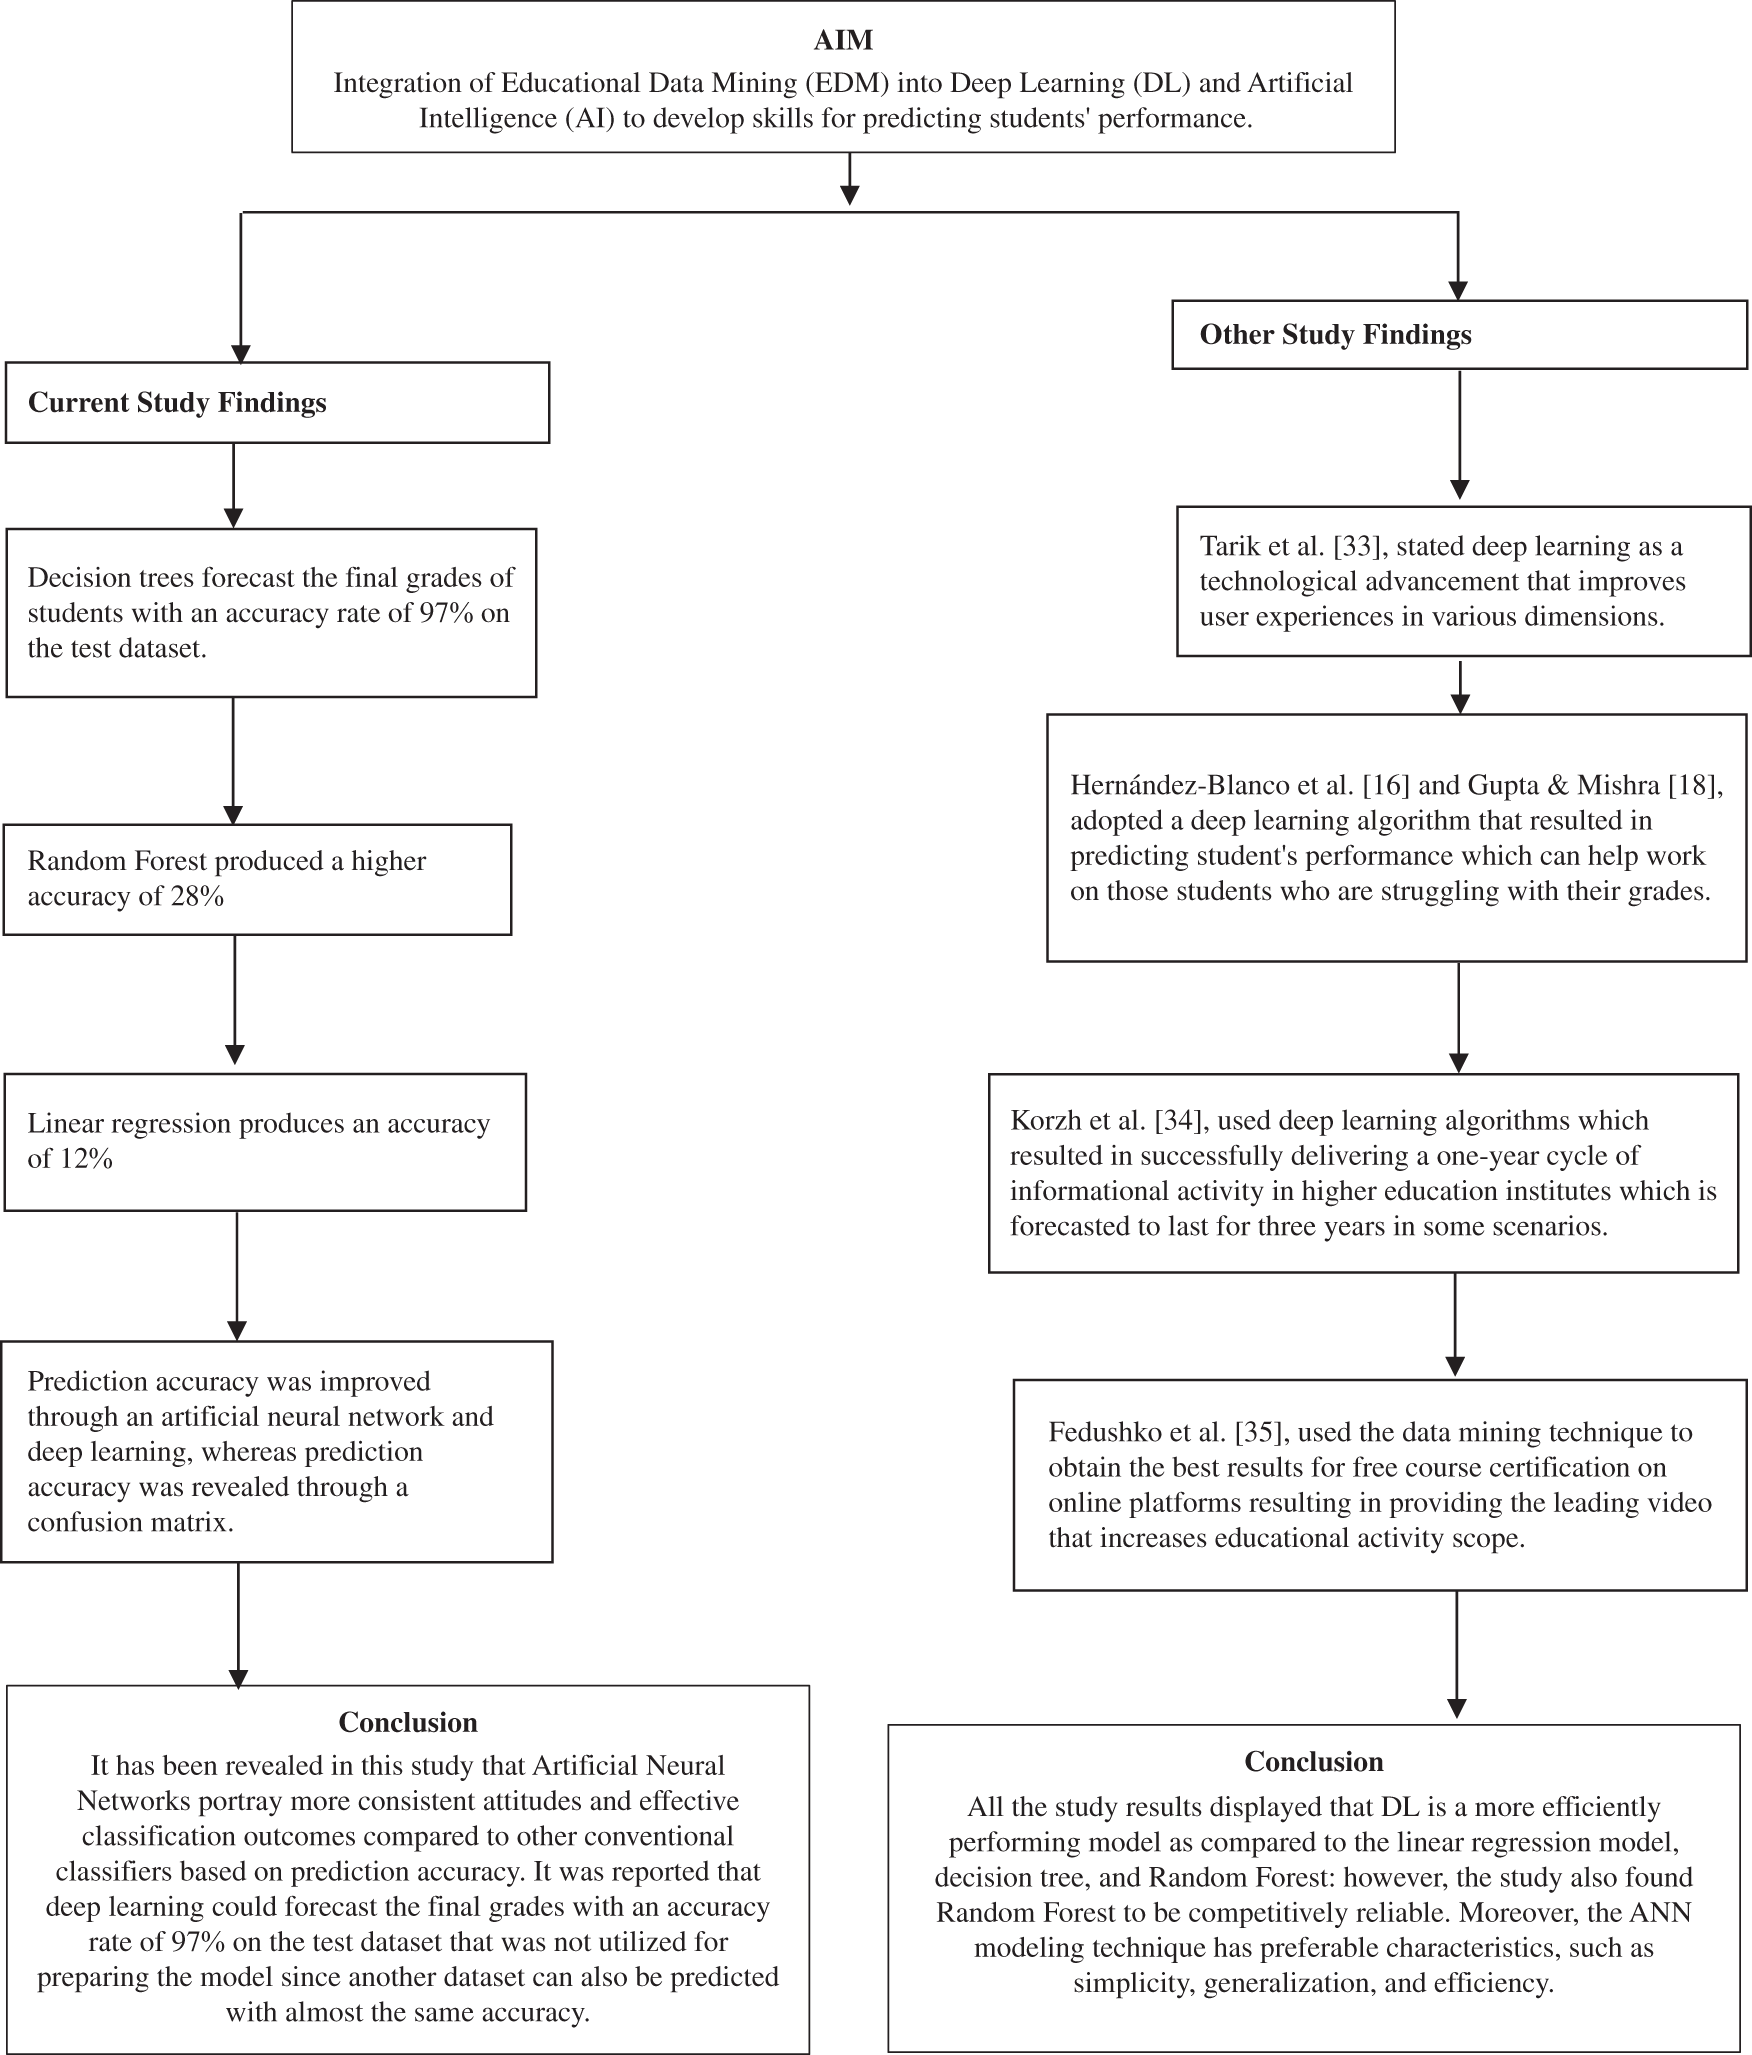
Figure 5: A display flow chart for comparative results
In conclusion, the study results displayed that DL is a more efficiently performing model as compared to the linear regression model, decision tree, and Random Forest: However, the study also found Random Forest to be competitively reliable. Moreover, the ANN modelling technique has preferable characteristics, such as simplicity, generalization, and efficiency. These characteristics make ANN suitable for more precise modelling of complicated systems. To sum up, several algorithms and techniques were used to forecast students’ academic achievement. The findings show that EDM can predict students’ performance. The results of this study can benefit the teaching staff in recognizing students who have below or above-average scores early.
Moreover, they can also match the students who have scored below average marks with those who have scored above average and motivate them to perform tasks in teams. In this way, their driver can be increased, and they will actively start participating in class activities, ensuring that learning takes place. Also, this data-driven research might aid higher education in developing a framework for learning analytics to support decision-making. Implementing EDM in educational institutes for higher education can be useful in providing strategies that build students’ interest and construct such tools that institutions and course instructors will be able to implement in the classroom for continuous improvement. Further, teachers can use EDM for forecasting to find high risks in the system and prepare a strategy to overcome the issue beforehand and pedal a student’s learning behaviors in the future.
The proposed model in the study is easily accessible to non-specialists and diverse audiences. The study’s findings suggest that academic instructors should consider the use of EDM while forecasting students’ academic performance and use its results to develop tailored programs for individuals who face difficulty maintaining the required grade of GPA. Further, the study motivates academics to assess, look into, and discover more about EDM at several other universities for future researchers to implement this advanced technique. For example, they can look at the outcomes of remedial instruction for students with difficulty in their core subjects and language proficiency’s role in social science and orientation courses.
The study’s findings demonstrated that artificial neural networks exhibit a more consistent attitude and effective classification outputs when compared to other traditional classifiers based on prediction accuracy and help represent data in multiple dimensions. It was noted that deep learning forecast the final grade accuracy with about 97% on the dataset, followed by random forest and regression model which are 28% and 12%, respectively. The findings indicate a link between students’ behavioural characteristics and academic success. This model summary portrayed a 0.05% significance level. The study suggests that a successful classifier model should be precise and easy for teachers to understand. Moreover, the ANN modelling technique has been preferred based on its characteristics, such as simplicity, generalization, and efficiency.
In addition, an extensive dataset and large sample size are recommended, which will allow for more accurate model training and which can improve results in better prediction. With the help of the current study, it can be enhanced and expanded by using additional machine learning techniques, such as advanced deep learning techniques to improve the classification of student data by future research.
Acknowledgement: The author is very thankful to all the associated personnel in any reference that contributed in/for the purpose of this research.
Funding Statement: This study is supported via funding from Prince Sattam bin Abdulaziz University Project Number (PSAU/2024/R/1445).
Author Contributions: It is a single author paper and M.M.Saeed contributed in all parts of the manuscript idea to final proofreading.
Availability of Data and Materials: The datasets used and analyzed during the current study are available from the corresponding author on reasonable request.
Conflicts of Interest: The author declares that he has no known competing financial interests or personal relationships that could have appeared to influence the work reported in this paper.
References
1. S. S. Chaurasia, D. Kodwani, H. Lachhwani, and M. A. Ketkar, “Big data academic and learning analytics,” Int. J. Educ. Manage., vol. 32, no. 6, pp. 1099–1117, 2018. doi: 10.1108/ijem-08-2017-0199. [Google Scholar] [CrossRef]
2. D. Hooshyar, M. Pedaste, and Y. Yang, “Mining educational data to predict students’ performance through procrastination behaviour,” Entropy, vol. 22, no. 1, pp. 12, 2019. [Google Scholar] [PubMed]
3. E. Alhazmi and A. Sheneamer, “Early predicting of students performance in higher education,” IEEE Access, vol. 11, pp. 27579–27589, 2023. [Google Scholar]
4. G. Ramaswami, T. Susnjak, and A. Mathrani, “On developing generic models for predicting student outcomes in educational data mining,” Big Data Cognit. Comput., vol. 6, no. 1, pp. 6, 2022. [Google Scholar]
5. Y. S. Su and C. F. Lai, “Applying educational data mining to explore viewing behaviors and performance with flipped classrooms on the social media platform Facebook,” Front. Psychol., vol. 12, pp. 653018, 2021. [Google Scholar] [PubMed]
6. C. Romero, S. Ventura, M. Pechenizkiy, and R. S. J. D. Baker, “Modeling affect by mining students’ interactions within learning environments,” in Handbook of Educational Data Mining, 1st Edition. CRC Press, 2010, pp. 231–244, doi: 10.1201/b10274. [Google Scholar] [CrossRef]
7. D. Ali and W. K. Hanna, “Predicting students’ achievement in a hybrid environment through self-regulated learning, log data, and course engagement: A data mining approach,” J. Educ. Comput. Res., vol. 60, no. 4, pp. 960–985, 2021. [Google Scholar]
8. S. U. Waheed et al., “Predicting the academic performance of students from VLE big data using deep learning models,” Comput. Human Behav., vol. 104, pp. 106189, 2020. [Google Scholar]
9. F. Cruz-Jesus et al., “Using artificial intelligence methods to assess academic achievement in public high schools of a European Union country,” Heliyon, vol. 6, no. 6, pp. e04081, 2020. [Google Scholar] [PubMed]
10. M. H. Sadiq and N. S. Ahmed, “Classifying and predicting students’ performance using improved decision tree c4.5 in higher education institutes,” J. Comput. Sci., vol. 15, no. 9, pp. 1291–1306, 2019. [Google Scholar]
11. M. Fernandes et al., “Educational data mining: Predictive analysis of the academic performance of public-school students in the capital of Brazil,” J. Bus. Res., vol. 94, pp. 335–343, 2019. [Google Scholar]
12. A. S. Hoffait and M. Schyns, “Early detection of university students with potential difficulties,” Decis. Support Syst., vol. 101, pp. 1–11, 2017. [Google Scholar]
13. S. Rebai, F. B. Yahia, and H. Essid, “A graphically based machine learning approach to predict secondary schools performance in Tunisia,” Socioecon. Plann. Sci., vol. 70, pp. 100724, 2020. [Google Scholar]
14. A. Bogarín, R. Cerezo, and C. Romero, “A survey on educational process mining,” Wiley Interdiscip. Rev.: Data Min. Knowl. Discov., vol. 8, no. 1, pp. e1230, 2017. [Google Scholar]
15. C. Chaka, “Educational data mining, student academic performance prediction, prediction methods, algorithms and tools: An overview of reviews,” 2021. doi: 10.20944/preprints202108.0345.v1. [Google Scholar] [CrossRef]
16. A. Hernández-Blanco, B. Herrera-Flores, D. Tomás, and B. Navarro-Colorado, “A systematic review of deep learning approaches to educational data mining,” Complexity, vol. 2019, pp. 1–22, 2019. [Google Scholar]
17. S. L. Gupta and N. Mishra, “Artificial intelligence and deep learning-based information retrieval framework for assessing student performance,” Int. J. Inf. Retr. Res., vol. 12, no. 1, pp. 1–27, 2022. [Google Scholar]
18. M. Akour, H. Alsghaier, and O. Al Qasem, “The effectiveness of using deep learning algorithms in predicting students achievements,” Indones. J. Electr. Eng. Comput. Sci., vol. 19, no. 1, pp. 387–393, 2020. [Google Scholar]
19. M. Yağcı, “Educational data mining: prediction of students' academic performance using machine learning algorithms,” Smart Learning Environments, vol. 9, no. 1, pp. 11, 2022. [Google Scholar]
20. S. Hussain and M. Q. Khan, “Student-performulator: Predicting students’ academic performance at secondary and intermediate level using machine learning,” Ann. Data Sci., vol. 10, no. 3, pp. 637–655, 2021. doi: 10.1007/s40745-021-00341-0. [Google Scholar] [PubMed] [CrossRef]
21. C. Márquez-Vera et al., “Early dropout prediction using data mining: A case study with high school students,” Expert. Syst., vol. 33, no. 1, pp. 107–124, 2015. [Google Scholar]
22. M. Kloft, F. Stiehler, Z. Zheng, and N. Pinkwart, “Predicting MOOC dropout over weeks using machine learning methods,” in Proc. EMNLP 2014 Workshop Anal. Large-Scale Soc. Interact. MOOCs, 2014. doi: 10.3115/v1/w14-4111. [Google Scholar] [CrossRef]
23. Y. H. Hu, C. L. Lo, and S. P. Shih, “Developing early warning systems to predict students’ online learning performance,” Comput. Human Behav., vol. 36, pp. 469–478, 2014. [Google Scholar]
24. C. Ye and G. Biswas, “Early prediction of student dropout and performance in MOOCs using higher granularity temporal information,” J. Learn. Anal., vol. 1, no. 3, pp. 169–172, 2014. [Google Scholar]
25. W. Xing, X. Chen, J. Stein, and M. Marcinkowski, “Temporal predication of dropouts in MOOCs: Reaching the low-hanging fruit through stacking generalization,” Comput. Human Behav., vol. 58, pp. 119–129, 2016. [Google Scholar]
26. M. A. Al-Barrak and M. Al-Razgan, “Predicting student’s final GPA using decision trees: A case study,” Int. J. Inf. Educ. Technol., vol. 6, no. 7, pp. 528–533, 2016. [Google Scholar]
27. A. Namoun and A. Alshanqiti, “Predicting student performance using data mining and learning analytics techniques: A systematic literature review,” Appl. Sci., vol. 11, no. 1, pp. 237, 2020. [Google Scholar]
28. A. Van den Beemt, J. Buijs, and W. Van der Aalst, “Analysing structured learning behavior in massive open online courses (MOOCsAn approach based on process mining and clustering,” Int. Rev. Res. Open Distrib. Learn., vol. 19, no. 5, pp. 37–60, 2018. [Google Scholar]
29. A. Hicham, A. Jeghal, A. Sabri, and H. Tairi, “A survey on educational data mining [2014–2019],” in 2020 Int. Conf. Intell. Syst. Comput. Vis. (ISCV), 2020. doi: 10.1109/iscv49265.2020.9204013. [Google Scholar] [CrossRef]
30. Y. Wei et al., “An improved grey wolf optimization strategy enhanced SVM and its application in predicting the second major,” Math. Probl. Eng., vol. 2017, pp. 1–12, 2017. [Google Scholar]
31. W. G. Hatcher and W. Yu, “A survey of deep learning: Platforms, applications and emerging research trends,” IEEE Access, vol. 6, pp. 24411–24432, 2018. [Google Scholar]
32. J. Schmidhuber, “Deep learning in neural networks: An overview,” Neural Netw., vol. 61, pp. 85–117, 2015. [Google Scholar] [PubMed]
33. A. Tarik, H. Aissa, and F. Yousef, “Artificial intelligence and machine learning to predict student performance during the COVID-19,” Procedia Comput. Sci., vol. 184, pp. 835–840, 2021. [Google Scholar] [PubMed]
34. R. Korzh, S. Fedushko, and A. Peleschyshyn, “Methods for forming an informational image of a higher education institution,” Webology, vol. 12, no. 2, pp. 1–10, 2015. [Google Scholar]
35. S. Fedushko, Y. Syerov, O. Tesak, O. Onyshchuk, and N. Melnykova, “Advisory and accounting tool for safe and economically optimal choice of online self-education services,” in Int. Workshop Conflict Manag. Global Inform. Networks (CMiGIN), 2019, pp. 290–300. [Google Scholar]
Cite This Article
 Copyright © 2024 The Author(s). Published by Tech Science Press.
This work is licensed under a Creative Commons Attribution 4.0 International License , which permits unrestricted use, distribution, and reproduction in any medium, provided the original work is properly cited.
 Downloads
 Citation Tools