
 Submit a Paper
 Propose a Special lssue
 Open Access
ARTICLE

A Framework for Driver Drowsiness Monitoring Using a Convolutional Neural Network and the Internet of Things
1 School of Computing, Telkom University, Bandung, 40257, Indonesia
2 Faculty of Information Science and Technology, Universiti Kebangsaan Malaysia, Bangi, 43600, Malaysia
3 Department of Electrical Engineering, College of Engineering, Qassim University, Al-Gassim, 51411, Saudi Arabia
4 Graduated School of Business, Universiti Kebangsaan Malaysia, Bangi, 43600, Malaysia
* Corresponding Author: Muhamad Irsan. Email:
Intelligent Automation & Soft Computing 2024, 39(2), 157-174. https://doi.org/10.32604/iasc.2024.042193
Received 22 May 2023; Accepted 16 January 2024; Issue published 21 May 2024
 View Full Text
 Download PDF
Abstract
One of the major causes of road accidents is sleepy drivers. Such accidents typically result in fatalities and financial losses and disadvantage other road users. Numerous studies have been conducted to identify the driver’s sleepiness and integrate it into a warning system. Most studies have examined how the mouth and eyelids move. However, this limits the system’s ability to identify drowsiness traits. Therefore, this study designed an Accident Detection Framework (RPK) that could be used to reduce road accidents due to sleepiness and detect the location of accidents. The drowsiness detection model used three facial parameters: Yawning, closed eyes (blinking), and an upright head position. This model used a Convolutional Neural Network (CNN) consisting of two phases. The initial phase involves video processing and facial landmark coordinate detection. The second phase involves developing the extraction of frame-based features using normalization methods. All these phases used OpenCV and TensorFlow. The dataset contained 5017 images with 874 open eyes images, 850 closed eyes images, 723 open-mouth images, 725 closed-mouth images, 761 sleepy-head images, and 1084 non-sleepy head images. The dataset of 5017 images was divided into the training set with 4505 images and the testing set with 512 images, with a ratio of 90:10. The results showed that the RPK design could detect sleepiness by using deep learning techniques with high accuracy on all three parameters; namely 98% for eye blinking, 96% for mouth yawning, and 97% for head movement. Overall, the test results have provided an overview of how the developed RPK prototype can accurately identify drowsy drivers. These findings will have a significant impact on the improvement of road users’ safety and mobility.Keywords
According to the World Health Organization’s (WHO) data, one of the major contributing factors to traffic accidents is driver weariness [1]. The National Sleep Foundation also found that 32% of drivers would drive while fatigued at least once a month [2]. Driving when tired puts drivers and other road users at risk for road accidents. Therefore, laws have been passed in several nations to address this issue. For instance, China’s Road Traffic Safety Law states that “drivers are not permitted to drive continuously for more than 4 h, and the rest break between every two long-term drives should not be less than 20 min”. Similar legislation is also applied throughout Europe, it stipulates that “drivers should stop and relax for no less than 20 min every 4.5 h of continuous driving” [3].
The revolutionary idea of the Internet of Things (IoT) architecture has gained enormous popularity over the last decade, resulting in exponential growth in the IoT networks, connected devices, and the data processed therein [4]. Many Internet of Things (IoT) products that collect environmental data and utilize conventional machine learning techniques to analyze it have recently entered the market. Google’s Nest Learning Thermostat is one example [5] as it records temperature data in a structured way and then uses algorithms to understand its user’s temperature preference patterns and schedules. IoT can also help find a vehicle’s location in the event of an accident on the highway [6]. Research conducted by [7] could detect real or fake face images by reducing the dimensions of the face. Microsoft’s Windows IoT team has also recently released a facial recognition security system that uses deep learning technology to perform tasks such as unlocking doors when recognizing its user’s face. Nevertheless, with data transfer using IoT, it is necessary to pay attention to the protocol to save energy [8–10].
Information Technology (IT) in Artificial Intelligence (AI) describes the future and everything it entails. Not only have conventional computer techniques been altered by AI, but it has also substantially altered many different sectors. Businesses are becoming more intelligent and the world is evolving digitally. Therefore, IT organizations must continue to keep up with the intricate procedures that speed up innovation. AI can conduct human-like activities, including learning new material, solving problems, and recognizing speech and text. Computers can also perform specialized jobs by analyzing vast volumes of data and finding recurrent patterns in this data by using AI-powered technologies. Transparency Market Research (TMR) predicted that the worldwide artificial intelligence market will grow at an excellent Compound Annual Growth Rate (CAGR) of 36.1% between 2016 and 2024, rising from $126.14 billion in 2015 to $3,061.35 billion by the end of that year.
Annual increases in road fatalities reached 1.35 million people in 2016. Based on the number of motor vehicles, the fatality rate has, nevertheless, remained relatively consistent in recent years. However, the rate of road fatalities has increased, despite it remaining relatively stable over the previous 15 years at roughly 18 deaths per 100,000 people [11]. Therefore, drivers play a crucial role in maintaining passenger safety. Traffic laws, such as those governing road signs, vehicle speed, stopping distance, and driving etiquette, must be understood by drivers [12]. Road accidents typically occur due to distraction and a lack of focus. Drivers concur that driving takes their total concentration and that multitasking is dangerous [13]. Another cause of road accidents is microsleep. Microsleep is the loss of awareness or alertness brought on by fatigue or sleepiness. Microsleep typically lasts between one and two minutes, but if the driver transitions into a sleep phase, it may last longer. When someone is engaged in a difficult task, like driving or spending a lot of time gazing at a computer, microsleep frequently occurs [14].
Eye blinks or movements can be physically observed sleepiness. A tired detection tool, the Percentage of Eye Closure (PERCLOS), measures a participant’s percentage of eyelid closure over time and indicates slower eyelid closure than blinking. Various real-time operator drowsiness detection systems use the PERCLOS evaluation and custom software capabilities to pinpoint the beginning of weariness. Each technology developer employs a distinct mix and combination of hardware to improve the precision and ability to detect eye movements, eyelid behavior, head movements, and facial expressions [15].
Certain circumstances prevent accidents from being immediately reported to the closest ambulance. Most of the time, no emergency services are available, thus resulting in a lower first aid response and delayed services which may result in fatalities within minutes. Therefore, a solution that addresses all of these issues and can effectively reduce the time delay brought on by medical vehicles must be developed.
An image recognition neural network type called a convolutional neural network (CNN) can be employed to detect weariness. The purpose of the CNN is to process arrays of picture data. This approach comprises of several processes and has a trainable design. Each method consists of a convolution layer, an activation layer (ReLu), and a pooling layer. Additionally, CNN provides a classification procedure for categorizing objects, including flattening, wholly connected, softmax classifiers, and drop out. A total of 96.42% of people use CNN to identify tiredness based on eye movements [16].
In this study, the proposed architecture comprises of four deep-learning models, namely AlexNet, VGG-FaceNet, FlowImageNet, and ResNet, in addition to using the driver’s RGB video to identify drowsiness. The model also considers four distinct variables for implementation, such as head motions, facial expressions, hand gestures, and behavioral characteristics. Meanwhile, the AlexNet model was employed for various backdrop and environment variations such as indoor, outdoor, daytime, and nighttime variations. To extract face traits like ethnicity and gender, VGG-FaceNet was employed. For behavioral characteristics and head movements, FlowImageNet was employed and ResNet was used for hand gestures. The results from hand gesture detection are sufficiently precise. The model would then divide these characteristics into four categories: Awake, drowsy with blinking eyes, yawning, and dozing off. This model’s output would then be used to create an algorithm that will run the data through a SoftMax classifier, which would then provide a positive (sleepy) or negative result. This method has an accuracy rate of 85% [17].
Based on the problems above, this study formulates what parameters are used to determine the characteristics of sleepy guides and what models are appropriate to detect drowsiness. This paper is organized as follows: methodology, discussion, results, and conclusion.
The main goal of this study is to create an accident recognition framework for monitoring drowsy drivers by using convolutional neural network technology. Thus, an Accident Detection Framework (RPK) was designed to reduce the occurrence of road accidents due to sleepiness.
2.1 Drowsy Detection and Prediction Based on Facial Signs
The proposed visual system for the detection and prediction of driver drowsiness was designed by analyzing the state of the driver’s eyes, mouth, and head movement. To label the driver as sleepy or not sleepy, the proposed detection method consists of several stages, starting from image input, pre-processing, sleepy detection, feature recognition based on eyes, mouth, and head, then combining features to determine sleepy and non-sleepy labels.
Facial landmark detection is a computer vision task where the model has to predict critical points that represent areas or landmarks on the human face, eyes, nose, lips, etc. It is considered a fundamental task that can perform other computer vision tasks, including head pose estimation, gaze direction identification, facial gesture detection, and face switching. Fig. 1 is a standard face dataset. The 68 x and y coordinates indicate the most critical points on a person’s face. The locations of the facial markers are as follows: Jaw: 1–17; right eyebrow: 18–22; left eyebrow: 23–27; nose: 28–36; right eye: 37–42; left eye: 43–48; and mouth: 49–68.
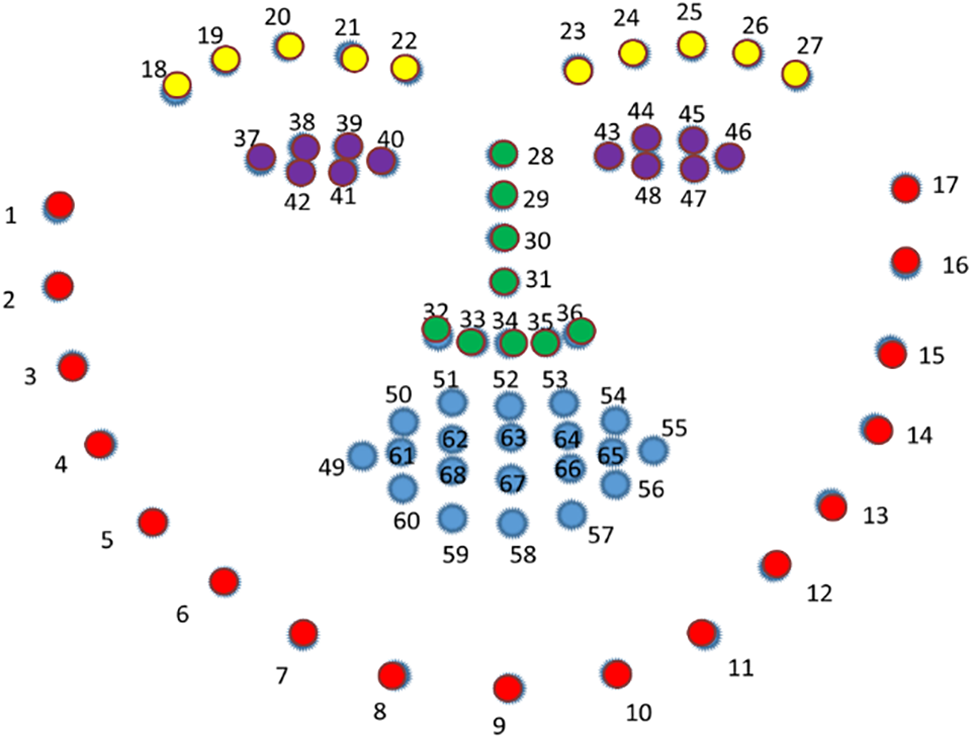
Figure 1: Illustration of 68 landmarks on the human face
2.3 Determination of Point Aspect Ratio for Each Driver
Of the 68 landmarks on the human face, 37 to 42 are the right eye’s coordinates. From that number, it could then be converted from A to F, as shown in Fig. 2 below.
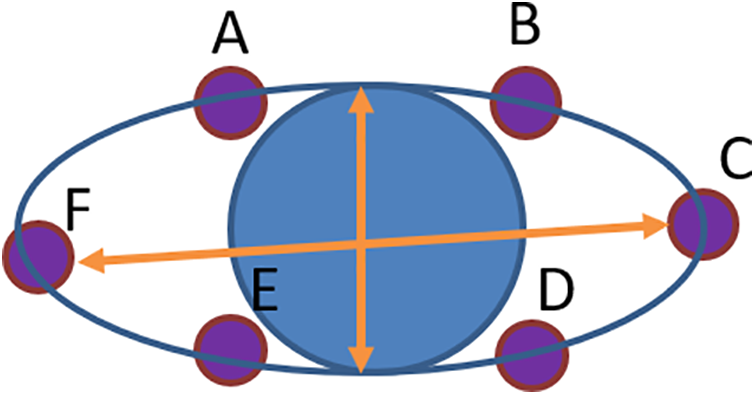
Figure 2: Six landmarks associated with eyes
The horizontal separations between points A, E, and B were calculated and the vertical separation between F and C were determined as well. The separations between these landmarks were determined by the equations shown below ((1)–(3)):
The distance between two landmarks for x and y is shown as Dx,y. Here, the coordinates of landmark A are shown as Ax, Ay. The locations of landmarks for A, B, C, D, E, and F were also discovered. After computing the horizontal and vertical distances, the distances between the ocular landmarks were determined. Then, the eye landmark distance for both eyes was determined by using Eq. (4).
L denotes the eye landmark distance. The left and right eyes’ eye landmark distances were then calculated. The length is l.l for the left eye and l.r for the right eye. The equation calculates this data’s average point landmark distance, L.
The difference between the mean distance of eye landmarks with open and closed eyes is seen in Fig. 2. The EAR threshold ranges from 0.20 to 0.41, with 0.20 being the minimum and 0.41 being the maximum amount [18].
2.4 Determination of Mouth Aspect Ratio for Each Driver
A wide-open mouth is a sign of yawning. Similar to how eye closure was detected, loose lips were determined by using facial landmarks. The person was identified as yawning if the lip distance derived from the frame was greater than the threshold. The positions of 2D face landmarks were indicated by the numbers 49 through 68. The number of yawns that will occur could be calculated by using these landmarks and the outcome of the mouth’s state, as shown in Fig. 3 below.
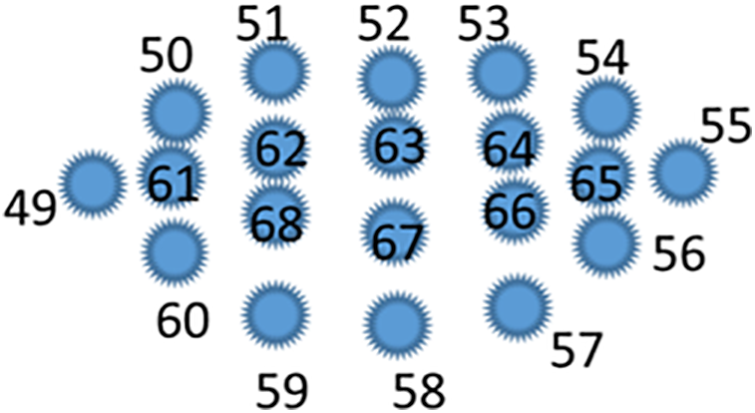
Figure 3: Mouth aspect ratio
If the subject yawns more than the predetermined limit, it would trigger a sound alert. The mouth’s horizontal and vertical distances were then computed by using the following equation:
There are 20 points on the MAR. The mouth part starts with the numbers 49 to 68. The mouth consists of the right (point 49) and left (point 55), the upper part is the points 50 to 54, and the bottom is the points 60 to 56. How the calculation of the upper mouth is subtracted from the lower part and then divided by the value of the mouth length from points 49 to 55. Under standard speaking settings, the mouth opening level varies between 0.4 and 0.5 but will be larger than 0.6 when the driver yawns, with a maximum level of roughly 1.2. The threshold value for mouth opening degree in this investigation was chosen at 0.6. Drivers are deemed fatigued when their maximum mouth opening level in 60 s surpasses 0.6, as described in Table 1.
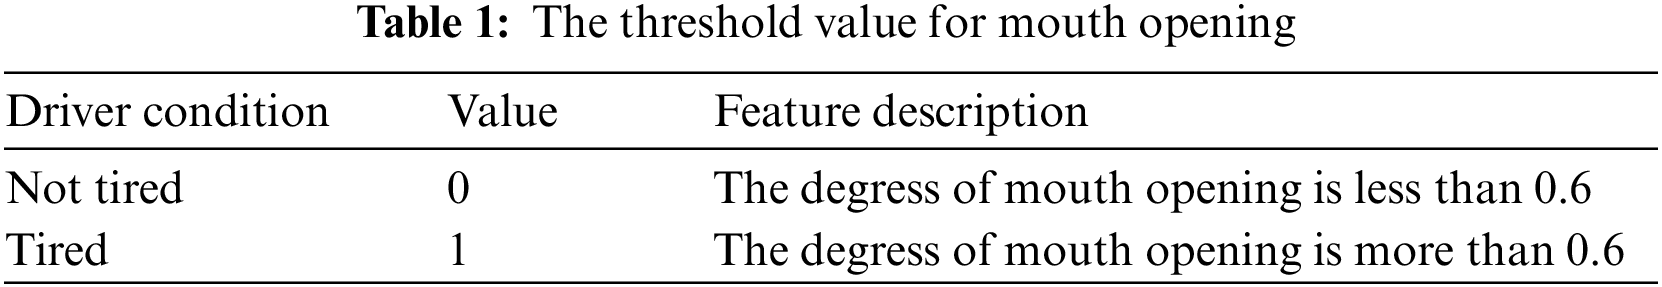
The threshold value for mouth opening degree in this investigation was chosen at 0.6. Drivers are deemed fatigued when their maximum mouth opening level in 60 s surpasses 0.6. The degree of mouth opening and eye condition were used in this study to identify the driver’s weariness. The categorization of tiredness and pre-classification was conducted throughout the data-collecting procedure based on the numbers.
2.5 Sleepy Detection and Prediction Based on Facial Signs
The suggested technique is based on an eye-opening threshold established for all motorists, which results in errors for motorists with large or small eyes. To solve this issue, the driver’s adaptive aperture threshold (EARThresh) was used to make determination easier. Fig. 4 displays the suggested method’s model.
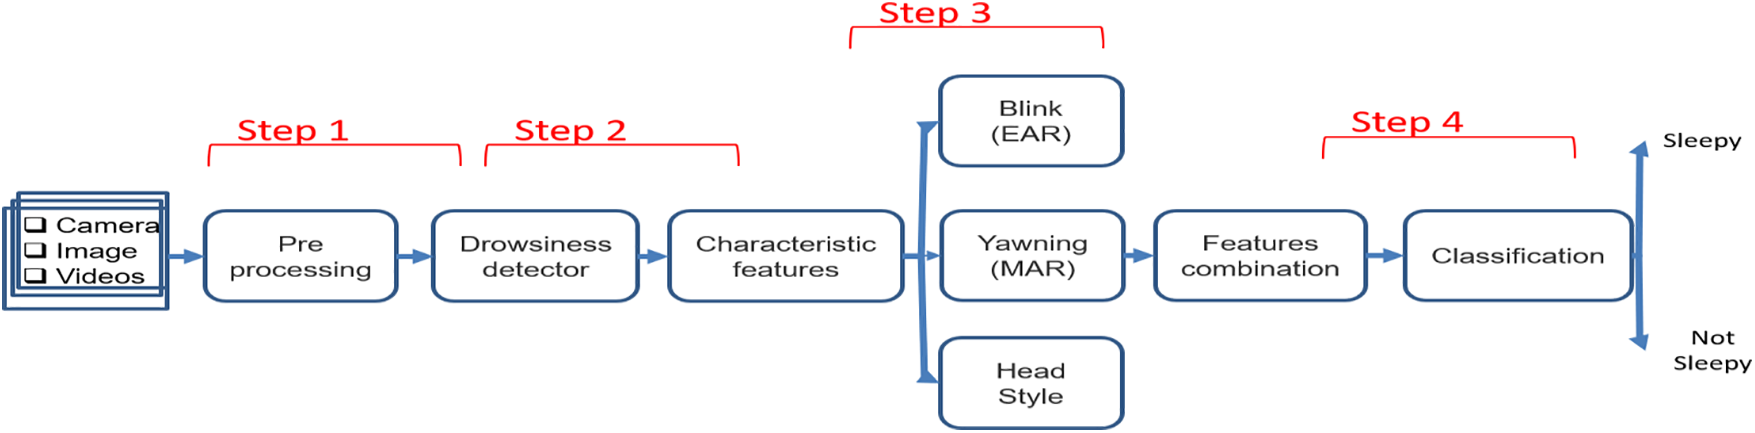
Figure 4: A proposed model to detect sleepiness by using facial landmarks
For each driver, the EAR and EARthresh values were first computed. Then, by contrasting EAR and EARthresh, the degree of the driver’s fatigue could be ascertained. This investigation would be routinely conducted while driving. This approach does not rely on frequency since it would be incorrect if the driver was talking or wearing a mask. The image dataset has 18,957 images of heads, eyes, and mouths. The colors and sizes of these photos vary. To perform the training and testing procedure, the images were preserved. The following is a description of the method employed in this study:
• Step 1. Pre-processing. Before entering the data, the packages used in data processing were installed, namely Keras, TensorFlow, and ImageDataGenerator. The Keras package is a deep learning library for data classification, and the TensorFlow package is a library for deep learning.
• Step 2. Face recognition. This step consists of identifying and detecting faces using facial landmarks from the image. These facial landmarks include the eyebrows, eyes, nose, mouth, and jaw.
• Step 3. Determination of each driver’s eye-opening threshold. In this step, 32 feature points based on the recognition of facial landmarks were used. Afterward, the locations of the mouth and eye points were determined.
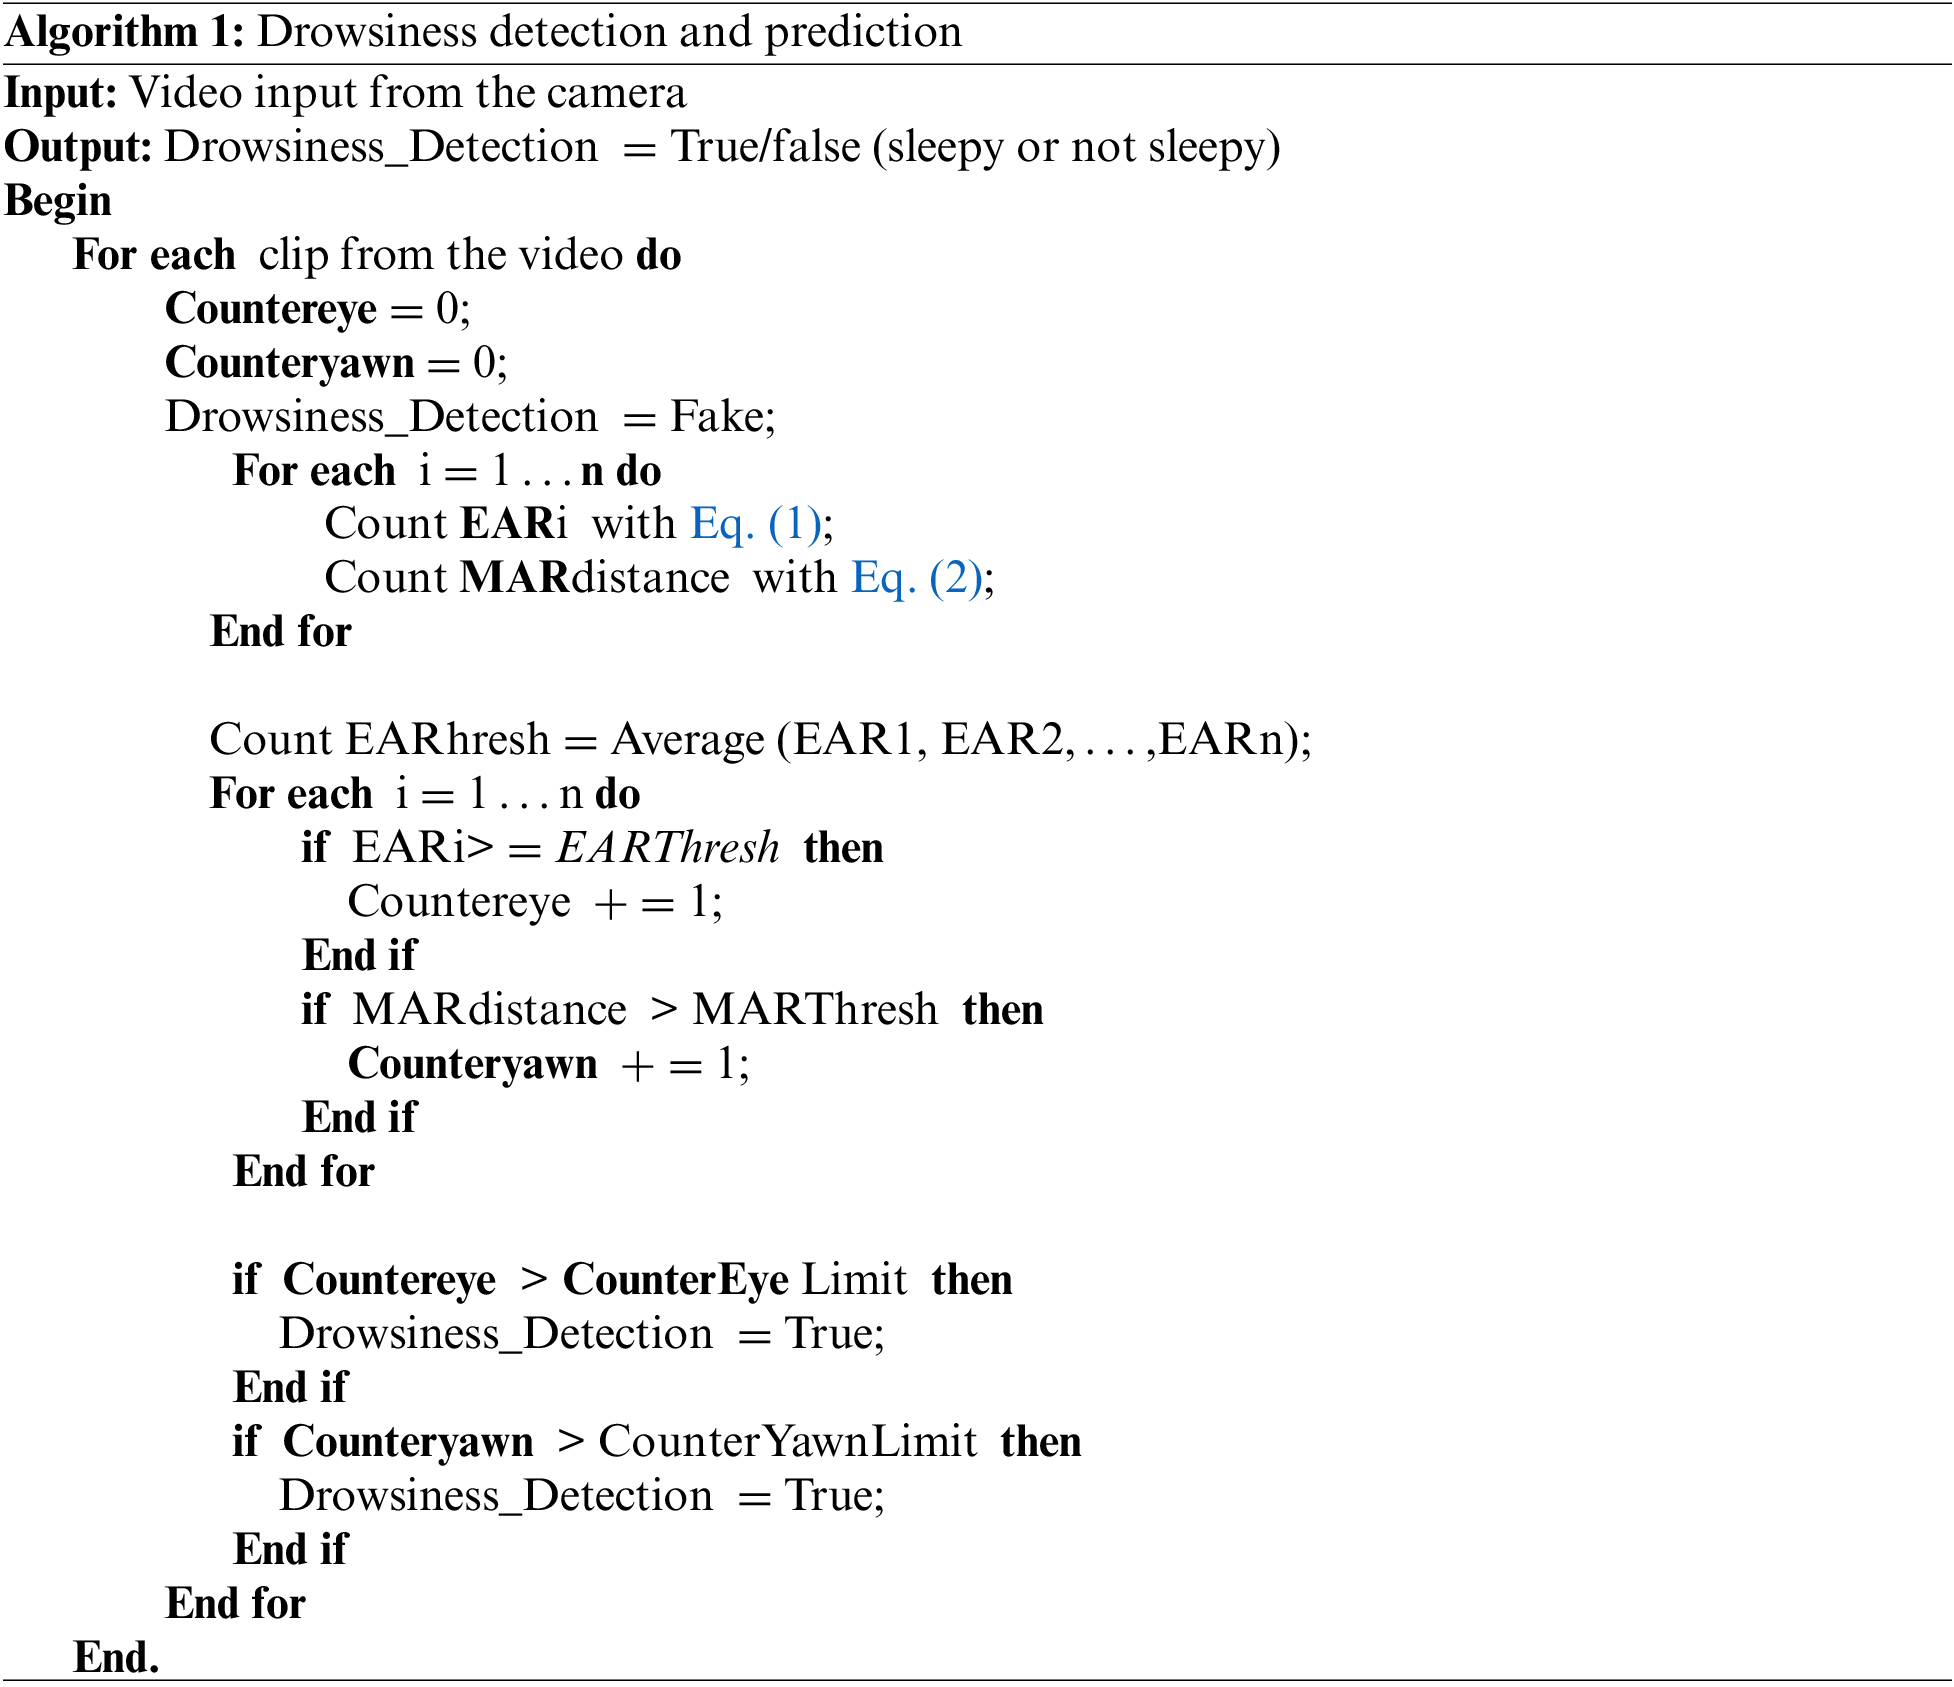
• Step 4. Detection and prediction of sleepy or not sleepy. The input data is the video frame from the camera on the vehicle. The video was divided into several clips with a duration of 300 s. After that, testing was conducted with many different values to achieve the recommended optimal values, such as CounterEyeLimit = 15 and CounterYawnLimit = 25. The stages for detecting them are presented in Algorithm 1.
2.6 Pre-Processing of Image Data
Image pre-processing is one of the steps taken for data sets to ensure that the machine training will run well. This step would then turn the data which were initially in the form of images into data in arrays so that the machine can learn it. Converting data into array form requires ImageDataGenerator() from the Keras library. Codes like horizontal_flip, vertical_flip, and height_shift_range as well as the ImageDataGenerator() function were used to change the image. The validation_split function was used to validate the training, and this validation_split splits the data from the dataset, and the dataset was divided into 80% for training and 20% for validation.
The datagen object is an ImageDataGenerator() object that has many functions and it processes the data before it is loaded. In this study, the rescaling function was used to change the scale of the image values. Therefore, when the image was processed, it would then be represented as a 3D array (sometimes called a Tensor) with values of between 0 to 255. The rescale parameter was given the value “1/255,” meaning that each value will be multiplied by 1/255. Thus, the value range will change between 0 and 1. This is intended to facilitate neural network learning.
2.7 Feature Extraction and Training
The training data set was transmitted via CNN for feature extraction. Two adaptive networks for drowsiness detection were then developed by enhancing various layers of this network. Next, an adaptive network was created by suppressing the AveragePooling2D layer and adding layers such as Flatten, Relu, Dropout, and Dense (Sigmoid). This seeks to address the overfitting issue and hasten model convergence. The inclusion of the Flatten, Two Relu, Dropout, and Dense layers also implies a different range of changes (Sigmoid).
The recommended network, a transfer learning technique, was first trained using the Bing Search API, Kaggle, and RMFD datasets. Trained weights were applied and they were retrained using the training data to modify the parameters of this network. As a result, learning happened more quickly, training took less time, and significant training datasets were unnecessary. When the loss value did not decrease during the training procedure, we opted to end the training phase.
Without putting the driver in danger, pictures and videos were captured by cameras for the driver’s sleepy state to compile an experimental dataset of drowsy and awake faces from diverse sources [19]. The efficacy, cost, security, and ease of data collection are the main advantages of this study. The collected pictures and videos of driving scenes resemble an actual road test. The dataset contains 5017 images with 874 open-eye images, 850 closed eyes images, 723 open-mouth images, and 725 closed-mouth images. Additionally, the data set contains 761 sleepy head images and 1084 non-sleepy head images. The dataset of 6448 pictures for method two was divided into 80% (4501) for training and 20% (498) for testing. The dataset directly influences the accuracy of sleepiness detection and prediction.
The Nvidia Geforce GPU, 12 GB of RAM, and Windows 10 Pro operating system setup were used to compare and assess the two suggested methods. TensorFlow v2.10.0 was used as the library for the training of the proposed network model. The recommended approach was tested when people yawned, closed their eyes, and remained still. To enhance accuracy during the experiment, the parameters were fine-tuned before achieving the ideal parameter values.
The first situation was to create a model for classification based on yawning. By using a sequential model, this classifier detected whether the mouth is yawning. The results of this model can be seen in Fig. 5 below.
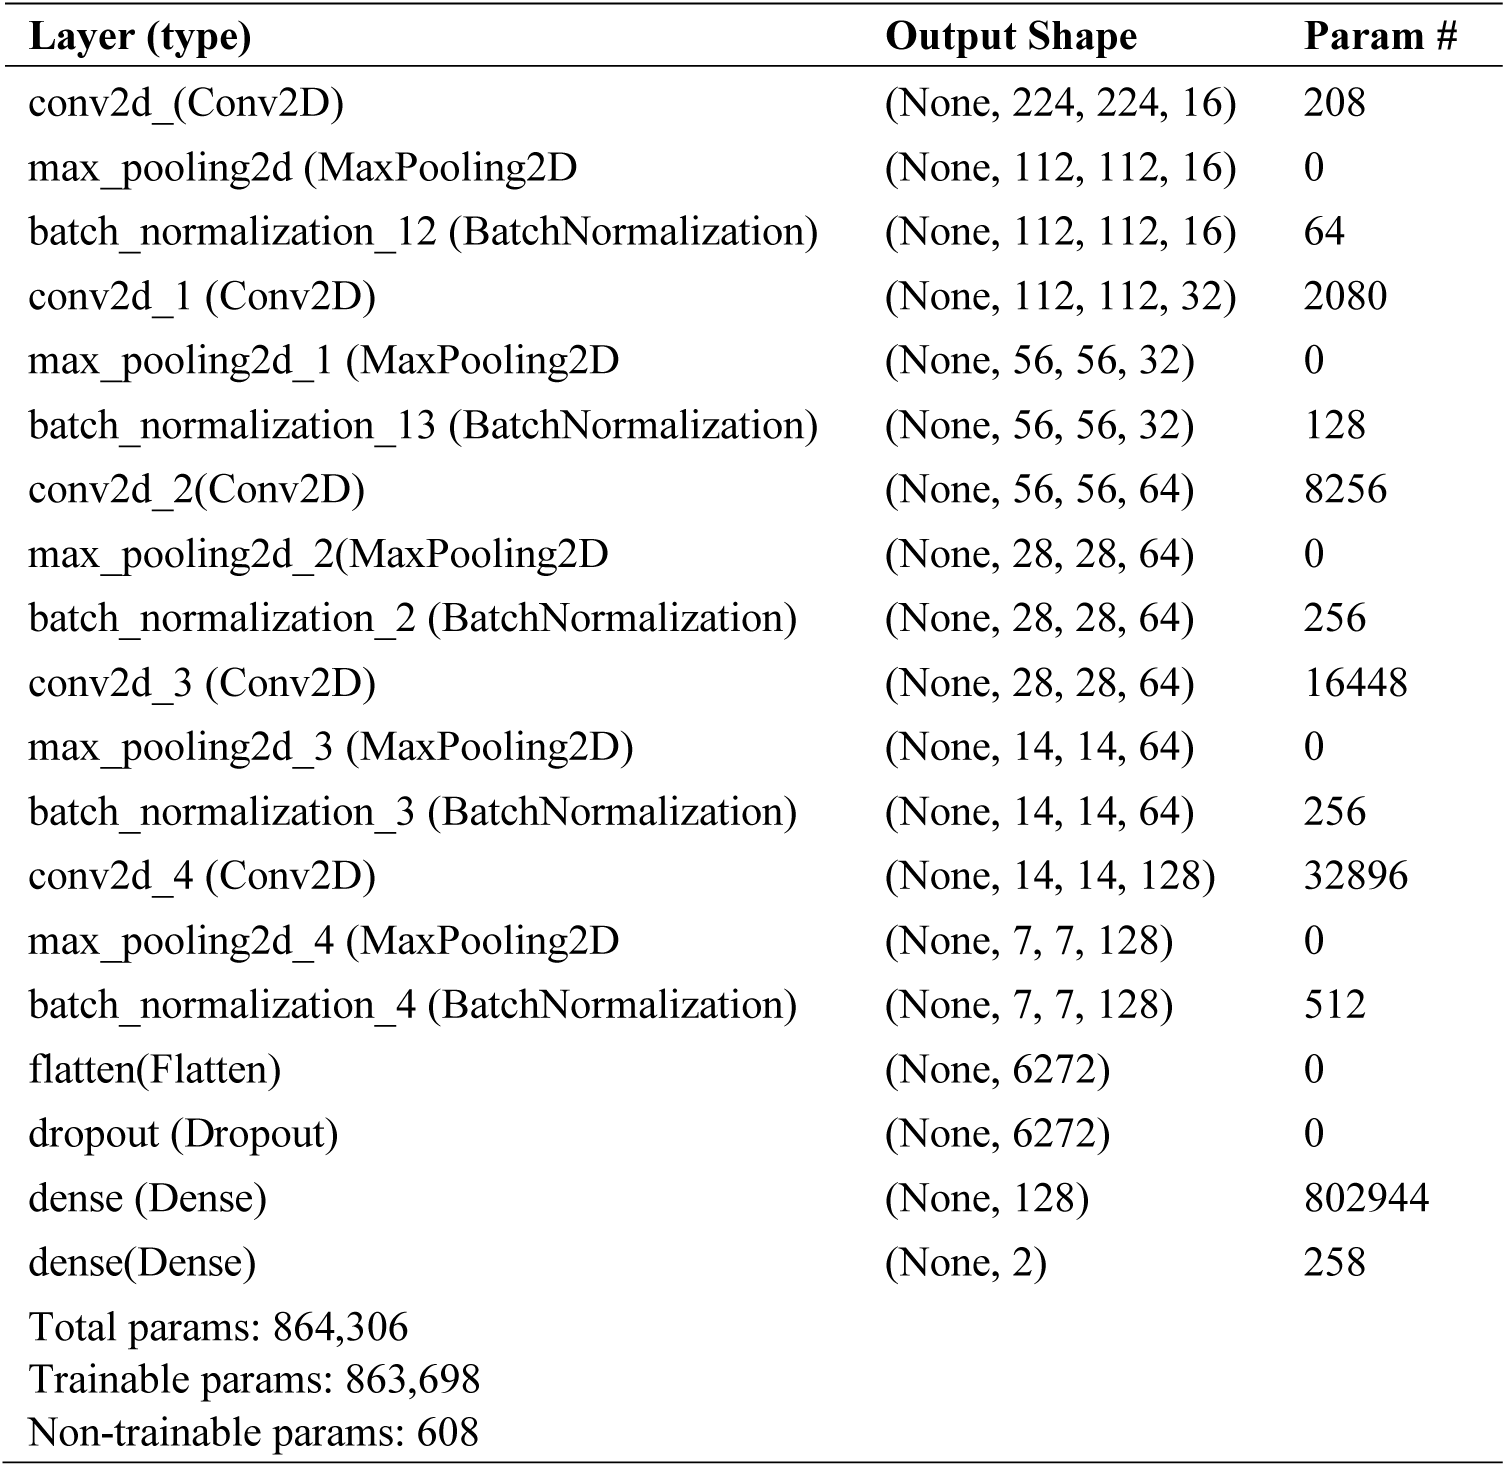
Figure 5: CNN model for yawning mouths
The next step was to create a model for the classification based on selected points. This classification would detect opened and closed eyes. The results of this model can be seen in Fig. 6 below.
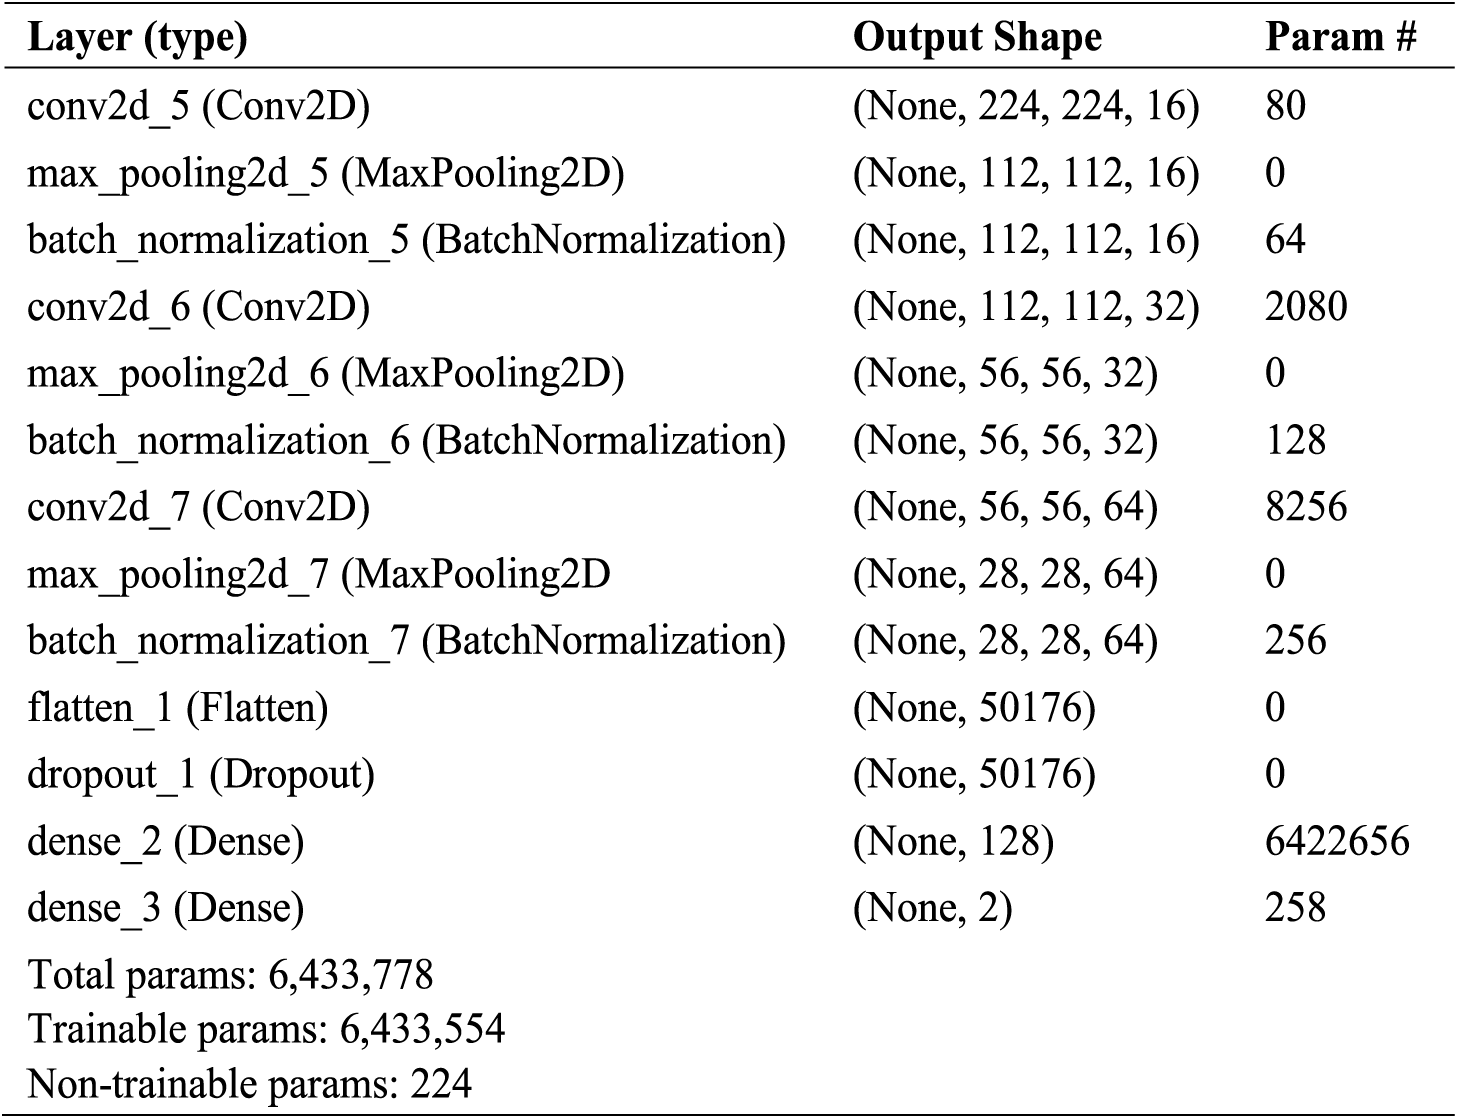
Figure 6: CNN model for open and closed eyes
A model was then created for head movement classification. This classification would detect whether the driver is keeping their head upright. The results of this model can be seen in Fig. 7 below.
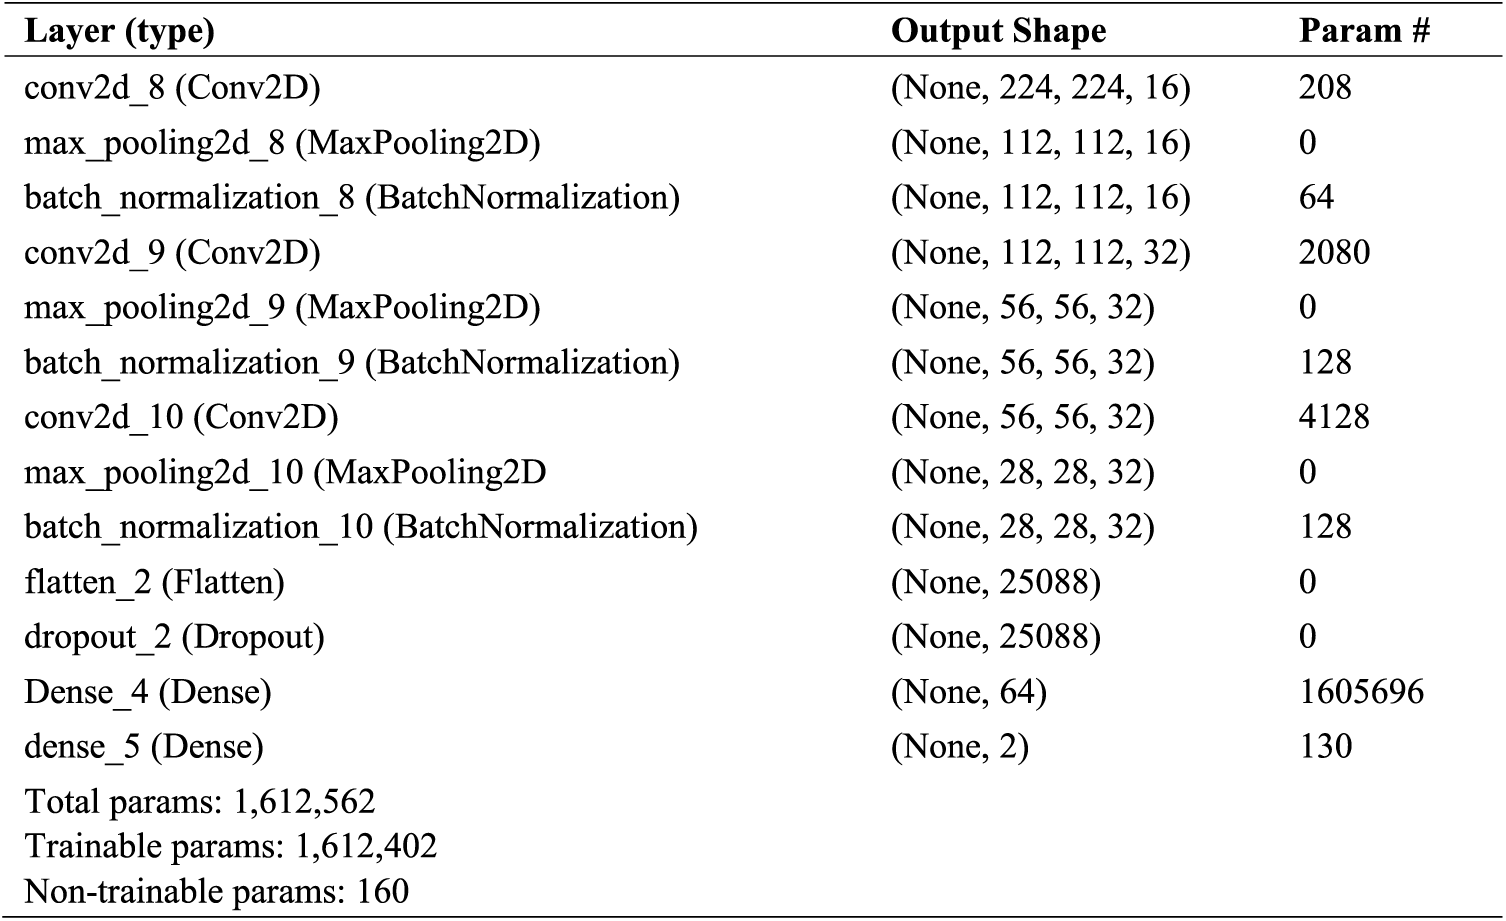
Figure 7: CNN model for head
The confusion matrix was used to assess the effectiveness of the network model for detecting drowsiness, as well as to compute the accuracy, loss value, and training time metrics. Loss is the value for the training loss function and was calculated from the training data set and predictions from the model. Accuracy depicts the accuracy of training and is the calculated value of the training data set’s accuracy and the model’s prediction. Validation loss is the calculated value of the loss function of the validation data set and prediction from the model with the input data from the validation data set. The validation accuracy is a value that is calculated from the validation data set and predictions from the model with input data from the validation data set. The X-axis represents the number of iterations, while the Y-axis on the loss graph will display the loss value at each iteration. An iteration is a training cycle in which the model sees all the training data once. When training begins, the number of iterations will start from 0 or 1.
Fig. 8 shows that the average loss during observation is approximately 0.050099, indicating that the model has a moderate error rate. The average accuracy during observation is around 0.980437, indicating that the model exhibits high accuracy on the training data.
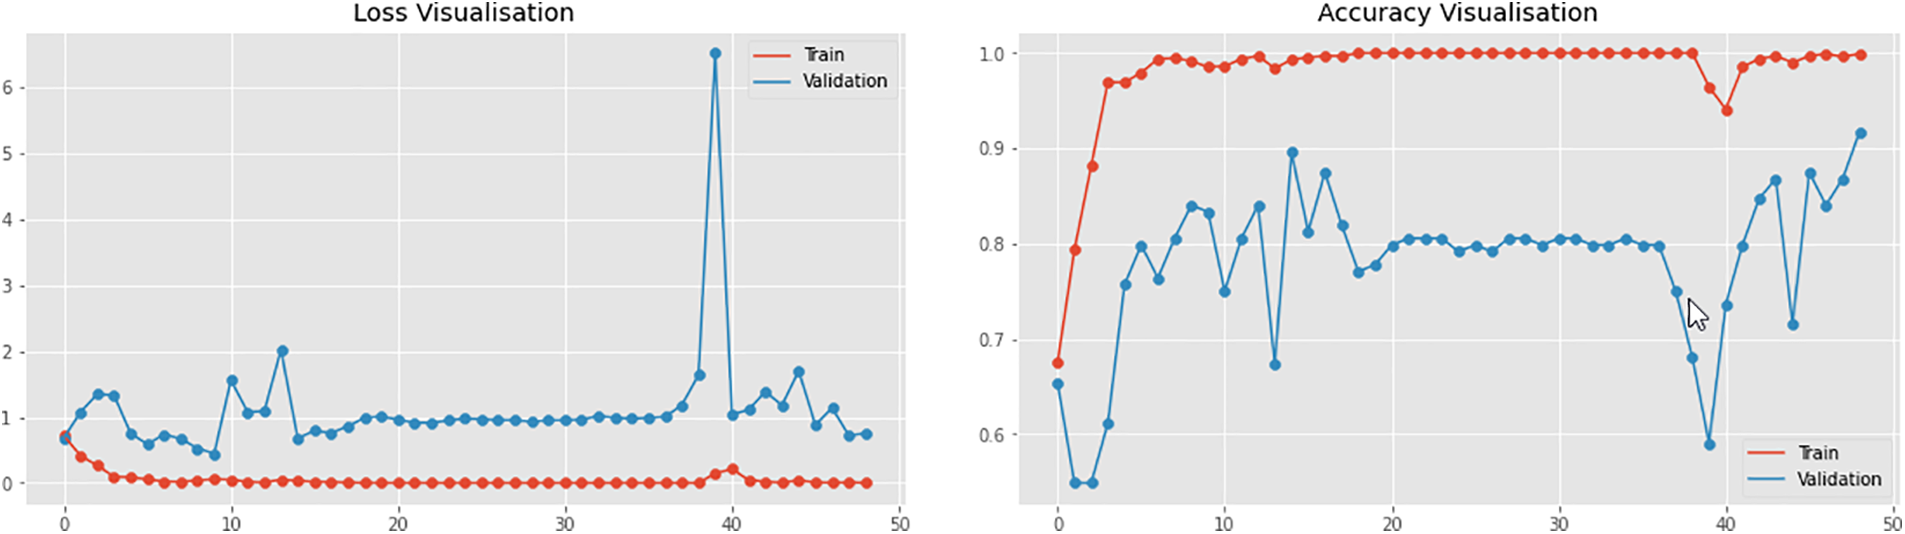
Figure 8: Accuracy and loss value chart for the mouth
Fig. 9 depicts that the average loss during observation is approximately 0.017369, indicating that the model tends to have a low error rate when predicting training data. The average accuracy during observation is around 0.997960, signifying that the model possesses a very high accuracy level on the training data. This signifies that the model can predict the training data well.
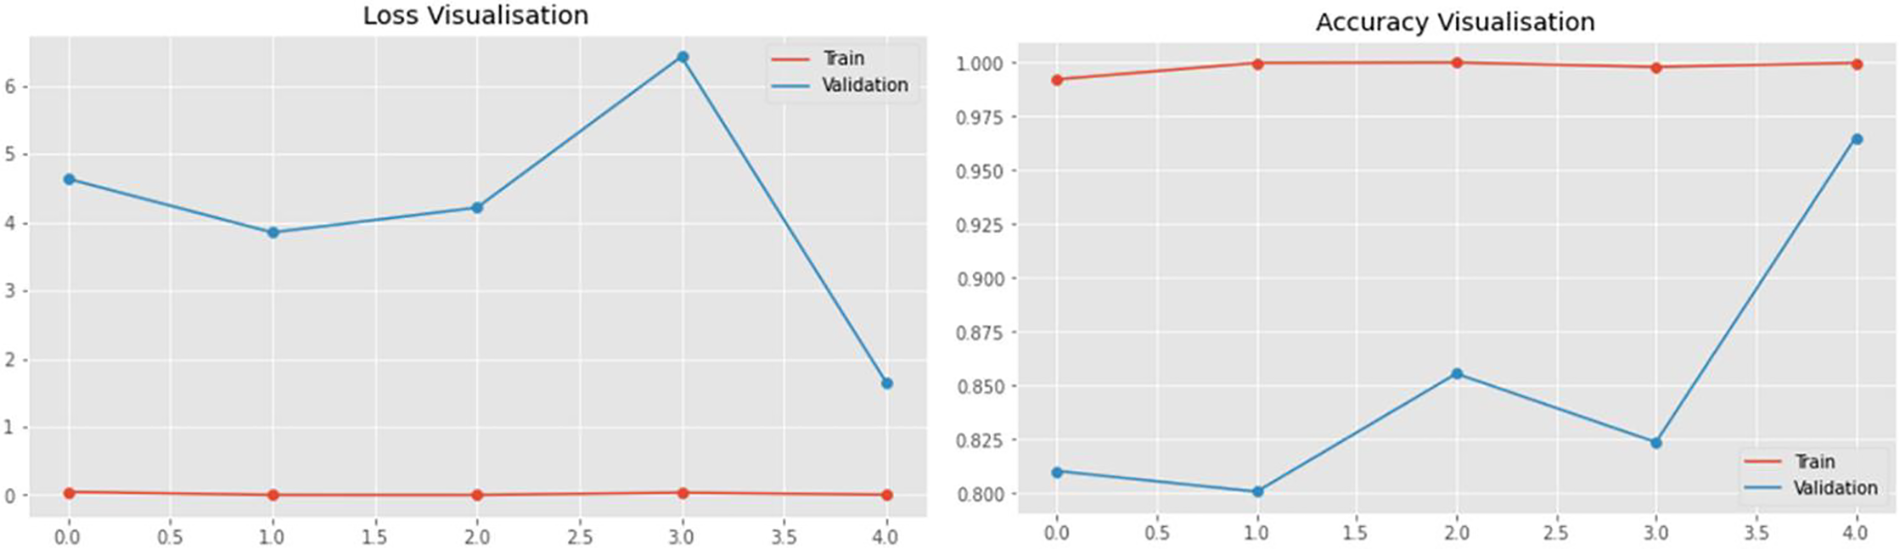
Figure 9: Accuracy and loss value chart for the head
Fig. 10 illustrates that the average loss during observation is approximately 0.154297, indicating that the model has a relatively low error rate. The average accuracy during observation hovers around 0.989213, showing that the model maintains a very high accuracy level on the training data.
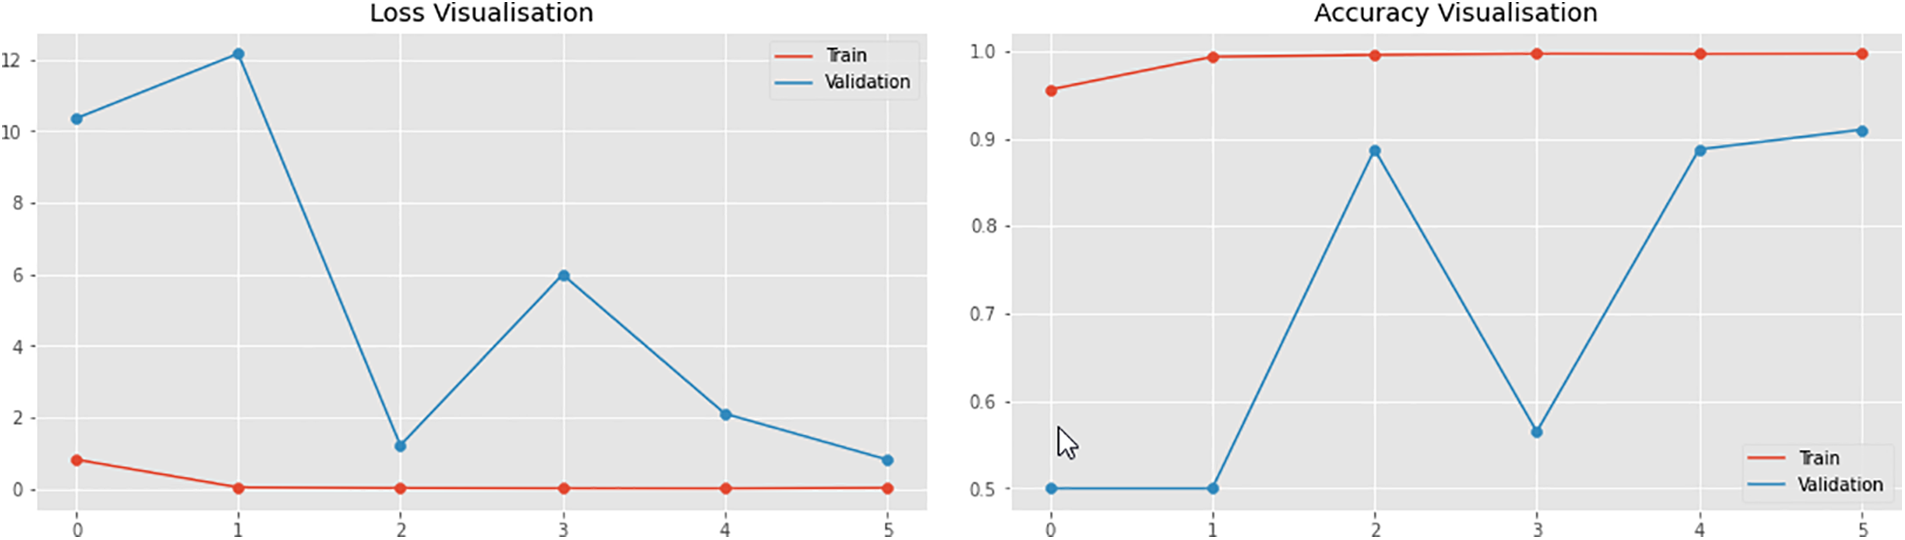
Figure 10: Accuracy and loss value chart for the eyes
The Confusion Matrix was used while running tests and assessments. The Recall value reflects the model’s success in locating information, while the F1-Score compares the average precision and weighted Recall. Precision describes the accuracy between the required data and the forecast outcomes produced by the model. The findings of the confusion matrix for mouth 96%, eyes 98%, and head 97%.
There were two different sets of experiments. The driver warning system was tested using Experiment Set 1 in various situations with the same driver, surroundings, and lighting conditions. A total of three problem sets were tested, namely normal driving, driving while wearing glasses, and driving while wearing a hat.
The prototype was tested with five different individuals in Experiment Set 2. This system has two basic categories of drivers: Those who use glasses and those who do not. To achieve consistent results, the drivers used the same vehicle and drove under identical lighting conditions.
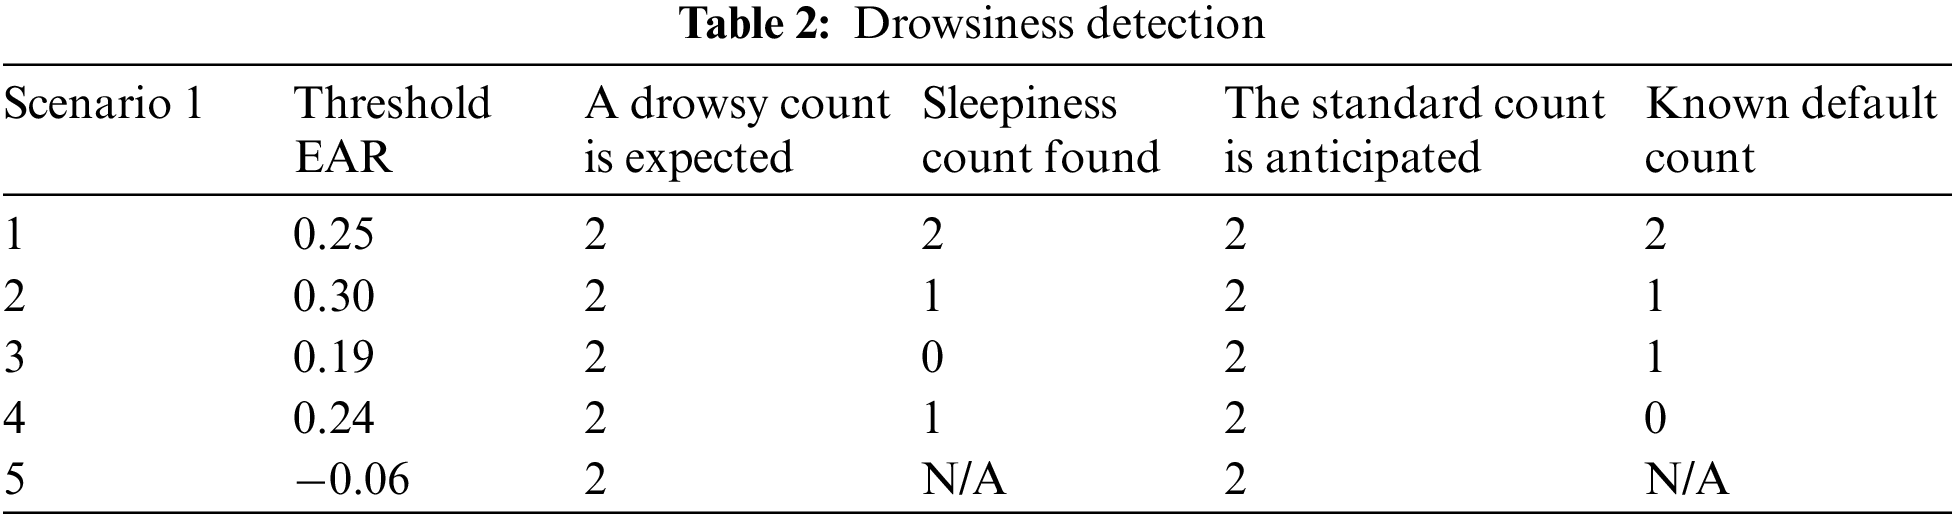
Table 2 contains the findings of Experiment Set 1. The default detection of tiredness in scenario number 1 occurred as anticipated. The results in scenario 2, when the driver wore glasses, were accurate experimental results that met one of two anticipated outcomes. When the driver wears glasses, the empirical findings of scenario 3 indicated that the system could not identify tiredness but performs better when detecting default behavior. Conversely, the experimental data for scenario 4 showed the reverse performance. Lastly, the threshold result for scenario 5 has the worst accuracy. There was a calibration phase mistake due to the face identification step’s failure to recognize facial landmarks, thereby making the sleepiness threshold a value of 0.06.
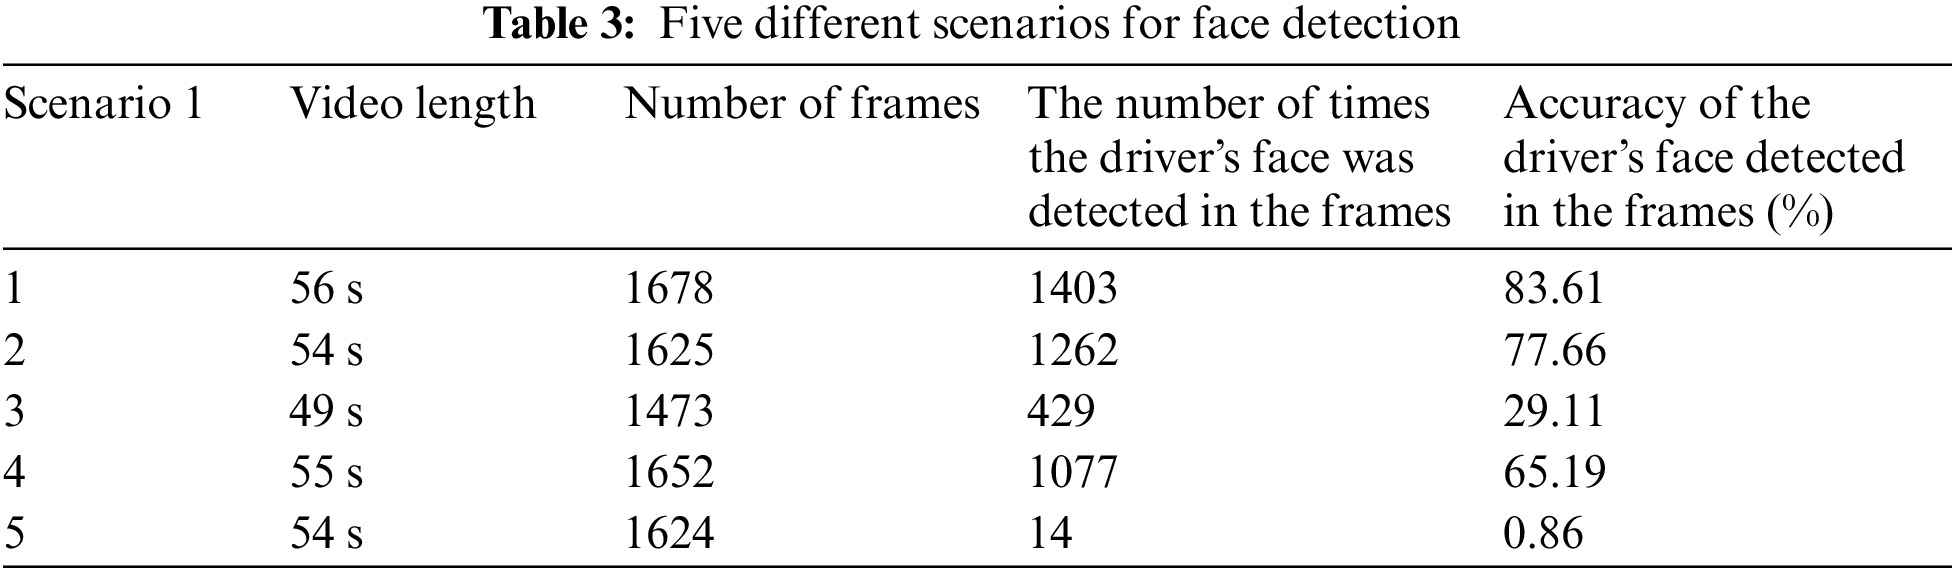
The face detection findings were then analyzed in more detail as it might impact detection precision. As shown in Table 3, scenario 1 has a success rate of 83.61% and has the most significant proportion of frames with the driver’s face identified at roughly 83.61%. Scenario 2 follows with a success rate of 77.66% and approximately 29.11% of the frames in scenario 3 contain the driver’s face. Whereas scenario 4 achieved a success rate of 65.19%. However, only 12 out of 1624 frames, or around 0.86%, of number 5 contain the driver’s face.
The experimental results for different sleepiness thresholds were recorded. The results for driver warning systems regarding drowsy and inattentive detection results are as follows:
• A True Positive (TP) result indicates that an alarm was triggered when drowsiness or an inattentive state was detected.
• A False Positive (FP) occurs when an alarm is triggered when no signs of drowsiness or a default state are detected.
• A True Negative (TN) occurs when an alarm is turned off when the system detects that the driver does not show any drowsiness or inattention.
• A False Negative (FN) result indicates that the alarm was not triggered even though signs of drowsiness or a default state were detected.
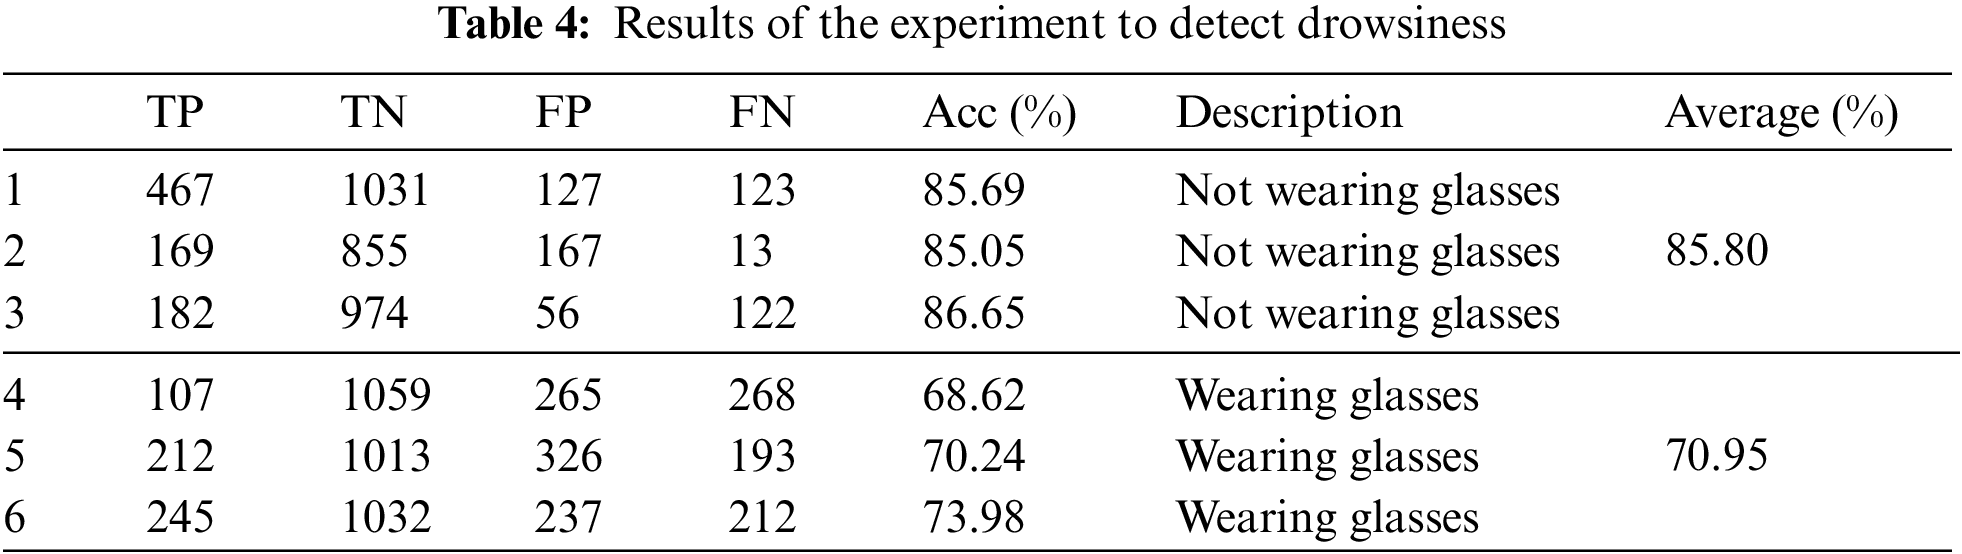
The performance of the driver’s warning system is reported in the following section. The Experiment Set 2 was conducted to test the sleepiness detection system for drivers using and not wearing glasses. The tiredness detection of drivers without glasses had an excellent accuracy rate of 85.80%, which is higher than the average for those using glasses. The outcomes are shown in Table 4.
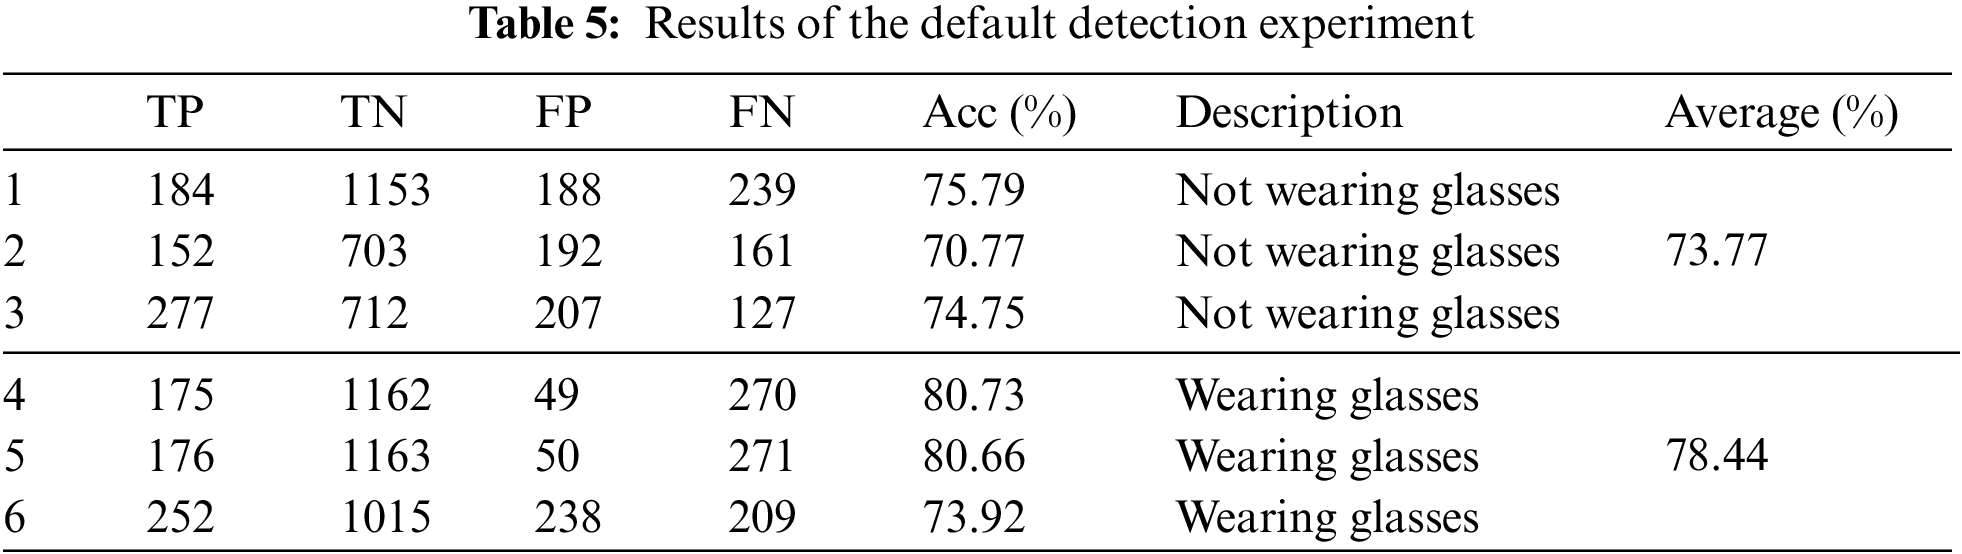
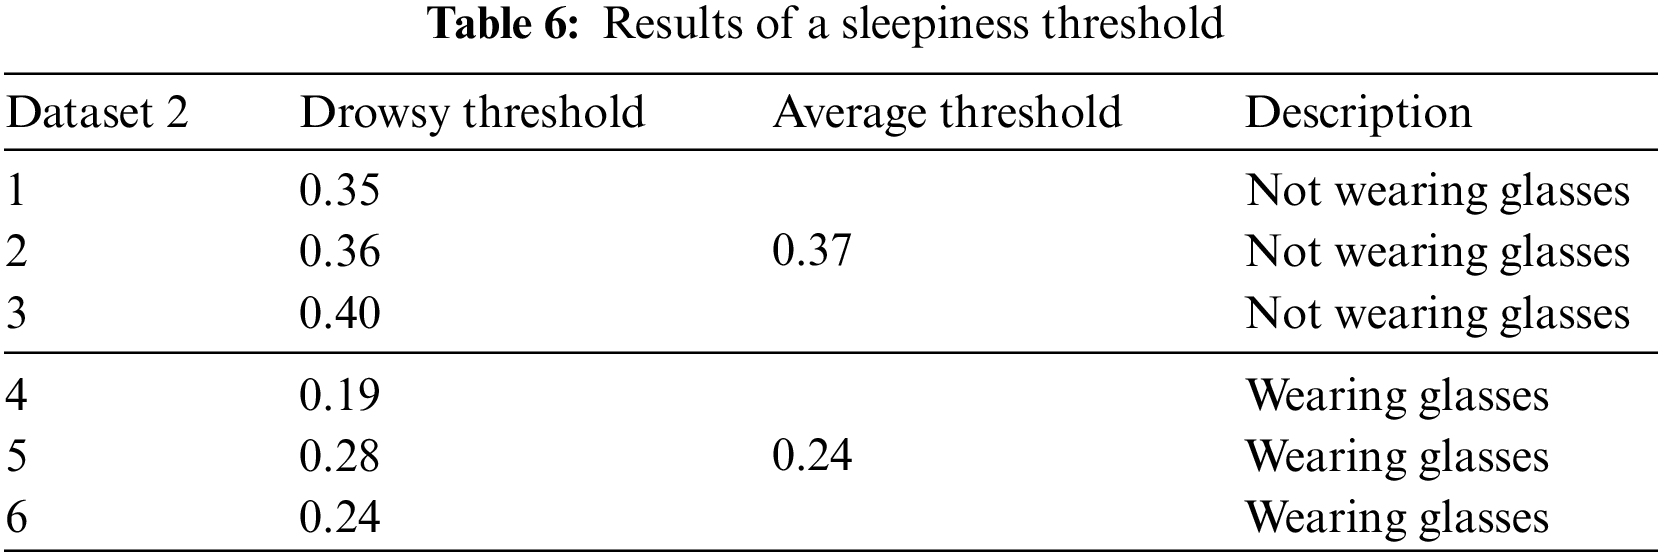
According to Table 5, drivers without glasses have a default detection accuracy of 73.77%, whereas those who use glasses have a default detection accuracy of an average of 78.44%. The sleepiness threshold values for each candidate from the second dataset are listed in Table 6. Those without glasses have a substantially greater drowsiness threshold than candidates who use glasses. The reflection of the lights from the driver’s spectacles may affect the threshold value for the candidate’s eye size (when wearing glasses) and may be to blame for the false negative detection. This is because the system will generate incorrect sleepiness threshold values due to the inaccurate driver eye size measurement.
To determine the accuracy of the distance estimate generated by the system, a measurement comparison between the actual measurement and the estimated result shown by the system was conducted. To do so, tests were performed to compare the exact distance of the objects measured manually with the actual distance. The results shown in this system indicate that measuring various distances between 600–900 mm results in an accuracy of 96.2%. The highest accuracy in measurement with a length of 600 mm is 97.2%.
Fig. 11 exhibits the distance between the camera and the driver while in the vehicle. Fig. 12 is a framework for detecting drowsiness which consists of several components such as the Raspberry Pi microprocessor, camera module, LCD, and speakers. These components are connected to the IoT Cloud Gateway to be monitored by operators or administrators.
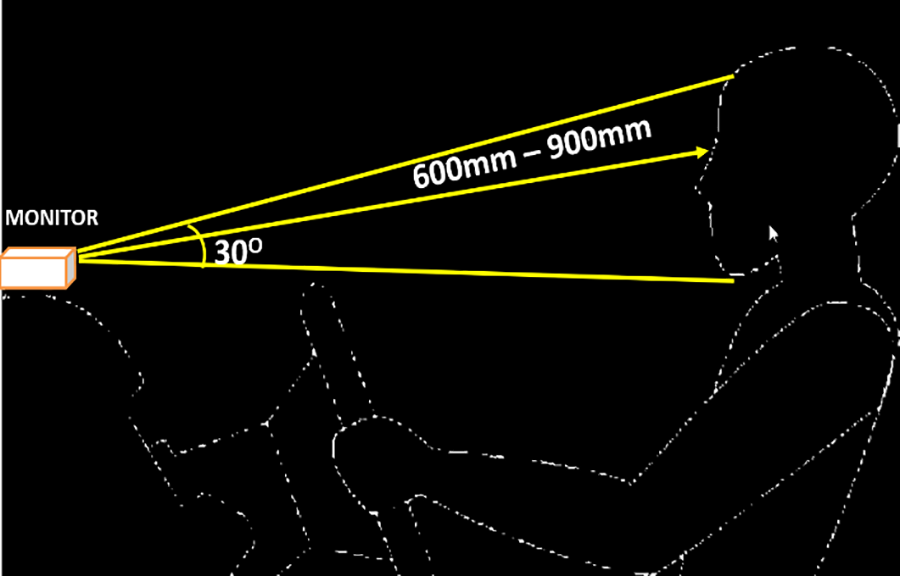
Figure 11: The ideal distance between the driver and the camera
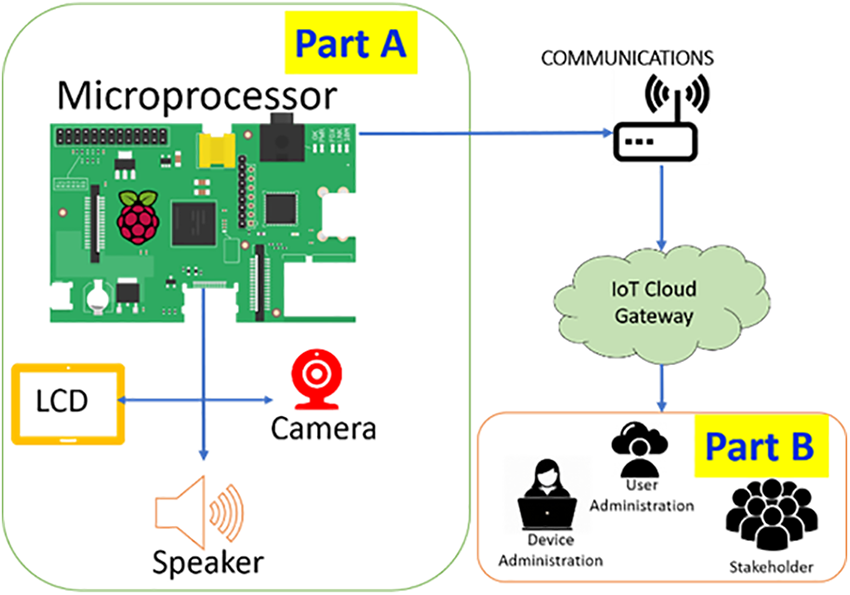
Figure 12: Framework for detecting drowsiness
4 Comparison of Drowsiness Detection
A comparison of the effectiveness of sleepiness-detecting techniques is shown in Table 7. The accuracy of the methods examined ranged from 83% to 97.1%, whereas the accuracy of this study’s proposed method is 97%. Most earlier methodologies concentrated on examining the mouth and ocular regions to find blinks and yawns. They employed the Haar cascade classifier to identify facial landmarks and predict tiredness. However, the traditional method, which estimates eye and mouth conditions using hand-engineered characteristics, has numerous shortcomings concerning drowsiness detection.
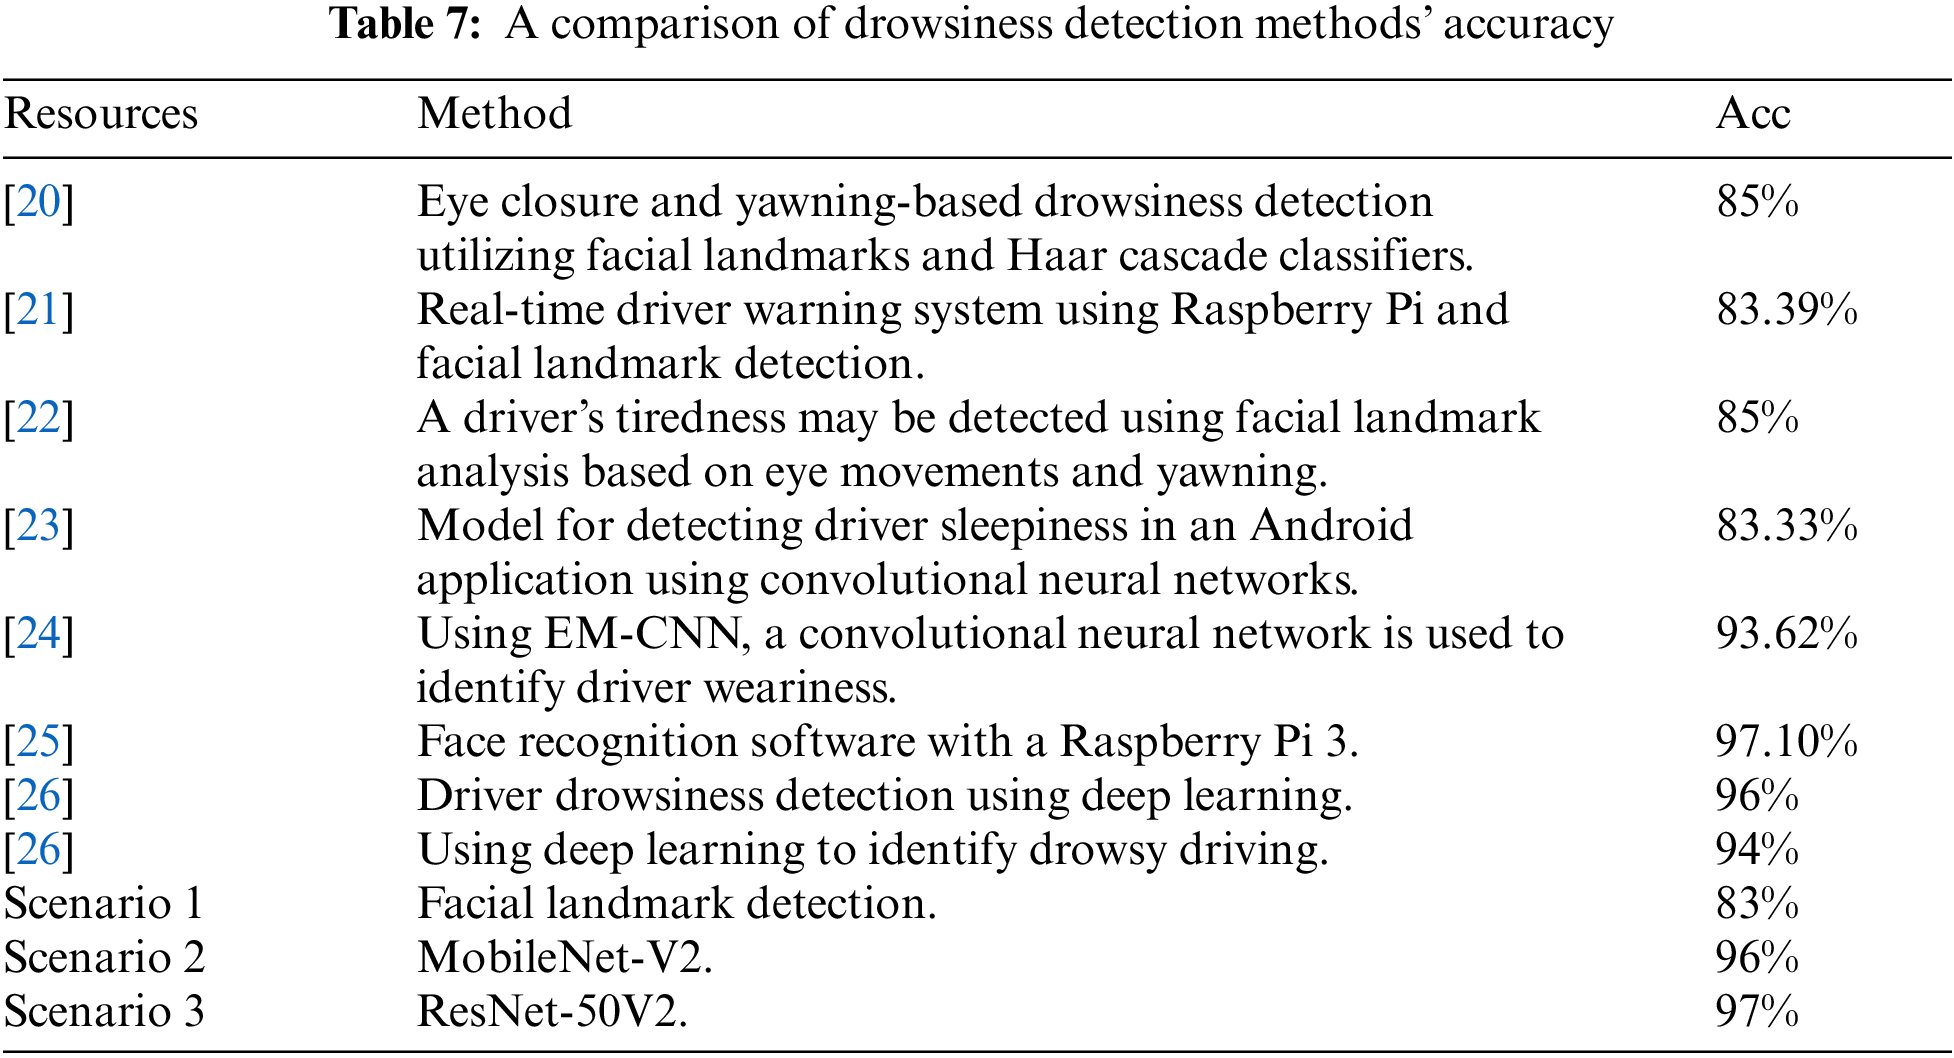
Furthermore, parameter tweaking is necessary for Haar cascade classifiers when employed for detection since they are prone to false positive detection. This is because it only considers the two primary aspects of blinking and yawning for tiredness identification. Although this approach obtains an accuracy of 96%–97.1% in trials, it has several limitations in real-world applications. Moreover, different blink and yawn time thresholds would need to be specified for each driver to identify their tiredness level. Additionally, fatigue is a physiological phenomenon that occurs naturally in people due to various disorder-causing variables. Thus, predicting tiredness just by blinking and yawning is inaccurate. Other indications of head and eye movements and physiological traits should be considered to develop more precise predictions. For a more accurate detection, an effective technique that combines deep learning with two neural networks constructed as an extension of MobileNet-V2 and ResNet-50V2 could be used.
The sleepy driver warning system used in this study was created using facial landmark approaches. The training outcomes in the three recommended situations, 1, 2, and 3, have an accuracy of 83%, 96%, and 97%, respectively (Table 7).
Scenario 2 has superior outcomes in terms of accuracy and loss value. However, scenario 2 requires more training time. Thus, we may conclude that scenarios 2 and 3 deliver exceptional products compared to scenario 1. The suggested approach with scenario 1 has the great benefit of producing quick results. However, when the driver is not gazing at the camera when the system is initially configured, the technique’s estimation of the eye-opening threshold is unreliable. Additionally, forecasts based exclusively on eye movements are incorrect because the system becomes confused if the drivers blink too frequently or open their eyes too little.
Additionally, choosing an input threshold that influences how well a prediction is made prevents sleep from being detected as failing. It is challenging for scenario 1 to deliver reliable findings if the driver shuts his eyes but is not sleepy. Overall, blinking and yawning are not reliable enough indicators of sleepiness. Therefore, for a more precise forecast other indications of head and eye movements (head tilt, inability to maintain a straight posture) need to be considered. This was done in scenarios 2 and 3.
The results of this study produced a new data set for the classification of drowsy drivers with as many as 5017 images. An Accident Location Detection Framework (PLK) that occurs in real-time based on the Internet of Things (IoT) was designed, along with the development of a Drowsiness Detector Model (PPM) by using a convolutional neural network based on three detection parameters, namely yawning, closing the eyes (blinking), and keeping the head upright.
The efficiency of the suggested strategy was examined by using the experimental findings. The findings demonstrate that the proposed method can use deep learning to attain a high accuracy of 97%. This study showed the method’s viability and adaptability for the creation of apps for doze alert warning systems, particularly mobile applications. Furthermore, the findings of this study have contributed to the prevention of automotive accidents brought on by drivers who fall asleep while operating a vehicle. However, further studies should focus on real-time or almost real-time operation systems as the primary need for sleepiness detection.
Acknowledgement: The authors gratefully acknowledge the Faculty of Information Science and Technology, Universiti Kebangsaan Malaysia for the fund provided under the Research Grant “An Intelligent 4IR Mobile Technology for Express Bus Safety System Scheme DCP-2017-020/2” to carry out this research.
Funding Statement: The Faculty of Information Science and Technology, Universiti Kebangsaan Malaysia, provided funding for this research through the Research Grant “An Intelligent 4IR Mobile Technology for Express Bus Safety System Scheme DCP-2017-020/2”.
Author Contributions: Conceptualization, M.I., R.H., M.K.H. and M.C.L.; methodology, M.I. and R.H.; validation, A.H.I., M.K.H. and M.C.L.; writing original draft preparation, M.I., R.H. and M.K.H.; writing review and editing, A.H.I. and W.M.H.W.H. visualization, M.I.; supervision, R.H., M.K.H. and M.C.L.; funding acquisition, W.M.H.W.H., M.K.H. and A.H.I. All authors have read and agreed to the published version of the manuscript.
Availability of Data and Materials: The data that support the findings of this study are available from the corresponding author, M.I., upon reasonable request.
Conflicts of Interest: The authors declare that they have no conflicts of interest to report regarding the present study.
References
1. A. Amodio, M. Ermidoro, D. Maggi, S. Formentin, and S. M. Savaresi, “Automatic detection of driver impairment based on pupillary light reflex,” IEEE Trans. Intell. Transp. Syst., vol. 20, no. 8, 2019. doi: 10.1109/TITS.2018.2871262. [Google Scholar] [CrossRef]
2. X. Li, X. Lian, and F. Liu, “Rear-end road crash characteristics analysis based on chinese in-depth crash study data,” in Proc. 16th COTA Int. Conf. Transport. Profess., pp. 1536–1545, 2016. doi: 10.1061/9780784479896.140. [Google Scholar] [CrossRef]
3. F. Chen and S. Chen, “Injury severities of truck drivers in single- and multi-vehicle accidents on rural highways,” Accid. Anal. Prev., vol. 43, no. 5, 2011. doi: 10.1016/j.aap.2011.03.026 [Google Scholar] [PubMed] [CrossRef]
4. Z. Ahmad et al., “Anomaly detection using deep neural network for iot architecture,” Appl. Sci., vol. 11, no. 15, 2021. doi: 10.3390/app11157050. [Google Scholar] [CrossRef]
5. J. P. Tuohy, “Google says Matter is still set to fix the biggest smart home frustrations,” 2022. Accessed: May 11, 2022. [Online]. Available: https://www.theverge.com/23065031/matter-google-nest-smart-home-michele-turner-interview [Google Scholar]
6. M. Irsan et al., “A novel prototype for safe driving using embedded smart box system,” Sensors, vol. 22, no. 5, 2022. doi: 10.3390/s22051907 [Google Scholar] [PubMed] [CrossRef]
7. S. ST et al., “Deep learning model for deep fake face recognition and detection,” PeerJ Comput. Sci., vol. 8, pp. e881, Feb. 2022. doi: 10.7717/peerj-cs.881 [Google Scholar] [PubMed] [CrossRef]
8. F. Bonafini, S. Rinaldi, A. Depari, A. Flammini, P. Ferrari, and E. Sisinni, “Cluster of IoT sensors for smart cities : Impact of the communication infrastructure over computational performance,” in 2019 IEEE Sensors Appl. Symp., 2019, pp. 1–6. [Google Scholar]
9. A. Sameer Sadeq et al., “MAC protocol with grouping awareness GMAC for large scale Internet-of-Things network,” PeerJ Comput. Sci., vol. 7, pp. e733, Nov. 2021. doi: 10.7717/peerj-cs.733 [Google Scholar] [PubMed] [CrossRef]
10. S. Goudarzi, M. H. Anisi, S. A. Soleymani, M. Ayob, and S. Zeadally, “An IoT-based prediction technique for efficient energy consumption in buildings,” IEEE Trans. Green Commun. Netw., vol. 5, no. 4, pp. 2076–2088, 2021. doi: 10.1109/TGCN.2021.3091388. [Google Scholar] [CrossRef]
11. World Health Organization, “Global status report on road safety 2018,” 2018. Accessed: Jun. 17, 2018. [Online]. Available: https://www.who.int/violence_injury_prevention/road_safety_status/2018/en/ [Google Scholar]
12. N. S. Darus et al., “The effect of physical environment risk factors on vehicle collisions severity involving child-pedestrians in Malaysia,” SAGE Open, vol. 12, no. 1, 2022. doi: 10.1177/21582440211068494. [Google Scholar] [CrossRef]
13. S. Tanvir, N. Z. Habib, and G. H. Walker, “A qualitative investigation of professional driver behavior due to socio-economic, cultural, religious factors and its impact on Dubai road safety,” Adv. Intell. Syst. and Comput., pp. 339–350, 2019. doi: 10.1007/978-3-319-93885-1_70. [Google Scholar] [CrossRef]
14. A. Malafeev, A. Hertig-Godeschalk, D. R. Schreier, J. Skorucak, J. Mathis, and P. Achermann, “Automatic detection of microsleep episodes with deep learning,” Front. Neurosci., vol. 15, pp. 564098, 2021. doi: 10.3389/fnins.2021.564098 [Google Scholar] [PubMed] [CrossRef]
15. C. Jacobé de Naurois, C. Bourdin, A. Stratulat, E. Diaz, and J. L. Vercher, “Detection and prediction of driver drowsiness using artificial neural network models,” Accid Anal. Prev., vol. 126, pp. 95–104, 2019. doi: 10.1016/j.aap.2017.11.038 [Google Scholar] [PubMed] [CrossRef]
16. V. R. Reddy Chirra, S. R. Uyyala, and V. K. Kishore Kolli, “Deep CNN: A machine learning approach for driver drowsiness detection based on eye state,” Rev. D’Intelligence Artif., vol. 33, no. 6, pp. 461–466, 2019. doi: 10.18280/ria.330609. [Google Scholar] [CrossRef]
17. M. Dua, Shakshi, R. Singla, S. Raj, and A. Jangra, “Deep CNN models-based ensemble approach to driver drowsiness detection,” Neural Comput. Appl., vol. 33, no. 8, pp. 3155–3168, 2021. doi: 10.1007/s00521-020-05209-7. [Google Scholar] [CrossRef]
18. N. T. B. Pasaribu, Ratnadewi, A. Prijono, R. P. Adhie, and J. F. Hermawan, “Drowsiness detection system design based on individual driver,” AIP Conf. Proc., vol. 2097, pp. 030104, 2019. doi: 10.1063/1.5098279. [Google Scholar] [CrossRef]
19. I. Nasri, M. Karrouchi, H. Snoussi, K. Kassmi, and A. Messaoudi, “Detection and prediction of driver drowsiness for the prevention of road accidents using deep neural networks techniques,” Lecture Notes Elect. Eng., vol. 745, 2022. doi: 10.1007/978-981-33-6893-4_6. [Google Scholar] [CrossRef]
20. C. M. S. R. B. Mohana, “Drowsiness detection based on eye closure and yawning detection,” Int. J. Recent Technol. Eng., vol. 8, no. 4, 2019. doi: 10.35940/ijrte.d9716.118419. [Google Scholar] [CrossRef]
21. J. Y. Wong and P. Y. Lau, “Real-time driver alert system using Raspberry Pi,” ECTI Trans. Electr. Eng. Electron. Commun., vol. 17, no. 2, pp. 193–203, 2019. [Google Scholar]
22. A. L. A. Ramos, J. C. Erandio, E. M. Enteria, N. Del Carmen, L. J. Enriquez, and D. H. Mangilaya, “Driver drowsiness detection based on eye movement and yawning using facial landmark analysis,” Int. J. Simul. Syst. Sci. Technol., 2019. doi: 10.5013/ijssst.a.20.s2.37. [Google Scholar] [CrossRef]
23. R. Jabbar, M. Shinoy, M. Kharbeche, K. Al-Khalifa, M. Krichen, and K. Barkaoui, “Driver drowsiness detection model using convolutional neural networks techniques for android application,” in 2020 IEEE Int. Conf. Inform., IoT, Enabling Technol. (ICIoT), Doha, Qatar, 2020, pp. 237–242. doi: 10.1109/ICIoT48696.2020.9089484. [Google Scholar] [CrossRef]
24. Z. Zhao, N. Zhou, L. Zhang, H. Yan, Y. Xu, and Z. Zhang, “Driver fatigue detection based on convolutional neural networks using EM-CNN,” Comput. Intell. Neurosci., vol. 2020, no. 3, 2020. doi: 10.1155/2020/7251280 [Google Scholar] [PubMed] [CrossRef]
25. A. K. Biswal, D. Singh, B. K. Pattanayak, D. Samanta, and M. H. Yang, “IoT-based smart alert system for drowsy driver detection,” Wirel. Commun. Mob. Comput., vol. 2021, 2021. doi: 10.1155/2021/6627217. [Google Scholar] [CrossRef]
26. A. C. Phan, N. H. Q. Nguyen, T. N. Trieu, and T. C. Phan, “An efficient approach for detecting driver drowsiness based on deep learning,” Appl. Sci., vol. 11, no. 18, Sep. 2021. doi: 10.3390/APP11188441. [Google Scholar] [CrossRef]
Cite This Article
 Copyright © 2024 The Author(s). Published by Tech Science Press.
This work is licensed under a Creative Commons Attribution 4.0 International License , which permits unrestricted use, distribution, and reproduction in any medium, provided the original work is properly cited.
 Downloads
 Citation Tools