
 Submit a Paper
 Propose a Special lssue
 Open Access
ARTICLE

Contamination Identification of Lentinula Edodes Logs Based on Improved YOLOv5s
1 School of Information Science & Engineering, Shandong Agricultural University, Tai’an, 271018, China
2 Department of Regulations, Tai’an Service Center for Urban Comprehensive Management, Tai’an, 271018, China
* Corresponding Author: Qiulan Wu. Email:
Intelligent Automation & Soft Computing 2023, 37(3), 3143-3157. https://doi.org/10.32604/iasc.2023.040903
Received 03 April 2023; Accepted 02 June 2023; Issue published 11 September 2023
 View Full Text
 Download PDF
Abstract
In order to improve the accuracy and efficiency of Lentinula edodes logs contamination identification, an improved YOLOv5s contamination identification model for Lentinula edodes logs (YOLOv5s-CGGS) is proposed in this paper. Firstly, a CA (coordinate attention) mechanism is introduced in the feature extraction network of YOLOv5s to improve the identifiability of Lentinula edodes logs contamination and the accuracy of target localization. Then, the CIoU (Complete-IOU) loss function is replaced by an SIoU (SCYLLA-IoU) loss function to improve the model’s convergence speed and inference accuracy. Finally, the GSConv and GhostConv modules are used to improve and optimize the feature fusion network to improve identification efficiency. The method in this paper achieves values of 97.83%, 97.20%, and 98.20% in precision, recall, and mAP@0.5, which are 2.33%, 3.0%, and 1.5% better than YOLOv5s, respectively. mAP@0.5 is better than YOLOv4, Ghost-YOLOv4, and Mobilenetv3-YOLOv4 (improved by 4.61%, 5.16%, and 6.04%, respectively), and the FPS increased by two to three times.Keywords
China exports about 70 million Lentinula edodes logs annually, with an annual growth rate of over 30%. In recent years, the production of Lentinula edodes logs has been gradually industrialized. Lentinula edodes logs are often contaminated by sundry bacteria in the process of germination due to incomplete hygienic cleaning of the production environment, inadequate disinfection, and irregular operation [1–4]. At present, the detection of the bacterial contamination of Lentinula edodes logs mainly relies on manual inspection and judgment experience. Problems such as production personnel not observing carefully, misjudging, and delaying the selection of contaminated logs lead to the spread of sundry bacteria. Based on the demand for factory production of Lentinula edodes, it is of great significance to study automatic identification technology to accurately identify contamination status to improve the quality and yield of Lentinula edodes logs, promote the development of the industry, and improve economic benefits.
With the continuous progress of artificial intelligence technology, deep learning has been widely used in industry and other fields [5–7], and brings convenient application services to people’s life [8,9]. Meanwhile, scholars have increasingly applied deep learning to crop disease detection and have a perfect, visible, image database [10–14]. Compared with traditional image identification methods, deep learning mainly combines low-level features into high-level abstract visual features by automatically extracting the input image features. This allows for a fast, non-destructive, and accurate identification of crop diseases in the visible range without the use of hyperspectral imaging techniques [15]. Zu et al. [16] first used a deep learning method to identify the contamination Lentinula edodes logs, and proposed an improved ResNeXt-50 (32 × 4d)-based method that utilizes six fully connected layer fine-tuning strategies to improve the model’s identification accuracy. Zu et al. [17] also proposed Ghost-YOLOv4, which ensures that the contamination of Lentinula edodes logs is accurately recognized, while optimizing the identification speed and real-time performance. However, Zu’s proposed method still has a high number of parameters and high network complexity, which leads to low contamination identification efficiency. Therefore, it is not conducive to the real-time detection and identification of contamination in Lentinula edodes log. In addition, the method has a poor identification effect in some Lentinula edodes logs contaminated by Aspergillus flavus, and it has low identification accuracy. YOLOv5 is a new generation of target detection networks in the YOLO series, which is the product of continuous integration and innovation based on YOLOv3 [18] and YOLOv4 [19]. The model obtained better results on PASCAL VOC and COCO (Common Objects in Context) target detection tasks and is able to significantly improve detection speed while maintaining the detection accuracy of existing models, making it one of the best choices for target detection.
To address the problem of low accuracy and efficiency of the contamination identification of Lentinula edodes logs, this paper improves and optimizes YOLOv5s and proposes a YOLOv5s-CGGS contamination identification model for Lentinula edodes logs. The model introduces a coordinate attention (CA) mechanism in the feature extraction network to highlight the identification of object features, as well as the SIoU loss function to solve the problems of slow convergence and low inference accuracy in the model. This model also combines GSConv and GhostConv modules to optimize the feature fusion network to improve the accuracy of contamination identification and identification efficiency. The method proposed in this paper is applicable to the identification of contamination during the mycelial growth of Lentinula edodes.
2.1 Data Collection for Lentinula Edodes Logs
The dataset used in this paper is the self-built database of the Smart Village Laboratory of Shandong Agricultural University, and the images were collected from a smart factory of a company in Shandong Province. The images showing the contamination of Lentinula edodes logs were manually collected by installing an LED strip light panel every 2 m to provide good lighting conditions in a culture shed of Lentinula edodes logs located in a factory. The image acquisition equipment was a Canon EOS 600D with an image resolution of 3648 × 2736. The camera was fixed at a distance of 50 cm from the Lentinula edodes logs to take pictures. Each Lentinula edodes log was photographed with a 90° rotation, so that four images could be acquired for each log. The Lentinula edodes logs were classified as Aspergillus flavus-contaminated, Trichoderma viride-contaminated, or normal according to the type of sundry bacteria (see Fig. 1). Finally, 3006 images were collected, including 1679 images of normal Lentinula edodes logs (see Figs. 1a, 1b), 689 images of Aspergillus flavus-contaminated Lentinula edodes logs (see Figs. 1c, 1d), and 638 images of Trichoderma viride-contaminated Lentinula edodes logs (see Figs. 1e, 1f).
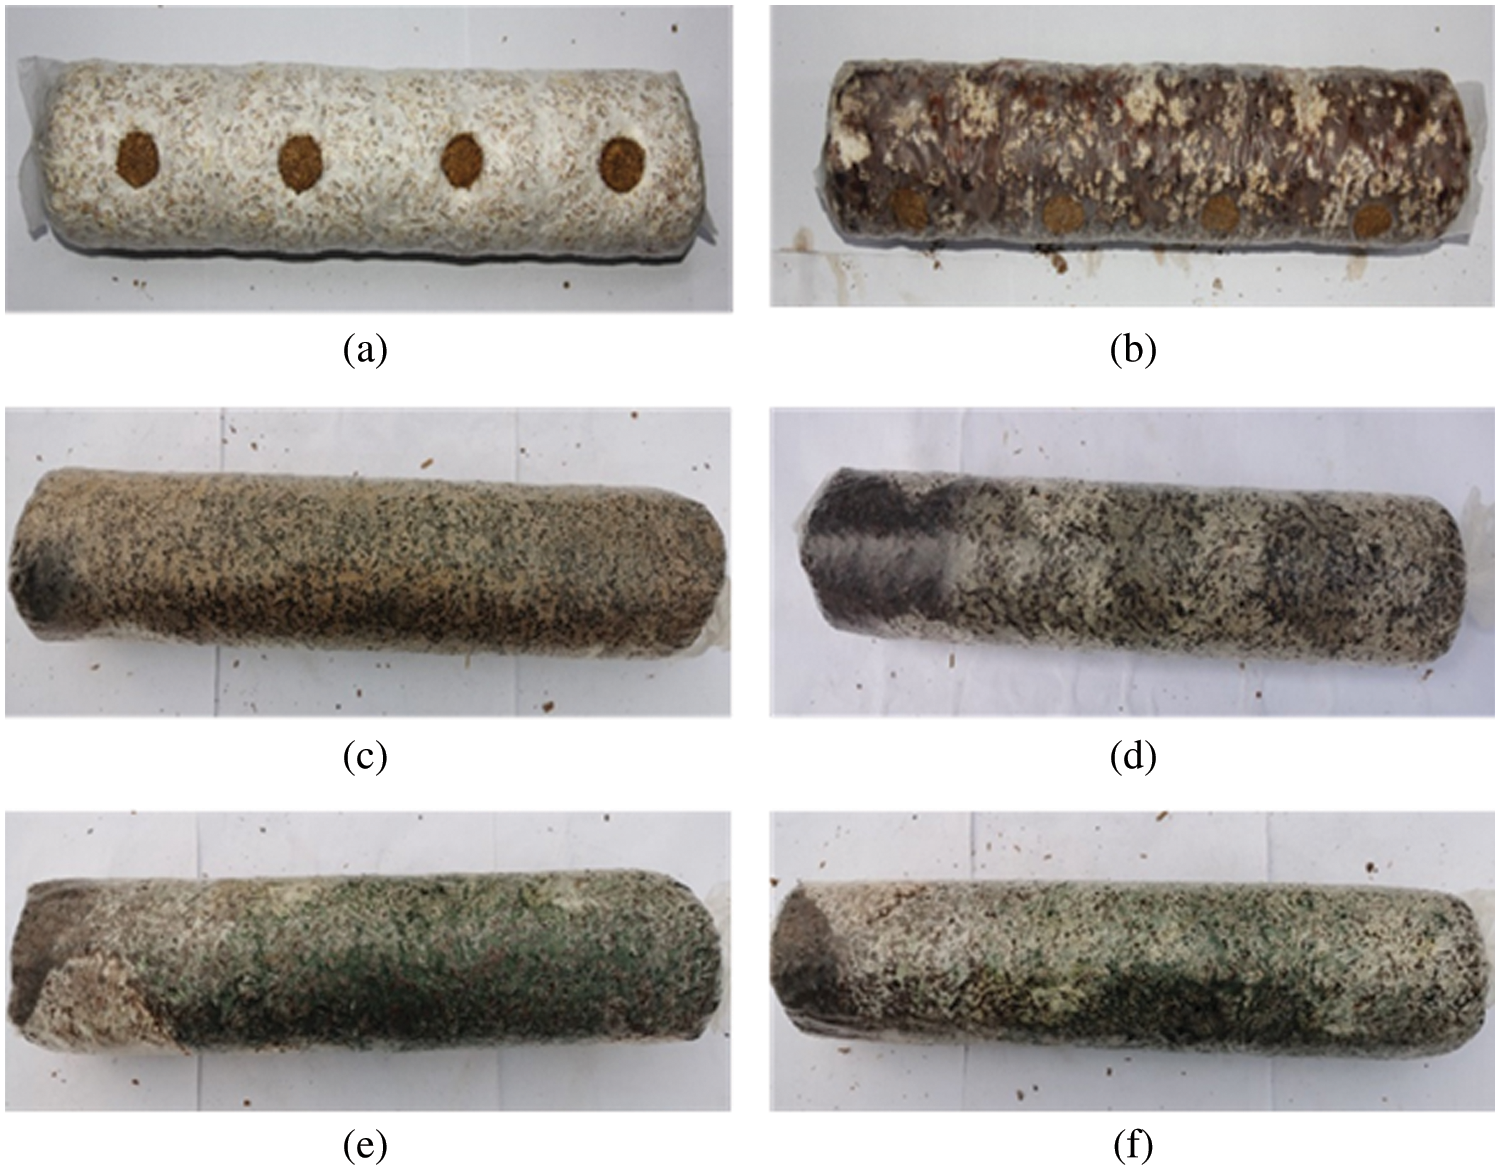
Figure 1: Example images of Lentinula edodes logs. (a, b) Normal, (c, d) Aspergillus flavus-contaminated, and (e, f) Trichoderma viride-contaminated
2.2 Data Pre-Processing and Dataset Construction
In order to improve the generalization performance of the network and prevent the network from overfitting during the training process, the dataset in this study was augmented by rotation, clipping, symmetric transformation, and random adjustment. The expanded dataset consisted of 2109 images of normal Lentinula edodes logs, 1721 images of Aspergillus flavus-contaminated Lentinula edodes logs, and 1574 images of Trichoderma viride-contaminated Lentinula edodes logs, a total of 5404 images. The images were saved in .jpg format in image folders, respectively.
Before the experiment, the Lentinula edodes logs were labeled according to their contamination type using the online MAKE SENSE dataset labeling method. A unified annotation standard was used to improve data quality and prevent some annotations from malfunctioning. The annotated data were directly exported to a txt file in YOLO format, in which the contamination type, length and width, location information, etc. were recorded. Finally, the annotated dataset was divided into training set, validation set, and test set according to a ratio of 7:2:1. Among them, the training set has a total of 3783 images, the validation set has a total of 1081 images, and the test set has a total of 540 images.
In order to design a lightweight contamination identification algorithm for Lentinula edodes logs with a high efficiency and accuracy, the YOLOv5s-CGGS algorithm proposed in this paper is improved in three parts: loss function, feature extraction network, and feature fusion network. The specific structure of this network model is shown in Fig. 2.
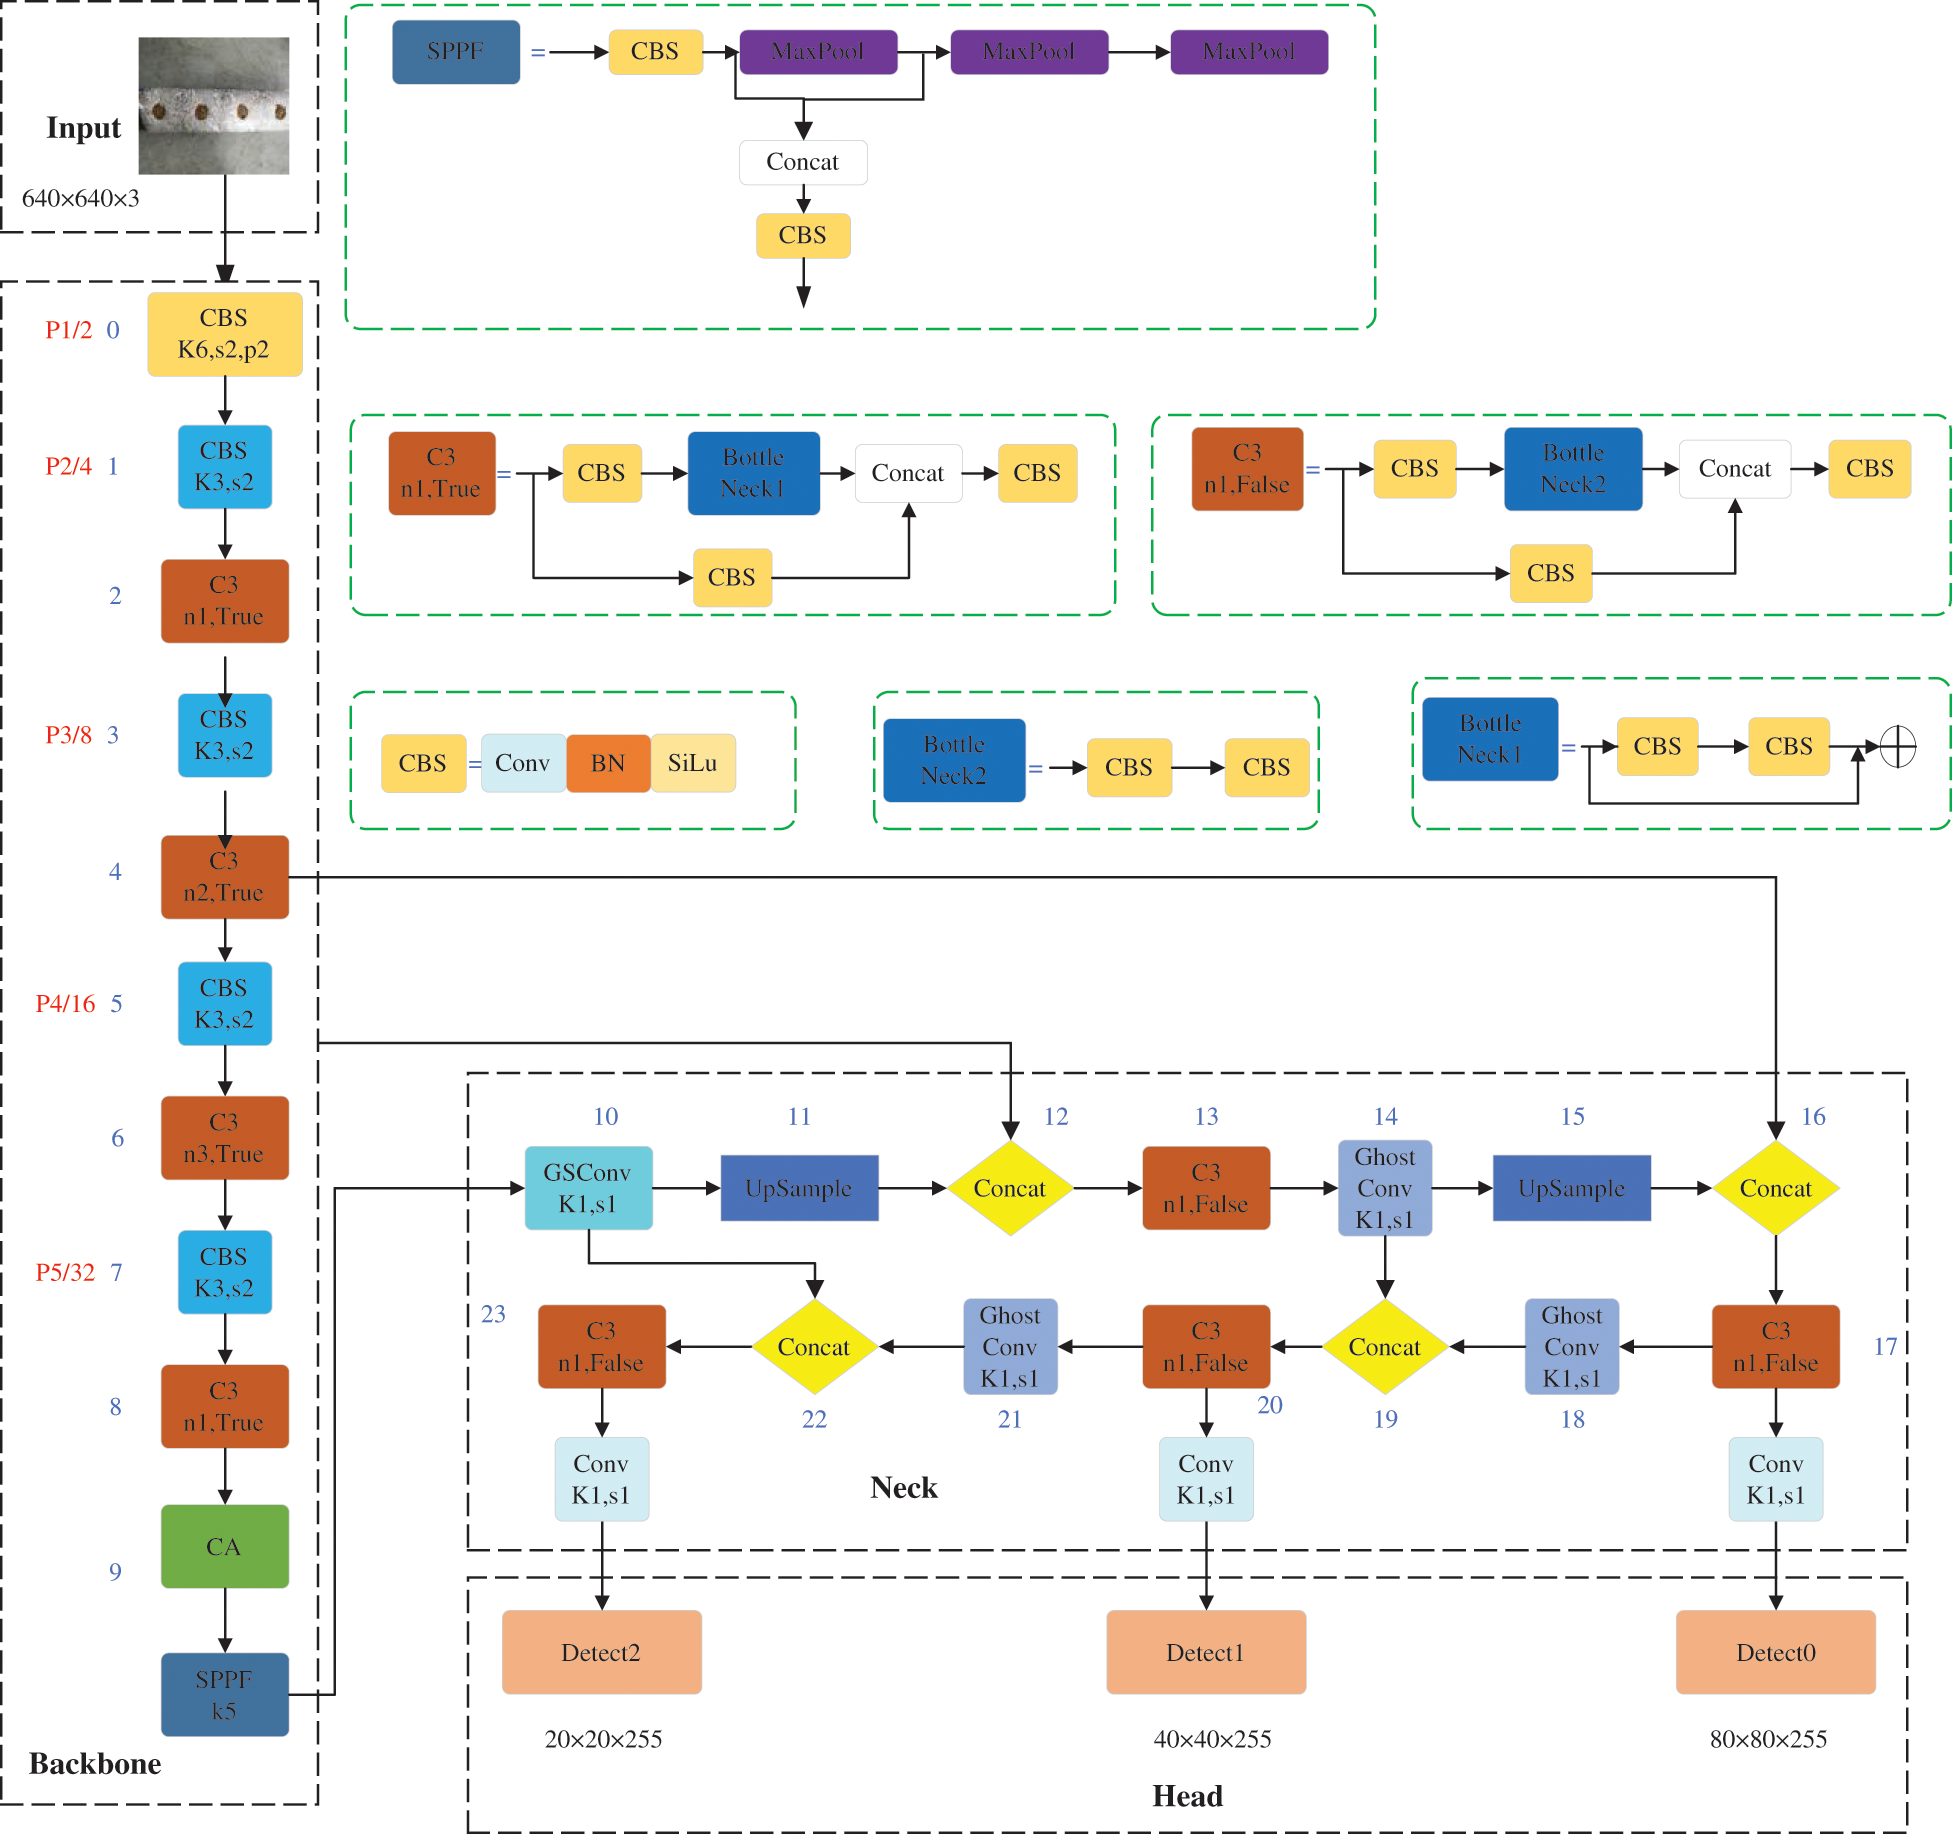
Figure 2: YOLOv5s-CGGS model structure
2.3.1 Loss Function Improvement
Since the loss function is a measure of the expected outcome of the model prediction, the effectiveness of target detection is very dependent on it. The CIoU loss function in the YOLOv5s model pays comprehensive attention to the distance between the prediction box and the real box, the overlap region, and the aspect ratio compared to the general target detection loss function [20–22].
The SIoU [23] loss function further solves the problem of direction mismatch between the desired real box and the predicted box, and solving this problem helps to improve convergence speed and efficiency.
The SIoU loss function consists of four cost functions: Angle cost, Distance cost, Shape cost, and IoU cost. Among them, Angle cost is defined as follows:
where
where
Shape cost is defined as follows:
where
Finally, the SIoU loss function is defined as follows:
where
Thus, in this paper, the original CIoU loss function in YOLOv5s is replaced by the SIoU loss function to improve the convergence speed and inference accuracy of the contamination identification model of Lentinula edodes logs.
2.3.2 Feature Extraction Network Improvement
The feature extraction backbone has the problem of ignoring some key features due to random contamination areas, different shapes and sizes, and intermingling of normal mycelia and sundry bacteria. Introduction of the attention mechanism focuses the network on key content and location information to improve the identifiability of contamination and the accuracy of target localization. However, the application of an attention mechanism in lightweight networks is somewhat limited, mainly because most attention mechanisms generate computational overhead that is unaffordable for lightweight network models [24]. Therefore, in this paper, we introduce a lightweight and convenient CA [25] that generates almost no additional computational overhead to improve the accuracy of the network. Unlike channel attention, which converts the feature tensor into individual feature vectors through two-dimensional global pooling, the CA module decomposes channel attention into two one-dimensional feature encoding processes that aggregate features along two spatial directions. The structure of the CA module is shown in Fig. 3.
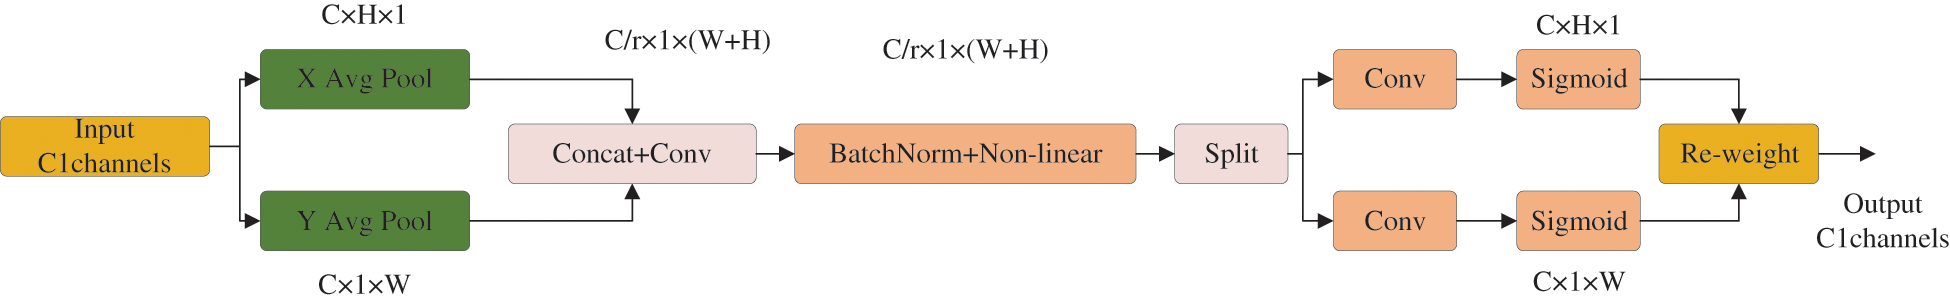
Figure 3: CA module structure
The input is the output feature map of the previous layer of convolution with dimensions C × H × W: the number of channels is C, the height is H, and the width is W. Each channel is encoded along the horizontal and vertical coordinate directions using an average pooling of size (H, 1) and (1, W), respectively. Thus, the output of the
The network can effectively focus on the relevant channel and spatial location coordinate information. As shown in Fig. 4, this paper embeds the CA module before the SPPF after the last layer of the C3 module in the backbone to help the model to extract feature information for key targets, thus improving the accuracy of model training identification.

Figure 4: CA module embedded in the backbone structure
2.3.3 Feature Fusion Network Improvement
In the process of network computation, in order to improve the speed of prediction computation, the input images in convolutional neural networks (CNNs) often need to go through a similar transformation process such as the gradual transfer of spatial information to channels in the backbone. Each spatial compression and channel expansion of the feature map results in the partial loss of semantic information; however, GSConv preserves the hidden connections between channels as much as possible with a low time complexity [26], as shown in Fig. 5. If the GSConv were embedded in all stages of the model, the network layer of the model would be deeper, resulting in significantly higher resistance to data flow and significantly higher inference time. Therefore, in this paper, the GSConv module is introduced to optimize the partial convolution in the feature fusion network. The specific method is to replace the first convolution operation of the feature fusion network with GSConv, which helps to improve the accuracy and reduce the complexity of identifying contamination in Lentinula edodes logs.
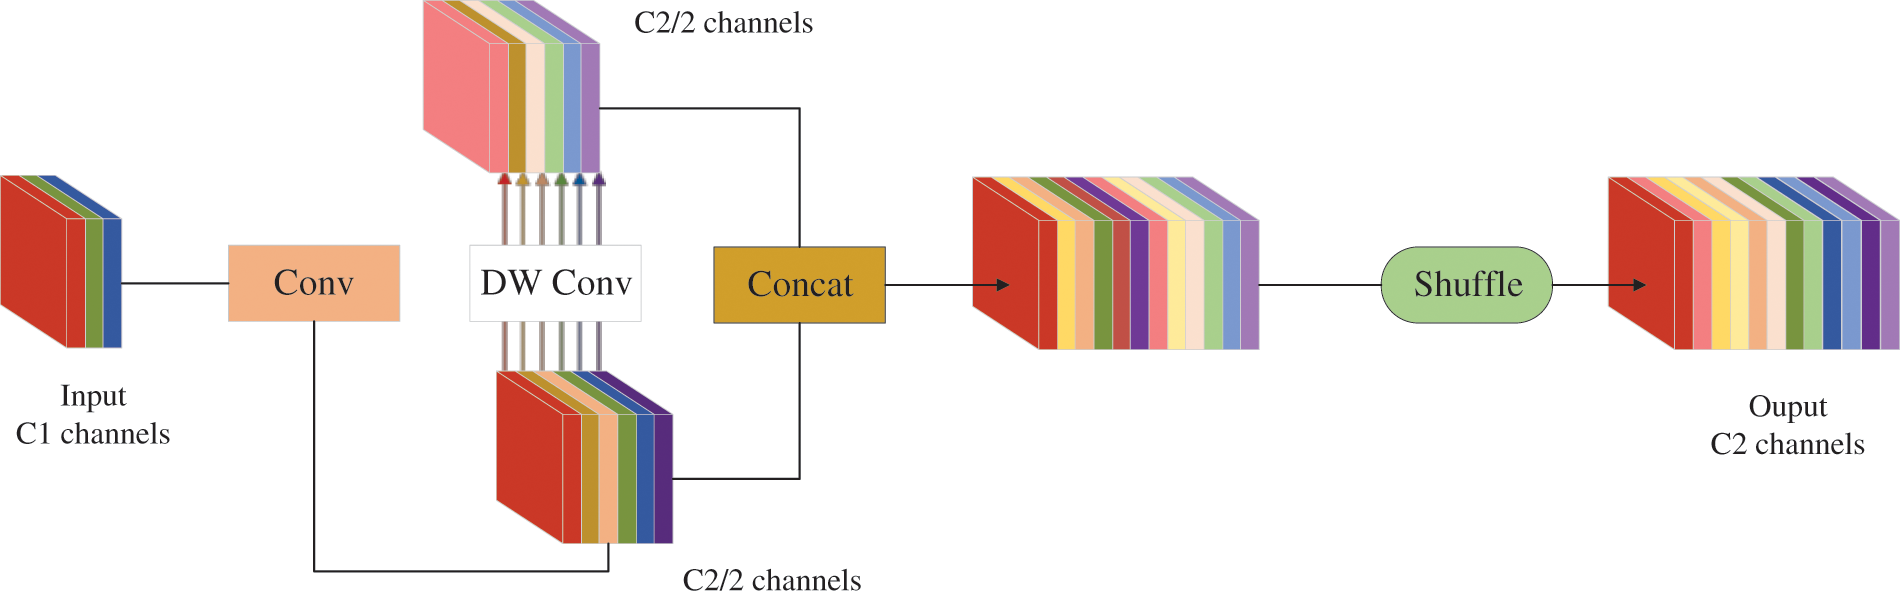
Figure 5: GSConv module structure
After the introduction of the SIoU loss function and CA mechanism, the number of parameters in the network is relatively improved. In addition, since the GSConv module introduced in the neck layer is not embedded in all phases of the layer, this paper uses the GhostConv [27] module to further reduce the number of parameters, with the expectation of improving real-time performance and efficiency. The specific method is to set GhostConv as the convolution module of the 14th, 18th and 21st layers in the feature fusion network. The main role of the GhostConv module is to reduce the computational cost and storage resources of the current deep neural network to achieve the best performance of the model quickly and efficiently. As shown in Fig. 6, the Ghost module generates m-layer intrinsic feature maps via a small amount of ordinary convolution, and then performs linear operations
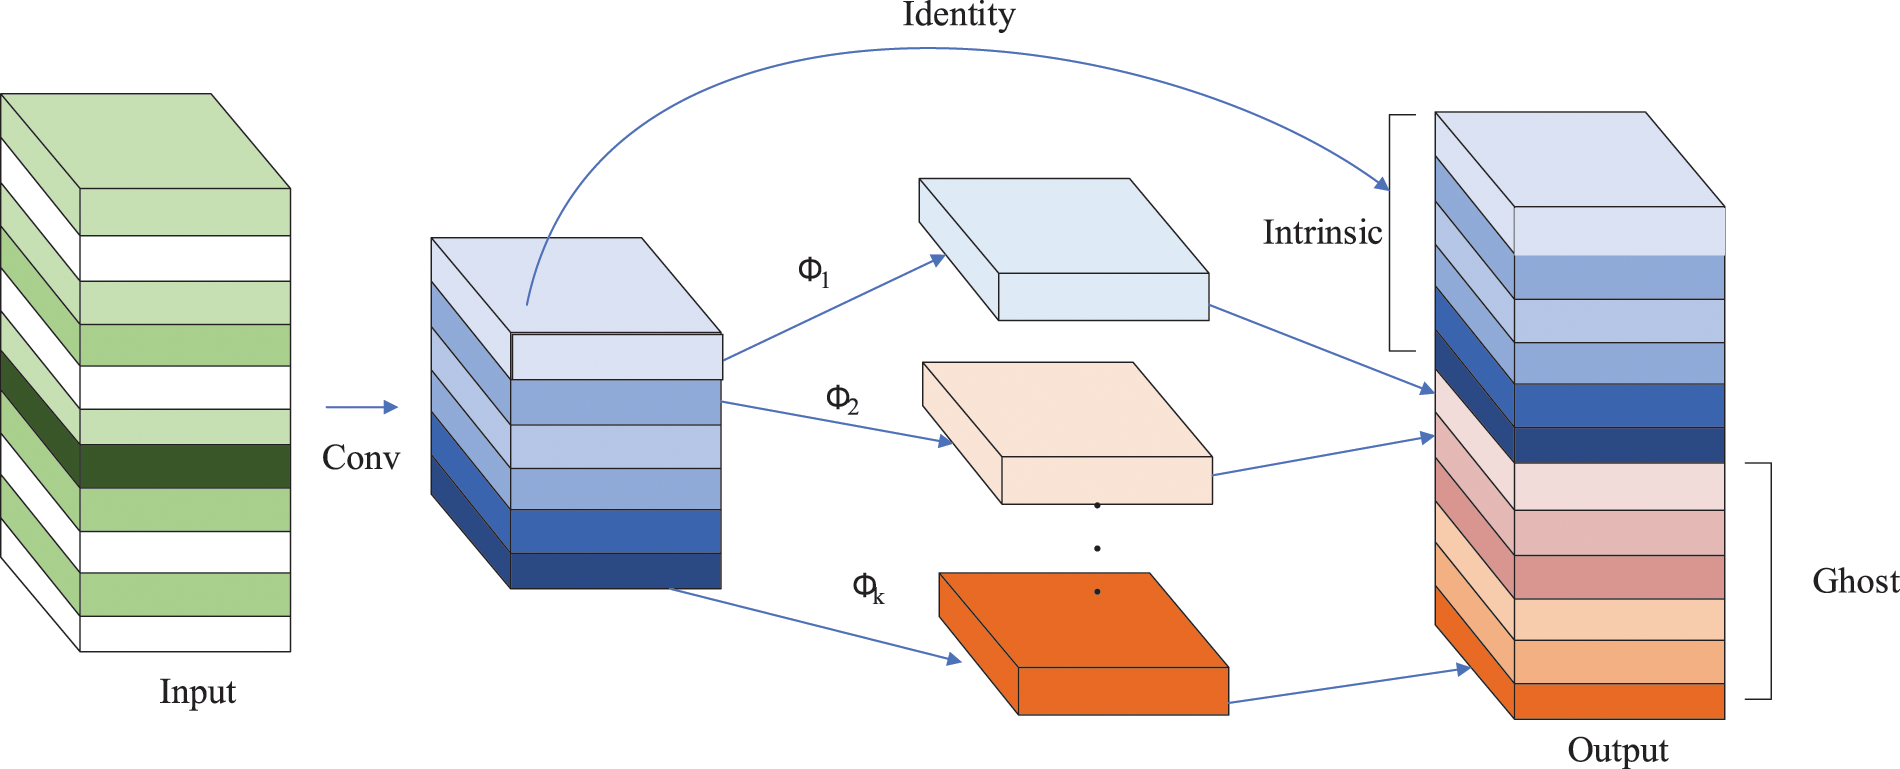
Figure 6: Ghost module structure
2.4 Model Training and Evaluation
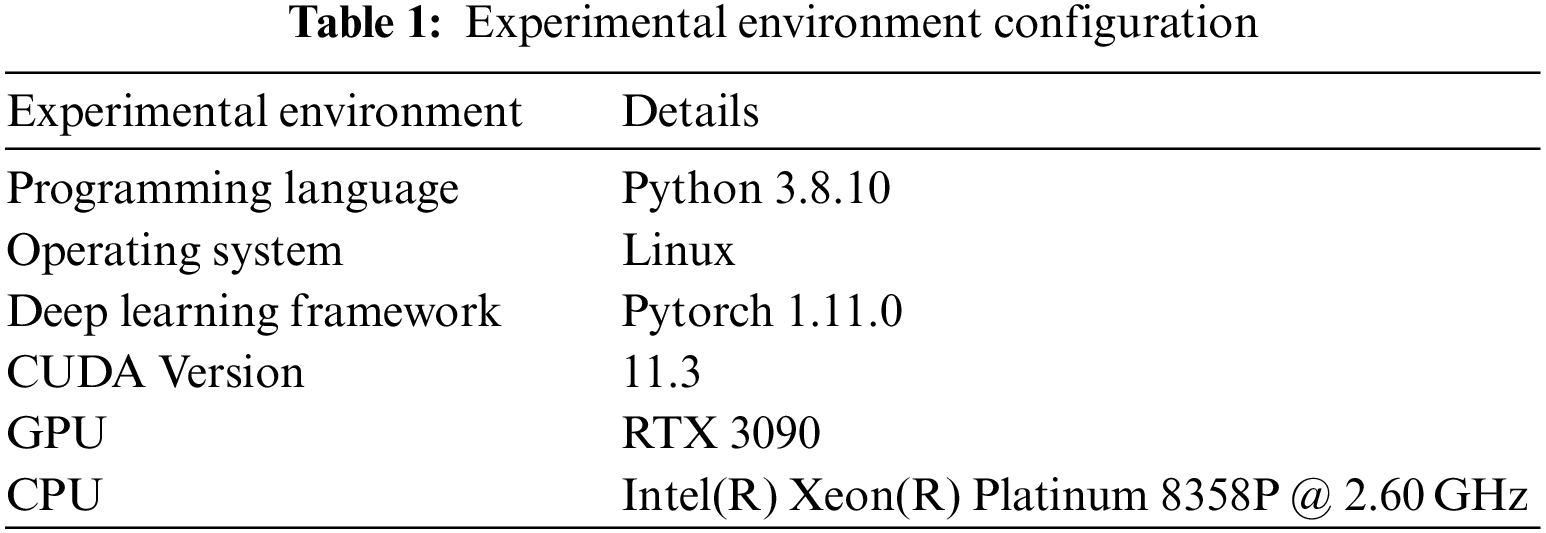
In this paper, considering the small number of samples in the Lentinula edodes logs dataset, YOLOv5s-CGGS uses the default hyperparameters derived from YOLOv5s training on the COCO dataset. The learning rate is set to 0.01 to accelerate the model convergence. Next, SGD is selected for hyperparameter optimization, and the learning rate momentum is set to 0.937. A pre-trained model is also used for training assistance, which gives the model better initial performance. The configuration of the experimental environment in this paper is shown in Table 1.
In order to verify the performance identifying contamination in Lentinula edodes logs, precision, recall, mAP, network structure parameter quantity and FPS are used for evaluation in this paper. The calculation equation is as follows:
where TP indicates that the target is a certain type of Lentinula edodes log, and the network model detection is also a certain type of Lentinula edodes log. FP indicates that the target is a non-type of Lentinula edodes log, and the network model detects a type of Lentinula edodes log. FN indicates that the target is a certain type of Lentinula edodes log, and the network model detection is a non-type of Lentinula edodes log. AP is the area enclosed by the precision and recall on the curve. mAP is the average of all values in the category AP. The average of the values when IoU is set to 0.5 is mAP@0.5. FPS indicates frames per second.
To reduce the computational stress and overfitting problem of the contamination identification model for Lentinula edodes logs, pre-trained weights are introduced into the YOLOv5s-CGGS model by migration learning [28]. The YOLOv5s-CGGS model is trained using the training set. The changes in different types of loss function values during the training process are shown in Fig. 7, where (a) is the localization loss; (b) is the confidence loss; and (c) is the classification loss.
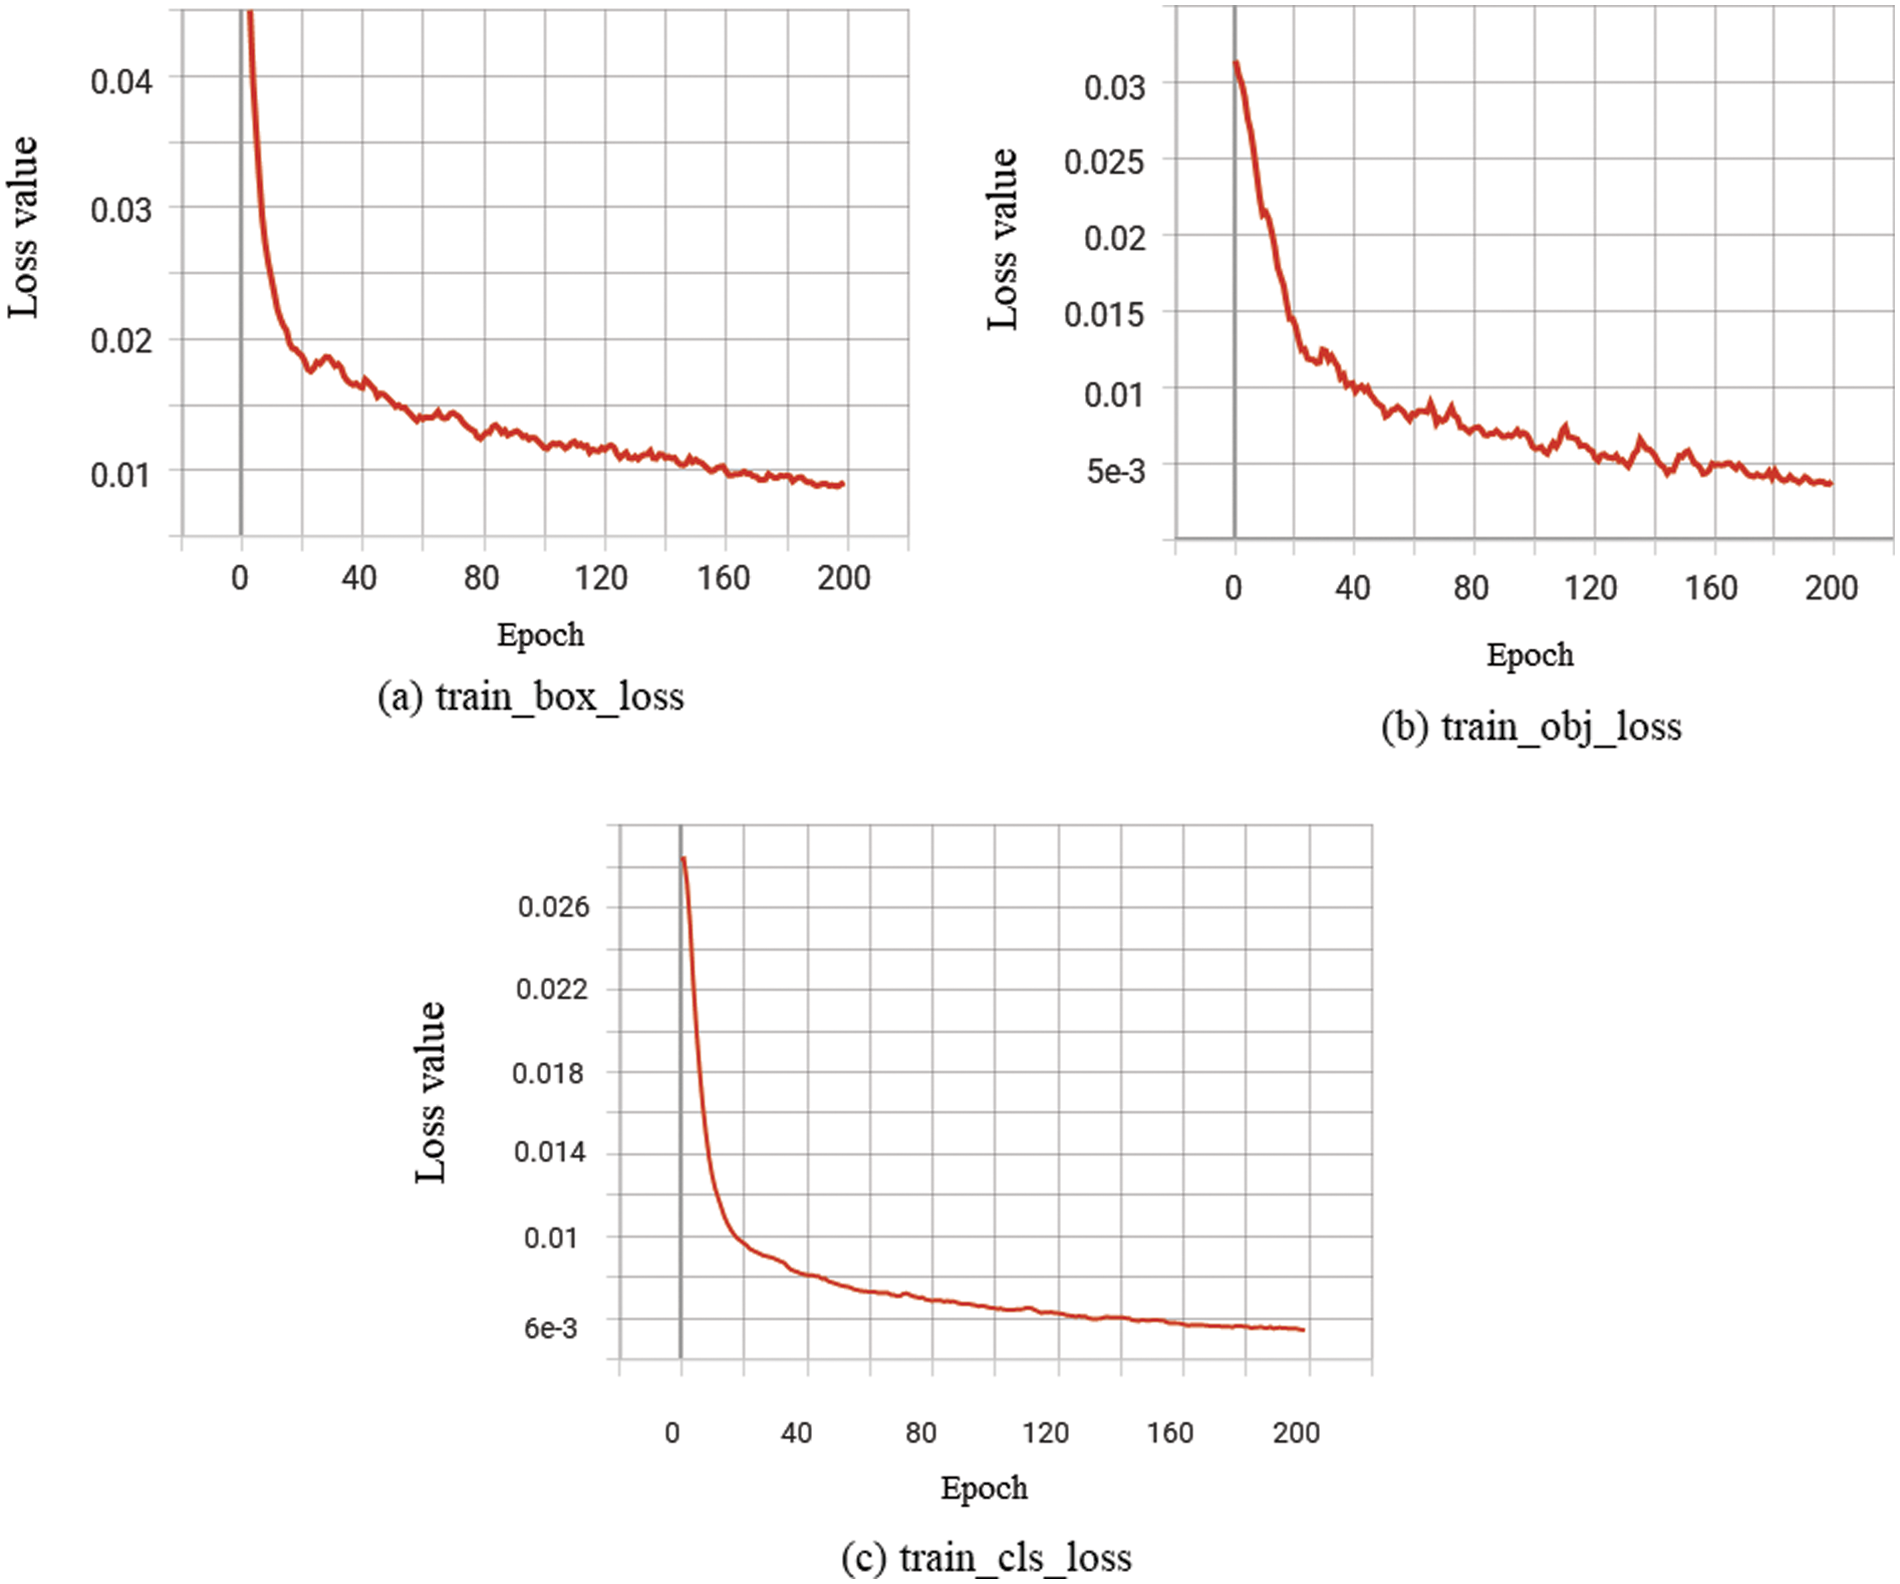
Figure 7: Convergence of the loss function values during training
In the training of the contamination identification model, the smaller the loss function loss value in the model structure, the better the effect, and the expected value is 0. In order to achieve the best performance of the model, the number of iterations is set to 200 and the maximum training batch is set to 32 during the training process. The value of the loss function sharply decreases from 0 to 40 times; the value of the loss function slowly decreases from 40 to 140 times; after 140 iterations, the loss value stabilizes, and the model reaches the maximum excellent state.
After each round of training, model validation is performed on the validation set, and the model training results are measured using three evaluation indicators: precision, recall, and mAP@0.5. The changes in the evaluation indicator values during the training process are shown in Fig. 8. The values of the three indicators sharply increase from 0 to about 40 iterations. Then, they oscillate in a certain range, rise slowly, and finally stabilize. The three indicators are stable in the range of 0.95∼1, which proves that the contamination identification model for Lentinula edodes logs has a high accuracy and good convergence.
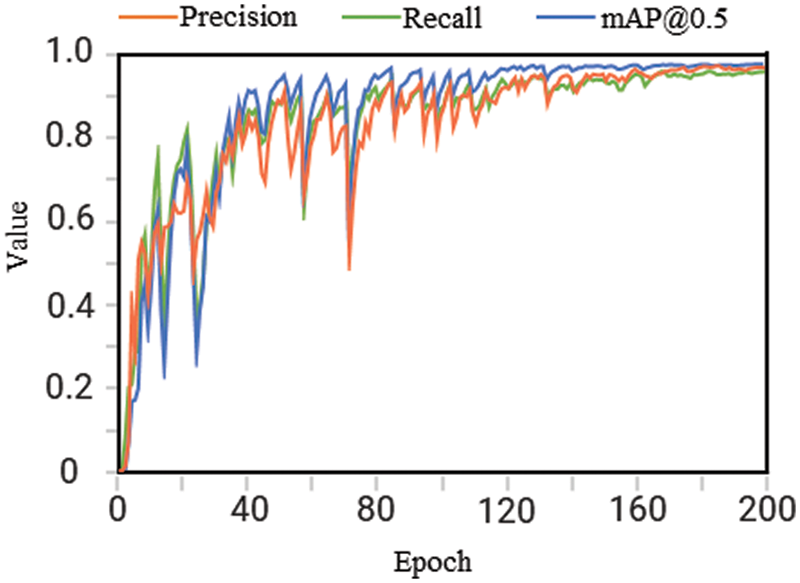
Figure 8: Changes in the values of evaluation indicators during the training process
3.2 Performance Comparison of Different Models
In order to prove that the method in this paper has better identification effect, the proposed YOLOv5s-CGGS is compared with YOLOv5s, YOLOv7, YOLOX, YOLOv4, Ghost-YOLOv4, and MobilenetV3-YOLOv4 in experiments using the validation set of Lentinula edodes logs. The evaluation indicators include precision, recall, mAP@0.5, network structure parameter quantity, and FPS. Table 2 shows the comparison results of each evaluation indicator for the different identification models mentioned above.
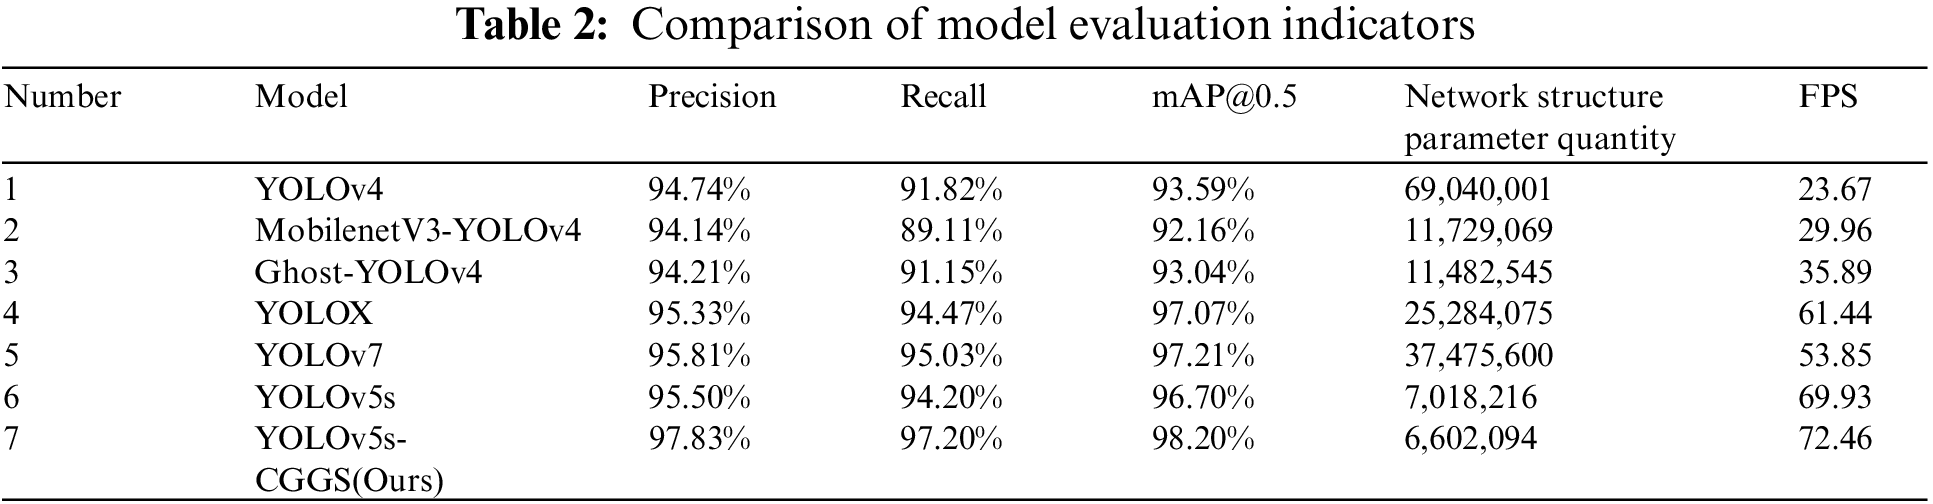
From the comparative experimental results in Table 2, the identification effect of the YOLOv5s-CGGS model proposed in this paper is significantly improved. Experiments 2 and 3 are the research methods of Zu et al. [17], which are dedicated to improving the network lightweight while ensuring the accuracy rate is stable. However, it can clearly be seen that the network structure parameter quantity is reduced by about 16.63% relative to YOLOv4, while the accuracy is slightly reduced. Therefore, there is still much room for improvement on this basis. The network structure parameter quantities of YOLOv5s-CGGS proposed in this paper are approximately 9.6%, 56.3%, and 57.5% of the network structure parameter quantity of YOLOv4, MobilenetV3-YOLOv4, and Ghost-YOLOv4, respectively. However, there are significant improvements in precision, recall, and mAP@0.5 evaluation indicators, and FPS is improved by two to three times. From Experiments 4 and 5, it can be seen that the performance of the three evaluation indicators of YOLOv7 and YOLOX is relatively close to that of YoLoV5s, but YoLoV5s has fewer model parameters and a faster identification rate. Compared with YOLOv5s, the network structure parameter quantity of YOLOv5s-CGGS model proposed in this paper is reduced by 6%. The accuracy improved by 2.33%, the recall rate increased by 3.0%, mAP@0.5 increased by 1.5%, and FPS increased by 2.53. In summary, the method proposed in this paper is significantly better than other methods.
3.3 Study of Model Ablation Experiments
In order to verify the effectiveness of the CA mechanism, GSConv module, GhostConv module, and SIoU loss function on the performance improvement of Lentinula edodes logs contamination identification model, this study conducted ablation experiments on the Lentinula edodes logs dataset. Firstly, pre-training weights were loaded using migration learning and training in the Lentinula edodes logs training set to obtain the contamination identification model of the Lentinula edodes logs. Then, the model performance was evaluated using the test set to obtain precision, recall, mAP@0.5, and FPS results. The ablation experimental results data are shown in Table 3.
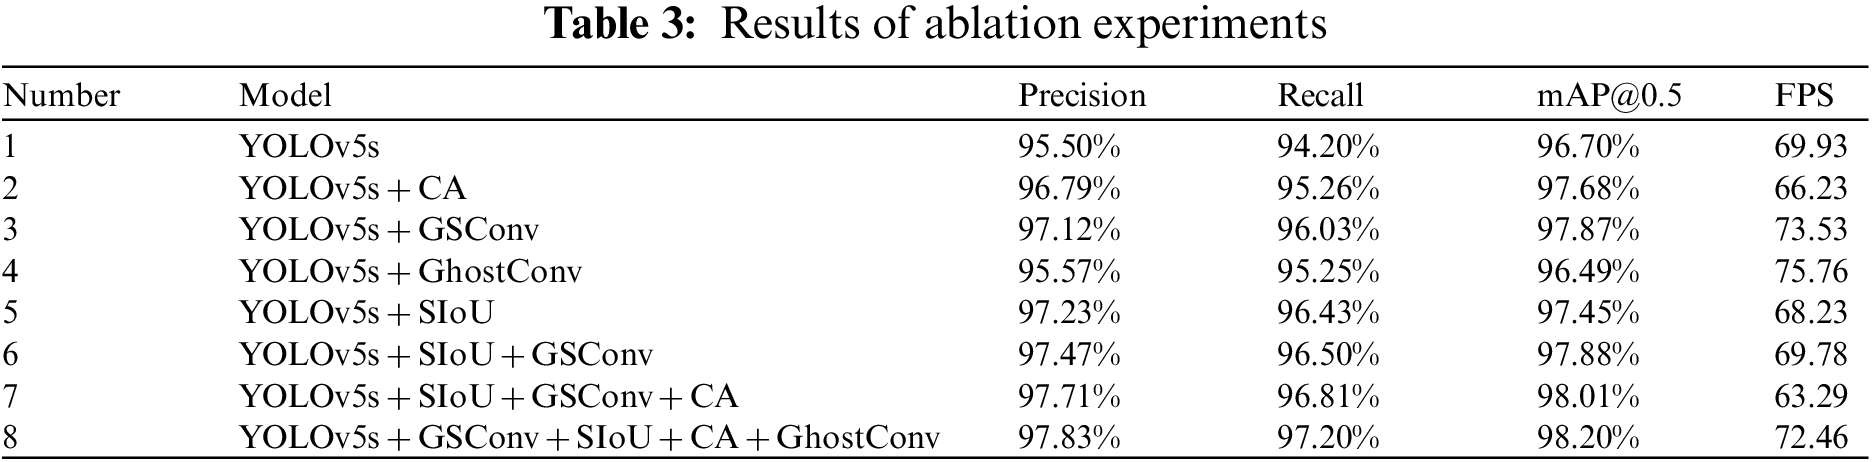
After the ablation experiment, it can be seen that although YOLOv5s has a good ability to identify the contamination of Lentinula edodes logs, the identification accuracy and efficiency of the model need to be improved. In Experiment 2, the precision, recall, and mAP@0.5 improved by 1.29%, 1.06%, and 0.98%, respectively. This indicates that embedding the CA module in YOLOv5s can highlight the key features of the identified objects and improve the identifiability and accuracy of target localization for the contamination of Lentinula edodes logs. In Experiment 3, precision, recall, and mAP@0.5 increased by 1.62%, 1.83%, and 1.17%, respectively, and the FPS increased by 3.60. This indicates that the introduction of GSConv in YOLOv5s can improve identification accuracy while reducing model complexity. In Experiment 4, compared with YOLOv5s, precision, recall, and mAP@0.5 essentially remained the same, the FPS improved by 5.83, and the identification efficiency performed relatively well. In Experiment 5, precision, recall, and mAP@0.5 improved by 1.73%, 2.23%, and 0.75%, respectively. This indicates that replacing the original loss function with the SIoU loss function can effectively improve the model convergence speed and the accuracy of inference. It can be concluded from the data comparison that the four different improvements to the YOLOv5s model all improve the performance of the contamination identification model for Lentinula edodes logs to different degrees. More importantly, Experiments 6–8 combined the above four improvements. In Experiment 6, by combining the more effective SIoU loss function and GSConv, the precision, recall, and mAP@0.5 are better than in Experiments 1, 3, and 5. This indicates that introducing both the SIoU loss function and GSConv can improve the performance of this contamination identification model for Lentinula edodes logs. Precision, recall, and mAP@0.5 results were higher for Experiment 7 than for Experiments 1, 2, 3, and 6, which indicates that fusing SIoU loss function, GSConv, and GhostConv modules together can improve the performance of this model for contamination identification in Lentinula edodes logs; however, the FPS is relatively low. Experiment 8 is the YOLOv5s-CGGS model proposed in this paper, and the four evaluation indicators of precision, recall, mAP@0.5, and FPS show the best overall performance.
In order to further analyze the effect of different improvement methods on contamination identification in Lentinula edodes logs, this paper visualizes the feature extraction results of the last convolutional layer in the feature extraction backbone using class activation mapping (CAM) [29]. The visualization results are shown in Fig. 9. The darker the red part, the more the model pays attention to this part of the image, followed by the yellow part. The bluer the heat map, the more the model considers this part of redundant information and has less influence on contamination identification in Lentinula edodes logs.
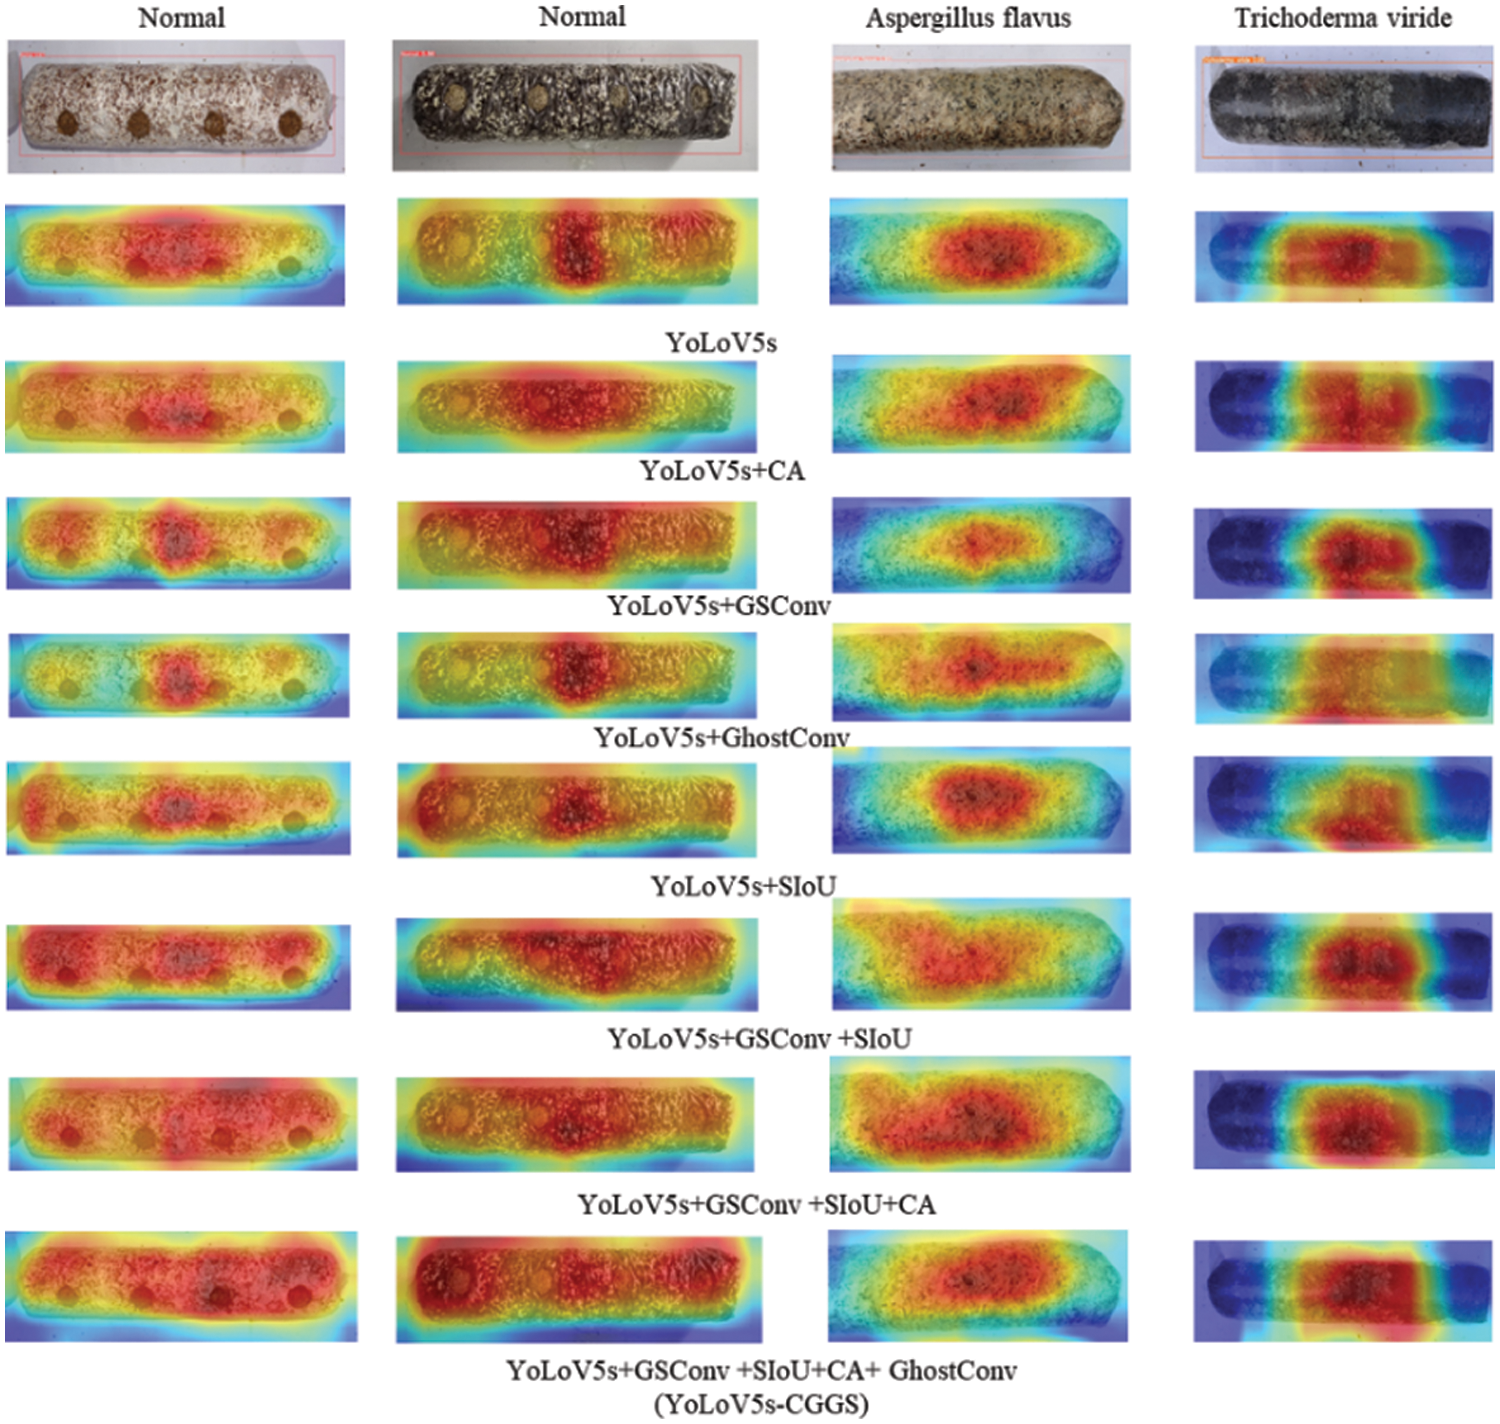
Figure 9: Visual analysis of feature maps
Analysis of model feature extraction results under different contamination types shows that different improvement methods improve the model’s identification effect to different degrees. According to the comprehensive experimental results, the YOLOv5s-CGGS contamination identification model for the Lentinula edodes logs proposed in this paper has the best performance and good application prospects; it can accurately and efficiently identify the Lentinula edodes logs contaminated by sundry bacteria in the process of germination. In addition, the method proposed in this paper can provide a reference solution for contamination identification in other edible Lentinula edodes logs.
In order to improve the accuracy and efficiency of contamination identification for Lentinula edodes logs, an improved YOLOv5s contamination identification model (YOLOv5s-CGGS) for Lentinula edodes logs is proposed in this paper. By introducing the CA mechanism to help the feature extraction network focus on key semantic and location information of Lentinula edodes logs, the identification object features are highlighted and the accuracy of contamination identification is improved. The SIoU loss function is used to solve the problem of direction mismatch between the real box and the predicted box to improve the convergence speed and identification accuracy of model. Meanwhile, this paper used a GSConv module and GhostConv module to improve and optimize the feature fusion network of YOLOv5s, which has faster identification efficiency, while ensuring identification accuracy. The method proposed in this paper provides an effective solution for the identification of contamination in factory-produced Lentinula edodes logs, which can reduce the workload of Lentinula edodes log inspectors and is of great significance for improving the quality of Lentinula edodes log products and reducing the economic loss of enterprises.
However, the contamination identification model for Lentinula edodes logs in this paper still has shortcomings when applied to the following scenarios. One scenario is when the contaminated area is small; the other is when a single Lentinula edodes log has multiple contamination types. In subsequent research, we will continue to optimize the contamination identification technology for Lentinula edodes logs. One future research direction could focus on an annotation technology for the Lentinula edodes logs dataset that will help the model extract the features of the target more accurately. A second research direction could include methods to improve the model’s performance and reduce the influence of mycelia on the model’s identification results.
Funding Statement: This research was funded by the Major Scientific and Technological Innovation Project of Shandong Province (Grant No. 2022CXGC010609), and the Talent Project of Zibo City.
Conflicts of Interest: The authors declare that they have no conflicts of interest to report regarding the present study.
References
1. Z. J. Cao, S. X. Wang, S. Y. Zheng, X. Q. Wang, Y. Liu et al., “Identification of Paecilomyces variotii and its interaction with Lentinula edodes mycelium,” North Horticulture, vol. 509, no. 14, pp. 116–125, 2022. [Google Scholar]
2. Y. Wang, Z. Y. Liu, Y. Feng, Y. X. Liu and Y. M. Tan, “Study on the infection process of Trichoderma in the production of Lentinus edodes,” Seed, vol. 40, no. 6, pp. 131–141, 2021. [Google Scholar]
3. Q. Yao, Z. Y. Gong, H. Y. Si, J. D. Han, Z. Y. Zhang et al., “Study on the formulation of culture substrate of lentinus edodes with resistance to hybrid bacteria,” Chinese Journal of Edible Fungi, vol. 39, no. 10, pp. 56–58, 2020. [Google Scholar]
4. W. J. Chen, X. J. Gu and W. P. Yang, “Prevention and control techniques of major physiological diseases of Lentinula edodes in northern high-altitude areas,” Edible Mushrooms, vol. 40, no. 3, pp. 68–70, 2018. [Google Scholar]
5. W. Gong, W. Zhang, M. Bilal, Y. Chen, X. Xu et al., “Efficient web APIs recommendation with privacy-preservation for mobile App development in industry 4.0,” IEEE Transactions on Industrial Informatics, vol. 18, no. 9, pp. 6379–6387, 2021. [Google Scholar]
6. W. Gong, H. Wu, X. Wang, X. Zhang, Y. Wang et al., “Diversified and compatible web APIs recommendation based on game theory in IoT,” Digital Communications and Networks, 2023. [Online]. Available: https://www.sciencedirect.com/science/article/pii/S2352864823000378 [Google Scholar]
7. W. Gong, X. Zhang, Y. Chen, Q. He, A. Beheshti et al., “DAWAR: Diversity-aware Web APIs recommendation for mashup creation based on correlation graph,” in Proc. of the 45th Int. ACM SIGIR Conf. on Research and Development in Information Retrieval, Madrid, Spain, pp. 395–404, 2022. [Google Scholar]
8. W. Gong, C. Lv, Y. Duan, Z. Liu, M. Khosravi et al., “Keywords-driven web APIs group recommendation for automatic app service creation process,” Software-Practice and Experience, vol. 51, no. 11, pp. 2337–2354, 2020. [Google Scholar]
9. W. Gong, L. Qi and Y. Xu, “Privacy-aware multidimensional mobile service quality prediction and recommendation in distributed fog environment,” Wireless Communications and Mobile Computing, vol. 2018, 2018. [Online]. Available: https://www.hindawi.com/journals/wcmc/2018/3075849/ [Google Scholar]
10. Y. Ai, C. Sun, J. Tie and X. T. Cai, “Research on recognition model of crop diseases and insect pests based on deep learning in harsh environments,” IEEE Access, vol. 8, no. 1, pp. 171686–171693, 2020. [Google Scholar]
11. X. Zhang, Y. Qiao, F. Meng, C. Fan and M. Zhang, “Identification of maize leaf diseases using improved deep convolutional neural networks,” IEEE Access, vol. 6, no. 1, pp. 30370–30377, 2018. [Google Scholar]
12. M. M. Si, M. H. Deng and Y. Han, “Using deep learning for soybean pest and disease classification in farmland,” Journal of Northeast Agricultural University, vol. 26, no. 1, pp. 64–72, 2019. [Google Scholar]
13. D. Wang, J. Wang, Z. Ren and W. Li, “DHBP: A dual-stream hierarchical bilinear pooling model for plant disease multi-task classification,” Computers and Electronics in Agriculture, vol. 195, 2022. [Online]. Available: https://www.sciencedirect.com/science/article/abs/pii/S0168169922001053 [Google Scholar]
14. P. Jiang, Y. Chen, B. Liu, D. He and C. Liang, “Real-time detection of apple leaf diseases using deep learning approach based on improved convolutional neural networks,” IEEE Access, vol. 7, no. 1, pp. 59069–59080, 2019. [Google Scholar]
15. G. Wang, J. Wang, H. Yu and Y. Sui, “Research on identification of corn disease occurrence degree based on improved ResNeXt network,” International Journal of Pattern Recognition and Artificial Intelligence, vol. 36, no. 2, pp. 2250005, 2022. [Google Scholar]
16. D. Zu, F. Zhang, Q. L. Wu, W. Y. Wang, Z. M. Yang et al., “Disease identification of lentinus edodes logs based on deep learning model,” Complexity, vol. 2022, pp. 1–9, 2022. [Google Scholar]
17. D. Zu, F. Zhang, Q. Wu, C. Lu, W. Wang et al., “Sundry bacteria contamination identification of Lentinula edodes logs based on deep learning model,” Agronomy, vol. 12, no. 9, pp. 2121, 2022. [Google Scholar]
18. J. Redmon and A. Farhadi, “YOLOv3: An incremental improvement,” arXiv Preprint arXiv, 2018. [Online]. Available: https://arxiv.org/abs/1804.02767 [Google Scholar]
19. A. Bochkovskiy, C. Y. Wang and H. Y. M. Liao, “YOLOv4: Optimal speed and accuracy of object detection,” arXiv Preprint arXiv, 2020. [Online]. Available: https://arxiv.org/abs/2004.10934 [Google Scholar]
20. Z. Zheng, P. Wang, W. Liu, J. Li, R. Ye et al., “Distance-IoU loss: Faster and better learning for bounding box regression,” in Proc. of th 07e AAAI Conf. on Artificial Intelligence, Hilton New York Midtown, New York, New York, USA, pp. 12993–13000, 2020. [Google Scholar]
21. H. Rezatofighi, N. Tsoi, J. Gwak, A. Sadeghian, I. Reid et al., “Generalized intersection over union: A indicator and a loss for bounding box regression,” in Proc. of the IEEE/CVF Conf. on Computer Vision and Pattern Recognition, Long Beach, CA, USA, pp. 658–666, 2019. [Google Scholar]
22. Z. Zheng, P. Wang, D. Ren, W. Liu, R. Ye et al., “Enhancing geoindicator factors in model learning and inference for object detection and instance segmentation,” IEEE Transactions on Cybernetics, vol. 52, no. 8, pp. 8574–8586, 2021. [Google Scholar]
23. Z. Gevorgyan, “SIoU loss: More powerful learning for bounding box regression,” arXiv preprint arXiv, 2022. [Online]. Available: https://arxiv.org/abs/2205.12740 [Google Scholar]
24. X. Tan and H. Peng, “Improved YOLOv5 SAR image ship target detection,” Computer Engineering and Application, vol. 58, no. 4, pp. 247–254, 2022. [Google Scholar]
25. Q. Hou, D. Zhou and J. Feng, “Coordinate attention for efficient mobile network design,” in Proc. of the IEEE/CVF Conf. on Computer Vision and Pattern Recognition, Nashville, TN, USA, pp. 13713–13722, 2021. [Google Scholar]
26. H. Li, J. Li, H. Wei, Z. Liu, Z. Zhan et al., “Slim-neck by GSConv: A better design paradigm of detector architectures for autonomous vehicles,” arXiv Preprint arXiv, 2022. [Online]. Available: https://arxiv.org/abs/2206.02424 [Google Scholar]
27. K. Han, Y. Wang, Q. Tian, J. Guo, C. Xu et al., “GhostNet: More features from cheap operations,” in Proc. of the IEEE/CVF Conf. on Computer Vision and Pattern Recognition, Seattle, WA, USA, pp. 1580–1589, 2020. [Google Scholar]
28. L. J. Wong and A. J. Michaels, “Transfer learning for radio frequency machine learning: A taxonomy and survey,” Sensors, vol. 22, no. 4, pp. 1416, 2022. [Google Scholar] [PubMed]
29. R. R. Selvaraju, M. Cogswell, A. Das, R. Vedantam, D. Parikh et al., “Grade-CAM: Visual explanations from deep networks via gradient-based localization,” in Proc. of the IEEE Int. Conf. on Computer Vision, Venice, Italy, pp. 618–626, 2017. [Google Scholar]
Cite This Article
 Copyright © 2023 The Author(s). Published by Tech Science Press.
This work is licensed under a Creative Commons Attribution 4.0 International License , which permits unrestricted use, distribution, and reproduction in any medium, provided the original work is properly cited.
 Downloads
 Citation Tools