
 Submit a Paper
 Propose a Special lssue
 Open Access
ARTICLE

Detection of Alzheimer’s Disease Progression Using Integrated Deep Learning Approaches
1 Department of Information and Communication Technology, Manipal Institute of Technology, Manipal Academy of Higher Education, Manipal, 576104, India
2 Department of Swasthavritta and Yoga, J S Ayurved Mahavidyalay, Nadiad, 387001, India
* Corresponding Author: Nisha P. Shetty. Email:
Intelligent Automation & Soft Computing 2023, 37(2), 1345-1362. https://doi.org/10.32604/iasc.2023.039206
Received 14 January 2023; Accepted 28 February 2023; Issue published 21 June 2023
 View Full Text
 Download PDF
Abstract
Alzheimer’s disease (AD) is an intensifying disorder that causes brain cells to degenerate early and destruct. Mild cognitive impairment (MCI) is one of the early signs of AD that interferes with people’s regular functioning and daily activities. The proposed work includes a deep learning approach with a multimodal recurrent neural network (RNN) to predict whether MCI leads to Alzheimer’s or not. The gated recurrent unit (GRU) RNN classifier is trained using individual and correlated features. Feature vectors are concatenated based on their correlation strength to improve prediction results. The feature vectors generated are given as the input to multiple different classifiers, whose decision function is used to predict the final output, which determines whether MCI progresses onto AD or not. Our findings demonstrated that, compared to individual modalities, which provided an average accuracy of 75%, our prediction model for MCI conversion to AD yielded an improvement in accuracy up to 96% when used with multiple concatenated modalities. Comparing the accuracy of different decision functions, such as Support Vector Machine (SVM), Decision tree, Random Forest, and Ensemble techniques, it was found that that the Ensemble approach provided the highest accuracy (96%) and Decision tree provided the lowest accuracy (86%).Keywords
The brain, which is responsible for coordination, creativity, memory, language, learning, emotional responses, and many other functions, is one of the most composite components of the human body. Because the brain is at the center of the nervous system, any irregularities in its operation can have a ripple effect throughout the body. AD is a degenerative disorder in which brain cells deteriorate and die prematurely. This disorder causes a decrease in the person’s mental process, social abilities, and behavioral reactions, eventually leading to Dementia [1]. Dementia is described as an illness in which an individual’s cognitive abilities have significantly deteriorated in contrast to their former functioning levels. All over 50 million people worldwide suffer from dementia and it is expected to upsurge to 152 million by 2050, especially in low- and middle-income countries (LMICs), where two-thirds of persons with dementia reside [2]. Table 1 gives some scenarios which clearly distinguish Dementia from lapses occurring due to normal aging.

AD [2] is a degenerative cerebral disease, with neuropathological and neurochemical features causing occupational, domestic, and social functioning interference. This progressive disease with a prevalence rate of 7% is usually diagnosed among individuals above 65 years of age. Even though the disease is irreversible, early detection can help people who are affected get the care they need, reducing the slow erosion of their mental abilities.
MCI is considered a transitional stage between cognitively normal aging and AD. People with MCI are more likely to develop AD than those with healthy cognition (HC). Since there is no reliable treatment available for AD, the management of the disease has become the biggest challenge among experts. Even though some therapies can slow down the progress of the disease, early detection of the disease in the prodromal stage has become very crucial. It is critical to keep patients with AD physically healthy to maintain their cognitive abilities. Patients with Alzheimer’s disease have greater physical health issues than people their age, but they also receive less community health care and have a harder time accessing and organizing treatment. Persons with Alzheimer’s disease are admitted to the hospital at a higher rate than other older people, even for conditions that may be treated at home. Hospitalizations are traumatic and linked to poor outcomes and expensive expenditures. Individuals with AD and their families and society would benefit greatly from a focus on disease prevention, early intervention, and effective care [3].
Deep learning (DL) has been shown to have enormous potential for clinical decision support for several diseases, including Alzheimer’s disease, cancers, and diabetic retinopathy. Compared to other shallow learning models, deep learning has the major advantage of learning most predictive features directly from the raw data given a dataset of labeled examples.
With the motivation to improve the detection rate of AD and prevent the misclassification of MCI as a progression toward AD, the proposed work contributes in the following manner.
• Single-factor models, which predominated in earlier AD prediction models, underperformed when compared to multi-factor models. A larger feature space is required for an accurate model for AD prediction. As a result, the concatenated feature vector containing educated data from Cerebrospinal Fluid (CSF) biomarkers, Magnetic resonance imaging (MRI), and cognitive performance data yielded more optimal results in this interdisciplinary study. The major contribution of this work is to yield a more accurate diagnosis which can be achieved with improved feature space and their correlations.
• To find the best-performing pattern for a more precise diagnosis, the decision function accuracy of the deep learning model is compared and contrasted.
With the above contributions the proposed work lays the foundation for the early detection of AD by identifying the most contributing features which lead to AD.
The remainder of the document has been methodized in the following manner. Section 2 of this article provides descriptions of the current referred literature in the area. Section 3 describes the data set used and the methods. In Section 4, experiments are described along with their results. Finally, in Section 5, the conclusions are drawn.
This section outlines the work of many authors on the subject of Alzheimer’s detection and highlights their major accomplishments and goals.
Authors Liu et al. [4] explored the correlation between different parts of the brain to detect MCI which is the starting symptom of AD. 90 Regions of Interest (ROI) per person were subjected to Automated Anatomical Labelling (ATLAS) and connected to form a hierarchical network. After selecting the textual features and scrutinizing the connectivity between the various regions, feature selection was done using Pearson’s Correlation and the MK-Boost S2 algorithm was applied thereafter for classification. The obtained results were cross-validated against the Alzheimer’s Disease Neuroimaging (ADNI) dataset.
Walker Land et al. [5] worked on analyzing whether the given patient is prone to Alzheimer’s or not by exploring the speech (vocabulary, pause indicators, pitch changes under different conditions, etc.) along with population tally and scores of a person on “Mini-Mental state exam”. The relevant feature vector selection was achieved by using a hybrid of the Genetic Algorithm, SVM, and General regression neural network (GRNN), preventing the expulsion of data fed into the Bayesian Network. Although the proposed method had a high accuracy score, the Bayesian network was not sensitive to missing data, which was critical for feature selection.
Tooba Altaf et al. [6] extracted textual features from three regions of the brain namely white matter, grey matter, and cerebrospinal fluid, which were optimized with the Bag of Words methods. The features were supplemented with features obtained from clinical data (acquired through various questionnaires). SVM, k-Nearest Neighbor (KNN), and Decision Tree, as well as an AdaBoost Ensemble, were given this hybrid feature set as input. The proposed work did not consider the additional regions from the brain which may also contribute to the result.
Albright [7] investigated the ADNI dataset as to how the past and current clinical data can correlate to predict the cognitive state of a person. To explore the effect of different biomarkers over the period, an innovative pre-processing algorithm called “All-Pairs” was introduced. Various machine-learning classifiers such as multilayer perceptron neural networks and RNN with seven-fold cross-validation were implemented for classification.
To identify Alzheimer’s and cognitively challenged individuals, Islam et al. [8] constructed a deep Convolutional Neural Network (CNN) that learns features from MRI images from the ADNI dataset. The applied pre-processing and data augmentation steps increased the efficiency of the classifier. The work lacked in including more biomedical features for more accurate detection.
Marghalani et al. [9] employed the Bag of Words Feature extraction model with SURF (Speeded-Up Robust Features), Scale-invariant feature transform (SIFT), or Histogram of Oriented Gradients (HOG) to identify interesting points, which were clustered using K-Means and then classified using SVM. The fixed grid size was used to locate the important points. However, it was observed that there will be reduced performance if the grid size is not fixed.
In their study, Rhodius-Meester et al. [10] combined different diagnostic tests and analyzed them to identify patients who are susceptible to clinical progression. The study was conducted on a large sample of patient data from two independent cohorts. In contrast to performing feature selection which would maximize the accuracy, they incorporated diagnostic tests and features which were familiar to practicing therapists. This approach concluded that analyzing such data and tests would indeed help clinicians to follow up with at-risk patients and discharge stable patients. However, the study was restricted to patients who currently visit the clinic but not to other general populations.
Khan et al. [11] reviewed and provided a comparison of different approaches. They determined that machine learning techniques yielded the best results and proposed a model using association rule mining after retrieving the best combination of attributes in the attribute selection step.
Arifoglu et al. [12] studied different variants of RNN to analyze activity recognition and detection of abnormal people in elderly people having Dementia. The study concluded that when compared to other popular classifiers such as SVM, Naive Bayes, and Hidden Markov Model, RNN performed better and was an apt choice for detecting abnormal activities.
Biju et al. [13] proposed a novel method in which MRI images of the brain were subjected to de-noising. 3D reconstruction and segmentation calculated the residual grey matter to white matter ratio of the brain. If the calculated proportion exceeded the normal thresholds (age group 20–45—1.1, 50–80—1.3, and above 60–1.5), the patient was diagnosed to be suffering from Alzheimer’s. Although the proposed approach outperformed existing methods in terms of diagnosis time and manual error reduction, it fell short in predicting the stage of AD and the extent to which the brain is impacted.
Thakare et al. [14] used the features such as median, mean, standard deviation, range, mode, skewness, kurtosis, and power spectral density of the Electroencephalogram (EEG) signals to classify if the person was suffering from Alzheimer or not. SVM offered a better accuracy in their study when compared to the Normalized Minimum Distance (NMD) classifier. They also created a tracking system to keep track of Alzheimer’s sufferers’ whereabouts.
Latha et al. [15] employed machine learning classifiers and pattern recognition on the MRI images obtained from the ADNI dataset to detect Alzheimer’s patients. These pre-processed and enhanced images were subjected to the region of interest detection wherein grey matter, cortex area, brain density, and white matter of the brain were analyzed. The authors aim to employ better classifiers like SVM with pre-processing techniques like Independent Component Analysis and Watershed principle to improve detection.
Bhagya Shree et al. [16] analyzed the data of neurophysiological tests which were subjected to many pre-processing techniques such as imbalance reduction and randomization. Feature selection was done using Wrapper Method and then classification was done with JRip Rule-based classifier. The authors aim at improving the resolution of disagreement when classifying by introducing better rules in the future.
Patro et al. [17] employed image processing to diagnose Alzheimer’s patients from their brain MRI scans. Interpolation and segmentation were employed to identify the regions of interest and then based on pixel intensity categorize the patient as normal or AD patients. More datasets to train machine learning and deep learning classifiers can be employed to improve the detection and do multiple detections at once.
Liu et al. [18] analyzed speech data to predict Alzheimer’s disease in earlier stages. The speech data was divided into different segments and was analyzed using different machine learning models. In their approach, the Logistic Regression model provided the best results.
In another study, Beltrán et al. [19] applied different machine learning algorithms to the ADNI dataset and determined that the Random Forest classifier and gradient boosting perform well for such analyses.
Venugopalan et al. [20] employed deep learning models on the ADNI dataset to categorize patients into MCI, AD, and controls. Their results prove that for the given data set deep learning models tend to perform better than shallow models. However, the sample size used for training the model was small, and strategies like transfer learning and domain adaptation can be explored to improve the technique.
The primary goal of the study conducted by Lee et al. [21] was to look into the prediction of Alzheimer’s disease patients using AD-related genes obtained from various datasets. To curate AD-related genes and discriminate AD patients, five feature selection methods and five classifiers were compared, respectively.
Pan et al. [22] proposed CNN-Ensemble Learning (EL) approach, a classifier ensemble developed by combining CNN and EL, to identify subjects with MCI or AD using MRI. To identify the brain regions with stronger discriminability, the classification performance needs to be improved with optimization methods and/or other deep learning models. The relatively low classification accuracy for MCIc (converter) vs. MCInc (non-converter) warrants further investigation.
The main goal in research curated by Helaly et al. [23] is to create a complete framework for Alzheimer’s disease early detection and medical image classification for different stages of AD. The authors employed classifiers like CNN and the Visual Geometry Group (VGG-19) in their study. Further, the authors aim to integrate MRI segmentation with data augmentation methods to highlight Alzheimer’s features before Alzheimer’s stage classifications.
AD is a progressive chronic neurodegenerative disorder that aggravates over time. It is one of the prominent forms of Dementia and ultimately progresses to the loss of bodily, social, and emotional functions and eventually death. The cause of Alzheimer’s is often not properly understood and often the clinical diagnosis is mistaken as a symptom of age. Thus, MCI [24,25] which is the initial stage of Dementia, is explored in our work to predict if such patients subsequently get affected by Alzheimer’s or not. Working with feature vectors such as demographics, neuroimaging data, cognitive evaluations, and so on, the proposed work aims to properly determine whether MCI develops into Alzheimer’s disease or is just a result of aging. Existing research in this area frequently relies on analyzing data from MRI scans of the brain, such as the ratio of grey matter to white matter [25]. However, this can fail in offering detection at the earliest stage, as studies show that the degeneration of white and grey matter can differ in different patient groups due to differences in their underlying pathobiology [26]. Many of the former approaches would ignore missing data or replace it with constant or mean values to remedy the problem. Due to its excellent performance in numerical datasets compared to other imputers [27], the KNN imputer has been used in this study. Moreover, the study has implemented various approaches to get different sets of results for comparison which is explained in detail in the next sections.
In this study, a deep learning multimodal neural network with different decision function classifiers is proposed to predict whether MCI progresses to AD or not. The datasets used for prediction contain records about each patient’s MRI, CSF, cognitive performance, and demographic data. The data containing these features is pre-processed and then analyzed using RNN with GRU. The idea is to build independent GRU units for learning the contribution of each feature and then combine the feature vectors from all GRU units to make the final prediction. However, during the parameter optimization phase of each GRU, a feature that does not contribute alone but contributes effectively when associated with other features is generally filtered out. To address this issue, a second GRU unit is added to the model, which is trained on value correlation. Pearson’s Correlation Coefficient method is applied here to find the strongly correlated features. For merging the feature vectors from individual GRUs, concatenation-based data integration is used [25,28]. The final layer consists of classifiers such as SVM, Decision Tree, Random Forest, and Ensemble as shown in Fig. 1.

Figure 1: Proposed GRU-RNN architecture with classification models
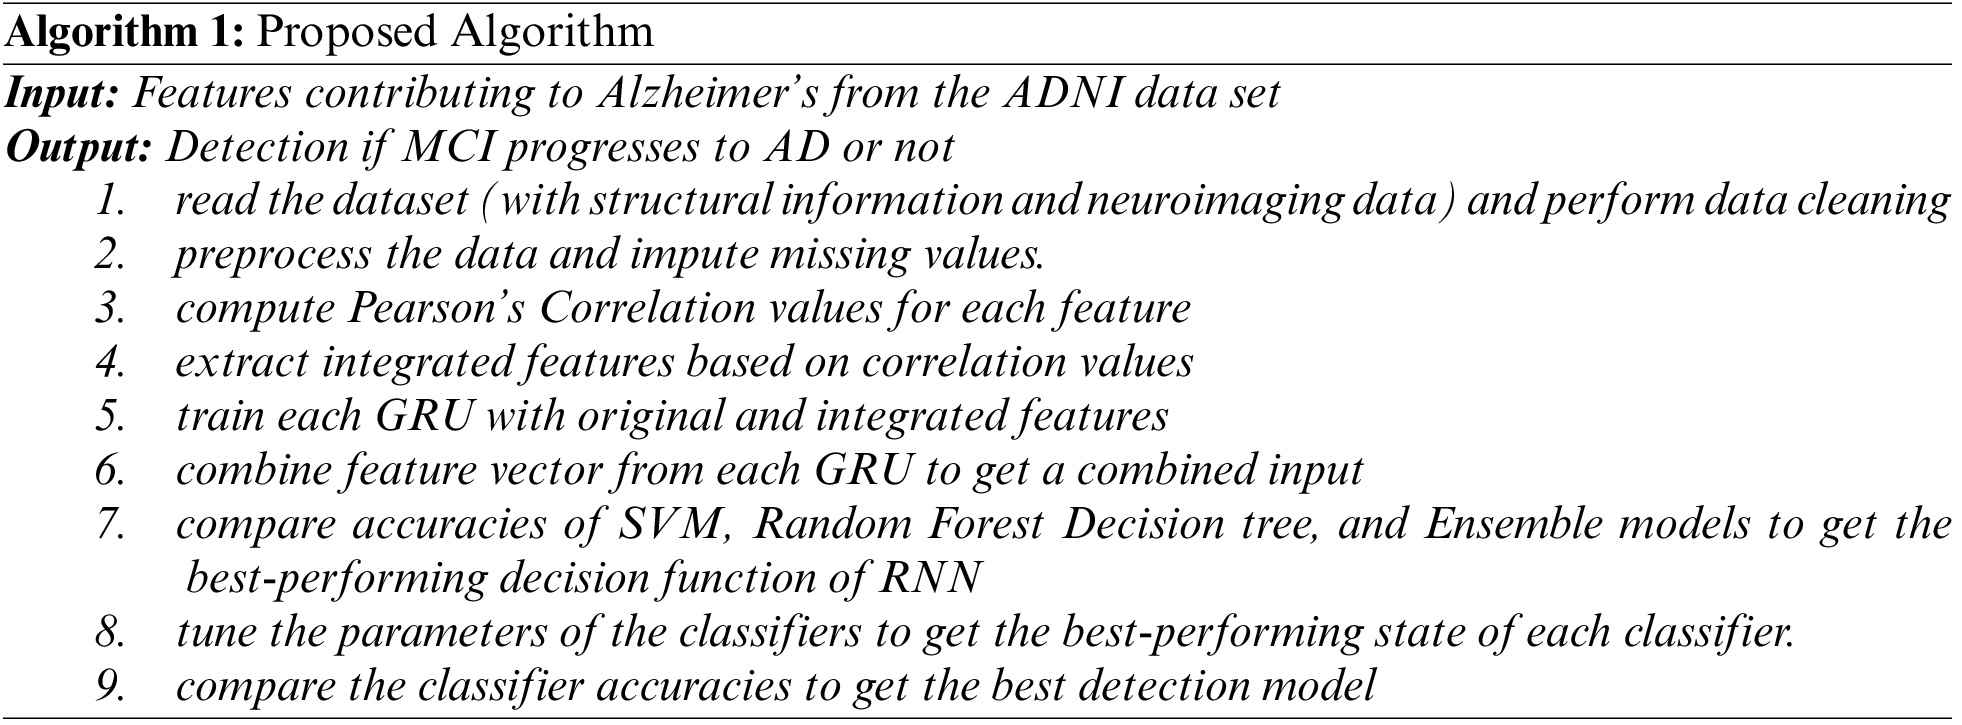
Algorithm 1 outlines the data processing procedures as well as the technique used to assess the hypothesized data model and architecture.
The data used in the preparation of this article were obtained from the ADNI database [29]. For this study, 4 datasets were taken into consideration which have been summarized in Table 2.

Cleaning, normalization, and missing value correction are all part of this process. Following pre-processing, it was discovered that the majority of patients who had progressed to the stage of Alzheimer’s disease were recognized in less than 48 months. As a result, clinical data from patients after this period was not considered for this study. Due to varying sample sizes, many values were missing from the datasets, i.e., the patient records found in one dataset did not exist in another. To handle this, KNN imputation is performed on the dataset to impute these missing values (0). KNN imputation relies on the KNN concept and finds the best-fit data for a missing value based on the points of data in the same position as it is Alzheimer’s in the dataset. Generally, for this imputation, the number of neighbors is the square root of the size of the dataset being used. However, the imputer was unable to fill in missing values for patients for whom fewer data was recorded, i.e., if there are more than three missing values in the row for a modal of a particular patient, the row is discarded as there are too fewer data for the missing values to be imputed. Additionally, the data was normalized within a range to eliminate any bias and make it easier to train the GRUs. To further balance the dataset, oversampling has been used to attain enough data for analyzing the combined approach. The use of KNN imputation coupled with oversampling helped to make up for missing values to a certain extent and keep the number of records enough for a meaningful prediction model to be trained based on relevant feature vectors.
After cleaning the dataset, the most important attributes must be mapped into feature vectors to feed into the classification algorithms. Before the feature vectors are calculated using GRU, to identify the most important features to compare the results against and to further understand how the different features might influence each other, Pearson’s correlation coefficient values are calculated. The results of this analysis have been tabulated in Table 3.

It was observed from prior research [25] that only age in demographic data contributed much to the analysis. So, demographic data was not taken as an individual feature vector. Further, based on the Pearson Coefficient values, it was decided not to use the patient’s years of education due to its negligible influence on the other features. Table 3 documents the initial correlation values obtained through Pearson’s Coefficient. Training of GRUs on the integrative values was influenced by these values in Table 3.
Once the data has been pre-processed and prepared, it is reshaped to three dimensions as GRUs only accept three-dimensional data. Then the data from each feature is normalized by an arbitrary value so that the values are closer to 0 which will help reduce any noise in the dataset. Keras is the Machine Learning (ML) library used in the implementation of the proposed work. The network consists of the input layer, the GRU layer, and the output layer. The input layer defines the size of the input. The GRU layer takes in data from the input layer and transforms it into sequential data. The output layer takes this sequential data and returns a list of uniform sizes which is the fixed-size feature vector of that observation. These steps are implemented for all the models and the respective feature vectors are generated. An optimization algorithm adjusts the weights and biases, and the internal cell states are updated accordingly. This process is recurrent until the neural network reaches the insisted accuracy or the best accuracy possible. Thereafter, the trained model can be utilized for binary classification of a given data to diagnose if the patient could have AD or not.
Table 4 lists correlation values for all features after they have been passed through a GRU. While most features have increased in correlation, a few may have decreased as well. The different integrative vectors used in the study were formulated based on the correlation results obtained in Tables 3 and 4.

3.5 Feature Vector Concatenation
To combine the result of the individual GRUs, concatenation-based data integration is used to get the final set feature vector. Based on the values obtained in Table 4 the combinations of feature vectors/attributes are used as the parameters for the different classification algorithms. The final result analysis is shown in Table 5. As observed in Fig. 2, the final feature vector is then used as an input to the prediction model to get the final output.


Figure 2: Concatenation-based data integration of GRU units [25]
For analysis, this section will discuss the different approaches which have been implemented for comparison and distinction.
The prediction results have been summarized in Table 5 for reference. The first set of results analyzes the classification results of the default datasets whose parameters have not been optimized. The second set of results analyzes the results after performing hyperparameter optimization (or hyperparameter tuning) on the individual datasets and concatenated feature vectors. This was achieved by using the GridSearchCV package that performs ‘grid search’ i.e., it evaluates all possible permutations and combinations to finally return a set of hyperparameters which allows the classification models to achieve higher accuracy. The last section summarizes the results of an ensemble model built using a combination of SVM, Random Forest, and Decision Tree classifiers. For brevity, Table 5 uses abbreviations for Sample Size (S), Accuracy (Acc), Precision (Prc), Recall (Rec), F1 Score (F1), Cohen-Kappa Score (CK), and Hyperparameter Tuning (HT).
4.2 Prediction Results Without Hyperparameter Tuning
In the first three approaches, when the GRUs were trained with individual datasets and thereafter tested for prediction, the results for all metrics indicate that the CSF biomarkers (Pheno Dataset) gave the best performance, followed by the datasets containing MRI and cognitive performance data. However, it should be noted that the lower number of usable samples in the Pheno Dataset possibly could have been attributed to the high performance. The number of false positives and false negatives is less when analyzed with the Pheno data set. However, MRI data gave a smaller number of false positives and cognitive data gave a smaller number of false negatives. However, neutralizing the same with F1-Score, MRI data outperformed the cognitive data. These sets of results portray the importance of each data which cannot be quantified by one metric alone.
The 4th approach combines CSF, MRI, cognitive performance data, and demographic data (age and APOE4). This approach implemented the KNN imputer to fill in missing values as well as oversampling to further balance the dataset. The prediction results which were achieved were 81.63% using the Decision Tree, 88.13% using SVM, and 91.52% using the Random Forest classifier.
In the 5th approach, age was removed from consideration in the training data. In comparison to the 4th approach, the performance of the Decision Tree reduced marginally to 79.59% accuracy and those of SVM and Random Forest reduced to 83.89% and 90.67% accuracy, respectively.
In the 6th approach, the demographic data is completely removed from consideration. The performance of the Decision tree classifier marginally increased (82% accuracy) but those of SVM and Random Forest remained at 83.89% and dropped to 87.28% accuracies, respectively.
The 4th strategy similarly shows less misclassification of false positives and false negatives. F1-Scores were similar for approaches 5 and 6. Thus, the observed results indicate that the 4th strategy, which combines CSF, MRI, data on cognitive function, and demographic information (age and APOE4), is the best one for further research and categorization. Last but not least, the 4th approach’s highest cohen kappa score demonstrates that the proposed combination’s conclusions are quite credible.
4.3 Prediction Results Using Optimized Hyperparameters
As shown in Table 5, the use of optimized hyperparameters has led to a general increase in the performance of metrics of all the models, except in the datasets of Pheno and Pheno + MRI + COG where the default parameters yielded the optimal performance (the same results were obtained for both the cases). The optimized hyperparameters improved the model’s ability to capture complex relationships such as implicit correlations between the features and the outcomes.
For every dataset and combination vector, the Random Forest classifier outperformed SVM and Decision Tree in terms of outcomes. Its capacity to manage intricate, high-dimensional data with numerous attributes is what accounts for its increased performance in our method.
Based on the increase in accuracy as observed in Table 5, the tuned parameters are considered for further prediction purposes
4.4 Prediction Results of Ensemble Model
An ensemble model is a combination of different models which helps in the prediction process by overcoming the technical challenges of individual models such as high variance, low accuracy as well feature noise, and bias. For further analysis, an ensemble model has also been implemented using SVM, Random Forest, and Decision Tree models as base estimators. From the previous results, we can see that for a few sets of combinations, certain classification algorithms, works better than other. The idea is to collect predictions from each model and combine them to build a final ensemble model. The ensemble then studies the percentage of accuracy of each model against different combinations and applies the best results for each set. In this study, the ensemble technique of stacking has been implemented to produce robust predictors. Table 6 lists the outcomes of the predictions made using the ensemble model that was used. The proposed ensemble approach outperforms individual classifiers on all measures. This can be explained by the fact that it detects more nuanced connections in the data while still avoiding overfitting. The decision tree falls short in capturing such complicated associations, random forests are difficult to comprehend, particularly when learning from minority samples, and SVM is only effective with a small feature space, which might lead to bias in the model if the dataset is unbalanced. The ensemble technique overcomes all of the constraints of these individual methods, resulting in improved performance. The inferences from current deep-learning techniques that have achieved substantial advancements in Alzheimer’s detection are summarized in Table 7.


4.5 Summary of Classifiers Performances
The confusion matrix in Fig. 3 summarizes the classifiers’ performances.

Figure 3: Confusion matrices of different models on various combinations of the dataset
This section will analyze the classifier’s performances on Cognitive, MRI, Pheno, Cognitive + Pheno + MRI, Cognitive + Pheno + MRI + APOE4, and Cognitive + Pheno + MRI + APOE4 + Age respectively. Confusion Matrices obtained for various test cases of our experiment (post hyperparameter tuning) are picturized in Fig. 3. As seen in Fig. 3, the Ensemble model for the Cognitive + Pheno + MRI + APOE4 + Age combo data set had the fewest false positives and false negatives. Thus, the acquired results support our initial premise that multimodal techniques that capture the complexities and relationships within the data set are preferable to single modality for high-intensity tasks like the detection of complicated diseases like Alzheimer’s.
Based on the results, it can be observed that the Random Forest classifier outperformed SVM and Decision Tree classifiers in every approach that was implemented which agrees with the conclusions published by Beltrán et al. [19]. The performance of SVM and Decision Tree was overall comparable where one outperformed the other based on the dataset or approach used. The Ensemble model, however, can be considered the best model for the accuracy of prediction as it combines all three models.
With regards to the effect of the features, it seems that age has a comparable impact on the performances of the Decision Tree, SVM, and Random Forest. After the removal of demographic data completely, the accuracy of the Decision Tree classifier marginally increased but that of SVM and Random Forest were adversely affected. The data correlation analysis using Pearson’s coefficient reveals that age is correlated to MRI data while APOE4 is strongly correlated to MRI data and CSF biomarkers. However, the use of the demographic data in a concatenated and educated feature vector does not seem to improve the accuracy of the classifiers by much. In other words, although demographic data does have a significant correlation to CSF biomarkers, cognitive performance, and MRI data, its direct use in the GRU training step has a low impact on the final prediction. The concatenated feature vector which contained educated data from CSF biomarkers, MRI, and cognitive performance data yielded the optimal results. Thus, with adequate data till 48 months after their initial visit, the implemented network can help determine which patients are susceptible to AD for doctors to review and reach an early conclusive diagnosis.
4.7 Relevance and Importance of the Study
The complex neurobiological changes that take place in Alzheimer’s disease can be better understood by combining numerous aspects, such as CSF biomarkers, MRI, and cognitive tests, than by evaluating each component separately (AD). A single biomarker or imaging technique cannot capture all the changes that take place as the disease progresses since AD is a complex illness.
Combining numerous features for analysis can be used to analyze the efficacy of therapies, find early indicators of AD, and monitor disease progression. Additionally, it can decrease false positives or negatives that could happen when studying isolated features and improve the accuracy of diagnosis. Such studies can uncover patterns of changes that are unique to AD and distinguish them from changes that occur in normal aging or other forms of Dementia. For instance, a combination of indicators, such as elevated tau protein levels in the CSF, alterations in particular brain regions seen on MRI, and decreases in cognitive performance may be more distinctive for AD than any one of these characteristics alone.
The proposed study uncovers such indicators to improve detection. Thus, the incorporation of the correlation of characteristics as distinct modalities can enhance the identification of MCI to AD development by offering a more complete and accurate collection of biomarkers that enhance the sensitivity and specificity of the models.
In this study, various approaches have been implemented using GRUs and classifiers to predict the progression of MCI to AD. Accounting for and effectively dealing with missing values was incorporated using the KNN imputation method. The effect that every feature has on each other has been analyzed using Pearson’s Coefficient values and the implementations have led to the analysis of the effect of single-modal data as well as multi-modal data to determine Alzheimer’s disease in a patient. The greatest contribution of this work is that although individual features do not contribute to the apt detection of the disease, this will take advantage of the correlation amongst features (combined feature strength) to make the detection better instead of ignoring such features in the parameter optimization stage. An early diagnosis will ensure that doctors can prepare an effective treatment plan for their patients to delay the progression of the disease and effectively provide better palliative care. In the future, the prediction results may be used as a separate input to further optimize the processing of training data which may, in turn, provide better accuracy. Also, various other correlation techniques can be explored to improve integrative data analysis. Further approaches for analyzing brain images or MRI scans [33–35] to include relevant data from the analysis with the current data can be investigated. This image data can be used as a modality while developing newer models.
Acknowledgement: We thank Dr. Sucheta Kolekar, Associate Professor, Department of Information & Communication Technology, Manipal Institute of Technology, Manipal, Karnataka for her expert advice.
Funding Statement: No funding was received for this work.
Conflicts of Interest: The authors declare that there is no conflict of interest regarding the publication of this paper.
References
1. S. A. Gale, D. Acar and K. R. Daffner, “Dementia,” The American Journal of Medicine, vol. 131, no. 10, pp. 1161–1169, 2018. [Google Scholar] [PubMed]
2. Alzheimer’s Association, “2019 Alzheimer’s disease facts and figures,” Alzheimer’s & Dementia, vol. 15, no. 3, pp. 321–387, 2019. [Google Scholar]
3. A. Hammoud, M. Deriaz and D. Konstantas, “Wandering behaviors detection for Dementia patients: A survey,” in 2018 3rd Int. Conf. on Smart and Sustainable Technologies (SpliTech), Split, Croatia, pp. 1–5, 2018. [Google Scholar]
4. J. Liu, M. Li, W. Lan, F. Wu, Y. Pan et al., “Classification of Alzheimer’s disease using whole Brain hierarchical network,” IEEE/ACM Transactions on Computational Biology and Bioinformatics, vol. 15, no. 2, pp. 624–632, 2018. [Google Scholar] [PubMed]
5. W. H. Land and J. D. Schaffer, “A machine intelligence designed Bayesian network applied to Alzheimer’s detection using demographics and speech data,” Procedia Computer Science, vol. 95, pp. 168–174, 2016. [Google Scholar]
6. T. Altaf, S. M. Anwar, N. Gul, M. N. Majeed and M. Majid, “Multi-class Alzheimer’s disease classification using image and clinical features,” Biomedical Signal Processing and Control, vol. 43, pp. 64–74, 2018. [Google Scholar]
7. J. Albright, “Forecasting the progression of Alzheimer’s disease using neural networks and a novel preprocessing algorithm,” Alzheimer’s & Dementia: Translational Research & Clinical Interventions, vol. 5, pp. 483–491, 2019. [Google Scholar]
8. J. Islam and Y. Zhang, “Deep convolutional neural networks for automated diagnosis of Alzheimer’s disease and mild cognitive impairment using 3D brain MRI,” Brain Informatics, vol. 11309, pp. 359–369, 2018. [Google Scholar]
9. B. F. Marghalani and M. Arif, “Automatic classification of brain tumor and Alzheimer’s disease in MRI,” Procedia Computer Science, vol. 163, pp. 78–84, 2019. [Google Scholar]
10. H. F. M. Rhodius-Meester, H. Liedes, J. Koikkalainen, S. Wolfsgruber, N. Coll-Padros et al., “Computer-assisted prediction of clinical progression in the earliest stages of AD,” Alzheimer’s & Dementia: Diagnosis, Assessment & Disease Monitoring, vol. 10, pp. 726–736, 2018. [Google Scholar]
11. A. Khan and M. Usman, “Early diagnosis of Alzheimer’s disease using machine learning techniques: A review paper,” in 7th Int. Joint Conf. on Knowledge Discovery, Knowledge Engineering and Knowledge Management (IC3K), Lisbon, pp. 380–387, 2015. [Google Scholar]
12. D. Arifoglu and A. Bouchachia, “Activity recognition and abnormal behaviour detection with recurrent neural networks,” Procedia Computer Science, vol. 110, pp. 86–93, 2017. [Google Scholar]
13. K. S. Biju, S. Alfa, K. Lal, A. Antony and M. K. Akhil, “Alzheimer’s detection based on segmentation of MRI image,” Procedia Computer Science, vol. 115, pp. 474–481, 2017. [Google Scholar]
14. P. Thakare and V. R. Pawar, “Alzheimer disease detection and tracking of Alzheimer patient,” in Int. Conf. on Inventive Computation Technologies (ICICT), Coimbatore, pp. 1–4, 2016. [Google Scholar]
15. M. Latha and S. Arun, “Detection of ROI for classifying Alzheimer’s disease using Mr. image of brain,” International Journal of Innovative Technology and Exploring Engineering (IJITEE), vol. 8, no. 5, pp. 740–745, 2019. [Google Scholar]
16. S. R. Bhagya Shree, H. S. Sheshadri and Muralikrishna, “Diagnosis of Alzheimer’s disease using rule-based approach,” Indian Journal of Science and Technology, vol. 9, no. 13, pp. 1–6, 2016. [Google Scholar]
17. S. Patro and N. V. M., “Early detection of Alzheimer’s disease using image processing,” International Journal of Engineering Research & Technology (IJERT), vol. 8, no. 5, 2019. [Google Scholar]
18. L. Liu, S. Zhao, H. Chen and A. Wang, “A new machine learning method for identifying Alzheimer’s disease,” Simulation Modelling Practice and Theory, vol. 99, 2020. [Google Scholar]
19. J. F. Beltrán, B. M. Wahba, N. Hose, D. Shasha and R. P. Kline, “Inexpensive, non-invasive biomarkers predict Alzheimer transition using machine learning analysis of the Alzheimer’s disease neuroimaging (ADNI) database,” PLoS One, vol. 15, no. 7, 2020. [Google Scholar]
20. J. Venugopalan, L. Tong, H. R. Hassanzadeh and M. D. Wang, “Multimodal deep learning models for early detection of Alzheimer’s disease stage,” Scientific Reports, vol. 11, no. 10, pp. 1–13, 2021. [Google Scholar]
21. T. Lee and H. Lee, “Prediction of Alzheimer’s disease using blood gene expression data,” Scientific Reports, vol. 10, no. 10, pp. 1–13, 2020. [Google Scholar]
22. D. Pan, A. Zeng, L. Jia, Y. Huang, T. Frizzell et al., “Early detection of Alzheimer’s disease using magnetic resonance imaging: A novel approach combining convolutional neural networks and ensemble learning,” Frontiers in Neuroscience, vol. 14, no. 259, 2020. [Google Scholar]
23. H. A. Helaly, M. Badawy and A. Y. Haikal, “Deep learning approach for early detection of Alzheimer’s disease,” Cognitive Computation, vol. 14, pp. 1711–1727, 2021. [Google Scholar] [PubMed]
24. H. X. Tan and H. P. Tan, “Early detection of mild cognitive impairment in elderly through IoT: Preliminary findings,” in IEEE 4th World Forum on Internet of Things (WF-IoT), Singapore, pp. 207–212, 2018. [Google Scholar]
25. G. Lee, K. Nho, B. Kang, S. Kyung-Ah and K. Dokyoon, “Predicting Alzheimer’s disease progression using multi-modal deep learning approach,” Scientific Reports, vol. 9, no. 1952, 2019. [Google Scholar]
26. H. Jang, H. Kwon, J. J. Yang, J. Hong, Y. Kim et al., “Correlations between gray matter and white matter degeneration in pure Alzheimer’s disease, pure subcortical vascular Dementia, and mixed Dementia,” Scientific Reports, vol. 7, no. 9541, 2017. [Google Scholar]
27. A. Jadhav, D. Pramod and K. Ramanathan, “Comparison of performance of data imputation methods for numeric dataset,” Applied Artificial Intelligence, vol. 33, no. 10, pp. 913–933, 2019. [Google Scholar]
28. A. F. Agarap, “A neural network architecture combining gated recurrent unit (GRU) and support vector machine (SVM) for intrusion detection in network traffic data,” in Proc. of the 2018 10th Int. Conf. on Machine Learning and Computing, New York, USA, pp. 26–30, 2018. [Google Scholar]
29. M. W. Weiner, Alzheimer’s Disease Neuroimaging Initiative, ADNI, 2004. [Online]. Available: https://adni.loni.usc.edu/ [Google Scholar]
30. J. Li, B. Song and C. Qian, “Diagnosis of Alzheimer’s disease by feature weighted-LSTM: A preliminary study of temporal features in brain resting-state fMRI,” Journal of Integrative Neuroscience, vol. 21, no. 2, 2022. [Google Scholar]
31. Q. Pan, S. Wang and J. Zhang, “Prediction of Alzheimer’s disease based on bidirectional LSTM,” Journal of Physics: Conference Series, vol. 1187, no. 5, pp. 052030, 2019. [Google Scholar]
32. T. Jo, K. Nho and A. J. Saykin, “Deep learning in Alzheimer’s disease: Diagnostic classification and prognostic prediction using neuroimaging data,” Frontiers in Aging Neuroscience, vol. 11, pp. 220, 2019. [Google Scholar] [PubMed]
33. M. Amini, M. M. Pedram, A. Moradi and M. Ouchani, “Diagnosis of Alzheimer’s disease severity with fMRI images using robust multitask feature extraction method and convolutional neural network (CNN),” Computational and Mathematical Methods in Medicine, vol. 2021, Article ID 5514839, 2021. [Google Scholar]
34. A. B. Tufail, K. Ullah, R. A. Khan, M. Shakir, M. A. Khan et al., “On improved 3D CNN-based binary and multiclass classification of Alzheimer’s disease using neuroimaging modalities and data augmentation methods,” Journal of Healthcare Engineering, vol. 2022, Article ID 1302170, 2022. [Google Scholar]
35. M. Sethi, S. Ahuja, S. Rani, P. Bawa and A. Zaguia, “Classification of Alzheimer’s disease using Gaussian-based Bayesian parameter optimization for deep convolutional LSTM network,” Computational and Mathematical Methods in Medicine, vol. 2021, 2021. [Google Scholar]
Cite This Article
 Copyright © 2023 The Author(s). Published by Tech Science Press.
This work is licensed under a Creative Commons Attribution 4.0 International License , which permits unrestricted use, distribution, and reproduction in any medium, provided the original work is properly cited.
 Downloads
 Citation Tools