
 Submit a Paper
 Propose a Special lssue
 Open Access
ARTICLE

QoS-Aware Cloud Service Optimization Algorithm in Cloud Manufacturing Environment
1 School of Information Engineering, Quzhou College of Technology, Quzhou, 324000, China
2 School of Computer Science and Technology, Zhejiang University of Technology, Hangzhou, 310023, China
3 Department of Natural and Computing Science, University of Aberdeen, Scotland, Aberdeen, AB243FX, UK
* Corresponding Author: Wenlong Ma. Email:
Intelligent Automation & Soft Computing 2023, 37(2), 1499-1512. https://doi.org/10.32604/iasc.2023.030484
Received 27 March 2022; Accepted 24 June 2022; Issue published 21 June 2023
 View Full Text
 Download PDF
Abstract
In a cloud manufacturing environment with abundant functionally equivalent cloud services, users naturally desire the highest-quality service(s). Thus, a comprehensive measurement of quality of service (QoS) is needed. Optimizing the plethora of cloud services has thus become a top priority. Cloud service optimization is negatively affected by untrusted QoS data, which are inevitably provided by some users. To resolve these problems, this paper proposes a QoS-aware cloud service optimization model and establishes QoS-information awareness and quantification mechanisms. Untrusted data are assessed by an information correction method. The weights discovered by the variable precision Rough Set, which mined the evaluation indicators from historical data, providing a comprehensive performance ranking of service quality. The manufacturing cloud service optimization algorithm thus provides a quantitative reference for service selection. In experimental simulations, this method recommended the optimal services that met users’ needs, and effectively reduced the impact of dishonest users on the selection results.Keywords
As a new type of networked manufacturing, cloud manufacturing utilizes network and cloud manufacturing service platforms to organize online manufacturing resources (manufacturing clouds) that meet user needs, thus providing users with various types of on-demand manufacturing services [1]. Therefore, the manufacturing cloud service deployed on the network contains an abundant amount of information. Many manufacturing cloud services have the same or similar functions, but vary in their service quality. Users naturally want to select the service(s) offering the highest quality of service (QoS) [2–5]. The optimization of QoS-based services must solve two simultaneous problems: 1) describing, quantifying, and monitoring the QoS attributes of manufacturing cloud services, 2) efficiently selecting the optimal service that meets the QoS requirements of the user among a number of similar services. The first problem can be approached through real-time sampling, detection, user feedback, or historical data obtained through data mining [6–9]; the second problem requires comprehensive consideration of various QoS performance indicators of the service, and evaluation of their importance. Finally, a flexible multi-indicator decision is made following a certain strategy, and the final solution is returned after ranking and selecting the decisions [10–12].
In fact, the QoS experience reported by users is sometimes inconsistent with the QoS information provided by the manufacturing cloud service registry. In some cases, this inconsistency is significant [13–16]. On the one hand, some service providers driven by self-interest may deliberately exaggerate their QoS. On the other hand, not all users leave honest evaluations of the service execution results. Some users deliberately talk-up or talk-down the QoS, leaving good or bad reviews about the service provider’s honesty with malicious intent. These situations mainly occur because the QoS value provided by service registries lacks the corresponding honesty measurements and an information correction mechanism.
In the present paper, the abovementioned problems are resolved by a QoS-aware cloud service optimization model that meets the specific needs of a manufacturing industry in the cloud-manufacturing environment. First, the collection, quantification, and information correction methods of QoS evaluation indicators suitable for cloud-manufacturing businesses are discussed. Next, the weights of various evaluation indicators are obtained from a large numbers of historical data records through a variable precision rough set. These weights are combined with the preset evaluation indicator weights of users with specific business needs and personal preferences. Finally, multi-indicator decisions are made by mining the weights of the indicators, thereby finding the optimal service to recommend to users.
The main contributions of this paper are summarized as follows:
1) A novel QoS information model of manufacturing cloud services accommodating the characteristics of the manufacturing industry is proposed.
2) A QoS information correction method that effectively reduces the influence of untrusted data on the selection results is proposed.
3) Theoretical and experimental analyses confirm the effectiveness of the proposed optimization algorithm for manufacturing cloud services, and the objectiveness of the proposed variable precision rough set weight method.
The rest of this paper is organized as follows. In Section 2, we give an overview of relevant work. Section 3 illustrates QoS-information awareness and quantification mechanisms. A QoS-aware cloud service optimization model are given in Section 4. In Section 5 we present the main implementation and the experiment to verify the efficiency of our method. This is followed by Conclusions and Future Work in Section 6.
Optimization of manufacturing cloud services has followed two main research directions: a. finding appropriate resources that match the functional description, b. finding appropriate resources based on non-functional descriptions. In the first approach, the search is completed when the detailed functional description of the manufacturing resource matches the required resource functions. This approach is suitable when initially searching the service. The second approach intends to satisfy the functional requirements of the service to determine the best service based on certain non-functional requirements. The best manufacturing resources are found by matching the service quality and resource requirements of many similar services. In a non-functional resource search, Zhou et al. [17] proposed that both the resource service management QoS and network performance QoS should be comprehensively considered in the manufacturing grid QoS evaluation. They also proposed a QoS evaluation model with 11 indicators, including time and price. Liu et al. [18] proposed an extensible calculation model based on general QoS and special QoS attributes. Yau et al. [19] proposed a QoS sorting algorithm based on user satisfaction alone, without considering the weights of the QoS attributes. Tao et al. [20] proposed a non-functional QoS evaluation method and a resource service optimization algorithm for manufacturing-resource services. Their method constructs an intuitionistic fuzzy set, combining intuitionistic fuzzy set theory and its corresponding operation rules.
The reliability of QoS data has attracted many researchers of Web services. Xu et al. [21] measured the reliability of each user in a cloud service-selection framework based on user reputation, and proposed a novel calculation method of user reputation. Xiong [22] considered the impact of similarity among users, and proposed a peer trust model that evaluates the reliability of users. Wang et al. [23] assessed service reputation by feedback verification, confirmation, and feedback tests. A trust framework that enables services to build reliable trust relationships has also been proposed [24,25].
As indicated above, QoS-aware selection of Web services has been studied from many perspectives, providing valuable references for selecting manufacturing cloud services. However, unlike Web services, manufacturing cloud services must abide by certain special requirements of the industry. The research object of Web services is developing computing and software resources. Manufacturing cloud services must provide not only the computing and software resources, but also other manufacturing resources and manufacturing capabilities. To cope with the large number of complex manufacturing services, the description model of the QoS information should differ from that of Web services. Using a non-functional description method, the present model attempts to improve the effectiveness of optimization models for cloud manufacturing services.
3 QoS Awareness and Information Correction of Manufacturing Cloud Services
3.1 QoS-aware Model of Manufacturing Cloud Services
In this paper, manufacturing cloud services are divided into hardware and software cloud services. Hardware cloud services produce and manufacture the equipment, whereas software cloud services deliver the software resources. To develop a QoS-aware model for manufacturing cloud services, we first define the information of the manufacturing cloud service.
Definition 1. The QoS information of a manufacturing cloud service S can be modeled as
The reliability of the service (
3.2 QoS Information Correction
In the proposed method, dishonest evaluations are detected by a monitor placed in the cloud manufacturing service platform, which collects, checks, and verifies the feedback data of users. Data which are too large or too small, which likely represent the malicious attack data, are filtered out. Whether data represent a malicious attack is judged by user collaborative filtering. Evaluations given by the same users using the same services are expected to vary only slightly.
Suppose that user X and user
The above method gives the set of users
The final evaluation of the users, given by
3.3 Collection and Quantification of QoS Information
The comprehensive QoS indicators of manufacturing cloud services are derived from the historical records of each evaluation indicator. The collection sources can be divided into two categories: QoS indicators of the network performance of the software cloud services (such as service computing time and network transmission delay), and QoS indicators of the manufacturing resources of hardware cloud services. The former can be extracted from the QoS database of the corresponding cloud manufacturing service platform, and the latter are generally provided by users (service providers, service users and platform operators) of the cloud manufacturing platform. The price of outsourcing, transportation, and other services can be directly obtained from the user input values on the manufacturing service platform.
Let
To comprehensively evaluate a cloud service, we must quantify the individual QoS indicators. As different QoS attributes have very different values and measurement units, they cannot be directly calculated. Instead, their values must be normalized to facilitate the multi-objective decision-making. This paper uses the following unified quantitative utility function [26]:
where
4 QoS-Based Manufacturing Cloud Service Optimization Model
To optimize a manufacturing cloud service, the performance of each QoS indicator of the service must be comprehensively considered, and the indicators must be weighted by their importance. This problem constitutes a typical multi-objective decision problem. Commonly, the weight ratio is calculated between the decision factors in the decision analysis and the weight calculation. The weights are calculated by the analytic hierarchy process or a similar method [27,28]. As these methods input the values of artificial experiences, their decision outputs are strongly subjective. To improve the objectivity, this paper calculates the decision factors by rough set (Rough Set, RS) theory. The RS is weighted by the importance of the attributes of each decision condition, which can be analyzed directly from the historical data records.
4.1 Attribute Weight Calculation of RS with Variable Precision
Before applying RS theory, we must cluster the QoS attribute values of each manufacturing cloud service. This paper adopts the
Let the tetrad
Definition 2. Let X and Y be non-empty subsets in a finite domain. If
where
In the information decision-making system of QoS, this paper sets
Definition 3. Given a
The positive region
Definition 4. The information amount of a conditional attribute [30] reflects the ability of the attribute to classify data objects. The greater the amount of information, the stronger is the ability to classify objects. The information amount of conditional attribute
where
Definition 5. The dependency degree [30] of a conditional attribute reflects the dependency degree of the decision-attribute classification of that attribute. The greater the dependency degree, the more critical is the attribute. In this paper, the dependency degree of conditional attribute
The information amount and dependency of conditional attributes represent different aspects of the attribute importance, and must be comprehensively evaluated. In this paper, both aspects are considered equally important. The dependence and information amount of each attribute, calculated by Eqs. (12) and (13) respectively, provide scattered information. This information must then be normalized to give the importance (weight) of the conditional attribute. This article proposes the following normalization method:
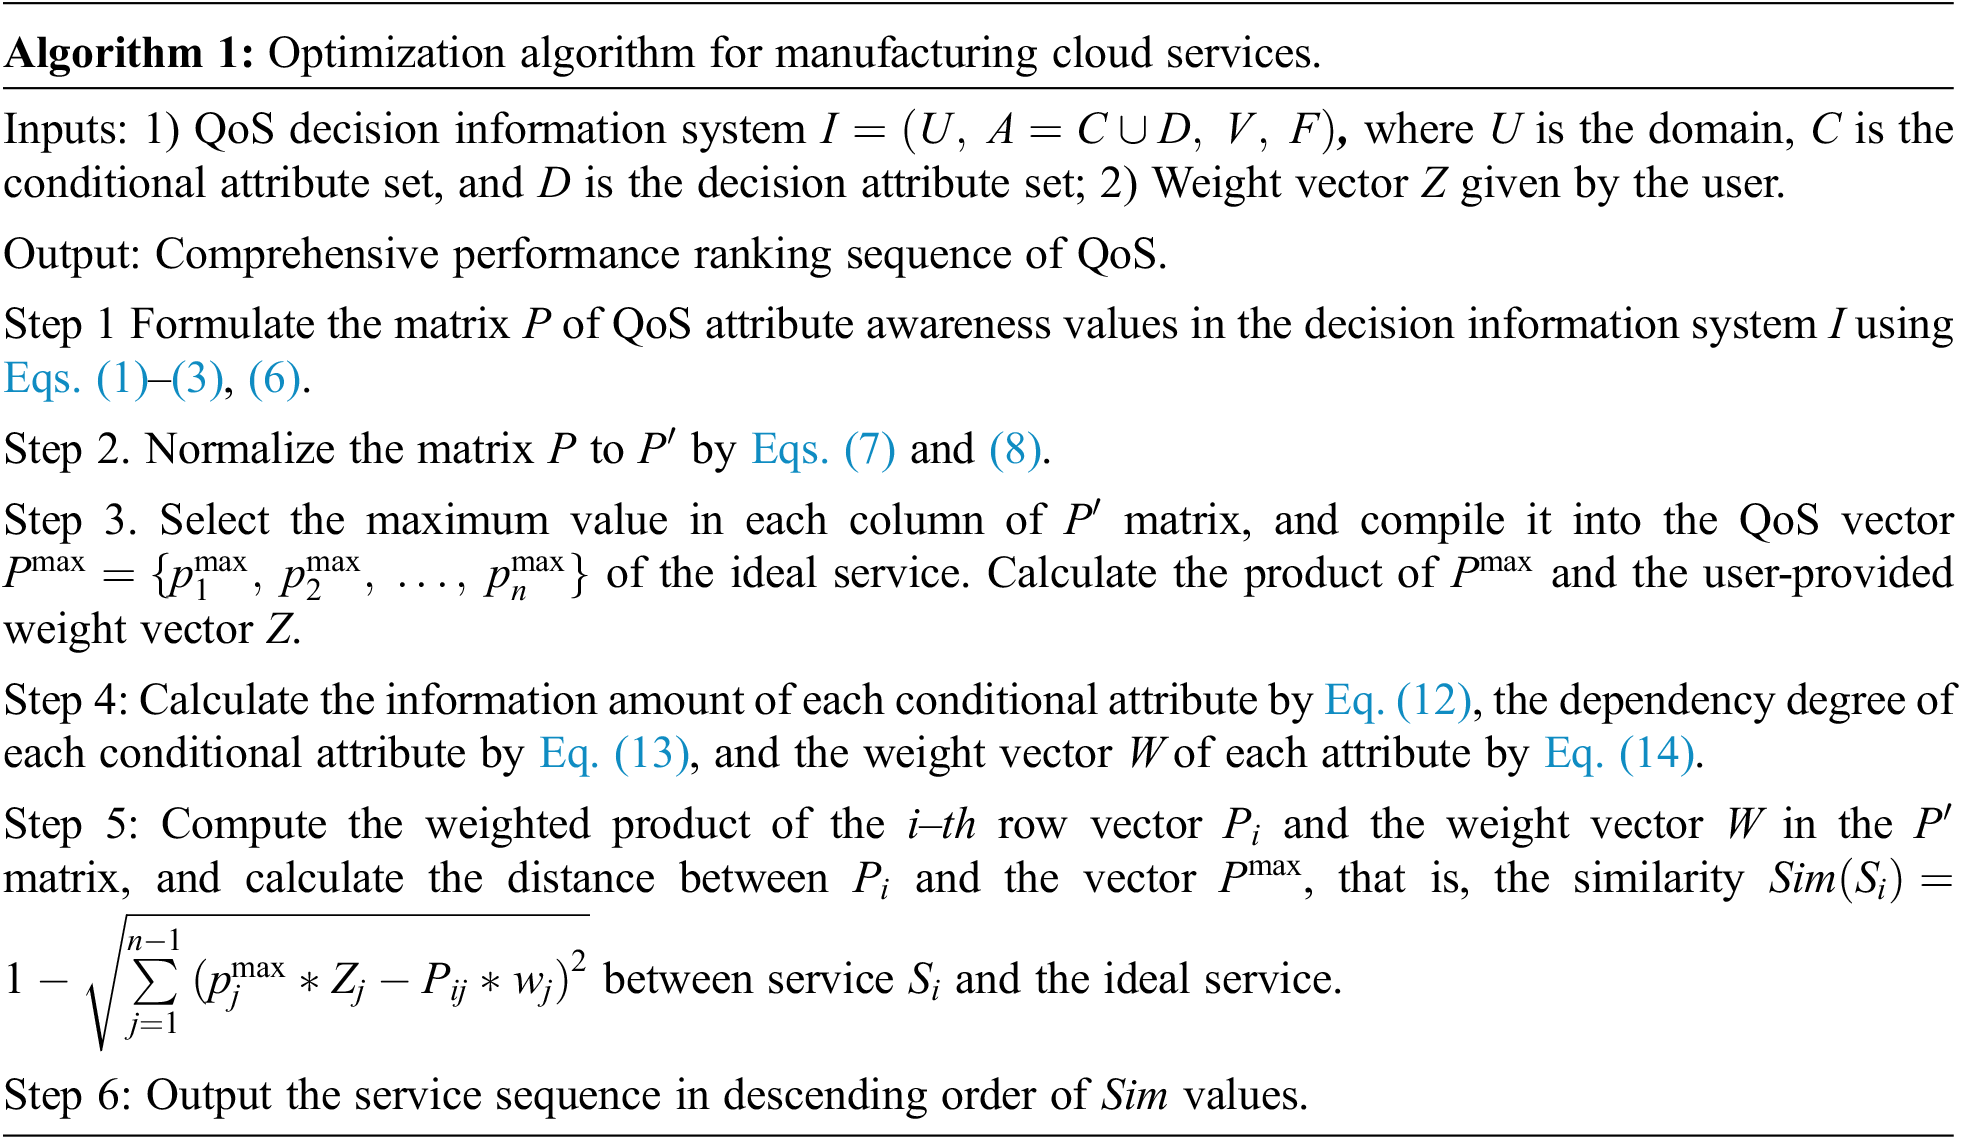
4.2 Optimization Algorithm of the Manufacturing Cloud Service
Let
5 Experimental Procedure and Results
Assisted by the telecom cloud computing platform, a prototype of the cloud manufacturing service test platform was designed using jdkl5+MyEclipse2019.4.0 as the Integrated Drive Electronics development environment, Tomcat 8.5 as the server, and MySQL 8.0 and Sybase16.0 as the database and its design tools, respectively. The call of computer nodes to cloud manufacturing service platform services was simulated in Mpiblast, a common distributed application software. Because the description and definition of manufacturing cloud services are highly autonomous and diverse, no common service benchmark database has been recognized by the vast majority of scholars. Therefore, a standard test set is currently lacking. Most service-selection tests of manufacturing cloud services instead use randomly generated test data. The cloud manufacturing service test platform established in this paper includes 1200 manufacturing cloud services for testing.
As an example, we consider production by a door handle manufacturer. The final production process is electroplating the door handle To meet the production requirements, 2,0000 door handles must be electroplated within 20 days. The manufacturer publishes these requirements to the cloud manufacturing service platform. The QoS attribute value of each service is extracted from the service platform QoS database. After receiving a service request, the platform-related module queries the hardware cloud service resource library in the manufacturing cloud pool. Suppose that five similar hardware cloud services in the pool can meet the functional requirements of the manufacturer. The manufacturer bases its decision on the cost, time, reliability, availability, and honesty indicators of the five services. The services and their QoS indicator values are listed in Table 1.
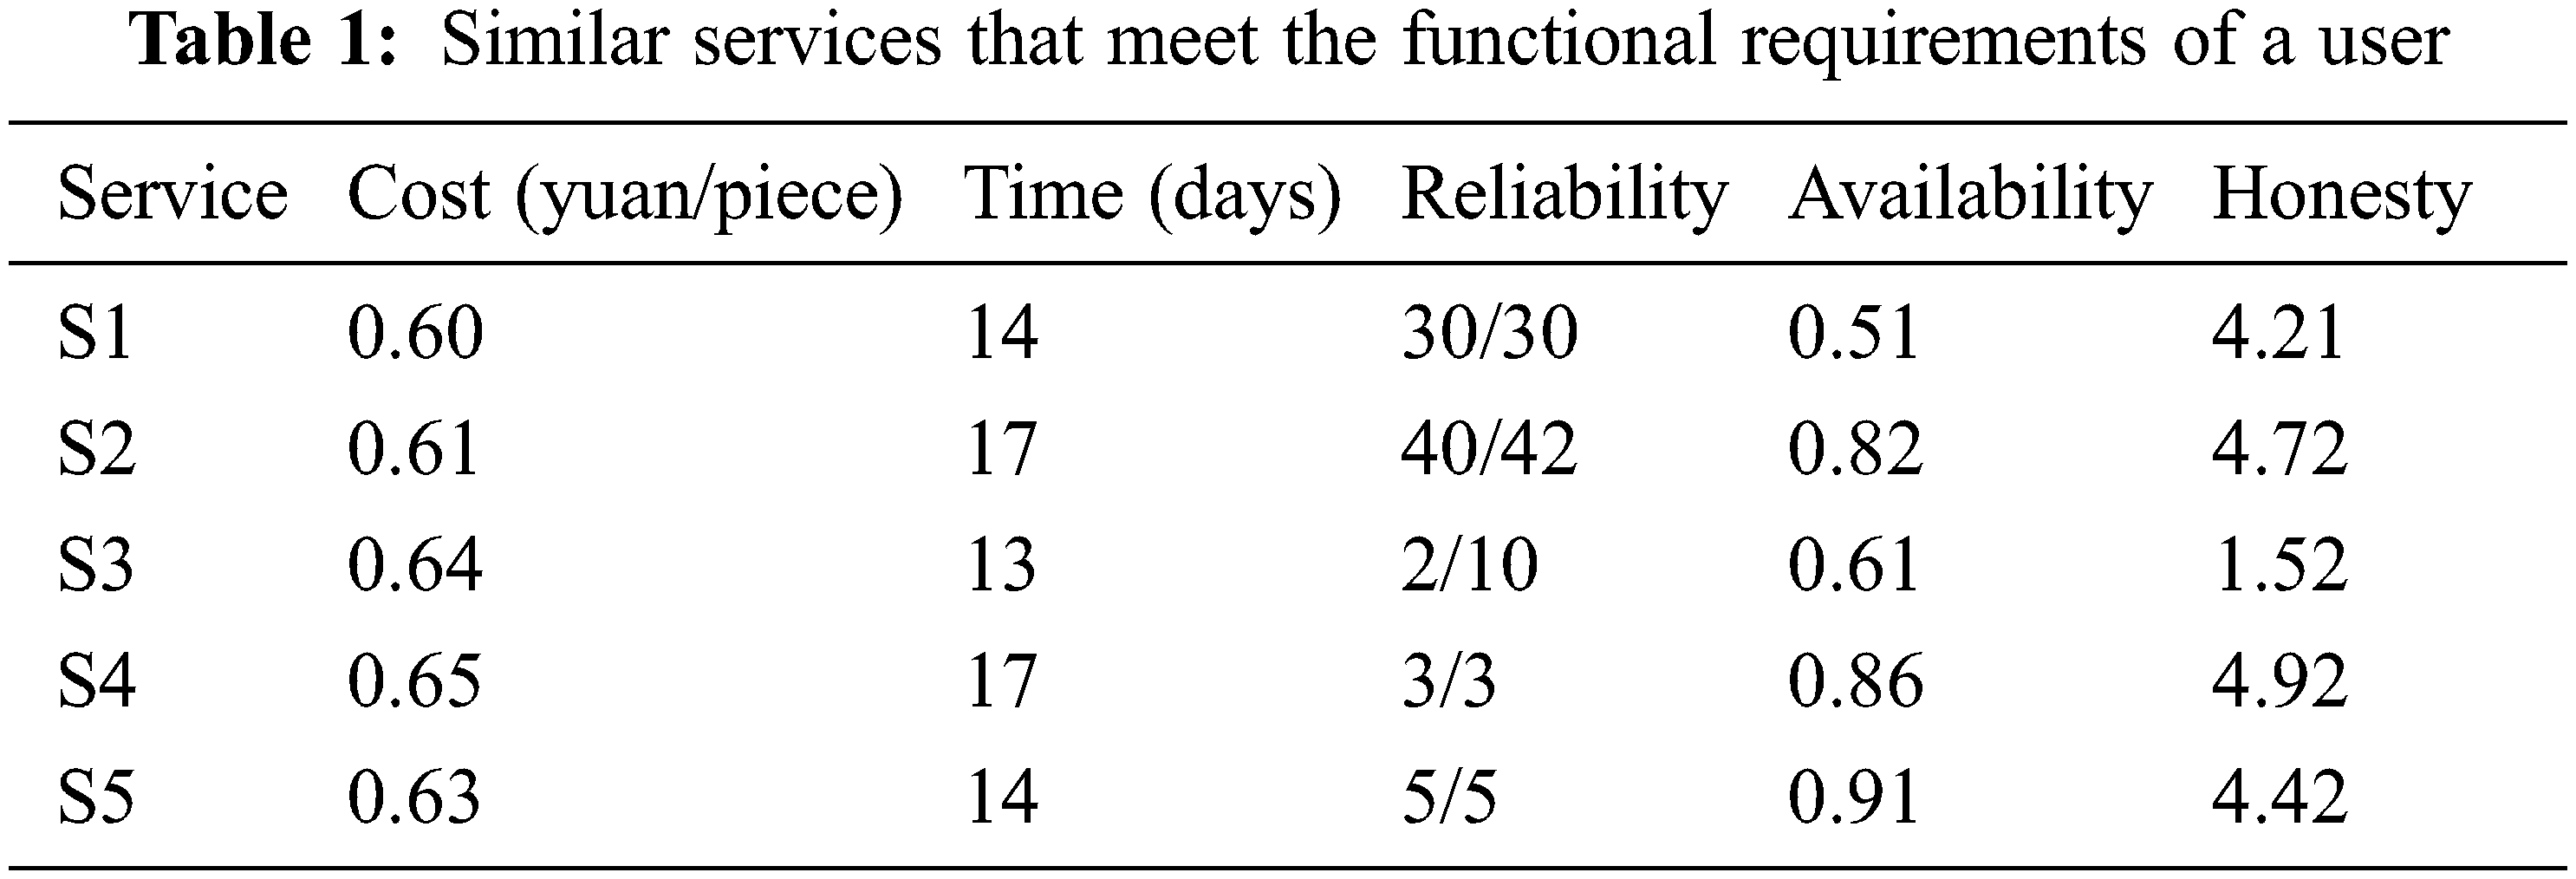
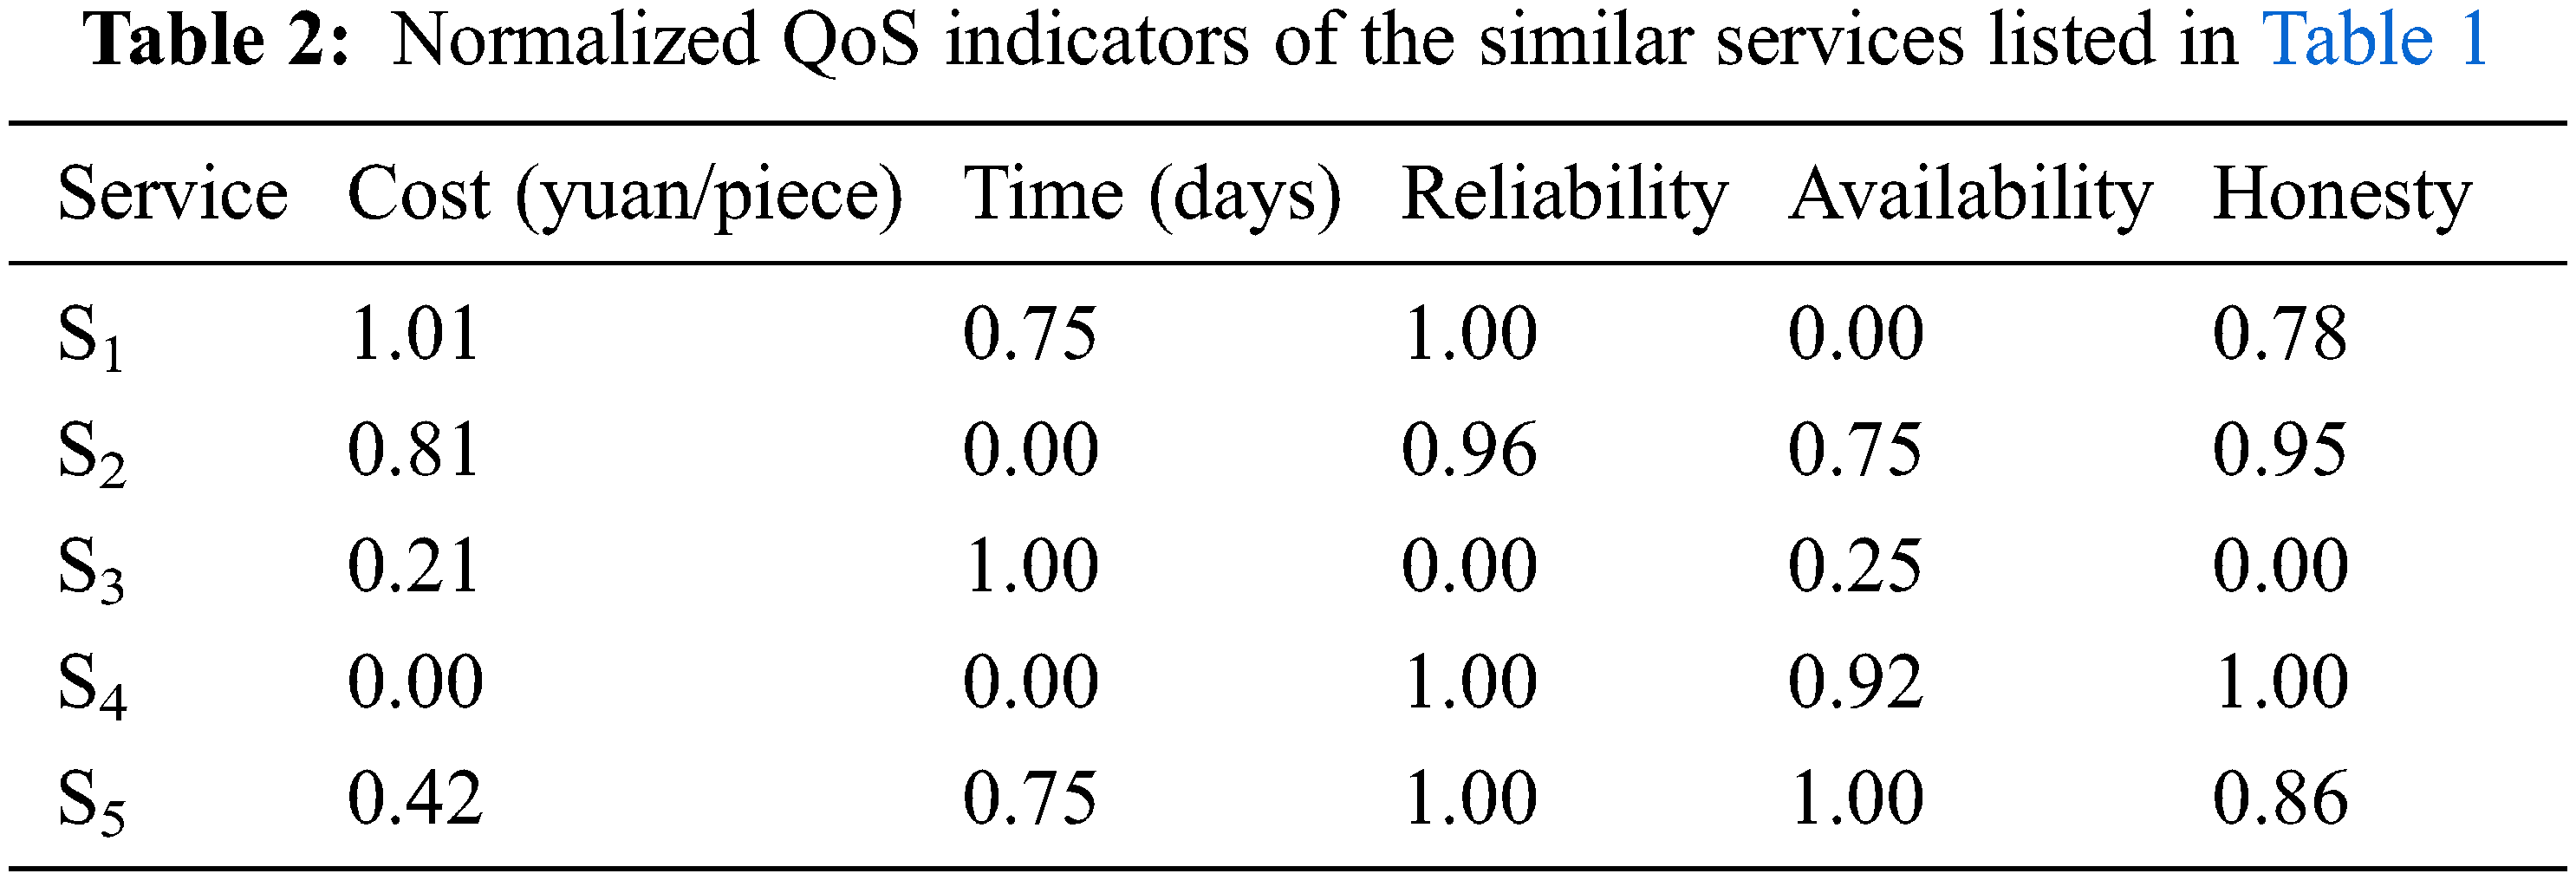
The cost in Table 1 is obtained by summing the processing costs and per-kilometer transportation costs of a single product. The time is the number of days required for processing and transporting the product. Service 2 has a reliability value of 40/42, indicating that this service was called 42 times from the QoS database, and provided 40 normal responses. In a practical scenario, the historical record of Service S2 revealed 42 bids for its service, and 40 completed contracts among those bids. The availability describes the probability of a service’s failure-free time during the effective period of the database record. Honesty (range [0, 5]) is the average evaluation obtained after completing all bid-winning projects. The honesty data are corrected by the QoS monitor in the cloud manufacturing service platform (see Eq. (5)). The cost and time indicators are normalized by Eq. (2), and the other indicators are processed by Eq. (3). The normalized data are listed in Table 2.
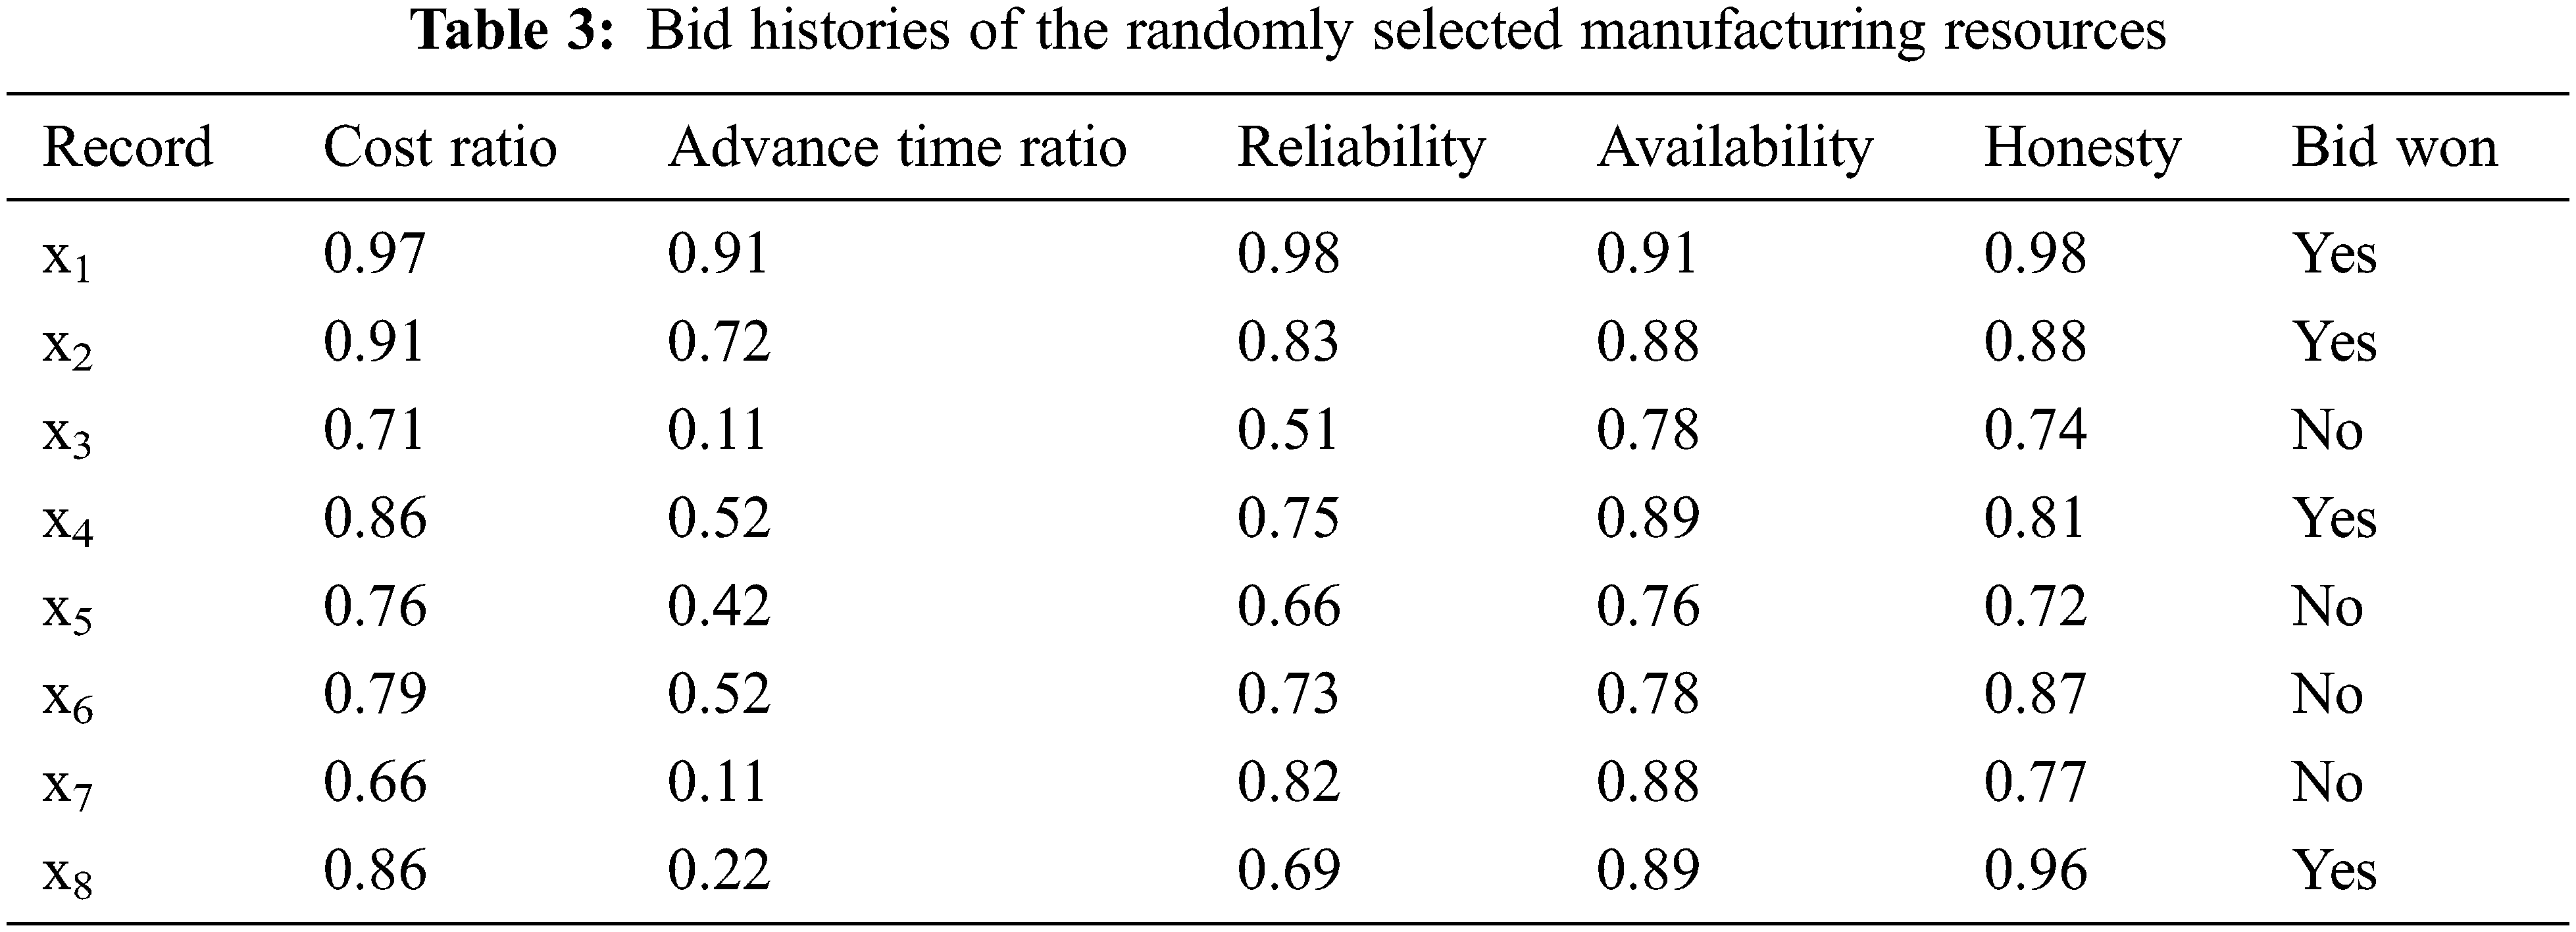
Based on the attribute weight calculation of the RS, the weight ratio of each attribute was obtained by analyzing the historical records. The presented experiment accessed the historical records of 5116 manufacturing resources in the manufacturing cloud pool. To demonstrate the reasoning process, we randomly selected eight records as the reasoning sample. The cost and time factors likely differ among the processed products, and the data are not directly comparable. The measurement parameter was the ratio of the bid quote in the record to the bid price of the current business, and the time factor was analyzed in terms of the advance time ratio. For example, service S1 in Table 1 participated in the bidding three days in advance of its manufacturing time (10 d), so its time factor was 0.3. The bidding history of the eight randomly selected manufacturing-resource records are listed in Table 3.
For processing by the RS (which can process only clustered data), the data in the historical database were clustered by the
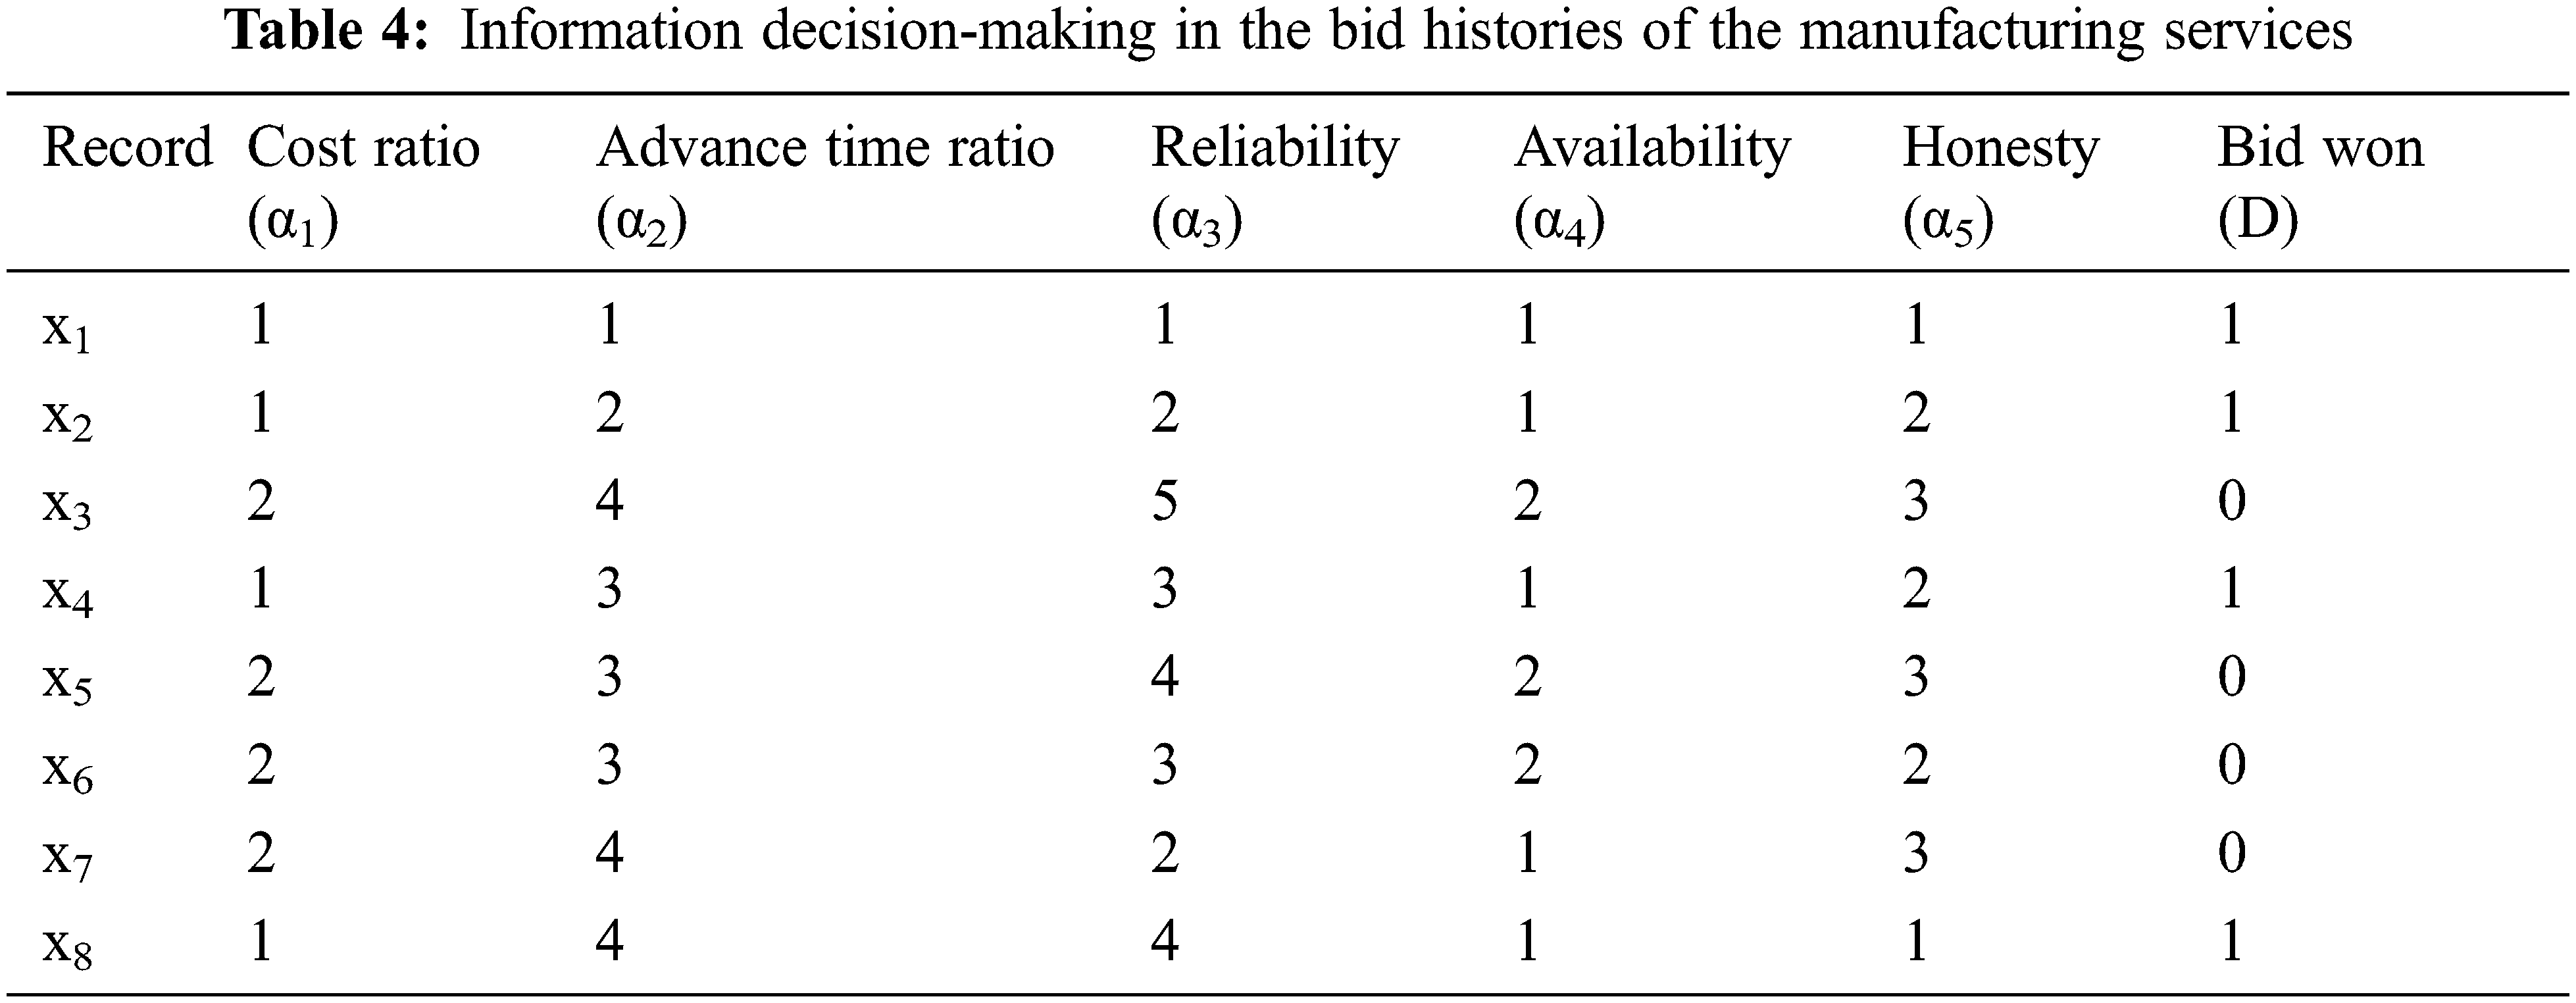
According to the data in Table 4, the bid-winning decision-making class was
Setting
If the weights of the QoS indicators are ignored or set to the same value, the data of Table 1 yield
5.2 Comparison of Selection Success Rate
In traditional information retrieval, the performance of retrieval algorithms is commonly estimated by the precision. In the present experiment, the performance of the selection algorithm was analyzed by a variant of precision called the success rate. With the aim of recommending optimal services to users, the selection success rate is defined as follows:
This experiment measured the success rates of three selection methods: the equal-weight selection method (in which the conditional attribute weights are evenly distributed and the QoS value is neither updated nor corrected), the user fixed-weight selection method (in which the weights are preset by the user, and the QoS value is neither updated nor corrected) and the hybrid fixed-weight selection method (the proposed method, in which the user-set weights are combined with the rough-set weights). The QoS value in the hybrid method is adjusted by honesty detection and an information correction mechanism. Simulations were executed on 20 manufacturing operations, each considered by 100 users for service selection. The success rates obtained in the comparison experiment are plotted in Fig. 1.
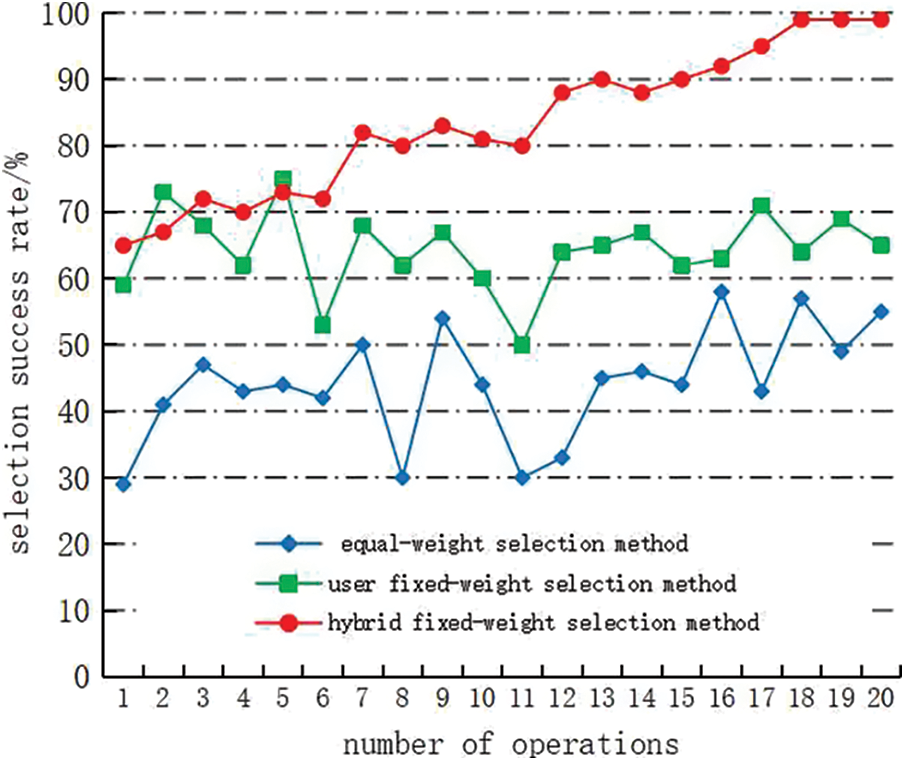
Figure 1: Precision comparison of three selection methods
As shown in Fig. 1, the user fixed-weight selection method was more successful than the equal-weight service-selection method in most cases, indicating the importance of considering the users’ expectation and their preferred evaluation factors. As the equal-weight selection method does not consider the weight differences between the QoS performance indicators, its success rate was relatively low and unstable. Meanwhile, the user fixed-weight selection method is blinded to some extent by the preferences of the weight setter, so its success rate fluctuated greatly. Initially, the hybrid fixed-weight selection method did not outperform the user fixed-weight selection method, because it lacked a historical record in the earliest stages. As the historical database extended, the success rate of the hybrid method gradually increased, indicating that the weights became increasingly more objective. The stability of the success rate also improved over time. The proposed method clearly outperformed the other two methods in terms of selection success rate.
5.3 Dishonesty Evaluation Experiment
For the dishonesty evaluation, we simulated 100 randomly selected services evaluated by up to 200 dishonest users. The selection success rates of the three selection methods are compared in Fig. 2.
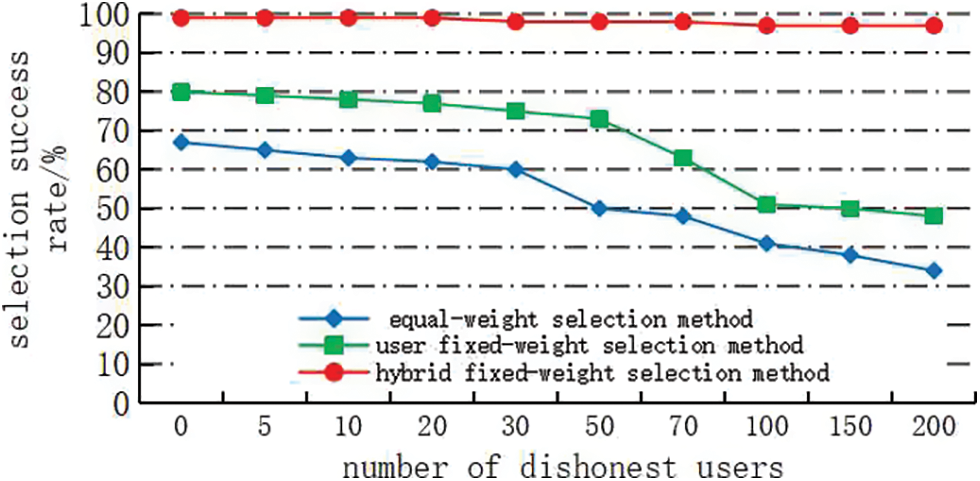
Figure 2: Comparison of selection success rates when services are evaluated by dishonest users
As shown in Fig. 2, increasing the number of dishonest users reduced the success rates of the equal-weight and user fixed-weight selection methods, because neither method adopts an honesty information detection and correction mechanism. The equal-weight selection method was especially sensitive to dishonest evaluations, because its honesty weight was relatively large. The hybrid fixed-weight selection method introduces a QoS information correction mechanism, and collects the user evaluation data by a monitor placed on the cloud manufacturing service platform. The low quality of their evaluation data reduces the credibility of dishonest users; accordingly, these users score very lowly in the QoS honesty calculation and their evaluation information will be filtered out. Therefore, increasing the number of dishonest users barely affected the success rate of the hybrid fixed-weight selection method.
This paper proposed a QoS-aware cloud service optimization model in the cloud-manufacturing environment. The study established the QoS evaluation indicators, information-aware models, and the quantification methods suitable for cloud-manufacturing businesses, and provided an honesty information correction method that filters out dishonest evaluations. The weights discovered by the variable precision RS, which mined the evaluation indicators from historical data, providing a comprehensive performance ranking of service quality. The manufacturing cloud service optimization algorithm thus provides a quantitative reference for service selection. In experimental simulations, this method recommended the optimal services and effectively reduced the impact of dishonest users on the selection results. In the next step, we will research the combination technology of manufacturing cloud services, conduct in-depth studies on the task decomposition, and improve the functionality of the developed system prototype.
Acknowledgement: I would like to express my gratitude to all those who have helped me during the writing of this thesis.
Funding Statement: This study has been supported by the National Natural Science Foundation, China (Grant No: 61602413, Jianwei Zheng, https://www.nsfc.gov.cn), and the Natural Science Foundation of Zhejiang Province (Grant No: LY15E050007,Wenlong Ma, http://zjnsf.kjt.zj.gov.cn/portal/index.html).
Conflicts of Interest: The authors declare that they have no conflicts of interest to report regarding the present study.
References
1. B. H. Li, L. Zhang, S. L. Wang, F. Tao and X. D. Chai, “Cloud manufacturing: A new service-oriented manufacturing model,” Computer Integrated Manufacturing Systems, vol. 16, no. 1, pp. 1–7, 2010. [Google Scholar]
2. D. Bermbach, “Quality of cloud services: Expect the unexpected,” IEEE Internet Computing, vol. 21, no. 1, pp. 68–72, 2017. [Google Scholar]
3. E. J. Ghomi, A. M. Rahmani and N. N. Qader, “Cloud manufacturing: Challenges, recent advances, open research issues, and future trends,” International Journal of Advanced Manufacturing Technology, vol. 102, pp. 3613–3639, 2019. [Google Scholar]
4. M. Koehler and S. Benkner, “Design of an adaptive framework for utility-based optimization of scientific applications in the cloud,” in Proc. of the 2012 IEEE/ACM Fifth Int. Conf. on Utility and Cloud Computing. IEEE Computer Society, Chicago, IL, USA, pp. 303–308, 2012. [Google Scholar]
5. N. Phaphoom, X. Wang, S. Samuel, S. Helmer and P. Abrahamsson, “A survey study on major technical barriers affecting the decision to adopt cloud services,” Journal of Systems and Software, vol. 103, pp. 167–181, 2015. [Google Scholar]
6. Z. ur Rehman, O. K. Hussain, F. K. Hussain, E. Chang and T. Dillon, “User-side QoS forecasting and management of cloud services,” World Wide Web, vol. 18, no. 6, pp. 1677–1716, 2015. [Google Scholar]
7. X. Zheng, L. D. Xu and S. Chai, “Qos recommendation in cloud services,” IEEE Access, vol. 5, no. 5, pp. 5171–5177, 2017. [Google Scholar]
8. Z. Zheng, X. Wu, Y. Zhang, M. R. Lyu and J. Wang, “QoS ranking prediction for cloud services,” IEEE Transactions on Parallel and Distributed Systems, vol. 24, no. 6, pp. 1213–1222, 2013. [Google Scholar]
9. J. A. Alzubi, R. Manikandan, O. A. Alzubi, I. Qiqieh, R. Rahim et al., “Hashed needham schroeder industrial IoT based cost optimized deep secured data transmission in cloud,” Measurement, vol. 150, no. 1, pp. 1–8, 2020. [Google Scholar]
10. W. Sun, G. C. Zhang, X. R. Zhang, X. Zhang and N. N. Ge, “Fine-grained vehicle type classification using lightweight convolutional neural network with feature optimization and joint learning strategy,” Multimedia Tools and Applications, vol. 80, no. 20, pp. 30803–30816, 2021. [Google Scholar]
11. D. Serrano, S. Bouchenak, Y. Kouki, T. Ledoux, J. Lejeune et al., “Towards qos-oriented sla guarantees for online cloud services: Cluster, Cloud and Grid Computing (CCGrid),” in 2013 13th IEEE/ACM Int. Symp. on. IEEE, Delft, Netherlands, pp. 50–57, 2013. [Google Scholar]
12. H. Wu, K. Yue, C. H. Hsu, Y. Zhao, B. Zhang et al., “Deviation-based neighborhood model for contextaware QoS prediction of cloud and IoT services,” Future Generation Computer Systems, vol. 76, no. 10, pp. 550–560, 2017. [Google Scholar]
13. E. kodhai, K. S. V. Divakar, R. Natarajan, A. C. Allwin, P. Yellamma et al., “Managing the cloud storage using deduplication and secured fuzzy keyword search for multiple data owners,” International Journal of Pure and Applied Mathematics, vol. 118, no. 14, pp. 563–565, 2018. [Google Scholar]
14. W. Sun, X. Chen, X. R. Zhang, G. Z. Dai, P. S. Chang et al., “A Multi-feature learning model with enhanced local attention for vehicle re-identification,” Computers, Materials & Continua, vol. 69, no. 3, pp. 3549–3560, 2021. [Google Scholar]
15. Y. Pan, S. Ding, W. Fan, J. Li and S. Yang, “Trust-enhanced cloud service selection model based on QoS analysis,” PloS One, vol. 10, no. 11, pp. 1–19, 2015. [Google Scholar]
16. O. A. Alzubi, J. A. Alzubi, A. Al-Zoubi, M. A. Hassonah and U. Kose, “An efficient malware detection approach with feature weighting based on harris hawks optimization,” Cluster Computing Journal, vol. 25, no. 4, pp. 2369–2387, 2022. [Google Scholar]
17. Z. Zhou, W. Xu, D. T. Pham and C. Ji, “QoS modeling and analysis for manufacturing networks: A service framework,” in Proc. of the 7th IEEE Int. Conf. on Industrial Informatics, New York, N.Y., USA, IEEE, 2009. [Google Scholar]
18. Y. Liu, A. H. Ngu and L. Z. Zeng, “QoS computation and policing in dynamic Web service selection,” in Proc. of the 13th Int. Conf. on World Wide Web, New York, N.Y., USA, ACM, pp. 17–22, 2014. [Google Scholar]
19. S. S. Yau and Y. Yin, “QoS-Based service ranking and selection for service-based system,” in Proc. of IEEE Int. Conf. on Services Computing, Washington, D.C., USA, IEEE, pp. 56–63, 2011. [Google Scholar]
20. F. Tao, D. Zhao and L. Zhang, “Resource service optimal-selection based on intuitionistic fuzzy set and non-functionality QoS in manufacturing grid system,” Knowledge and Information System, vol. 25, no. 1, pp. 185–208, 2010. [Google Scholar]
21. J. Xu, X. Du, W. Cai, C. Zhu and Y. Chen, “MeURep: A novel user reputation calculation approach in personalized cloud services,” PloS One, vol. 14, no. 6, pp. 1–15, 2019. [Google Scholar]
22. L. Xiong, “Peertrust: Supporting reputation-based trust for peer-to-peer electronic communities,” IEEE Transactions on Knowledge and Data Engineering, vol. 16, no. 7, pp. 843–857, 2004. [Google Scholar]
23. S. Wang, Z. Zheng, Z. Wu, M. R. Lyu and F. Yang, “Reputation measurement and malicious feedback rating preventionin web service recommendation systems,” IEEE Transactions on Services Computing, vol. 8, no. 5, pp. 755–767, 2015. [Google Scholar]
24. M. H. Al-Adhaileh and F. W. Alsaade, “Detecting and analysing fake opinions using artificial intelligence algorithms,” Intelligent Automation & Soft Computing, vol. 32, no. 1, pp. 643–655, 2022. [Google Scholar]
25. O. A. Wahab, J. Bentahar, H. Otrok and A. Mourad, “Towards trustworthy multi-cloud services communities: A trust-based hedonic coalitional game,” IEEE Transactions on Services Computing, vol. 11, no. 1, pp. 184–201, 2018. [Google Scholar]
26. O. A. Wahab, J. Bentahar, H. Otrok and A. Mourad, “A survey on trust and reputation models for Web services,” Decision Support Systems, vol. 74, no. 6, pp. 121–134, 2015. [Google Scholar]
27. E. Yang, Z. Yong, W. Liu, Y. Liu and S. Liu, “A hybrid approach to placement of tenants for service-based multi-tenant SaaS application,” in Proc. of Asia-Pacific Services Computing Conf., Jeju, Korea, 2011. [Google Scholar]
28. E. Al-Masri and Q. HMahmoud, “Discovering the best web service,” in Proc. of the 16th Int. World Wide Web Conf., New York, N.Y., USA, IEEE, pp. 1257–1258, 2007. [Google Scholar]
29. A. A. Movassagh, J. A. Alzubi, M. Gheisari, M. Rahimi, S. K. Mohan et al., “Artificial neural networks training algorithm integrating invasive weed optimization with diferential evolutionary model,” Journal of Ambient Intelligence Humanized Computing, vol. 3, no. 3, pp. 1–19, 2021. [Google Scholar]
30. Y. Chen and Y. Chen, “Feature subset selection based on variable precision neighborhood rough sets,” International Journal of Computational Intelligence Systems, vol. 14, no. 1, pp. 1–12, 2021. [Google Scholar]
Cite This Article
 Copyright © 2023 The Author(s). Published by Tech Science Press.
This work is licensed under a Creative Commons Attribution 4.0 International License , which permits unrestricted use, distribution, and reproduction in any medium, provided the original work is properly cited.
 Downloads
 Citation Tools