
 Submit a Paper
 Propose a Special lssue
 Open Access
ARTICLE

Fusing Supervised and Unsupervised Measures for Attribute Reduction
School of Computer, Jiangsu University of Science and Technology, Zhenjiang, Jiangsu, 212100, China
* Corresponding Author: Jianjun Chen. Email:
Intelligent Automation & Soft Computing 2023, 37(1), 561-581. https://doi.org/10.32604/iasc.2023.037874
Received 19 November 2022; Accepted 06 February 2023; Issue published 29 April 2023
 View Full Text
 Download PDF
Abstract
It is well-known that attribute reduction is a crucial action of rough set. The significant characteristic of attribute reduction is that it can reduce the dimensions of data with clear semantic explanations. Normally, the learning performance of attributes in derived reduct is much more crucial. Since related measures of rough set dominate the whole process of identifying qualified attributes and deriving reduct, those measures may have a direct impact on the performance of selected attributes in reduct. However, most previous researches about attribute reduction take measures related to either supervised perspective or unsupervised perspective, which are insufficient to identify attributes with superior learning performance, such as stability and accuracy. In order to improve the classification stability and classification accuracy of reduct, in this paper, a novel measure is proposed based on the fusion of supervised and unsupervised perspectives: (1) in terms of supervised perspective, approximation quality is helpful in quantitatively characterizing the relationship between attributes and labels; (2) in terms of unsupervised perspective, conditional entropy is helpful in quantitatively describing the internal structure of data itself. In order to prove the effectiveness of the proposed measure, 18 University of CaliforniaIrvine (UCI) datasets and 2 Yale face datasets have been employed in the comparative experiments. Finally, the experimental results show that the proposed measure does well in selecting attributes which can provide distinguished classification stabilities and classification accuracies.Keywords
In the era of big data, a large number of irrelevant and redundant attributes are usually generated in practical applications, which will bring a series of problems in data processing, such as over-fitting, high computing cost and insufficient classification performance. Attribute reduction [1–4] is one of the effective methods to deal with this problem in rough set theory [5]. As a process of deleting irrelevant attributes and preserving key attributes, attribute reduction can reduce computational complexity and time by eliminating the influence of irrelevant attributes and noise. The result of attribute reduction is called reduct. Reduct is a new data which is composed of key attributes. In certain criterion of evaluation, such reduct can achieve or go beyond the performance of raw data [6]. As a dimension reduction method, the attribute reduction based on rough set theory consists of three stages, which are data representation under rough set, construction of attribute evaluation constraints and selection of search strategy. In the first stage, raw data can be described as a triple set, they are samples, conditional attributes and decision attributes. In second stage, the constraint can be constructed by using some related measures of rough set in certain learning perspective. There are many related measures in rough set theory, such as approximation quality [7], conditional entropy [8], and decision error rate [9]. And the learning perspective can be usually divided into two parts, supervised learning and unsupervised learning. Different measures correspond to different constraints [10]. In the third stage, using suitable search strategy can obtain the reduct effectively. Serving as a criterion of evaluation, constraint controls the condition of terminating search. Naturally, it may be concluded that different constraints imply different reducts, and then different learning performances.
With a literature review, it is noticed that most studies about constraint based on either supervised perspective or unsupervised perspective have been extensively explored [11]. In other words, the measure based on only one perspective is used to form a constraint of attribute reduction, and then the qualified reduct can be sought out through such a constraint. For example, Jiang et al. [12] and Yuan et al. [13] have investigated attribute reductions with respect to supervised information granulation and the relative supervised measures, respectively; Yang et al. [14] have introduced a measure, called fuzzy complementary entropy, into the attribute reduction based on the unsupervised framework. Nevertheless, either supervised measure or unsupervised measure is considered, the measure based on single perspective may have some limitations as follows.
(1) The measure based on single perspective neglects the diverse evaluations [15,16]. That is, it may not identify more confident attributes. The potential reason is that if a measure is fixed to perform attribute reduction, then within the iterations in searching reduct, only such a measure can assess the importance of candidate attributes, so it follows that immediate results of the evaluation may be invalidated if some other measures are further required.
(2) The measure based on single perspective ignores the complex constraint [17]. It may not effectively terminate the process of attribute selection. For example, supposed that conditional entropy serves as a measure to evaluate attributes [18,19], a derived reduct is only equipped with the single characteristic required by such an evaluation, no other types of uncertainty characteristics and learning abilities have been fully considered.
To overcome the limitations mentioned above, a new measure is proposed, which is a fusion of measures defined in both supervised and unsupervised perspectives. Fig. 1 shows the flowchart of attribute reduction, the dotted box presents our main work. Approximation quality and conditional entropy are classical measures and have been widely accepted in the field of rough set. The former can be used to build a bridge between attributes and labels [20], while the latter can quantitatively characterize the uncertainty of the data itself [21]. In our study, approximation quality from a supervised perspective and conditional entropy from an unsupervised perspective are employed to fuse into a new measure. Through abundant comparative experiments, the superiorities of new measure can be summarized as: (1) it is equipped with the distinguishing characteristic of multiple perspectives [22–24]; (2) it has more complex constraints than measure based on single perspective [25] and then more appropriate attributes are selected [26]; (3) it can not only quantitatively describe the relationship between attributes and label [27], but also quantitatively describe the internal structure of data itself [28,29].
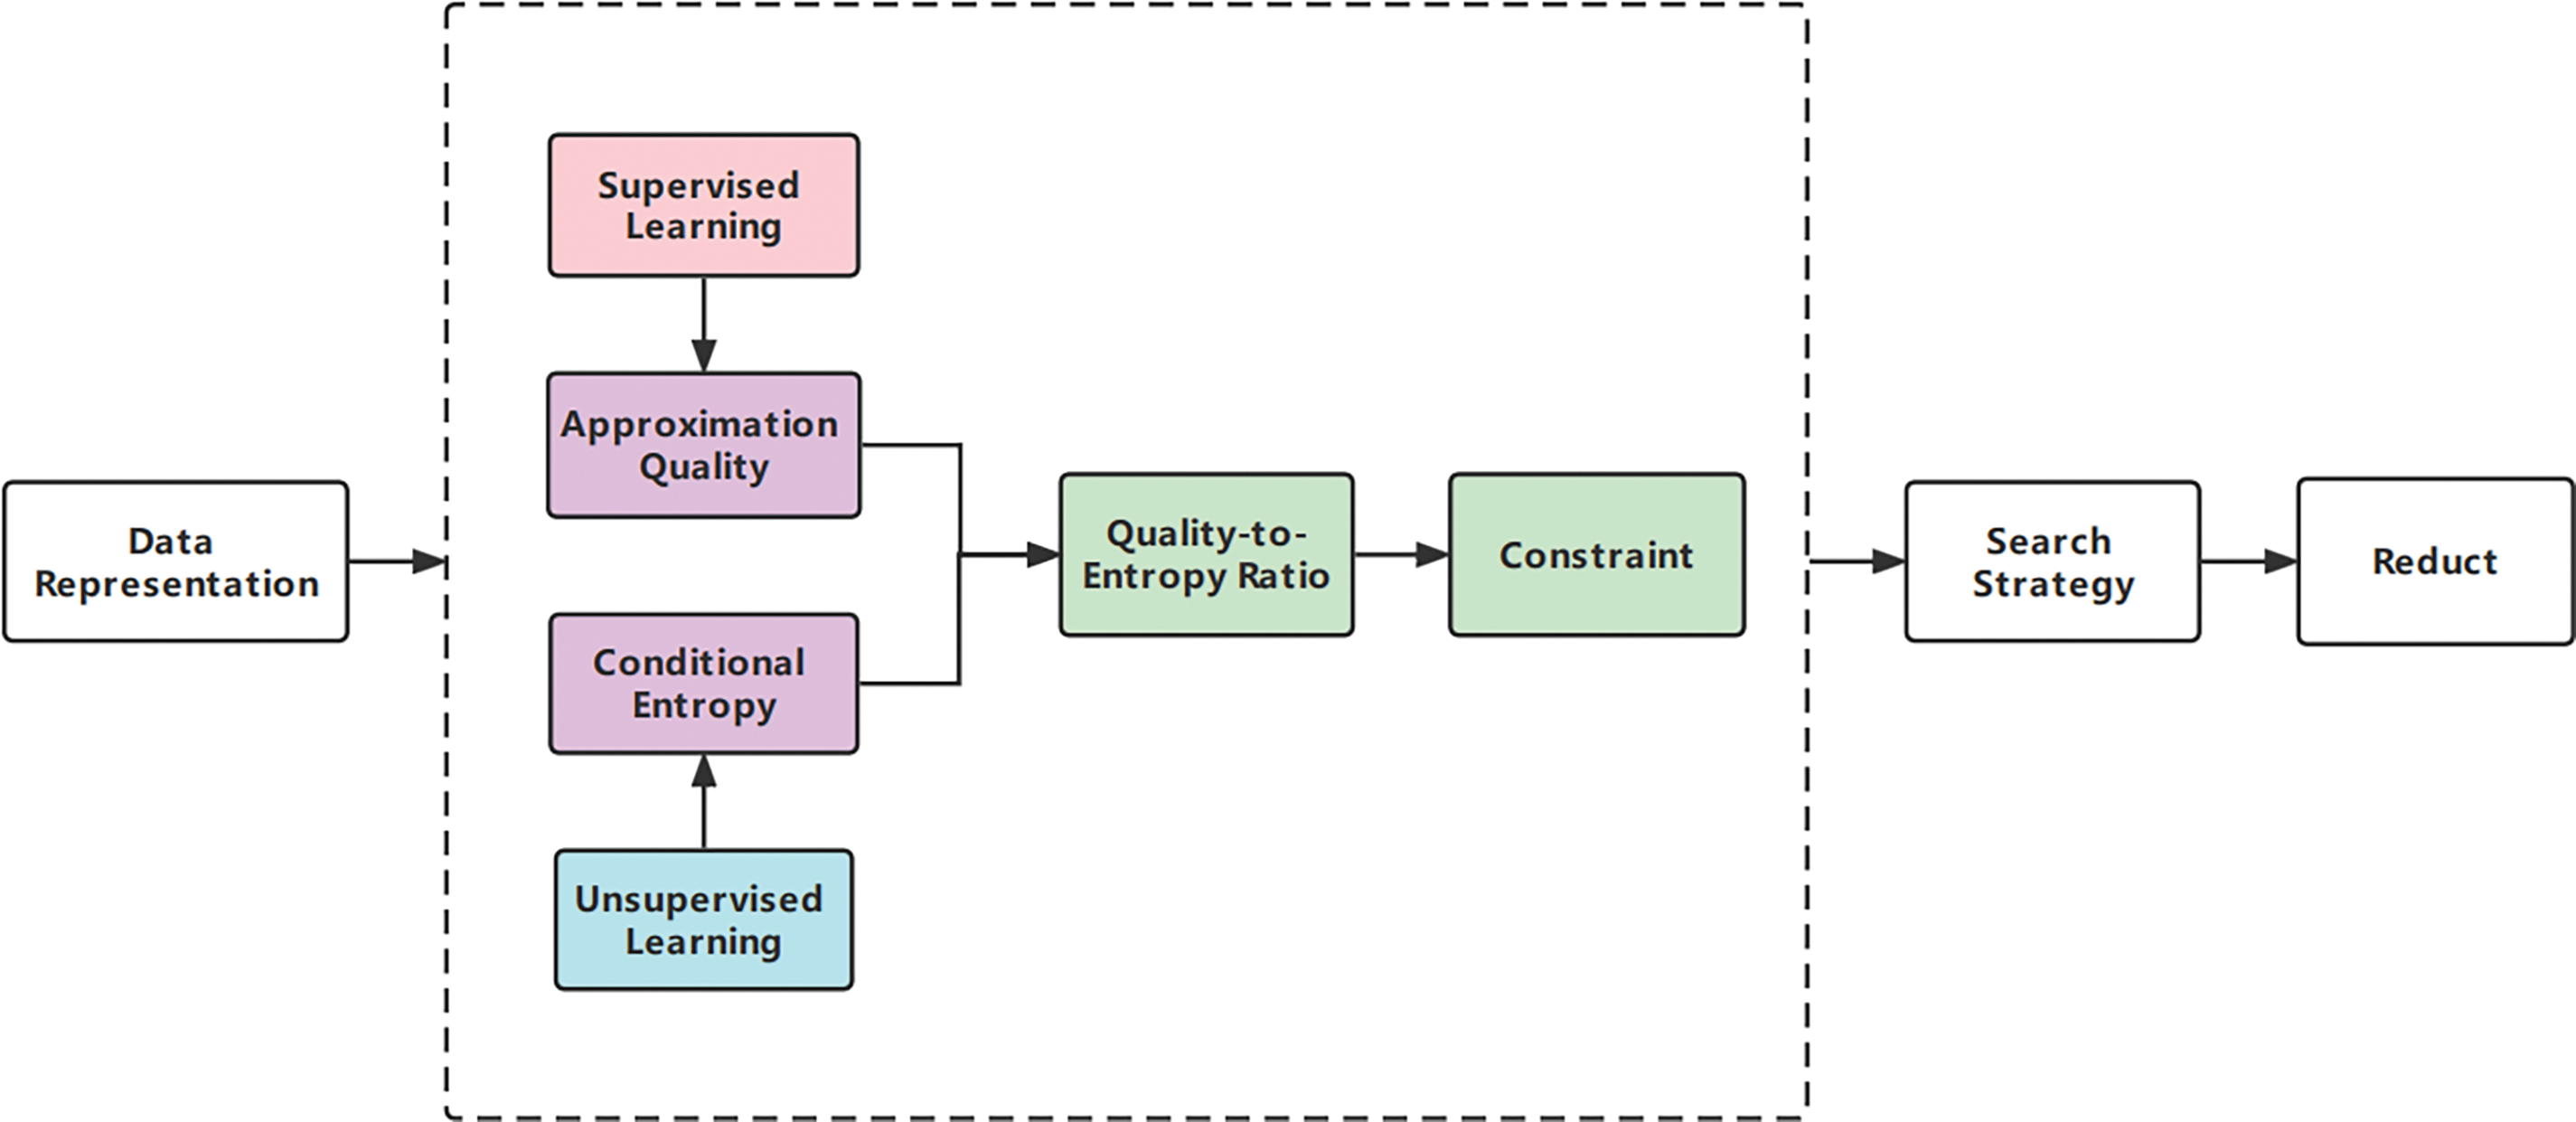
Figure 1: Fusing supervised and unsupervised measures for attribute reduction
The rest of this paper is organized as follows: Section 2 introduces the basic notions about the rough set, related measures, and attribute reduction. The proposed novel measure and searching process of solving reduct are elaborated in Section 3. Section 4 describes the comparative experimental results over 20 datasets and the corresponding analyses. The conclusions and future work are presented in Section 5.
The neighborhood rough set was first proposed by Hu et al. [9,30], as an improvement of the conventional rough set. The most significant difference is that the neighborhood rough set is constructed by a neighborhood relation instead of an indiscernibility relation. Therefore, the superiorities of the neighborhood rough set are: (1) it can process data with complicated types; (2) it is equipped with the natural structure of multi-granularity if various radii are used.
Generally, a data can be represented by a triple
Following
Furthermore, suppose that
where
In this study, Euclidean distance is applied, i.e.,
From the viewpoint of Granular Computing (GrC) [10,33,34], both the deriving of
Definition 1. Given a data
By the above definition, a neighborhood of
2.2 Supervised Attribute Reduction
As is well-known, a neighborhood rough set is frequently employed to execute the supervised learning tasks. Furthermore, in many supervised learning tasks, feature selection plays an important role in improving the generalization performance, decreasing the complexity of classifier, and so on. The superiority of attribute reduction is that it can be easily expanded with respect to different requirements in real-world applications. Therefore, various forms of attribute reduction have emerged in recent years. As far as the neighborhood rough set is concerned, the following two measures, approximation quality [30] and conditional entropy [8,19] can be used to further explore the forms of attribute reduction.
Definition 2. Given a data
where
Obviously,
Definition 3. Given a data
It is proved that
Definition 4. Given a data
(1)
(2)
Without loss of generality, the constraint shown in Def. 4 is closely related to the used measure
2.3 Unsupervised Attribute Reduction
It is well known that supervised attribute reduction relies heavily on the labels of samples, so it is time-consuming and costly to obtain labels of samples from many real-world tasks. However, unsupervised attribute reduction does not need to obtain such labels, this is why unsupervised attribute reduction has recently been paid much more attention to [14].
For unsupervised attribute reduction, if approximation quality or conditional entropy is still required to serve as a measure, the immediate problem is how to make labels for samples. As it has been pointed out by Qian et al. [35], a pseudo-label strategy can be introduced into the construction of a rough set model. The pseudo labels of samples are generated by using the information over condition attributes. Therefore, it is not difficult to present the following definitions of approximation quality and conditional entropy.
Definition 5. Given an unsupervised data
where
A partition can also be obtained such that
Similar to the approximation quality shown in Def. 2,
Definition 6. Given an unsupervised data
where
According to the definition of conditional entropy shown in Def. 3,
Definition 7. Given an unsupervised data
(1)
(2)
Without loss of generality, the constraint shown in Def. 7 is closely related to the used measure
Following Defs. 4 and 7, it is found that attribute reduction is closely related to the used measure. In other words, if different measures are employed then different results of reduct can be generated. From this viewpoint it can be concluded that the used measure is the key to deriving an expected reduct. Nevertheless, most previous measures based on single perspective may fall into the following limitations.
(1) The measure based on single perspective ignores the diverse evaluations [15,16]. The less diverse evaluations, the identified attributes will be less confident. This is mainly because if a measure is fixed to perform attribute reduction, then in the iterations of seeking out reduct, only such a measure is applied to assess the importance of candidate attributes. It follows that such a result of evaluation may be invalidated [36] or ineffective for some other measures.
(2) The measure based on single perspective ignores the complex constraint which is helpful in terminating the procedure of selecting attributes. For instance, given a form of attribute reduction that preserves the value of approximation quality in data, i.e., in Def. 4, the measure
From the discussions above, a new measure is proposed to further solve such problems. Since both supervised and unsupervised cases have been presented in the above section, they will be introduced into our new proposed measure.
Approximation quality and conditional entropy can be used to evaluate the importance of attributes. In Defs. 2 and 6, the relationships between such measures and the importance of attributes are revealed. And these two relationships are at opposite poles. To further unify the relationships, the format of ratio is employed to coordinate two relationships. Moreover, in order to enhance the relationship between conditional entropy and the importance of attributes, an exponential function is added to conditional entropy.
Definition 8. Given a data
where
From the perspective of attribute reduction, conditional entropy is used to build a bridge between condition attributes and decisions [37]. It frequently reveals a learning relationship between samples and labels in data. In this study, unsupervised data can be labeled through a pseudo-label strategy, and then conditional entropy helps uncover the learning relationships among condition attributes. That is why we use unsupervised conditional entropy instead of unsupervised approximation quality in Eq. (9).
Furthermore, by the form of
Theorem 1. Given a data
Proof. By the property of approximation quality,
Following Sections 2.1 and 2.2, it is known that the higher the value of the approximation quality, the more influential the discriminating performance of the condition attributes relative to decision
Example 1. For example, see Table 1. In Table 1,

Firstly, the corresponding partitions over
By Eq. (9),
Therefore,
Presume that the condition attributes
Therefore,
Though
The quality-to-entropy ratio proposed above presents a form of attribute reduction as follows.
Definition 9. Given a data
where
Following Def. 9, it is observed that as a minimal subset of attributes, κ-reduct improves the quality-to-entropy ratio. Immediately, an open problem is how to seek out such a reduct. Without loss of generality, it is frequently required to evaluate the significance or importance of attributes in
Definition 10. Given a data
The above significance function shows: as the value rises, the condition attribute becomes more and more significant, and such an attribute is highly possible to be added to the reduct pool. For instance, if
The above interpretation is consistent with the semantic explanation of attribute reduction shown in Def. 9, i.e., a higher value of the quality-to-entropy ratio is expected.
Based on the significant function shown in Eq. (12), Algorithm 1 is designed to seek out a κ-reduct.
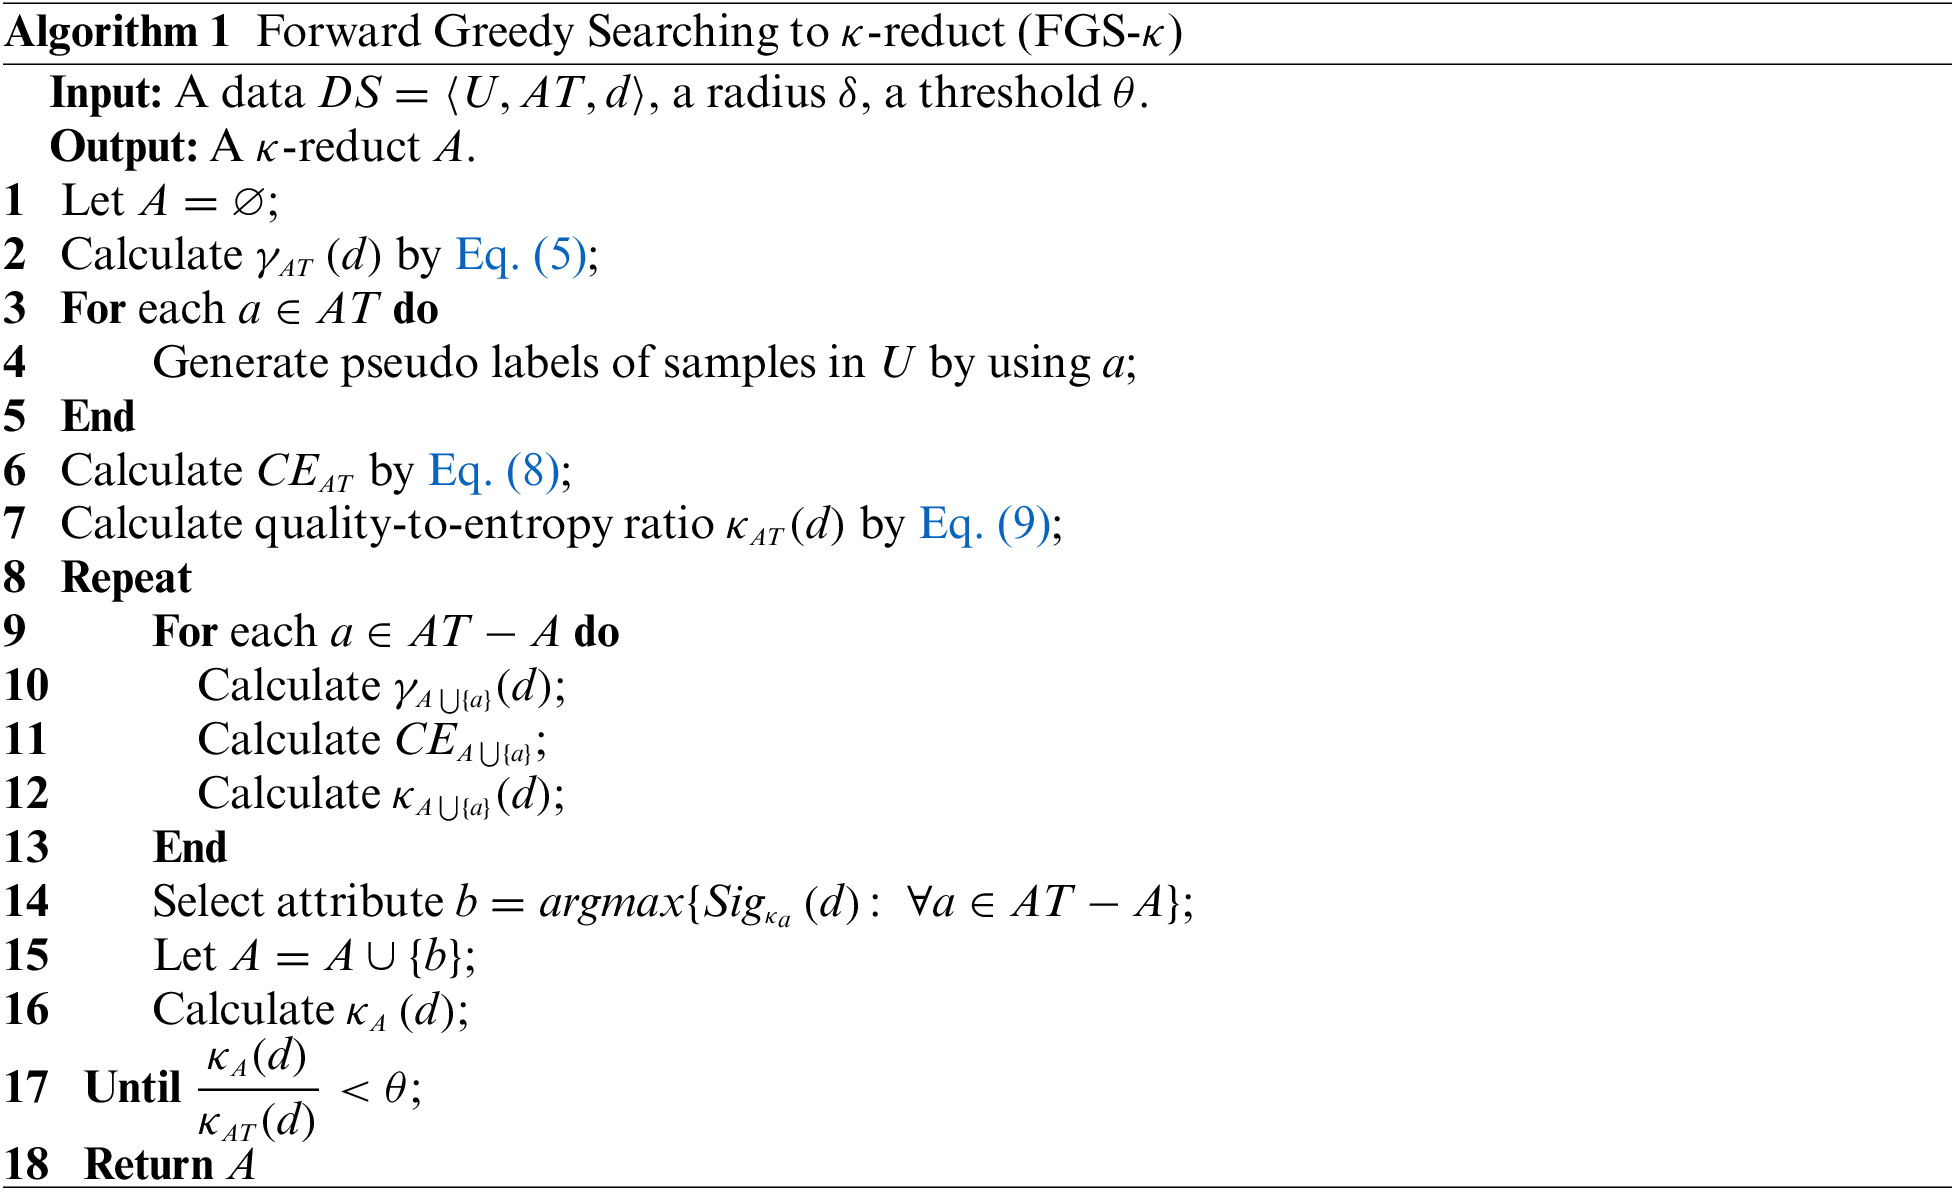
To simplify the discussion of the time complexity of Algorithm 1. Firstly,
To demonstrate the performance of our proposed strategy, 18 UCI datasets and 2 Yale face datasets have been employed in this study. Table 2 summarizes the detailed statistics of these data.

All the experiments are carried out on a desktop computer with the Windows 10 operating system, Advanced Micro Devices (AMD) Ryzen 5 5500U with Radeon Graphics (2.10 GHz) and 32.00 GB memory. The programming environment is Matlab R2020a.
In this section, two groups of comparative experiments are designed and executed. For all the experiments, 20 different radii
Moreover, 10-fold cross-validation is used in the experiments, dividing the samples in
In the first group of the experiment, we will compare our proposed approach with previously supervised attribute reduction and unsupervised attribute reduction strategies. The supervised attribute reduction is based on the approximation quality [30], which is called Supervised Approximation Quality Reduct (SAQR). The unsupervised attribute reduction is based on the conditional entropy, which is called Unsupervised Conditional Entropy Reduct (UCER).
Since 20 different radii have been used to obtain reducts in our experiments, the mean values related to those 20 different reducts are presented in the following subsection.
4.3.1 Comparisons among Classification Stabilities
The classification stabilities [15] derived by different kinds of reducts are compared. Classification stability is used to test the stability of classification results if data perturbation (simulated by cross-validation) happens. Such a computation is based on the distribution of the classification results. The higher the value of classification stability, the better the ability to the data perturbation.
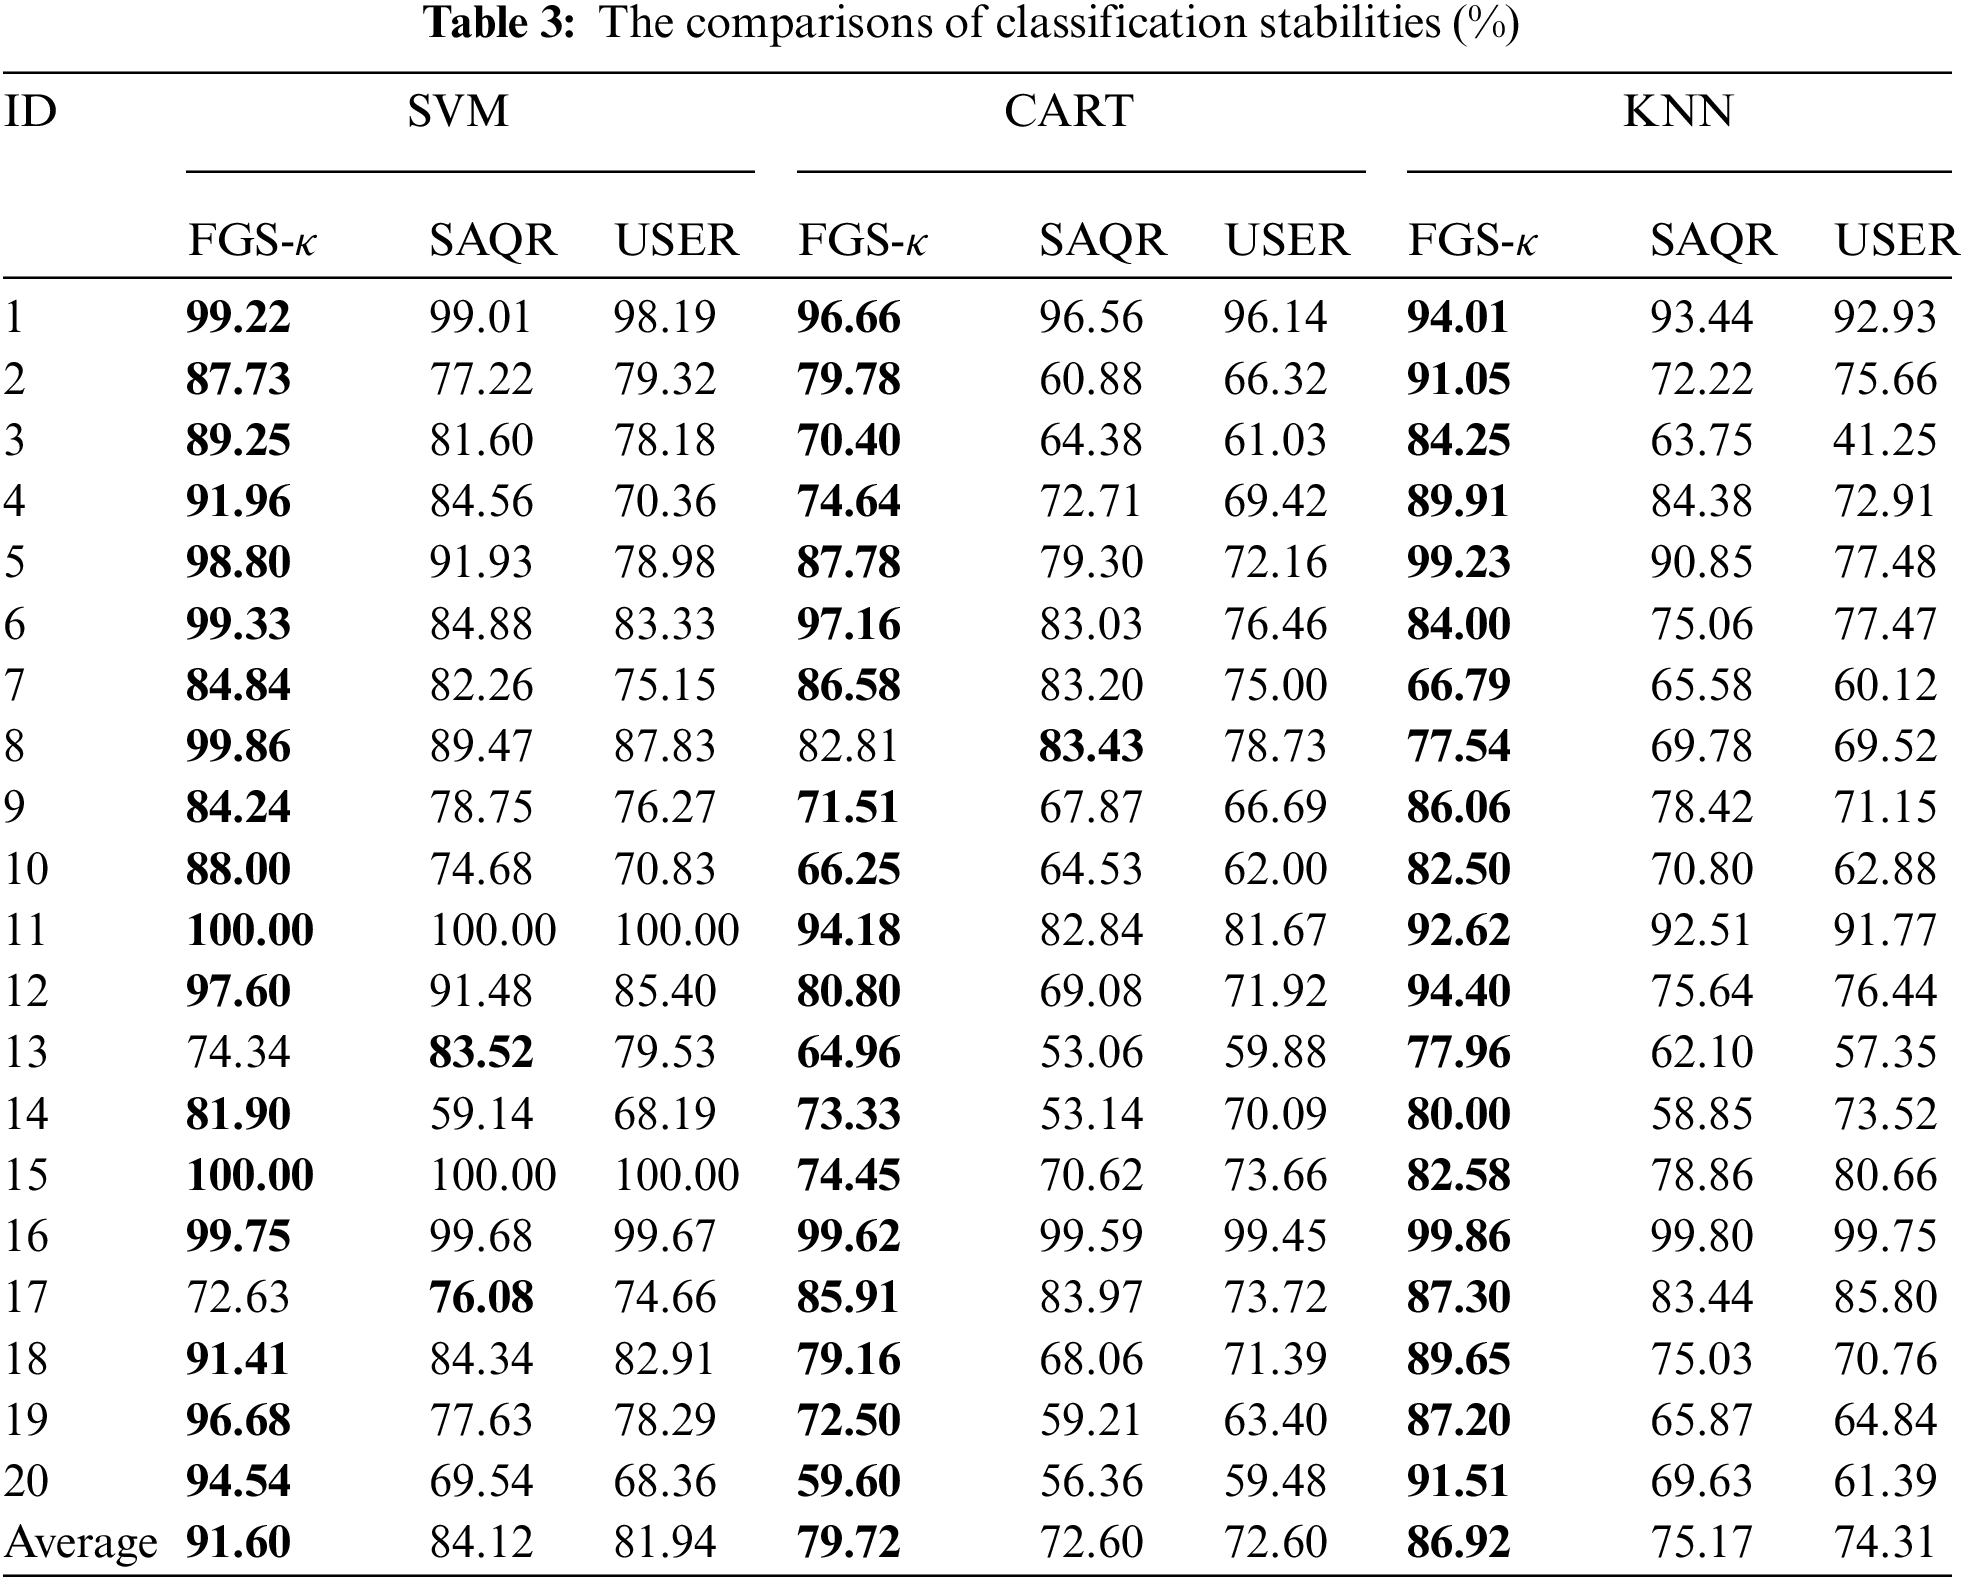
The following Table 3 reports the mean values of classification stabilities obtained over 20 datasets. A closer look at Table 3 reveals the following facts.
(1) Whichever classifier is adopted, the classification stabilities related to κ-reducts are greater than those related to reducts derived by SAQR and UCER in most datasets. Take data “Drive-Face (ID:3)” as an example. Through the use of SVM, the classification stability of FGS-κ, SAQR and UCER are 89.25%, 81.60% and 78.18%, respectively. Through the use of CART, the classification stability of FGS-κ, SAQR and UCER are 70.40%, 64.38% and 61.03%, respectively. Through the use of KNN, the classification stability of FGS-κ, SAQR and UCER are 84.25%, 63.75% and 41.25%, respectively. From this point of view, it is concluded that by comparing with the single measure used in SAQR and UCER, the quality-to-entropy-based multiple measures in FGS-κ helps select attributes with superior data adaptability, i.e., the slight data perturbation in training data will not lead to more significant variation of the classification results.
(2) From the perspective of the average values, the classification stability of FGS-κ is more remarkable than those related to both SAQR and USER. Through the use of SVM, the classification stability of FGS-κ is over 8.24% higher than others. Through the use of CART, the classification stability of FGS-κ is over 8.93% higher than others. Through the use of KNN, the classification stability of FGS-κ is over 13.50% higher than others.
From the discussions above, our new approach can select more critical attributes than other attribute reduction strategies, and these selected attributes are able to replace raw attributes to complete subsequent tasks.
4.3.2 Comparisons among Classification Accuracies
The classification accuracies corresponding to different results of reduct are compared. Table 4 reports the average values of classification accuracy obtained over 20 datasets.

A closer look at Table 4 reveals the following facts.
(1) Whichever classifier is employed, the accuracies corresponding to κ-reducts are greater than those corresponding to both SQAR and USER. Take the dataset “Optical Recognition of Handwritten Digits (ID:10)” as an example. Through the use of SVM, the classification accuracy of κ-reduct, SAQR and UCER are 88.00%, 66.25% and 58.75%, respectively. Through the use of CART, the classification accuracy of κ-reduct, SAQR and UCER are 56.25%, 45.00% and 36.25%, respectively. Through the use of KNN, the classification accuracy of κ-reduct, SAQR and UCER are 78.75%, 58.75% and 63.75%, respectively. Because of this, it can be found that the attributes selected by our FGS-κ can also provide better learning performance.
(2) Interestingly, compared to others, the κ-reducts derived from FGS-κ perform significantly better over high-dimensional datasets. Take the data “Yale face (64 × 64) (ID:20)” as an example, which possesses 4096 attributes. The classification accuracy of κ-reduct is 29.04% higher than the reduct derived from SAQR, and 36.58% higher than the reduct derived from USER. For “Connectionist Bench (Sonar, Mines vs. Rocks) (ID:1)”, which possesses 60 attributes. The classification accuracy of κ-reduct is 1.71% higher than the reduct derived from SAQR, and 0.38% higher than the reduct derived from USER.
(3) From the perspective of the average values, the classification accuracies related to FGS-κ are also more significant than those of both SAQR and USER. Through the use of SVM, the classification accuracy of FGS-κ is over 13.74% higher than others. Through the use of CART, the classification accuracy of FGS-κ is over 8.33% higher than others. Through the use of KNN, the classification accuracy of FGS-κ is over 10.38% higher than others. Such an observation indicates that our proposed algorithm applies to several different classifiers.
In this experiment, with respect to two measures addressed in this study, our proposed approach is compared with five other popular approaches, they are:
(1) The novel rough set algorithm for fast adaptive attribute reduction in classification (FAAR) [51];
(2) The multi-criterion neighborhood attribute reduction (MNAR) [17];
(3) The robust attribute reduction based on rough sets (RARR) [52];
(4) The attribute reduction algorithm based on fuzzy self-information (FSIR) [53];
(5) The attribute reduction based on neighborhood self-information (NSIR) [54].
4.4.1 Comparisons among Classification Stabilities
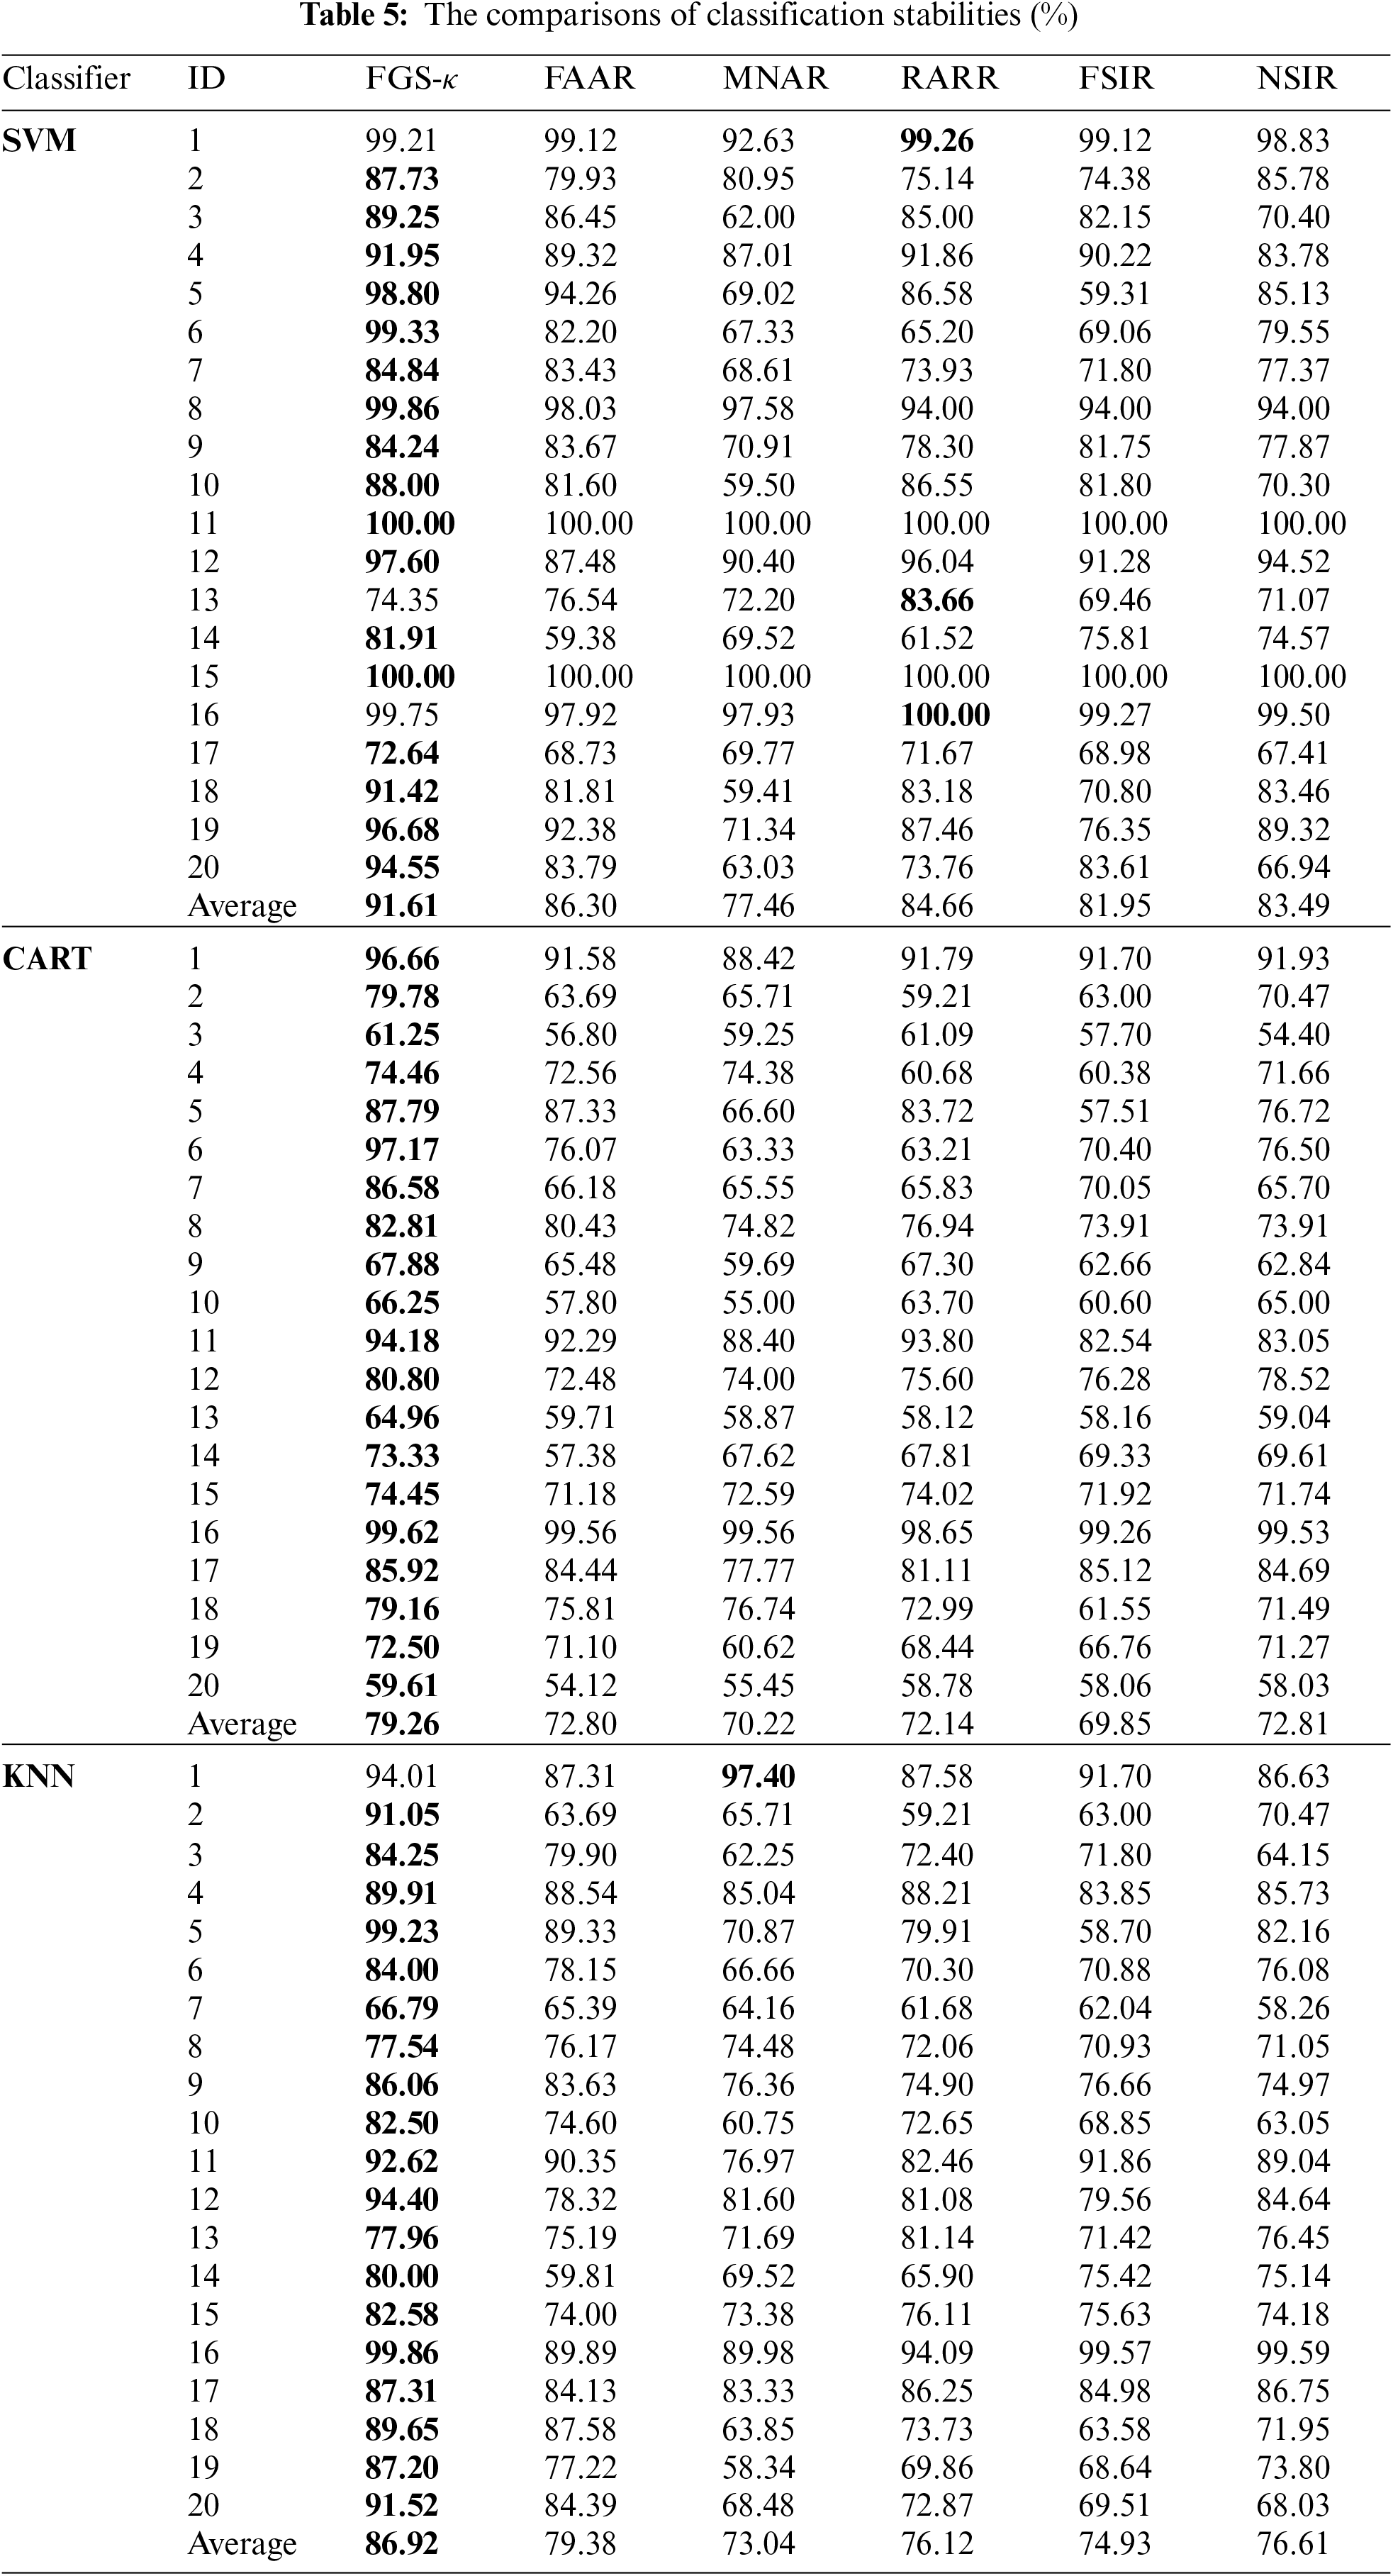
In this part, the classification stabilities derived from different kinds of reducts are compared. Table 5 shows the mean values of different classification stabilities obtained over 20 datasets. A closer look at Table 5 reveals the following facts.
(1) Whichever classifier is chosen, the classification stabilities based on κ-reducts are more significant than others over most datasets. Take the dataset “Wisconsin Diagnostic Breast Cancer (ID:18)” as an example. Through the use of SVM, the classification stability of FGS-κ, FAAR, MNAR, RARR, FSIR and NSIR are 91.42%, 81.81%, 59.41%, 83.18%, 70.80% and 83.46%, respectively. Through the use of CART, the classification stability of FGS-κ, FAAR, MNAR, RARR, FSIR and NSIR are 79.16%, 75.81%, 76.74%, 72.99%, 61.55% and 71.49%, respectively. Through the use of KNN, the classification stability of FGS-κ, FAAR, MNAR, RARR, FSIR and NSIR are 89.65%, 87.58%, 63.85%, 73.73%, 63.58% and 71.95%, respectively.
(2) From the perspective of the average values, the classification stability of FGS-κ is also greater than those related to FAAR, MNAR, RARR, FSIR and NSIR, respectively. Through the use of SVM, the classification stability of FGS-κ is over 5.87% higher than others. Through the use of CART, the classification stability of FGS-κ is over 8.21% higher than others. Through the use of KNN, the classification stability of FGS-κ is over 8.73% higher than others.
From the discussions above, our new approach is superior to state-of-the-art attribute reduction strategies in offering stable classification results from the discussions above.
4.4.2 Comparisons among Classification Accuracies
In this part, the classification accuracies based on different kinds of reducts are also compared. Different classification accuracies acquired by 20 datasets are shown in Table 6. A closer look at Table 6 reveals the following facts.
(1) Whichever classifier is chosen, the classification accuracies based on κ-reducts are more significant than others over most datasets. Take the dataset “Ultrasonic Flowmeter Diagnostics-Meter D (ID:15)” as an example. By employing SVM, the classification accuracy of FGS-κ, FAAR, MNAR, RARR, FSIR and NSIR are 73.58%, 71.48%, 70.58%, 71.48%, 71.48% and 71.48%, respectively. By employing CART, the classification accuracy of FGS-κ, FAAR, MNAR, RARR, FSIR and NSIR are 79.24%, 79.20%, 75.18%, 72.22%, 77.78% and 72.22%, respectively. By employing KNN, the classification accuracy of FGS-κ, FAAR, MNAR, RARR, FSIR and NSIR are 69.56%, 59.56%, 55.18%, 62.22%, 57.78% and 62.22%, respectively.
(2) From the perspective of the average values, the classification precision related to FGS-κ is also more significant than those of FAAR, MNAR, RARR, FSIR and NSIR. By employing SVM, the classification accuracy of FGS-κ is over 5.92% higher than others. By employing CART, the classification accuracy of FGS-κ is over 8.46% higher than others. By employing KNN, the classification accuracy of FGS-κ is over 5.61% higher than others.
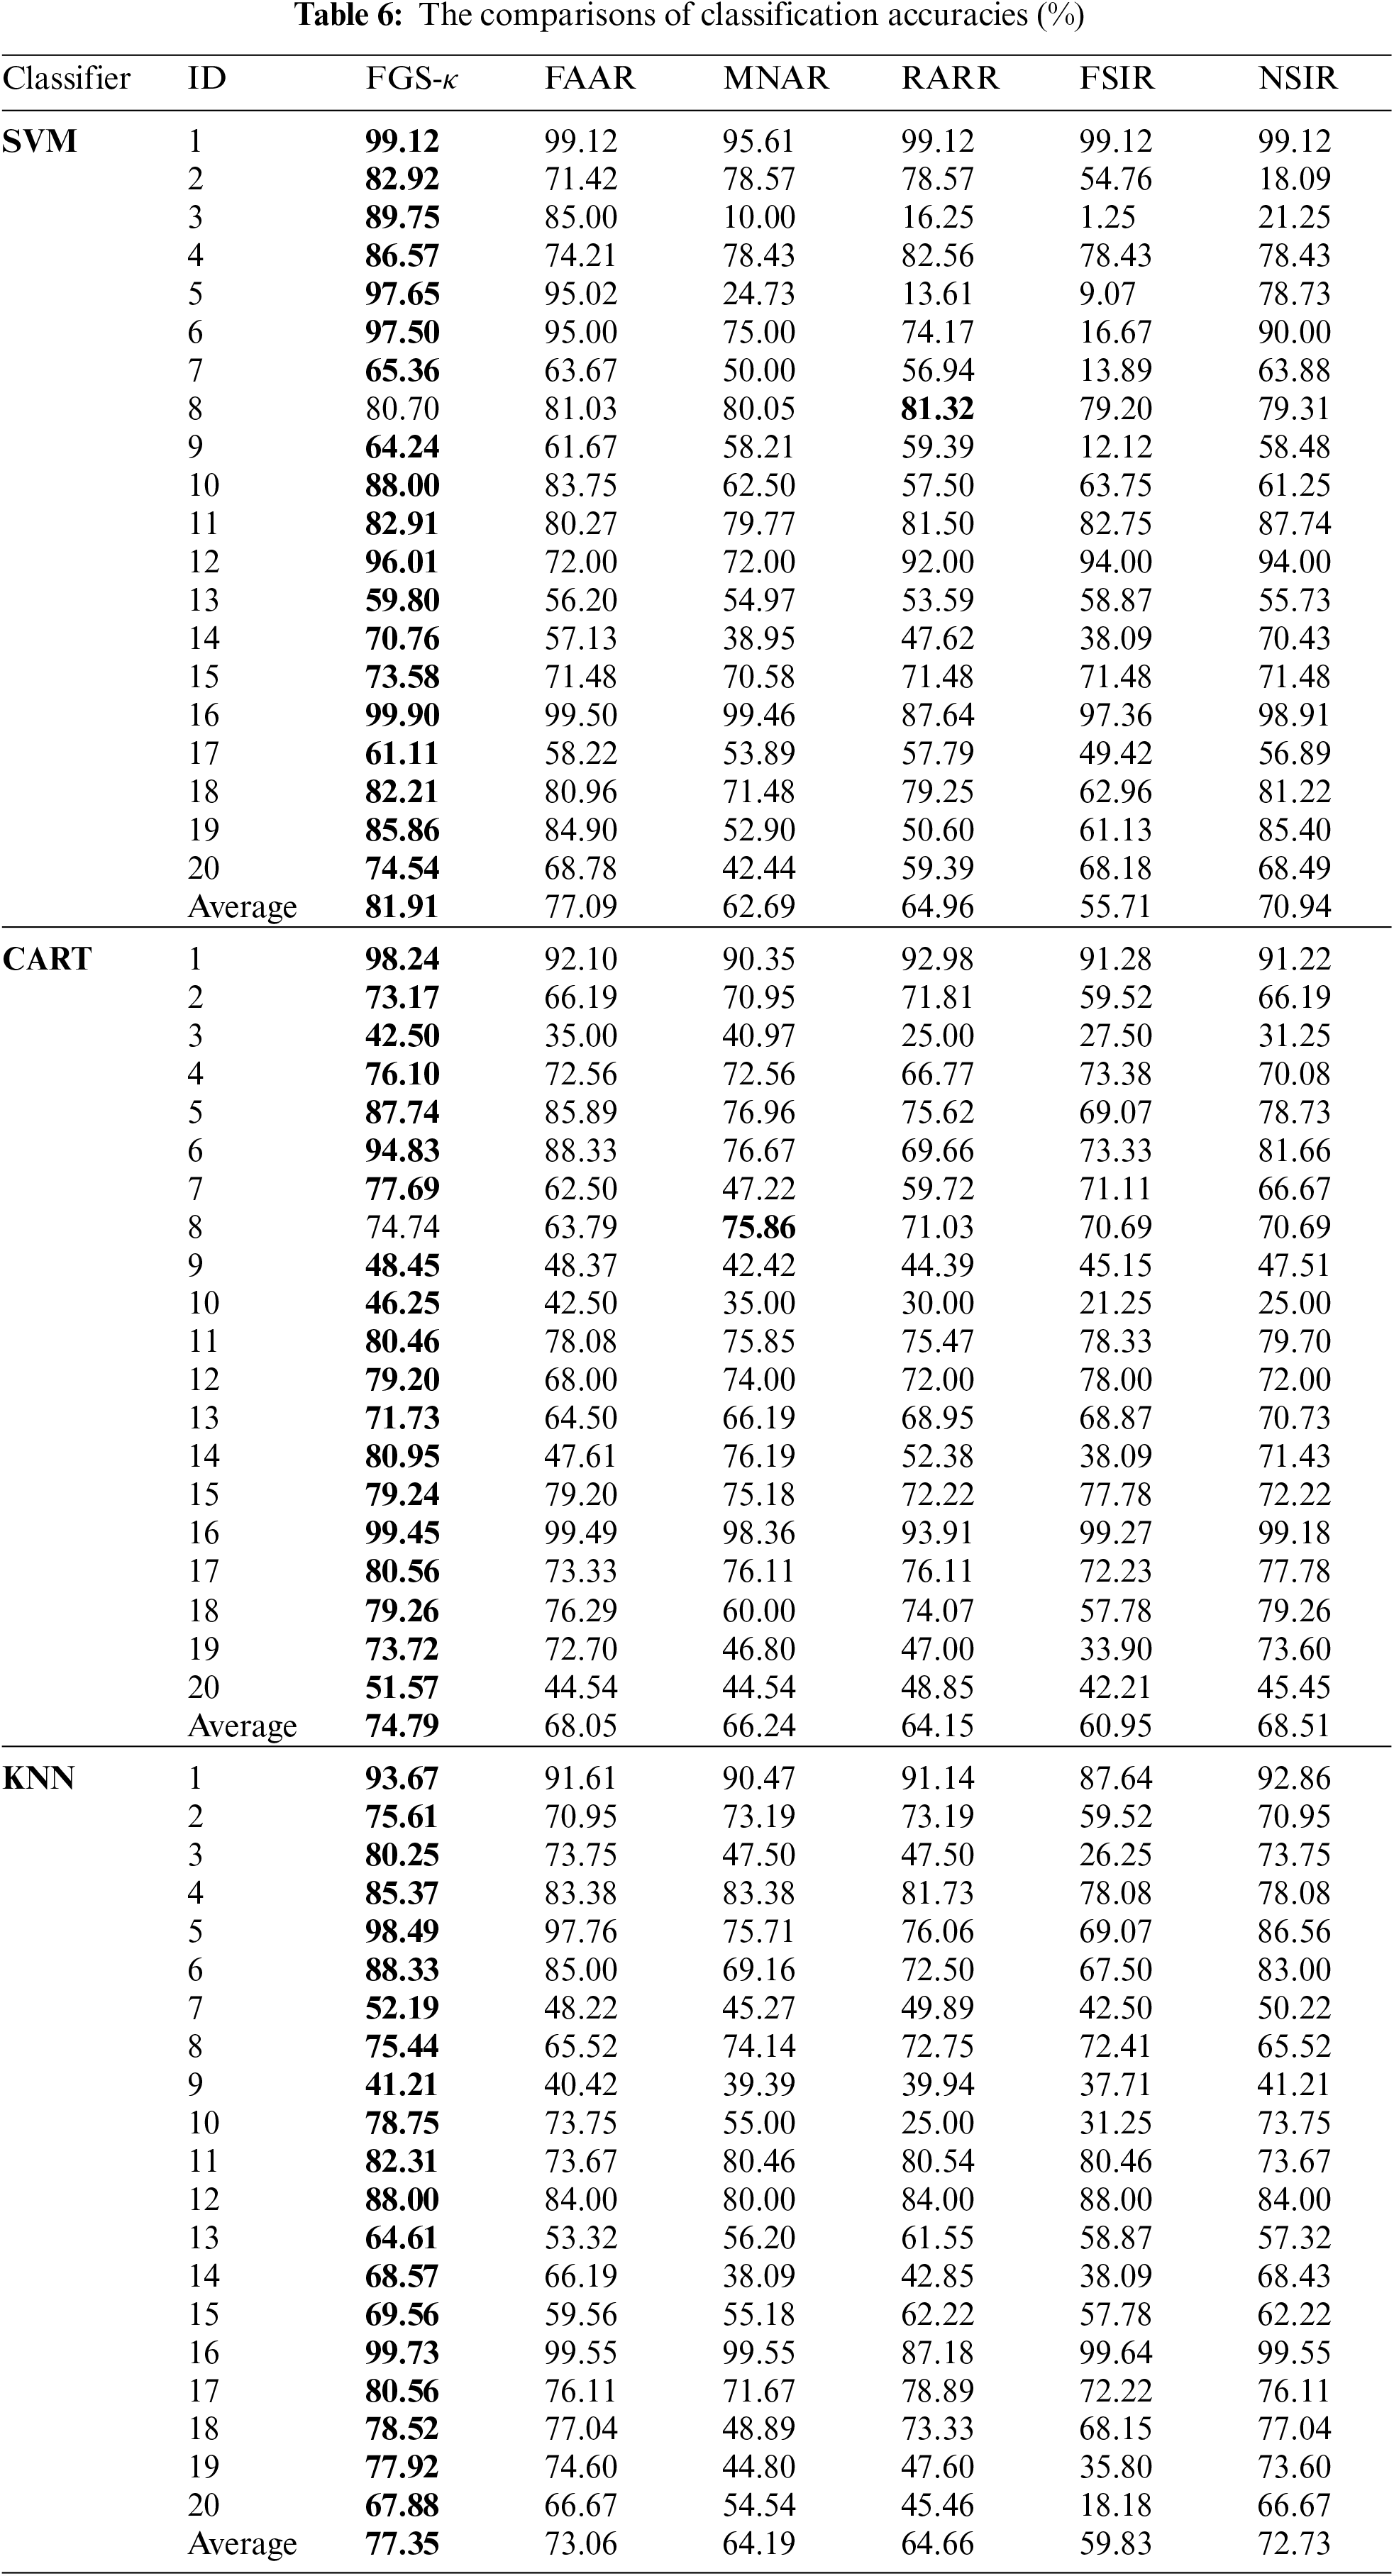
From the discussions above, our new approach is superior to popular attribute reduction strategies in providing more precise classification results.
In such a study, with a review of limitations derived from measures based on single perspective, a novel measure, called quality-to-entropy, is proposed. The superiorities of our research are: in the process of searching reduct, not only can the relationship between condition attributes and labels be characterized from the supervised perspective, but also the internal structure of data can be quantitatively described. More importantly, our new measure can be further introduced into other search strategies. Through extensive experiments, it has been demonstrated that the proposed measure helps select attributes with significantly superior classification performance.
Further investigations will be focused on the following aspects:
(1) Our strategy is developed based on the neighborhood rough set. It can also be further introduced into other rough sets, e.g., fuzzy rough set [36,53,55] and decision-theoretic rough set [41].
(2) Fused measures may increase time consumption for seeking out a reduct, accelerators [3,42] to reduce the corresponding elapsed time are then necessary.
Funding Statement: This work was supported by the National Natural Science Foundation of China (Grant Nos. 62006099, 62076111), the Key Research and Development Program of Zhenjiang-Social Development (Grant No. SH2018005), the Natural Science Foundation of Jiangsu Higher Education (Grant No. 17KJB520007), Industry-school Cooperative Education Program of the Ministry of Education (Grant No. 202101363034).
Conflicts of Interest: The authors declare that they have no conflicts of interest in reporting regarding the present study.
References
1. Z. H. Jiang, X. B. Yang, H. L. Yu, D. Liu, P. X. Wang et al., “Accelerator for multi-granularity attribute reduction,” Knowledge-Based Systems, vol. 177, pp. 145–158, 2019. [Google Scholar]
2. Y. Chen, X. B. Yang, J. H. Li, P. X. Wang and Y. H. Qian, “Fusing attribute reduction accelerators,” Information Sciences, vol. 587, pp. 354–370, 2022. [Google Scholar]
3. P. X. Wang and X. B. Yang, “Three-way clustering method based on stability theory,” IEEE Access, vol. 9, pp. 33944–33953, 2021. [Google Scholar]
4. Q. Chen, T. H. Xu and J. J. Chen, “Attribute reduction based on lift and random sampling,” Symmetry- Basel, vol. 14, no. 9, pp. 1828, 2022. [Google Scholar]
5. Z. Pawlak, “Rough sets,” International Journal of Computer and Information Sciences, vol. 11, no. 5, pp. 341–356, 1982. [Google Scholar]
6. X. B. Yang, Y. Qi, D. J. Yu, H. L. Yu and J. Y. Yang, “α-Dominance relation and rough sets in interval-valued information systems,” Information Sciences, vol. 294, pp. 334–347, 2015. [Google Scholar]
7. K. Y. Liu, X. B. Yang, H. L. Yu, H. Fujita, X. J. Chen et al., “Supervised information granulation strategy for attribute reduction,” International Journal of Machine Learning and Cybernetics, vol. 11, no. 9, pp. 2149–2163, 2020. [Google Scholar]
8. X. Zhang, C. L. Mei, D. G. Chen and J. H. Li, “Feature selection in mixed data: A method using a novel fuzzy rough set-based information entropy,” Pattern Recognition, vol. 56, pp. 1–15, 2016. [Google Scholar]
9. Q. H. Hu, W. Pedrycz, D. R. Yu and J. Lang, “Selecting discrete and continuous features based on neighborhood decision error minimization,” IEEE Transactions on Systems, Man, and Cybernetics, Part B(Cybernetics), vol. 40, no. 1, pp. 137–150, 2010. [Google Scholar]
10. Y. Chen, K. Y. Liu, J. J. Song, H. Fujita, X. B. Yang et al., “Attribute group for attribute reduction,” Information Sciences, vol. 535, no. 5, pp. 64–80, 2020. [Google Scholar]
11. K. Y. Liu, X. B. Yang, H. Fujita, D. Liu, X. Yang et al., “An efficient selector for multi-granularity attribute reduction,” Information Sciences, vol. 505, pp. 457–472, 2019. [Google Scholar]
12. Z. H. Jiang, K. Y. Liu, X. B. Yang, H. L. Yu, H. Fujita et al., “Accelerator for supervised neighborhood based attribute reduction,” International Journal of Approximate Reasoning, vol. 119, pp. 122–150, 2020. [Google Scholar]
13. Z. Yuan, H. M. Chen, T. R. Li, Z. Yu, B. B. Sang et al., “Unsupervised attribute reduction for mixed data based on fuzzy rough sets,” Information Sciences, vol. 572, no. 1, pp. 67–87, 2021. [Google Scholar]
14. X. B. Yang and Y. Y. Yao, “Ensemble selector for attribute reduction,” Applied Soft Computing, vol. 70, pp. 1–11, 2018. [Google Scholar]
15. Y. N. Chen, P. X. Wang, X. B. Yang and H. L. Yu, “BEE: Towards a robust attribute reduction,” International Journal of Machine Learning and Cybernetics, vol. 13, no. 12, pp. 3927–3962, 2022. [Google Scholar]
16. J. Z. Li, X. B. Yang, X. N. Song, J. H. Li, P. X. Wang et al., “Neighborhood attribute reduction: A multi-criterion approach,” International Journal of Machine Learning and Cybernetics, vol. 10, no. 4, pp. 731–742, 2019. [Google Scholar]
17. J. H. Dai, W. T. Wang, H. W. Tian and L. Liu, “Attribute selection based on a new conditional entropy for incomplete decision systems,” Knowledge-Based Systems, vol. 39, no. 1, pp. 207–213, 2013. [Google Scholar]
18. J. H. Dai, Q. Xu, W. T. Wang and H. W. Tian, “Conditional entropy for incomplete decision systems and its application in data mining,” International Journal of General Systems, vol. 41, no. 74, pp. 713–728, 2012. [Google Scholar]
19. Y. H. Qian, J. Y. Liang, W. Pedrycz and C. Y. Dang, “Positive approximation: An accelerator for attribute reduction in rough set theory,” Artificial Intelligence, vol. 174, no. 9–10, pp. 597–618, 2010. [Google Scholar]
20. W. Y. Li, H. M. Chen, T. R. Li, J. H. Wan and B. B. Sang, “Unsupervised feature selection via self-paced learning and low-redundant regularization,” Knowledge-Based Systems, vol. 240, no. 11, pp. 108150, 2022. [Google Scholar]
21. X. B. Yang, Y. Qi, H. L. Yu, X. N. Song and J. Y. Yang, “Updating multi-granulation rough approximations with increasing of granular structures,” Knowledge-Based Systems, vol. 64, pp. 59–69, 2014. [Google Scholar]
22. S. P. Xu, X. B. Yang, H. L. Yu, D. J. Yu and J. Y. Yang, “Multi-label learning with label-specific feature reduction,” Knowledge-Based Systems, vol. 104, pp. 52–61, 2016. [Google Scholar]
23. K. Y. Liu, T. R. Li, X. B. Yang, H. R. Ju, X. Yang et al., “Hierarchical neighborhood entropy based multi-granularity attribute reduction with application to gene prioritization,” International Journal of Approximate Reasoning, vol. 148, no. 3, pp. 57–67, 2022. [Google Scholar]
24. J. Qian, D. Q. Miao, Z. H. Zhang and W. Li, “Hybrid approaches to attribute reduction based on indiscernibility and discernibility relation,” International Journal of Approximate Reasoning, vol. 52, no. 2, pp. 212–230, 2011. [Google Scholar]
25. K. Y. Liu, X. B. Yang, H. L. Yu, J. S. Mi, P. X. Wang et al., “Rough set based semi-supervised feature selection via ensemble selector,” Knowledge-Based Systems, vol. 165, pp. 282–296, 2019. [Google Scholar]
26. X. B. Yang, M. Zhang, H. L. Dou and J. Y. Yang, “Neighborhood systems-based rough sets in incomplete information system,” Knowledge-Based Systems, vol. 24, no. 6, pp. 858–867, 2011. [Google Scholar]
27. Y. H. Qian, H. H. Cheng, J. T. Wang, J. Y. Liang, W. Pedrycz et al., “Grouping granular structures in human granulation intelligence,” Information Sciences, vol. 382–383, no. 6, pp. 150–169, 2017. [Google Scholar]
28. X. B. Yang, Y. H. Qian and J. Y. Yang, “On characterizing hierarchies of granulation structures via distances,” Fundamenta Informaticae, vol. 123, no. 3, pp. 365–380, 2013. [Google Scholar]
29. Q. H. Hu, D. R. Yu and Z. X. Xie, “Neighborhood classifiers,” Expert Systems with Applications, vol. 34, no. 2, pp. 866–876, 2008. [Google Scholar]
30. K. Cheng, S. Gao, W. L. Dong, X. B. Yang, Q. Wang et al., “Boosting label weighted extreme learning machine for classifying multi-label imbalanced data,” Neurocomputing, vol. 403, no. 8, pp. 360–370, 2020. [Google Scholar]
31. S. P. Xu, H. R. Ju, L. Shang, W. Pedrycz, X. B. Yang et al., “Label distribution learning: A local collaborative mechanism,” International Journal of Approximate Reasoning, vol. 121, no. 7, pp. 59–84, 2020. [Google Scholar]
32. Y. Chen, P. X. Wang, X. B. Yang, J. S. Mi and D. Liu, “Granular ball guided selector for attribute reduction,” Knowledge-Based Systems, vol. 229, pp. 107326, 2021. [Google Scholar]
33. X. B. Yang, S. P. Xu, H. L. Dou, X. N. Song, H. L. Yu et al., “Multi-granulation rough set: A multiset based strategy,” International Journal of Computational Intelligence Systems, vol. 10, no. 1, pp. 277–292, 2017. [Google Scholar]
34. X. B. Yang, S. C. Liang, H. L. Yu, S. Gao and Y. H. Qian, “Pseudo-label neighborhood rough set: Measures and attribute reductions,” International Journal of Approximate Reasoning, vol. 105, pp. 112–129, 2019. [Google Scholar]
35. Y. H. Qian, J. Y. Liang and W. Wei, “Consistency-preserving attribute reduction in fuzzy rough set framework,” International Journal of Machine Learning and Cybernetics, vol. 4, no. 4, pp. 287–299, 2013. [Google Scholar]
36. T. H. Xu, G. Y. Wang and J. Yang, “Finding strongly connected components of simple digraphs based on granulation strategy,” International Journal of Approximate Reasoning, vol. 118, no. 1, pp. 64–78, 2020. [Google Scholar]
37. Y. Y. Yao and Y. Zhao, “Discernibility matrix simplification for constructing attribute reducts,” Information Sciences, vol. 179, no. 7, pp. 867–882, 2009. [Google Scholar]
38. C. Z. Wang, Q. H. Hu, X. Z. Wang, D. G. Chen, Y. H. Qian et al., “Feature selection based on neighborhood discrimination index,” IEEE Transactions on Neural Networks and Learning Systems, vol. 29, no. 7, pp. 2986–2999, 2018. [Google Scholar] [PubMed]
39. X. S. Rao, K. Y. Liu, J. J. Song, X. B. Yang and Y. H. Qian, “Gaussian kernel fuzzy rough based attribute reduction: An acceleration approach,” Journal of Intelligent & Fuzzy Systems, vol. 39, no. 1, pp. 1–17, 2020. [Google Scholar]
40. J. J. Song, E. C. C. Tsang, D. G. Chen and X. B. Yang, “Minimal decision cost reduct in fuzzy decision-theoretic rough set model,” Knowledge-Based Systems, vol. 126, no. 1, pp. 104–112, 2017. [Google Scholar]
41. Y. H. Qian, J. Y. Liang, W. Pedrycz and C. Y. Dang, “An efficient accelerator for attribute reduction from incomplete data in rough set framework,” Pattern Recognition, vol. 44, no. 8, pp. 1658–1670, 2011. [Google Scholar]
42. X. S. Rao, X. B. Yang, X. Yang, X. J. Chen, D. Liu et al., “Quickly calculating reduct: An attribute relationship-based approach,” Knowledge-based Systems, vol. 200, pp. 106014, 2020. [Google Scholar]
43. Y. X. Liu, Z. C. Gong, K. Y. Liu, S. P. Xu, H. R. Ju et al., “A q-learning approach to attribute reduction,” Applied Intelligence, vol. 53, pp. 3750–3765, 2022. [Google Scholar]
44. P. X. Wang, H. Shi, X. B. Yang and J. S. Mi, “Three-way k-means: Integrating k-means and three-way decision,” International Journal of Machine Learning and Cybernetics, vol. 10, no. 10, pp. 2767–2777, 2019. [Google Scholar]
45. J. Ba, K. Y. Liu, H. R. Ju, S. P. Xu, T. H. Xu et al., “Triple-g: A new mgrs and attribute reduction,” International Journal of Machine Learning and Cybernetics, vol. 13, no. 2, pp. 337–356, 2022. [Google Scholar]
46. Z. C. Gong, Y. X. Liu, T. H. Xu, P. X. Wang and X. B. Yang, “Unsupervised attribute reduction: Improving effectiveness and efficiency,” International Journal of Machine Learning and Cybernetics, vol. 13, no. 11, pp. 3645–3662, 2022. [Google Scholar]
47. C. -C. Chang and C. -J. Lin, “LIBSVM: A library for support vector machines,” ACM Transactions on Intelligent Systems and Technology, vol. 2, no. 3, pp. 27, 2011. [Google Scholar]
48. M. Krzywinski and N. Altman, “Classification and regression trees,” Nature Methods, vol. 14, no. 8, pp. 755–756, 2017. [Google Scholar]
49. K. Fukunaga and P. M. Narendra, “A branch and bound algorithm for computing k-nearest neighbors,” IEEE Transactions on Computers, vol. 24, no. 7, pp. 750–753, 1975. [Google Scholar]
50. S. Y. Xia, H. Zhang, W. H. Li, G. Y. Wang, E. Giem et al., “GBNRS: A novel rough set algorithm for fast adaptive attribute reduction in classification,” IEEE Transactions on Knowledge and Data Engineering, vol. 34, no. 3, pp. 1231–1242, 2020. [Google Scholar]
51. L. J. Dong, D. G. Chen, N. L. Wang and Z. H. Lu, “Key energy-consumption feature selection of thermal power systems based on robust attribute reduction with rough sets,” Information Sciences, vol. 532, no. 5, pp. 61–71, 2020. [Google Scholar]
52. C. Z. Wang, Y. Huang, W. P. Ding and Z. H. Cao, “Attribute reduction with fuzzy rough self-information measures,” Information Sciences, vol. 549, no. 12, pp. 68–86, 2021. [Google Scholar]
53. C. Z. Wang, Y. Huang, M. W. Shao, Q. H. Hu and D. Chen, “Feature selection based on neighborhood self-information,” IEEE Transactions on Cybernetics, vol. 50, no. 9, pp. 4031–4042, 2020. [Google Scholar] [PubMed]
54. J. J. Song, X. B. Yang, X. N. Song, H. L. Yu and J. Y. Yang, “Hierarchies on fuzzy information granulations: A knowledge distance based lattice approach,” Journal of Intelligent & Fuzzy Systems, vol. 27, no. 3, pp. 1107–1117, 2014. [Google Scholar]
55. W. W. Yan, J. Ba, T. H. Xu, H. L. Yu, J. L. Shi et al., “Beam-influenced attribute selector for producing stable reduct,” Mathematics, vol. 10, no. 4, pp. 553, 2022. [Google Scholar]
Cite This Article
 Copyright © 2023 The Author(s). Published by Tech Science Press.
This work is licensed under a Creative Commons Attribution 4.0 International License , which permits unrestricted use, distribution, and reproduction in any medium, provided the original work is properly cited.
 Downloads
 Citation Tools