 Open Access
ARTICLE
A Weakly-Supervised Method for Named Entity Recognition of Agricultural Knowledge Graph
Harbin Institute of Technology, Harbin, 150001, China
* Corresponding Author: Jingchi Jiang. Email:
Intelligent Automation & Soft Computing 2023, 37(1), 833-848. https://doi.org/10.32604/iasc.2023.036402
Received 01 October 2022; Accepted 14 November 2022; Issue published 29 April 2023
Abstract
It is significant for agricultural intelligent knowledge services using knowledge graph technology to integrate multi-source heterogeneous crop and pest data and fully mine the knowledge hidden in the text. However, only some labeled data for agricultural knowledge graph domain training are available. Furthermore, labeling is costly due to the need for more data openness and standardization. This paper proposes a novel model using knowledge distillation for a weakly supervised entity recognition in ontology construction. Knowledge distillation between the target and source data domain is performed, where Bi-LSTM and CRF models are constructed for entity recognition. The experimental result is shown that we only need to label less than one-tenth of the data for model training. Furthermore, the agricultural domain ontology is constructed by BILSTM-CRF named entity recognition model and relationship extraction model. Moreover, there are a total of 13,983 entities and 26,498 relationships built in the neo4j graph database.Keywords
According to statistics, there are more than 1,400 kinds of common crop diseases and pests in agriculture. The loss of crop yield and farmers’ income is severe due to diseases and pests yearly. At the same time, it is difficult for users to efficiently query and use various crop diseases and pest information resources because of the wide range of data sources, different ways of data representation, storage, and organization, and the state of disordered and relatively chaotic resources. With the development of the knowledge graph, it is of great significance to use knowledge extraction technology to integrate multi-source heterogeneous crop and pest data and fully mine the knowledge hidden in the text. Two main tasks are entity recognition and relationship extraction in constructing agricultural knowledge graphs.
Recently, researchers have begun to use deep learning for entity recognition. LSTM/Bi-LSTM [1] is frequently combined with the conditional random fields CRF model [2] for entity recognition [3,4] to avoid the problem of relying on much prior knowledge. However, the above method is data-hungry, requiring lots of training data. However, knowledge data, especially labeled data, are difficult to obtain in the agricultural field. The cost is very high to label entity recognition data.
Moreover, adopting the entity recognition scheme from the general field can hardly perform. In crop diseases and insect pests, entity recognition’s difficulties lie in uneven data quality and the high requirement of manual labeling. As a result, the existing models have significant problems, such as worse entity recognition effects and manual relationship extraction.
Hence, a significant problem has to be solved to reduce the dependence on data annotation. Entity recognition task in the agricultural knowledge graph is performed by using massive unlabeled data, learning from small samples, and gradually learning new knowledge by self-exploration to form an interactive learning process. There are three contributions to the paper.
• Our study proposes a novel model based on transfer learning to solve the problem of scarcity of annotation data for agricultural entity recognition.
• A novel transfer learning method is proposed by knowledge distillation between the target and source data domain, where Bi-LSTM and CRF models are constructed for entity recognition.
• The agricultural knowledge graph is constructed with 13983 entities and 26498 relationships. Experiment results show that only one-tenth of annotation data is used in making an entity recognition model without affecting the model’s performance.
Back in the 1960s, a semantic network was proposed and applied in the computer field [5]. It has used a network of interconnected nodes and arcs to represent the semantic relationships between concepts and entities. In May 2012, Google officially proposed the knowledge graph concept [6] that the knowledge graph is essentially a semantic network. Nodes can be entities or abstract concepts, and edges can be entity attributes or relationships [7]. A knowledge graph allows knowledge representation and management to solve knowledge association problems, such as knowledge retrieval and semantic question answering [8].
Knowledge graph technology can be divided into general and vertical domain knowledge graphs. A general knowledge graph is typically large-scale in a broad field with much common sense [9]. The vertical domain knowledge graph has the desirable advantages of accuracy and fine granularity for supporting knowledge reasoning and retrieval applications. Some knowledge graphs are built by academia and industry for crop diseases and pests [10]. Knowledge graph for crop pests and diseases has been widely applied for crop variety selection [11], greenhouse environment control, pest control [12], economic benefit analysis [13], and other aspects of agricultural production and application [14–17].
Knowledge graph provides a more effective way to express, organize, manage and utilize massive and heterogeneous crop pest information. Research has been conducted on knowledge graph management in the construction of crop pest ontology since the concept of ontology was introduced into the computer field to describe knowledge in the 1980s. Beck et al. [18] have established an ontology, including the concepts and relationships of crops and related pests and pest management issues. Wang et al. [19] have constructed an ontology to organize and manage citrus production knowledge in the hilly areas of Chongqing, China, extracted citrus fertilizer and water ontology from documents and charts of citrus production knowledge. Chougule et al. [20] have proposed a method to construct a crop pest ontology in India. Natural processing technology has been used to describe the species and cases of pests and diseases, and ontology has been applied to the expert system of pests and diseases. Cañadas et al. [21] have proposed an ontology management scheme for grape pests and developed a professional web page tool based on this ontology for quality evaluation. Lagos-ortiz et al. [22] have proposed an ontology based on the decision support system for pest control of sugarcane, rice, soybean, and cocoa crops. It guides pest diagnosis and management.
There are two issues about entity recognition and relation extraction in ontology construction. Malarkodi et al. [23] have applied the conditional random field model to input some syntactic and lexical features, which rely on manual construction features. Biswas et al. [24] have used WordNet [25] for agricultural entity recognition. This method is not different from dictionary matching in essence, but it uses the correlation of WordNet words to expand the dictionary. With the application development for deep learning, many researchers recently used machine learning for entity recognition in agriculture [26,27]. Li et al. [26] have proposed an attention-based Bert model that combines BiLSTM and CRF models for entity recognition. Remote supervision is used to solve the problem of obtaining the annotation data of relationship extraction. Zhao et al. [27] have constructed BiLSTM and CRF models for entity recognition in knowledge graphs and used the continuous bag of words (CBOW) model to pre-train the input word vector. There is also research about effectively combining multiple syntactic tree information of sentences for relation extraction in crop diseases and insect pests [22,28]. Till now, the current relationship extraction of neural networks is mainly used for pre-defined relationship types [29–32].
However, most domain ontologies still rely on manual construction, which requires many humans to collect information and organize concepts between semantic connections. The defects in construction efficiency, applicability, and scalability have become difficulties in building large-scale ontologies [10]. The word formation of agricultural entities is complex and varied due to the need for labeled training data. Segmenting words on the domain data set using the existing general vocabulary could be better, making entity recognition in the agricultural field more challenging. Furthermore, the research needs to improve the coarse granularity of entity annotation.
Furthermore, the construction methods used mostly rely on feature templates defined based on a corpus, resulting in the model’s weak scalability and generalization ability. Suppose more automation cannot be further improved. In that case, it is challenging to meet the requirements of the actual question and answer in application scenarios, precise recommendations, and other advanced knowledge service needs.
3 Ontology Construction of Agricultural Knowledge Graph
Ontology representation has become the mainstream in which knowledge is expressed in the form of networks. The ontology is a model of representing and organizing knowledge of the agricultural domain, such as pests and diseases. Ontology focuses on the intrinsic characteristics of entities. The designed ontology in this paper has seven entities and 39 sub-entities to describe the basic information of disease, pest, and other class instances. This section will introduce the design of ontology and the relationship between entities.
Ontology architecture intuitively displays entities and their attributes and the relationship among entities. The outline of the agricultural domain ontology designed in this paper is shown in Fig. 1. The figure describes seven defined entities and the relationships between these entities. There may be no relationship between entities. For example, there is no defined relationship between pesticides and fertilizers. There are also a variety of relationships. For example, the natural environment may accelerate or inhibit the growth of crops. There is also a relationship between the entity itself. For example, there is a control relationship between pests.
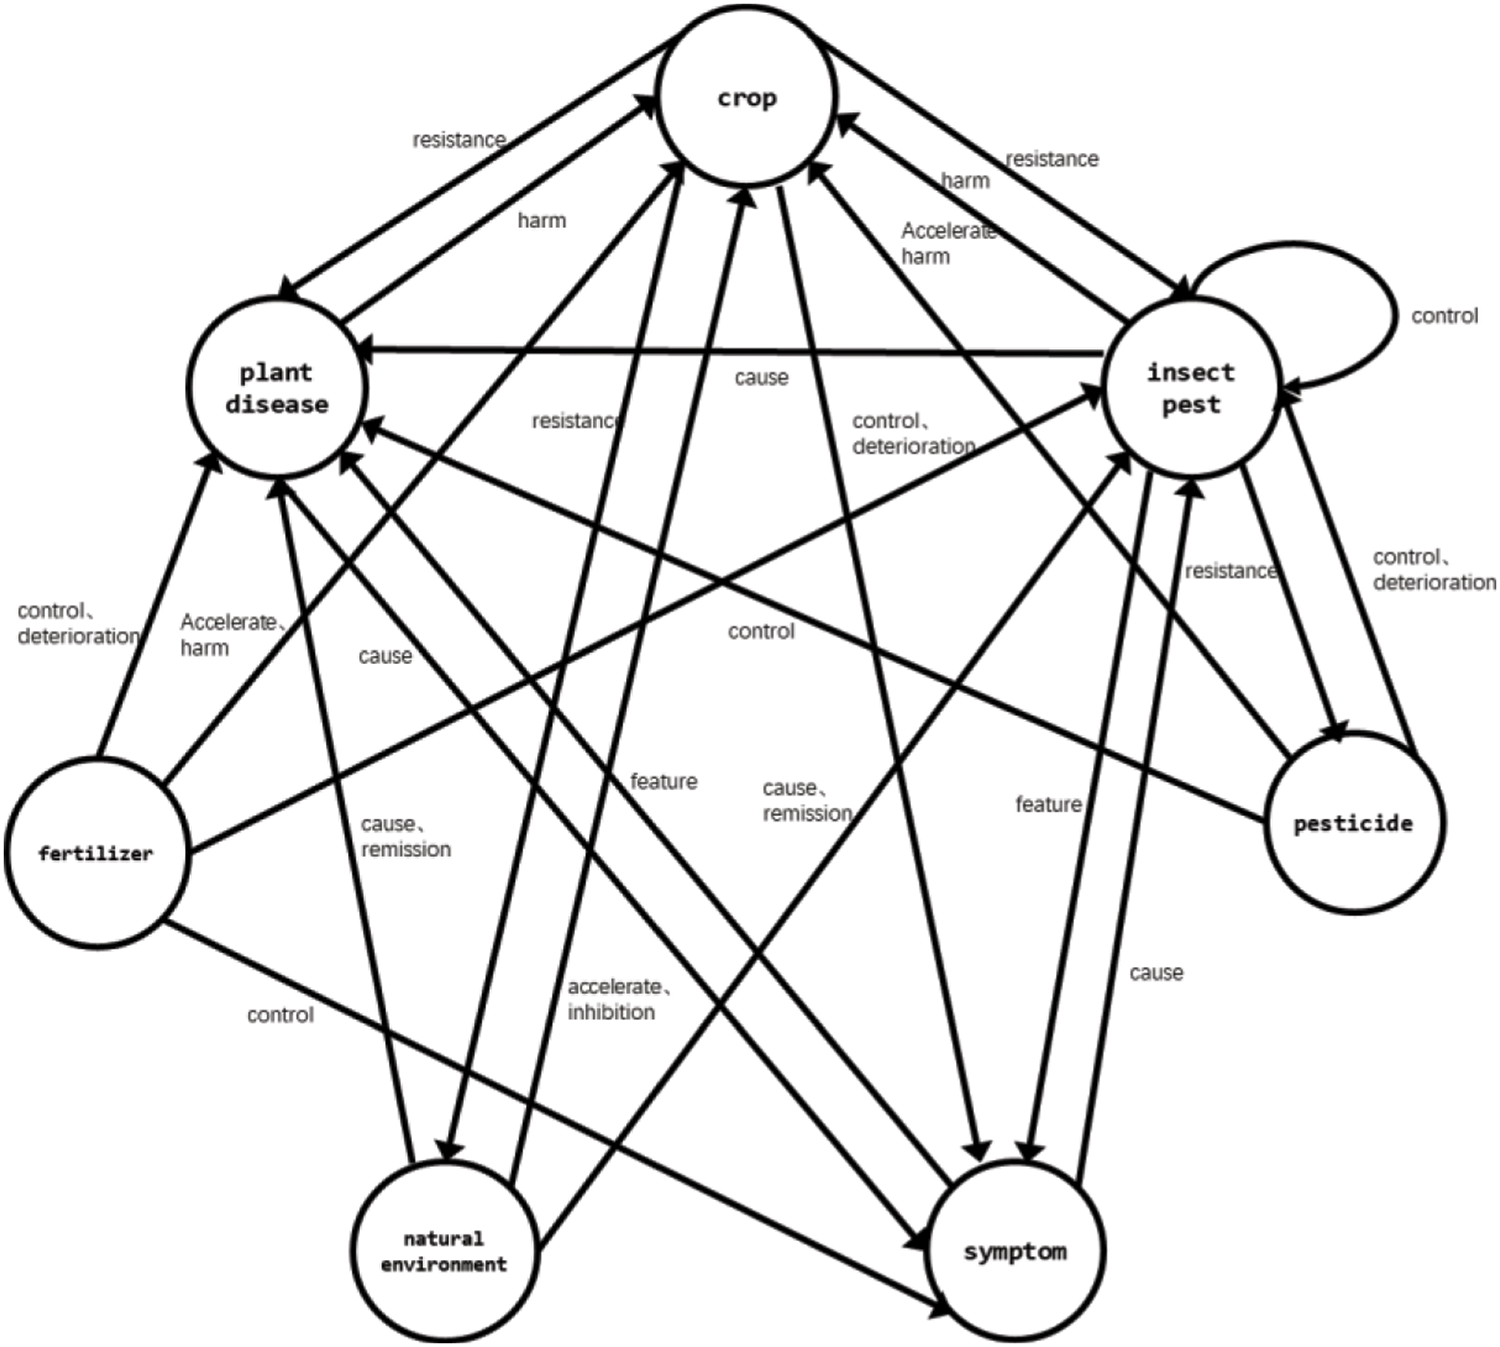
Figure 1: Ontology architecture
The ontology defines seven entities: crop, plant, disease, pests, pesticides, fertilizers, symptoms, and natural environment. Crops are divided into field crops, fruits, and vegetables. Their attributes include a nickname, Latin name, boundary, phylum, class, order, family, genus, species, distribution range, reproduction mode, processed products, cultivation technology, and value.
Diseases are subdivided into five types of entities according to the causes of diseases: fungal diseases, bacterial diseases, viral diseases, nematode diseases, and other diseases. Other diseases are caused by the lack of trace elements, the natural environment, and drug and fertilizer damage. The attributes of these diseases include nicknames, overwintering, and control methods.
Pests can be divided into three entities: Insect pests, Arachnida pests, and other pests. The attributes of pests include nicknames, overwintering, pest characteristics, and control methods. According to the role of pesticides, pesticides are subdivided into seven entities: insecticides, acaricides, rodenticides, fungicides, herbicides, synergists, and plant growth regulators. Their attributes include pesticide composition, concentration, dosage, and application methods.
Due to the different elements contained in fertilizers can be divided into five entities: nitrogen fertilizer, phosphorus fertilizer, potassium fertilizer, compound fertilizer, and trace element fertilizer. Their attributes include the use method and fertilizer dosage. The natural environment is subdivided into soil temperature, humidity, salinity, pH, soil nutrient elements, soil type, air temperature, air humidity, air carbon dioxide concentration, air ammonia concentration, wind speed, sunlight, and water.
3.2 Definition of Semantic Relationship Between Entities
Twelve semantic relationships are defined: resistance, harm, manifest, accelerate, inhibition, cause, feature, induction, control, remission, deterioration, and upper/lower. The extracted knowledge is stored in the neo4j graph database with 26,498 relationships.
4 Proposed a Weakly Supervised Model for Entity Recognition
The task of agricultural named entity recognition is to extract entities defined in the pattern layer of the agricultural knowledge graph from unstructured data, such as field crops, pesticides, fertilizers, etc. The entity is used to form nodes in the knowledge graph. It is an integral part of the construction of the agricultural knowledge graph.
The agricultural entity recognition mainly includes a corpus construction module, model training, and inference module. Among them, the proposed corpus construction module is divided into two stages: constructing agricultural knowledge graph, which crawls the agricultural knowledge from books and websites to construct the agricultural knowledge graph. The second is to label data for training in the text. Training data is partitioned into target and source domain data in this stage according to their labels. Data in the target domain does not have a label. Data in the source domain has a label. There are two parts to this stage. One is teacher model training, which uses labeled data from a source domain to train the teacher model proposed in this paper. Second, the model using data from the target domain without labels is used as the student model to distill the teacher model.
Based on BILSTM-CRF and knowledge distillation, a weakly supervised entity recognition model is proposed, as shown in Fig. 2. The model training process is divided into the following four parts.
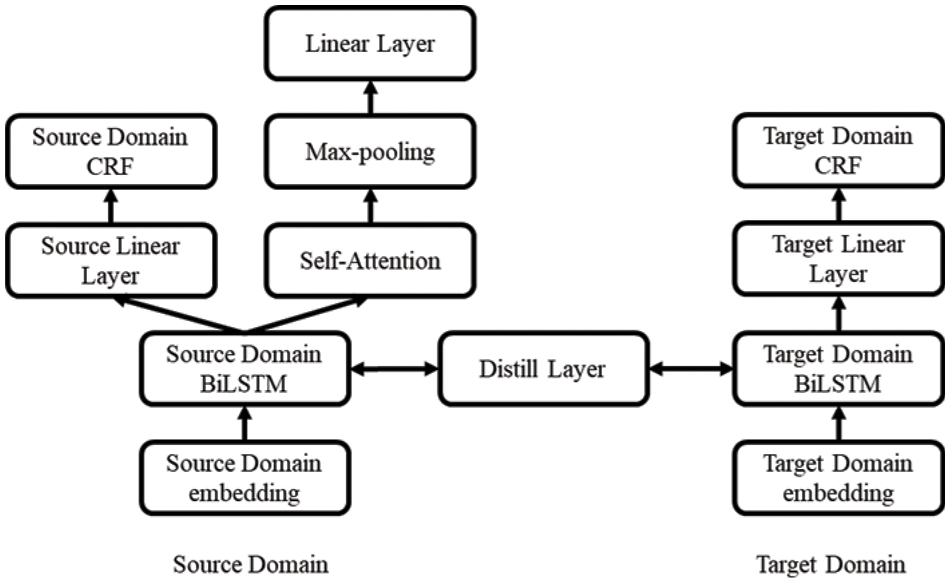
Figure 2: Transfer learning model based on knowledge distillation
4.1 Source Domain Training Model
For Chinese sentence of the source domain
Each character
Here,
Then, the probability distribution o of the corresponding tag of each character in the sentence is obtained through the linear layer.
Then the score of the sentence
where
Then,
Moreover, Y represents the probability distribution of all possible tags in the sentence.
4.2 Discriminator in the Training Domain
This part takes the result of the data of the source domain and the target domain passing through the feature extractor BILSTM in the source domain as the input and multiplies it with the three parameters in self-attention to obtain the three matrices of Q, K and V. Hence,
Here, Q
Here,
Therefore, the judgment result of the domain discriminator is:
Here,
I (d) is a conversion function that outputs 1 and 0 when D belongs to the source and the target domain, respectively.
After the source domain model and the domain discriminator are trained, the text data without labels in the target domain is taken as input. Moreover, the target domain data is divided into S and T parts through the domain discriminator. The domain discriminator identifies the data in the S part as the source domain. Moreover, the domain discriminator identifies the data in the T part as the target domain.
4.4 Knowledge Distillation Operation
Chinese sentence
It is inputted into the embedded model of the target field and the feature extractor of the target field. Feature extractor outputs the feature of the target field
The network layer obtains the average value
Finally, the loss function of knowledge distillation is defined as
The loss function of labeled data in the target domain is similar to that of the training source domain model.
The total loss function of the final model is defined as
5 Experimental Results and Analysis
Three data sets are used for experimental verification.
The data source first data set is from books, and the second is from Baidu Encyclopedia. These two datasets are used for constructing agricultural knowledge graphs. Text in the agricultural field is segmented according to the sentence. The training set is built, and the verification set is manually labeled. These include 13,983 entities and 26,498 relations constructed in the database. The third one is from Crichton et al. [33] in the field of Bioinformatics.
The structured data in the first set is highly organized and formatted data derived from the Agricultural Science Thesaurus [34]. It contains a total of 64,638 words. It is a scientific and normative agricultural information book. The unstructured data from China’s crop diseases and pests (Third Edition) [35] includes more than 775 kinds of agricultural diseases and 739 kinds of pests. It focuses on the distribution and harm, symptoms, pathogens, and control technology of diseases, as well as the distribution and harm, morphological characteristics, living habits, and control technology of pests. Six thousand thirty-six entities and 16923 relations have been constructed.
The second data set is from Baidu Encyclopedia data. Baidu Encyclopedia is an open-source Chinese encyclopedia website that contains a large number of agricultural entities and knowledge. It can be accessed at https://www.baidu.com. Considering that Baidu Encyclopedia is more accessible to crawl than other encyclopedia websites and open-source agricultural information websites, Baidu Encyclopedia data is selected to build the agricultural knowledge graph and annotate the entity recognition training corpus. The documents corresponding to agricultural entities in the Baidu Encyclopedia database are segmented to obtain an agricultural Entity Recognition Corpus. Baidu Encyclopedia entries mainly introduce some primary attributes of plants, diseases, pests, pesticides, chemical fertilizers, etc. Among them, the attributes of plants include aliases, species, subjects, phyla, morphological characteristics, distribution range, value, etc. The attributes of diseases include symptoms, pathogens, control methods, etc. At the same time, the attributes of pests include pest characteristics, control methods, etc, and the attributes of pesticides and fertilizers include components. 4965 entities and 9575 relations have been constructed.
The third data set, the BioNER dataset, is used to verify our algorithm. BioNLP11ID is selected as the source domain for transfer learning among these datasets. There are 5178 sentences. The entities include chemical (973), protein (6,551), and species (3,471). We use datasets in IOB format. These datasets are available to the open and can be accessed at https://github.com/cambridgeltl/MTL-Bioinformatics-2016 to get these datasets.
Our experiment environment is given in Table 1. And the parameter settings are given in Tables 2 and 3. The calculation methods of precision, recall, and harmonic mean (F1 value) in the experiments are as follows.


The source and target domains are Baidu Encyclopedia and book data. The parameters in the experiment are set as a batch of training data. The size is 10, and the round training epoch is 500. The optimization method of the optimizer is set to Adam. The learning rate LR is 0.01, and the weight decay WD is 0.0001. Both the source domain model and target domain model use BILSTM-CRF model.
The target domain model is trained with all training sets in the target domain and tested on the test set in the target domain. The F1 value of the model changes with the training rounds, as shown in Fig. 3. It can be seen that the target domain model has reached the maximum value of 75.59% in about 300 rounds of training.
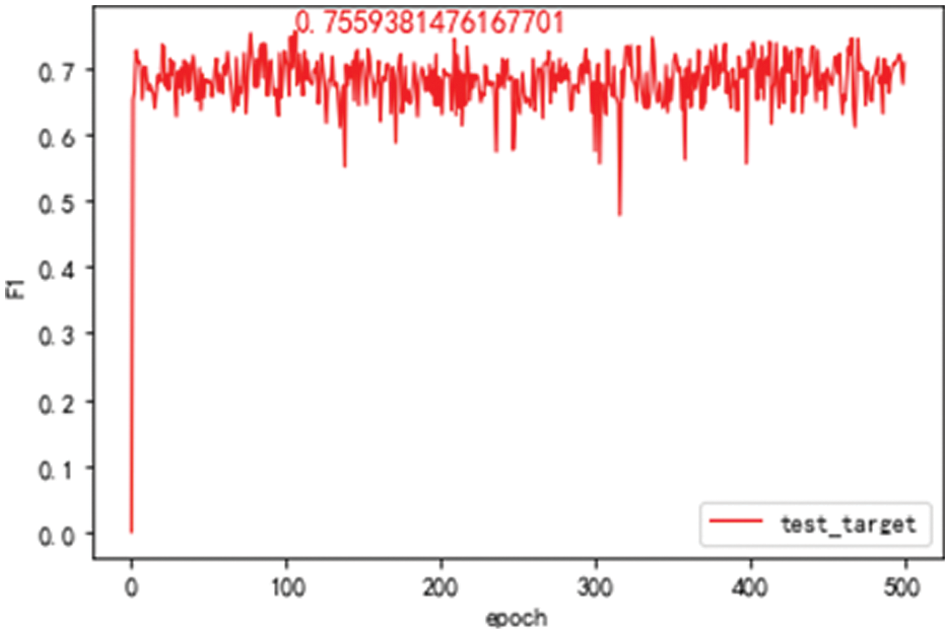
Figure 3: F1 value of the target domain model on the target domain test set
For comparison, the source domain model is trained with all training sets in the source domain and tested on the source domain test set. The F1 value of the model is given with the increase of the training rounds, as shown in Fig. 4a. It can be seen that the best value of F1 on the test set of the source domain test is 62.33%. The source domain model is trained with all training sets in the source domain and tested on the target domain. The F1 value of the model is presented with the increasing training rounds, as shown in Fig. 4b. It can be seen that the best value of F1 on the target domain test set is 47.74%. When the model achieves the best results on the source domain test set, the F1 value on the target domain test set is 34.17%.
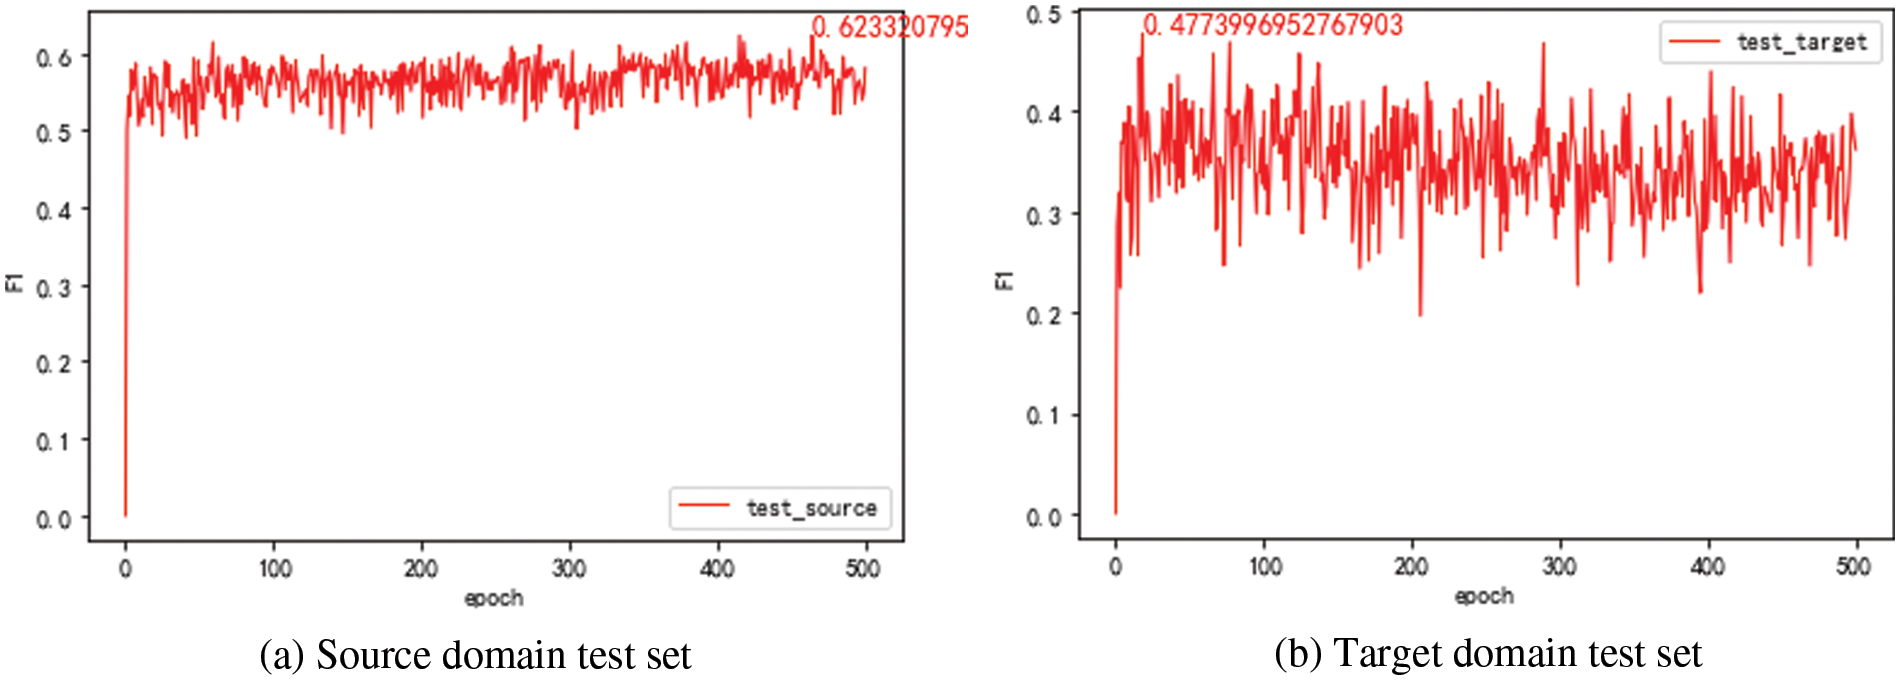
Figure 4: F1 value of the source domain model on the different domain test set
The domain discriminator model is trained and tested with mixed data from the source and target domains. The F1 value of the model is given in Fig. 5. The best value of F1 of the domain discriminator is 81.27%. It means there are still some data that the domain discriminator needs to distinguish from its domain correctly. The training set data of the target domain (7303 in total) is filtered by the domain discriminator. The results show that 425 data from the source domain and 6878 data from the target domain are judged by the domain discriminator. There are more data in the target domain.
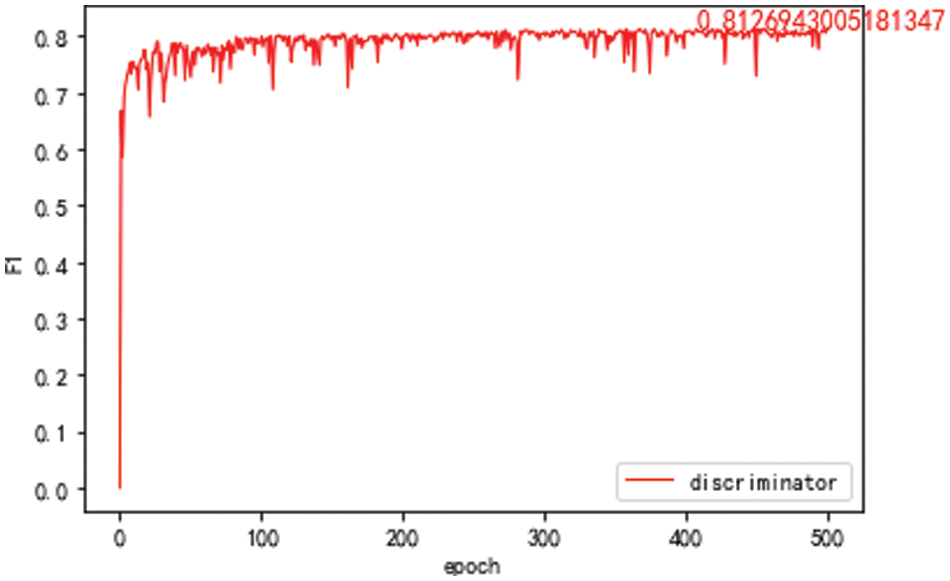
Figure 5: F1 value of the domain discriminator model after 500 epochs
After the target domain training set is divided, the part of training data from the target domain identified as the source domain by the domain discriminator is recorded as S. The part of training data in the target domain identified as the target domain is recorded as T. The experimental results for the best value of F1 in all training round for different training data is given in Table 4. The target domain models are BILSTM-CRF.

It can be seen from Table 4 that the F1 value of the target domain model after training with all the target domain data is 75.83%. When the data of part S is added for knowledge distillation, the F1 value is 76.02%. It improves by 0.19%. However, when the data of part T is added for knowledge distillation, the F1 value is 73.88%. It is shown that the data of part S can improve the model of the target domain. However, the data of part T will produce wrong characteristics in the source domain model, which will affect the performance of the target domain model. At the same time, when the target domain is trained only with the data of part S, the F1 value is 52.58%. After data from part S is added for distilling the knowledge, and F1 value of the target domain increases to 64.16%. Although compared with the result for training set S+T, the F1 value is smaller. As the data of part S only accounts for 5.8% of the total data in the target domain, the cost of labeling is significantly reduced.
The target domain model is trained only with the data of part S and tested with the target domain test set. The model’s accuracy, recall, and F1 value are given in Table 5. It can be seen that the performance of the target domain model varies with the increase of alpha. The best result is achieved within the range of 1 to 5 alpha. It means that the value of the alpha affects the knowledge distillation. When the alpha value exceeds a threshold, data in the source domain has more effect on the target domain. And then, the performance of the target domain model gets worse. When the alpha is smaller, knowledge distillation has less effect on the F1 value of the target domain model initials at 52.65%.

The precision, recall, and F1 values of our proposed model for different entities are given in Table 6. The best value of the model is 71% for crops. The reason is that the most extensive labeled data set has been constructed for crops.

For comparison, adversarial transfer learning with a self-attention mechanism is performed. The adversary transfer learning model’s data set takes the Baidu Encyclopedia’s data as the source domain. The data set of the target domain takes the S part for training and then tests with all the target domain test sets. The parameters in the experiment are set as the batch of training data is 32. The round training epoch is 2000. The optimization method of the optimizer is set to Adam. The learning rate LR is 0.01, and the alpha is 0.06 in the loss function. Finally, the F1 value of the model changes with the increasing training round epoch, as shown in Fig. 6. It can be seen that the F1 oscillation of the model is relatively intense, and the best result is 53.47%. Compared with the model effect of training only with the S part, this method’s final effect has somewhat improved.
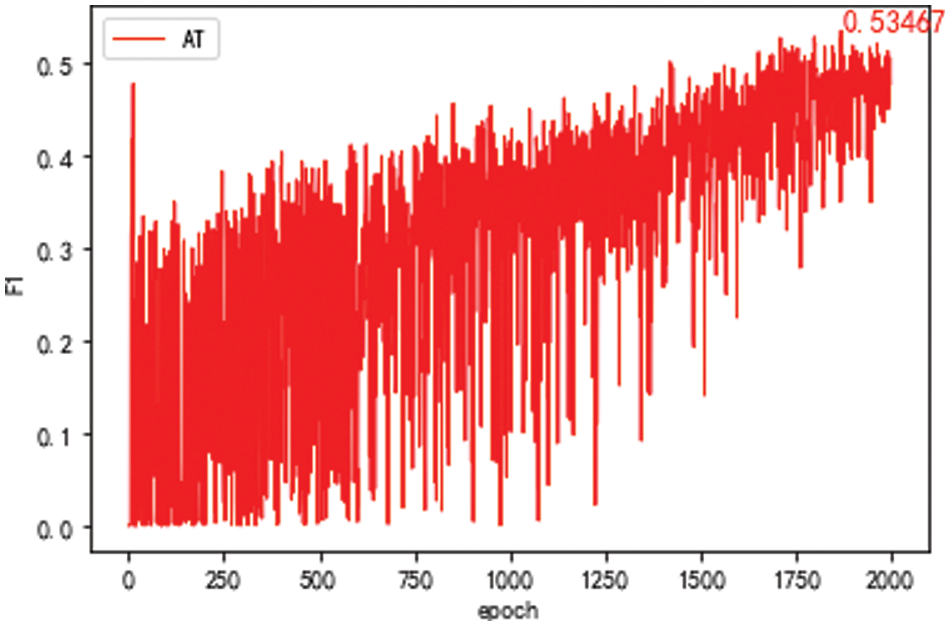
Figure 6: F1 value of the domain discriminator model after 2,000 epochs with Baidu Encyclopedia as the source domain
The data set of the adversarial learning model takes the MSR data set in the public data set SIGHAN 2005 as the source domain. The target domain data set takes the S part for training and tests with all the target domain test sets. The F1 value of the model is given in Fig. 7. The best value of the F1 of the model is 52.79%. In this model, public data sets in the non-agricultural field have little effect on improving performance for the adversarial learning model.
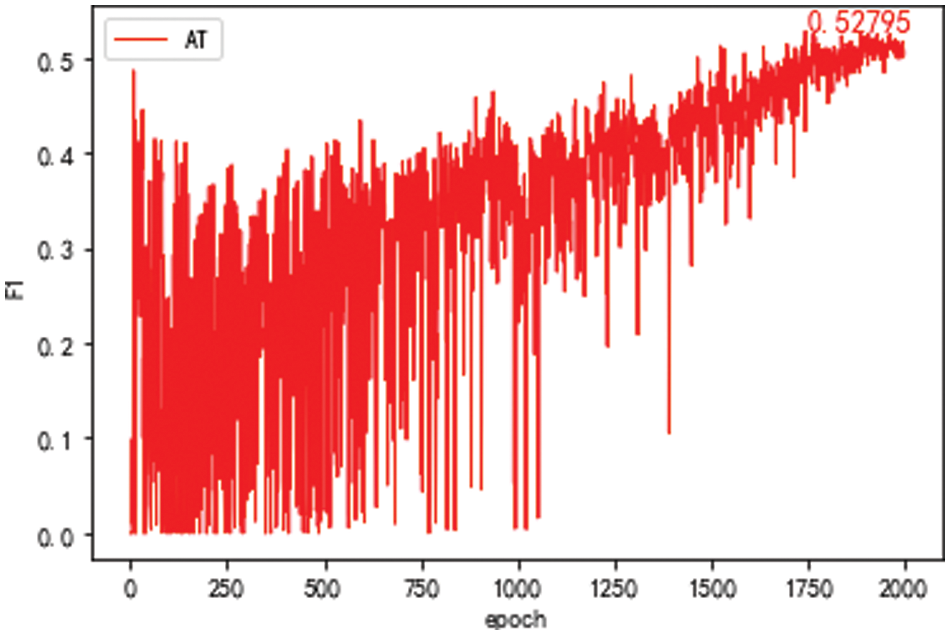
Figure 7: F1 value of the domain discriminator model after 2,000 epochs with sighan 2,005 as the source domain
The experiment results on different models are shown in Table 7. Compared with adversarial transfer learning and multi-task methods, LSTM-CRF and our proposed model have better values on precision values. The reason is that these two methods have used transfer learning for data labeling, which affects the performance of these two models. Our proposed model has achieved the best recall value among these models, as knowledge distillation between target and source domains can effectively increase recall value. Compared with the LSTM-CRF method, our method can achieve a 27% improvement in recall value. Furthermore, our method also has the best value on F1. Furthermore, it can significantly reduce the labeling cost due to transfer learning in the model, as only a tiny part of the data is required to be labeled in the source domain.
Bioinformatics data set is also used to perform experiments. The results are shown in Table 8. BioNLP11ID is selected as the source domain in the experiment. The highest value of precision is achieved at 0.48. The largest recall and F1 values are 0.51 and 0.47, respectively. These values are much lower than that of agricultural datasets. It proves that our method still is limited to domain knowledge.

This paper proposes a new model combining transfer learning and knowledge distillation for entity recognition in constructing agricultural knowledge graphs. In our method, a domain discriminator is first trained to classify the source and target domain data more accurately. Then a small amount of target domain data is selected through the domain discriminator. Last, only this part of the data is used by knowledge distillation to improve the effectiveness of the target domain model. The experimental results show that we only need to label less than one-tenth of the data. The agricultural domain ontology is constructed. Then, BILSTM-CRF named entity recognition model and PCNN relationship extraction model are constructed to extract knowledge from structured and unstructured data. Furthermore, the extracted knowledge is stored in the neo4j graph database with 13,983 entities and 26,498 relationships. In future work, the transfer learning method for cross-domain will improve our method.
Funding Statement: This research is supported by Heilongjiang NSF funding, No. LH202F022, Heilongjiang research and application of key technologies, No. 2021ZXJ05A03, and New generation artificial intelligent program, No. 21ZD0110900 in CHINA.
Conflicts of Interest: The authors declare that they have no conflicts of interest to report regarding the present study.
References
1. R. Kadari, Y. Zhang, W. Zhang and T. Liu, “CCG supertagging via bidirectional LSTM-CRF neural architecture,” Neurocomputing, vol. 283, no. 2, pp. 31–37, 2018. [Google Scholar]
2. H. Tseng, P. -C. Chang, G. Andrew, D. Jurafsky and C. D. Manning, “A conditional random field word segmented for sighan bakeoff,” in Proc. SIGHAN Workshop on Chinese Language Processing, San Diego, USA, 2005. [Google Scholar]
3. G. Lample, M. Ballesteros, S. Subramanian, K. Kawakami and C. Dyer, “Neural architectures for named entity recognition,” in Proc. NAACL-HLT, USA, pp. 260–270, 2016. [Google Scholar]
4. C. Dong, J. Zhang, C. Zong, M. Hattori and H. Di, “Character-based LSTM-CRF with radical-level features for Chinese named entity recognition,” in Proc. ICCPOL National CCF NLPCC, Berlin, German, pp. 239–250, 2016. [Google Scholar]
5. F. Lehmann, Semantic Networks in Artificial Intelligence. New York: Elsevier Science Inc., 1992. [Google Scholar]
6. A. Singhal, Introducing the Knowledge Graph: Things, not a String. Official Google Blog, 2012. [Google Scholar]
7. R. Fagin, J. Y. Halpern and Y. Moses, Reasoning About Knowledge Reasoning About Knowledge. MIT Press, 2003. [Google Scholar]
8. H. Arnaout and S. Elbassuoni, “Effective searching of RDF knowledge graphs,” Web Semantics, vol. 48, no. 1, pp. 66–84, 2018. [Google Scholar]
9. C. B. Wang, X. Ma, J. Chen and J. Chen, “Information extraction and knowledge graph construction from geoscience literature,” Computers & Geosciences, vol. 112, no. 5, pp. 112–120, 2018. [Google Scholar]
10. L. Xiaoxue, B. Xuesong, W. Longhe, R. Bingyuan, L. Shuhan et al., “Review and trend analysis of knowledge graphs for crop pest and diseases,” IEEE Access, vol. 7, pp. 62251–62264, 2019. [Google Scholar]
11. P. K. Thornton, “Site selection to test an integrated approach to agricultural research for development: Combining expert knowledge and participatory geographic information system methods,” Agricultural Sustainability, vol. 4, no. 1, pp. 39–60, 2006. [Google Scholar]
12. M. M. Yusof, N. F. Rosli, M. Othman, R. Mohamed and M. H. A. Abdullah, “M-DCocoa: M-agriculture expert system for diagnosing cocoa plant diseases,” in Recent Advances on SCDM, vol. 700. Cham, Switzerland: Springer, 2018. [Google Scholar]
13. W. D. van Eeden, J. P. de Villiers, R. J. Berndt, W. A. J. Nel and E. Blasch, “Micro-Doppler radar classification of humans and animals in an operational environment,” Expert Systems Application, vol. 102, no. 1, pp. 1–11, 2018. [Google Scholar]
14. B. Stewart-Koster, D. A. Nguyen, M. Burford, J. Condon, N. V. Qui et al., “Expert based model building to quantify risk factors in a combined aquaculture-agriculture system,” Agricultural Systems, vol. 157, no. 10, pp. 230–240, 2017. [Google Scholar]
15. M. Dubey, D. Banerjee, D. Chaudhuri and J. Lehmann, “EARL: Joint entity and relation linking for question answering over knowledge graphs,” in Proc. Int. Semantic Web Conf., Monterey, California, pp. 108–126, 2018. [Google Scholar]
16. J. Lacasta, F. J. Lopez-Pellicer, B. Espejo-García, J. Nogueras-Iso and F. J. Zarazaga-Soria, “Agricultural recommendation system for crop protection,” Computers and Electronics in Agriculture, vol. 152, no. 4, pp. 82–89, 2018. [Google Scholar]
17. L. Chen, J. Gao, Y. Yuan and L. Wan, “Agricultural question classification based on CNN of cascade word vectors,” in Proc. PRCV, Guangzhou, China, pp. 110–121, 2018. [Google Scholar]
18. H. W. Beck, S. Kim and D. Hagan, “A crop-pest ontology for extension publications,” Environmental Science, pp. 1169–1176, 2005. [Google Scholar]
19. Y. Wang, Y. Wang, J. Wang, Y. Yuan and Z. Zhang, “An ontology-based approach to integration of hilly citrus production knowledge,” Computers & Electronics Agriculture, vol. 113, no. 7, pp. 24–43, 2015. [Google Scholar]
20. A. Chougule, V. K. Jha and D. Mukhopadhyay, “Adaptive ontology construction method for crop pest management,” in Proc. ICDCT DECT, Singapore, pp. 665–674, 2017. [Google Scholar]
21. J. Cañadas, I. M. del Águila and J. Palma, “Development of a web tool for action threshold evaluation in table grape pest management,” Precision Agriculture, vol. 18, no. 6, pp. 974–996, 2017. [Google Scholar]
22. K. Lagos-ortiz, J. Medina-moreira, C. Moran-castro, C. Campuzano and R. Valencia-garcia, “An ontology-based decision support system for insect pest control in crops,” in Proc. ICTI, Cham, Switzerland, Springer, 2018. [Google Scholar]
23. C. Malarkodi, E. Lex and S. Devi, “Named entity recognition for the agricultural domain,” Research in Computing Science, vol. 117, no. 1, pp. 121–132, 2016. [Google Scholar]
24. P. Biswas, A. Sharan and S. Verma, “Named entity recognition for agriculture domain using word net,” Computer & Mathematical Sciences, vol. 5, no. 10, pp. 29–36, 2016. [Google Scholar]
25. G. A. Miller, WordNet: An Electronic Lexical Data Base. Massachusetts: MIT Press, 1998. [Google Scholar]
26. L. Li, X. Wang, M. Kang, J. Hua and M. Fan, “Agricultural named entity recognition based on semantic aggregation and model distillation,” Smart Agriculture, vol. 3, no. 1, pp. 118–128, 2021. [Google Scholar]
27. P. Zhao, C. Zhao, H. Wu and W. Wang, “Named entity recognition of Chinese agricultural text based on attention mechanism,” Agricultural Machinery in Chinese, vol. 52, no. 1, pp. 185–192, 2022. [Google Scholar]
28. H. Arnaout and S. Elbassuoni, “Effective searching of RDF knowledge graphs,” Web Semantics, vol. 48, no. 1, pp. 66–84, 2018. [Google Scholar]
29. M. Nickel, K. Murphy, V. Tresp and E. Gabrilovich, “A review of relational machine learning for knowledge graphs,” in Proc. IEEE, USA, vol. 104, pp. 11–33, 2016. [Google Scholar]
30. N. Kaushik and N. Chatterjee, “Automatic relationship extraction from agricultural text for ontology construction,” Information Processing in Agriculture, vol. 5, no. 1, pp. 60–73, 2018. [Google Scholar]
31. S. Mei, Y. Du and M. Zhao, “Axioms extraction method of the non-taxonomic relationship in crop diseases and insect pests,” Computer & Digital Engineering, vol. 43, no. 10, pp. 1746–1750, 2015. [Google Scholar]
32. Z. Ming, D. Yaru, D. Huifang, Z. Jiajun, W. Hongshuo et al., “Research on ontology non-taxonomic relations extraction in plant domain knowledge graph construction,” Transaction Chinese Society Agricultural Machinery, vol. 47, no. 9, pp. 9–38, 2016. [Google Scholar]
33. G. Crichton, S. Pyysalo, B. Chiu and A. Korhonen, “A neural network multi-task learning approach to biomedical named entity recognition,” BMC Bioinformatics, vol. 18, no. 1, pp. 368, 2017. [Google Scholar] [PubMed]
34. China Agricultural Press, Agricultural Science Thesaurus. China Agricultural Press, 1994. [Google Scholar]
35. Institute of plant protection, Chinese Academy of Agricultural Sciences, China Crop Diseases and Pests. China Agricultural Press, 2015. [Google Scholar]
36. Z. Huang, W. Xu and K. Yu, “Bidirectional LSTM-CRF models for sequence tagging,” arXiv Computer Science, 2015. [Google Scholar]
37. P. Cao, Y. Chen, K. Liu, J. Zhao and S. Liu, “Adversarial transfer learning for Chinese named entity recognition with self-attention mechanism,” in Proc. EMNLP, Brussels, Belgium, pp. 182–192, 2018. [Google Scholar]
38. X. Wang, J. Lyu, L. Dong and K. Xu, “Multi-task learning for biomedical named entity recognition with cross-sharing structure,” BMC Bioinformatics, vol. 20, no. 1, pp. 427, 2019. [Google Scholar] [PubMed]
Cite This Article
 Copyright © 2023 The Author(s). Published by Tech Science Press.
This work is licensed under a Creative Commons Attribution 4.0 International License , which permits unrestricted use, distribution, and reproduction in any medium, provided the original work is properly cited.


 Submit a Paper
 Propose a Special lssue
 View Full Text
 Download PDF
 Downloads
 Citation Tools