
 Submit a Paper
 Propose a Special lssue
 Open Access
ARTICLE

Analysis of Social Media Impact on Stock Price Movements Using Machine Learning Anomaly Detection
1 College of Information Sciences and Technology, Pennsylvania State University, State College, PA, 16801, USA
2 Western New England University, College of Business, 1215 Wilbraham Rd, Springfield, MA, 01119, USA
* Corresponding Author: Johnson Kinyua. Email:
Intelligent Automation & Soft Computing 2023, 36(3), 3405-3423. https://doi.org/10.32604/iasc.2023.035906
Received 09 September 2022; Accepted 14 November 2022; Issue published 15 March 2023
 View Full Text
 Download PDF
Abstract
The massive increase in the volume of data generated by individuals on social media microblog platforms such as Twitter and Reddit every day offers researchers unique opportunities to analyze financial markets from new perspectives. The meme stock mania of 2021 brought together stock traders and investors that were also active on social media. This mania was in good part driven by retail investors’ discussions on investment strategies that occurred on social media platforms such as Reddit during the COVID-19 lockdowns. The stock trades by these retail investors were then executed using services like Robinhood. In this paper, machine learning models are used to try and predict the stock price movements of two meme stocks: GameStop ($GME) and AMC Entertainment ($AMC). Two sentiment metrics of the daily social media discussions about these stocks on Reddit are generated and used together with 85 other fundamental and technical indicators as the feature set for the machine learning models. It is demonstrated that through the use of a carefully chosen mix of a meme stock’s fundamental indicators, technical indicators, and social media sentiment scores, it is possible to predict the stocks’ next-day closing prices. Also, using an anomaly detection model, and the daily Reddit discussions about a meme stock, it was possible to identify potential market manipulators.Keywords
Stock market trading activities generate massive amounts of data, and when combined with the increasing use of the Internet especially on social media microblog platforms as a source of information for investors, massive amounts of data are generated that can be used to analyze financial markets from new perspectives. Investor sentiments expressed in social media are particularly useful in trying to understand movements in financial markets. The case of GameStop and AMC Entertainment stocks is particularly interesting because of the unusual stock price movements that occurred around January 2021 and were widely reported [1–3]. Machine learning (ML) models are used to try and predict the stock price movements of these two meme stocks by analyzing their social media sentiments on Reddit together with stock price history and 85 fundamental and technical indicators as the feature set for the machine learning models. Anomaly detection is also used to analyze the behavior of these stocks.
Prior to the advent of the applications of statistical, econometric, and machine learning models to stock market prediction, researchers operated under the premise of the Efficient Market Hypothesis (EMH) posited by Fama [4]. EMH proposes that it is impossible to gain an advantage in an efficient market since securities reflect all available information at any given time. Therefore, utilizing historical information about securities to try and predict the future prices and behaviors of securities is impossible because the market already factors such information into the prices. This leads to the belief that the current price of a security is an acceptable estimate of its intrinsic value. In recent years, many researchers have proposed various machine learning and deep learning algorithms that have demonstrated the predictive power of such methods on stock market securities and thus counter the EMH [5–12].
An unusual stock price movement behavior of $GME and $AMC occurred between January 1, 2020, and July 31, 2021, which attracted the interest of US lawmakers. Can machine learning be used to explain and predict this behavior using social media data, stock price, fundamental indicators, and technical indicators? Can machine learning identify potential market manipulators using social media data, stock price, fundamental indicators, and technical indicators? This study proposes ensemble methods for predicting stock price movement using a large feature set as discussed in Section 3.
The main contributions of this paper are as follows:
• The application of a large feature set that includes social media sentiments, stock price, technical indicators, and fundamental indicators to predict stock price movement. This is innovative because other researchers use smaller feature sets as explained at the beginning of Section 2.
• The application of a large feature set that includes social media sentiments, stock price, technical indicators, and fundamental indicators to identify market manipulators. This is innovative because other researchers use smaller feature sets as explained at the beginning of Section 2.
• Extreme negative correlation was found amongst fundamental stock indicators, such as the price-to-book ratio with the closing price.
• Strong positive relationships between the sentiment features and the closing price which has not been reported in the literature
While this work provides some insightful results, it does have some limitations. The work used social media data harvested from Reddit. Collecting and aggregating social media data from other platforms such as StockTwits and Twitter; although involving a lot more work and taking longer, would have been more representative of social media conversations. Additionally, the research work used only two stocks that exhibited unusual activity between January 1, 2020, and July 31, 2021, that also attracted the attention of lawmakers in the U.S. It is quite likely that there were other stocks that exhibited unusual behavior in the same period and identifying them and including them in this research would have provided additional insight. Despite these limitations, a key strength of the approach used in this research was the use of social media sentiments, stock price history, as well as 85 fundamental and technical indicators as the feature set for the machine learning models to predict price movement behavior. Most researchers use a feature set with fewer features as explained in Section 2.2.
The rest of this paper is organized as follows. In Section 2 a review of the literature relevant to the work in this paper is presented. Section 3 describes the research methodology that was used in this work. The experimental results are presented and discussed in Section 4. Finally, Section 5 concludes the paper.
A review of some approaches that have been applied to stock price movement prediction by different researchers is presented. The review includes work on ensemble, deep learning, sentiment analysis, and anomaly detection approaches. It should be noted that these are different approaches that researchers have been using to predict stock price movement using a combination of features that may include social media data, price history, technical indicators, and/or fundamental indicators. The majority of studies in literature follow one of the following approaches for feature engineering: (1) price history only, (2) price history and fundamental indicators, (3) price history and technical indicators, or (4) price history, fundamental indicators, and technical indicators. Across the four different approaches described below, the results using each approach are discussed, but comparing the results across the different approaches would be misleading because they use different feature sets. For this reason, a table is not provided comparing results obtained in this research work and other research results. Also, the focus of this research was to study the unusual price movement behavior that occurred with $GME and $AMC stocks as stated earlier. Most studies attempt to predict stock price movement under ‘normal’ market conditions using the approaches discussed in the sections below. The research work presented in this paper applies the techniques in Sections 2.1, 2.3, and 2.4.
2.1 Ensemble Methods in Stock Prediction
Ensemble ML models have become popular due to the superiority of their intrinsic structure in which assorted ML models are combined to achieve better performance than a single ML model. The study by Ballings et al. [6], compares the performance of several classification ensemble methods for predicting the movement of many publicly listed European companies. They use a large feature set consisting of company fundamental indicators and economic information as predictors. The results of this study show that the Random Forest algorithm outperformed peer machine learning algorithms; with the Support Vector Machines (SVM), Kernel Factory, and AdaBoost algorithms following behind, respectively. Ampomah et al. [7] have used tree-based ensemble ML methods in an attempt to predict stock price movement direction for eight different stocks. The tree-based ensemble methods used are Random Forest, XGBoost, AdaBoost, a basic Bagging Classifier, Extra-Trees, and a basic Voting Classifier. The results of that study contradict the results of the work by Ballings et al. [6], where the Kendall W test results using the AUC (area under the curve) metric show the Random Forest classifier performing poorly, just above the bagging classifier, while the Extra-Trees algorithm is the best performer.
These results are certainly interesting as they reflect the popular feature extraction methods outlined in each study. In [6] the feature set is comprised of fundamental indicators while in [7] the feature set consists of various technical indicators as well as the price history. Fundamental indicators data pertaining to a company includes information about the company’s intrinsic value based on economic variables, such as the business model, company management, the balance sheet, cash flow, income statements, etc. By contrast, technical indicators data makes use of the company’s stock price history to develop statistical indicators with the intent of analyzing trends and patterns. The work of Bhardwaj et al. [8] compares Logistic Regression, Random Forest, K-NN, and statistical ARIMA to analyze the prediction power using only the price history of the specified securities in which the training data contains the open, high, low, close, and volume values. Logistic Regression outperformed the other models, with Random Forest coming in second place. However, Random Forests have proven to have good predictive power in many experiments as discussed in [6, 8–10], and it was for this reason that the Random Forest algorithm was adopted as the baseline algorithm for comparison in this study.
Based on the varying outcomes of research studies presented in [6–10] with respect to the Random Forest algorithm, it can be inferred that feature extraction and engineering are of high importance. Tanaka-Yamawaki et al. [11] found that as the number of technical indicators used as predictors increased, the prediction results improved accordingly. This effectively led the researchers to conclude that the combination of technical indicators can improve the prediction power of a model. However, this is not a one-size-fits-all solution, as the structure of the technical indicators combination itself is of great importance. The studies by Khaidem et al. [9] and Dey et al. [12] where the researchers apply two different machine learning algorithms based on two different concepts (bagging and boosting) show that feature engineering improves performance. Their methods of feature engineering and preprocessing are identical as are the results. The studies described in [9,11], are identical in every aspect except for the machine learning algorithms used. Both studies apply exponential smoothing to the dataset, and thereafter they extract identical technical indicators before testing for linear separability. The accuracy, precision, recall, and specificity of each proposed model are noted. However, in this study, the XGBoost algorithm outperforms the Random Forest algorithm, and this may be attributed to the underlying structure of the algorithm.
Deep learning has also become prominent in the financial domain with the most popular method applied being Recurrent Neural Networks (RNNs). Chen et al. [13] and Roondiwala et al. [14] apply the popular Long Short-Term Memory (LSTM) model to the Chinese stock markets and the NIFTY 50 Index to evaluate the predictive power using only price history. The evaluation metrics applied are not the same, and the performances cannot be compared directly. The study by Dingli et al. [15] takes on a different approach, shifting away from RNNs and instead evaluating the performance of a Convolutional Neural Network (CNN). It is worth noting that the features set in this study is certainly unique compared to the others reported in the literature in the same domain. Dingli et al. [15] make use of price history and technical indicators as well as external indicators such as foreign currency exchange rates, global stock market indices, and the price of popular commodities, such as oil and gold. Nevertheless, when compared to a basic multilayer perceptron (MLP) model, the proposed CNN fails to achieve better, or even similar, results.
The work discussed by Selvin et al. [16] can be considered to be the deep learning equivalent of the work discussed by Ballings et al. [6]. Selvin et al. [16] compare the following models: ARIMA, LSTM, RNN, and CNN using data from three publicly traded companies on the NIFTY 50 Index. This approach differs from [15] in that these researchers apply a sliding window approach to the CNN to optimize its performance. Consequently, the proposed CNN outperforms its peers with Selvin et al. [16] attributing the superior performance to the use of the sliding window technique. The researchers expressed the view that CNN did not depend on past information but only on information that was within the current window, allowing the model to ‘understand’ patterns in the data. Whereas the RNN and LSTM models used prior information and therefore failed to recognize dynamic changes in the data.
Echo-State Networks (ESNs) are a popular type of RNNs that are mostly applied in time-series analysis. Therefore, they have been shown to perform well when analyzing time-series data in the financial domain [17,18]. The research described by Dan et al. [19] aims to address the inherent randomness of ESN reservoirs by proposing a deterministic approach in which the reservoirs follow a fixed topology and compare the performance against a standard ESN. The resulting outcome supports the hypothesis that deterministic ESNs outperform standard ESNs, with the deterministic ESNs improving the prediction accuracy by as much as 23%. Nevertheless, the researchers convey that the proposed models indicate forecasting instability, but the deterministic models increase stability by up to 52%. Tanaka-Yamawaki et al. [11] apply principal component analysis (PCA) to evaluate the impact on ESN forecasting performance and find that PCA improves the performance on 10/16 of the worst performing models as well as the prediction accuracy of 325/491 publicly traded companies.
Another area of importance surrounding forecasting and predicting stock price movement as well as analyzing contributing factors is sentiment analysis. Mitchell et al. [20] studied the impact that financial news has on publicly traded securities on the DJIA and found that news stories, specifically the amount released within a given time, and market activity have a direct relationship and share common day-of-the-week patterns. To further support this research, Pagolu et al. [21] analyze specific keyword tweets and their relationship with the corresponding stock and find that the general public sentiment reflects well on the respective price. Khedr et al. [22] build a sentiment analyzer using n-gram, TF-IDF, and a Naïve Bayes classifier to analyze the investor sentiment of financial news. The sentiment analyzer classifies the news as positive or negative, and the results are then joined to a numeric feature set extracted from price history. The features are joined by date and are used to train a KNN algorithm to predict whether the price of a stock would rise or fall.
The results of this study show that using simple sentiment analysis yields 59% accuracy but combining the feature sets yields 89% accuracy, supporting the hypothesis that public sentiment shares a relationship with stock price movement. The research work discussed by Xu et al. [23] focused on using StockTwits to analyze investor sentiment and predict stock price movement over a 25-hour period. Sixteen stock tickers are selected and following preprocessing methods, features are fed to three classification algorithms: Naïve Bayes, Decision Trees, and Support Vector Machines. The predictive power is unimpressive at about 59%, but the correlation results support the hypothesis that investor sentiment is important in stock price prediction. The results show that StockTwits user activity positively correlates with the next day’s trading volume and the after-hours (after the closing of the stock market) sentiments have powerful prediction capability for the next day’s prices. Zhai et al. [24] combine news with price history to predict stock price movement using SVM and show that the prediction accuracy increases when you combine price and news features compared to each respective feature set individually. These researchers took it a step further by conducting a market simulation and further supported their findings; when using price and news combined the net profit exceeded the individual feature sets by as much as $236.
Anomaly detection is defined as the process of monitoring well-defined behavior patterns to identify deviant events known as outliers or anomalies. In the domain of finance, anomaly detection holds substantial potential for improving business processes and optimizing operations. Anomaly detection in finance has grown in literature, prompting those in the field to survey diverse techniques, methods, and challenges [25–27]. These studies offer a useful resource for surveying the field of anomaly detection and its varying applications in fraud detection. Most of the methods focus on fraud detection in domains such as insurance fraud, treatment fraud, credit card fraud, etc. There is not much literature regarding anomaly detection applied to sub-domains of finance such as risk assessment/management, securities exchange or the stock market, and cryptocurrency.
The stock market is no exception to fraud as there are numerous occasions in which individuals, or groups of individuals, seek to manipulate the market for their gain. Such manipulation may manifest itself via a diverse set of methods including insider trading, pump-and-dump schemes, spoof trading, Ponzi schemes, etc. Anomaly detection using machine learning or deep learning, while not entirely new to the financial domain, is still young in the application of the stock market. Nonetheless, research has shown there is promise in this area. Ahmed et al. [25] have framed the anomaly detection problem from the perspective of big data by seeking answers from the data. They proposed making use of historical data for daily transactions on the Australian Security Exchange. A common problem that researchers working in anomaly detection have is the lack of labeled data. To mitigate against this limitation, researchers in the field often apply unsupervised learning methods, and then compare the relative performances of their models against one another.
The research methodology used in the research including data collection, pre-processing, feature engineering, and model development is described in this section.
3.1 Data Processing and Features Engineering
The financial and social media data for the $GME and $AMC tickers between January 1, 2020, and July 31, 2021, was collected for this study. This end date is chosen due to the abnormal activity that occurred during that period in which both $GME and $AMC experienced unusual trading volume and reached all-time highs. First, for the financial data, the daily price history is collected using the Tiingo API, an API that provides several stock market analysis tools [28]. To analyze the performance properly and optimize computational complexity, the daily open, high, low, close, and volume is collected going back to January 1, 2020. The social media data was harvested from Reddit and for each ticker, all of the individual comments posted on Reddit that mention the ticker are collected and placed in a dataset. The resulting two datasets each contain over 1 million rows.
Before feature engineering, the data collected requires a few pre-processing steps. The irrelevant features present in the social media data such as total awards received, score, and others are discarded leaving only the date the comment was posted, author, subreddit, and body of text. The social media data is not collected at a daily frequency and therefore requires computational steps to resample at a daily frequency. Before resampling the data, the VADER sentiment analyzer [29] is used to classify each body of text for each row (i.e., each Reddit comment), assigning it a general public sentiment class of positive, negative, or neutral, as well as a general public sentiment score based on the VADER compound score. Next, resampling the general public sentiment scores at a daily frequency based on the average scores for each day is performed. Studies have shown that combining numerous technical indicators can increase the accuracy of prediction when applied to stock market analysis [11]. For this reason, numerous technical indicators alongside fundamental indicators are combined in order to create a comprehensive feature set. The feature engineering process combines features from technical indicators, fundamental indicators, and sentiment scores yielding a dataset containing 87 features. Figs. 1 and 2 display the correlation matrix for each ticker, where the darker the blue color, the stronger the correlation between features. It can be seen from the heatmaps that there is a strong positive correlation between the target (close) and several fundamental and technical indicators, as well as a few market analyst sentiment features (bullish and bearish).
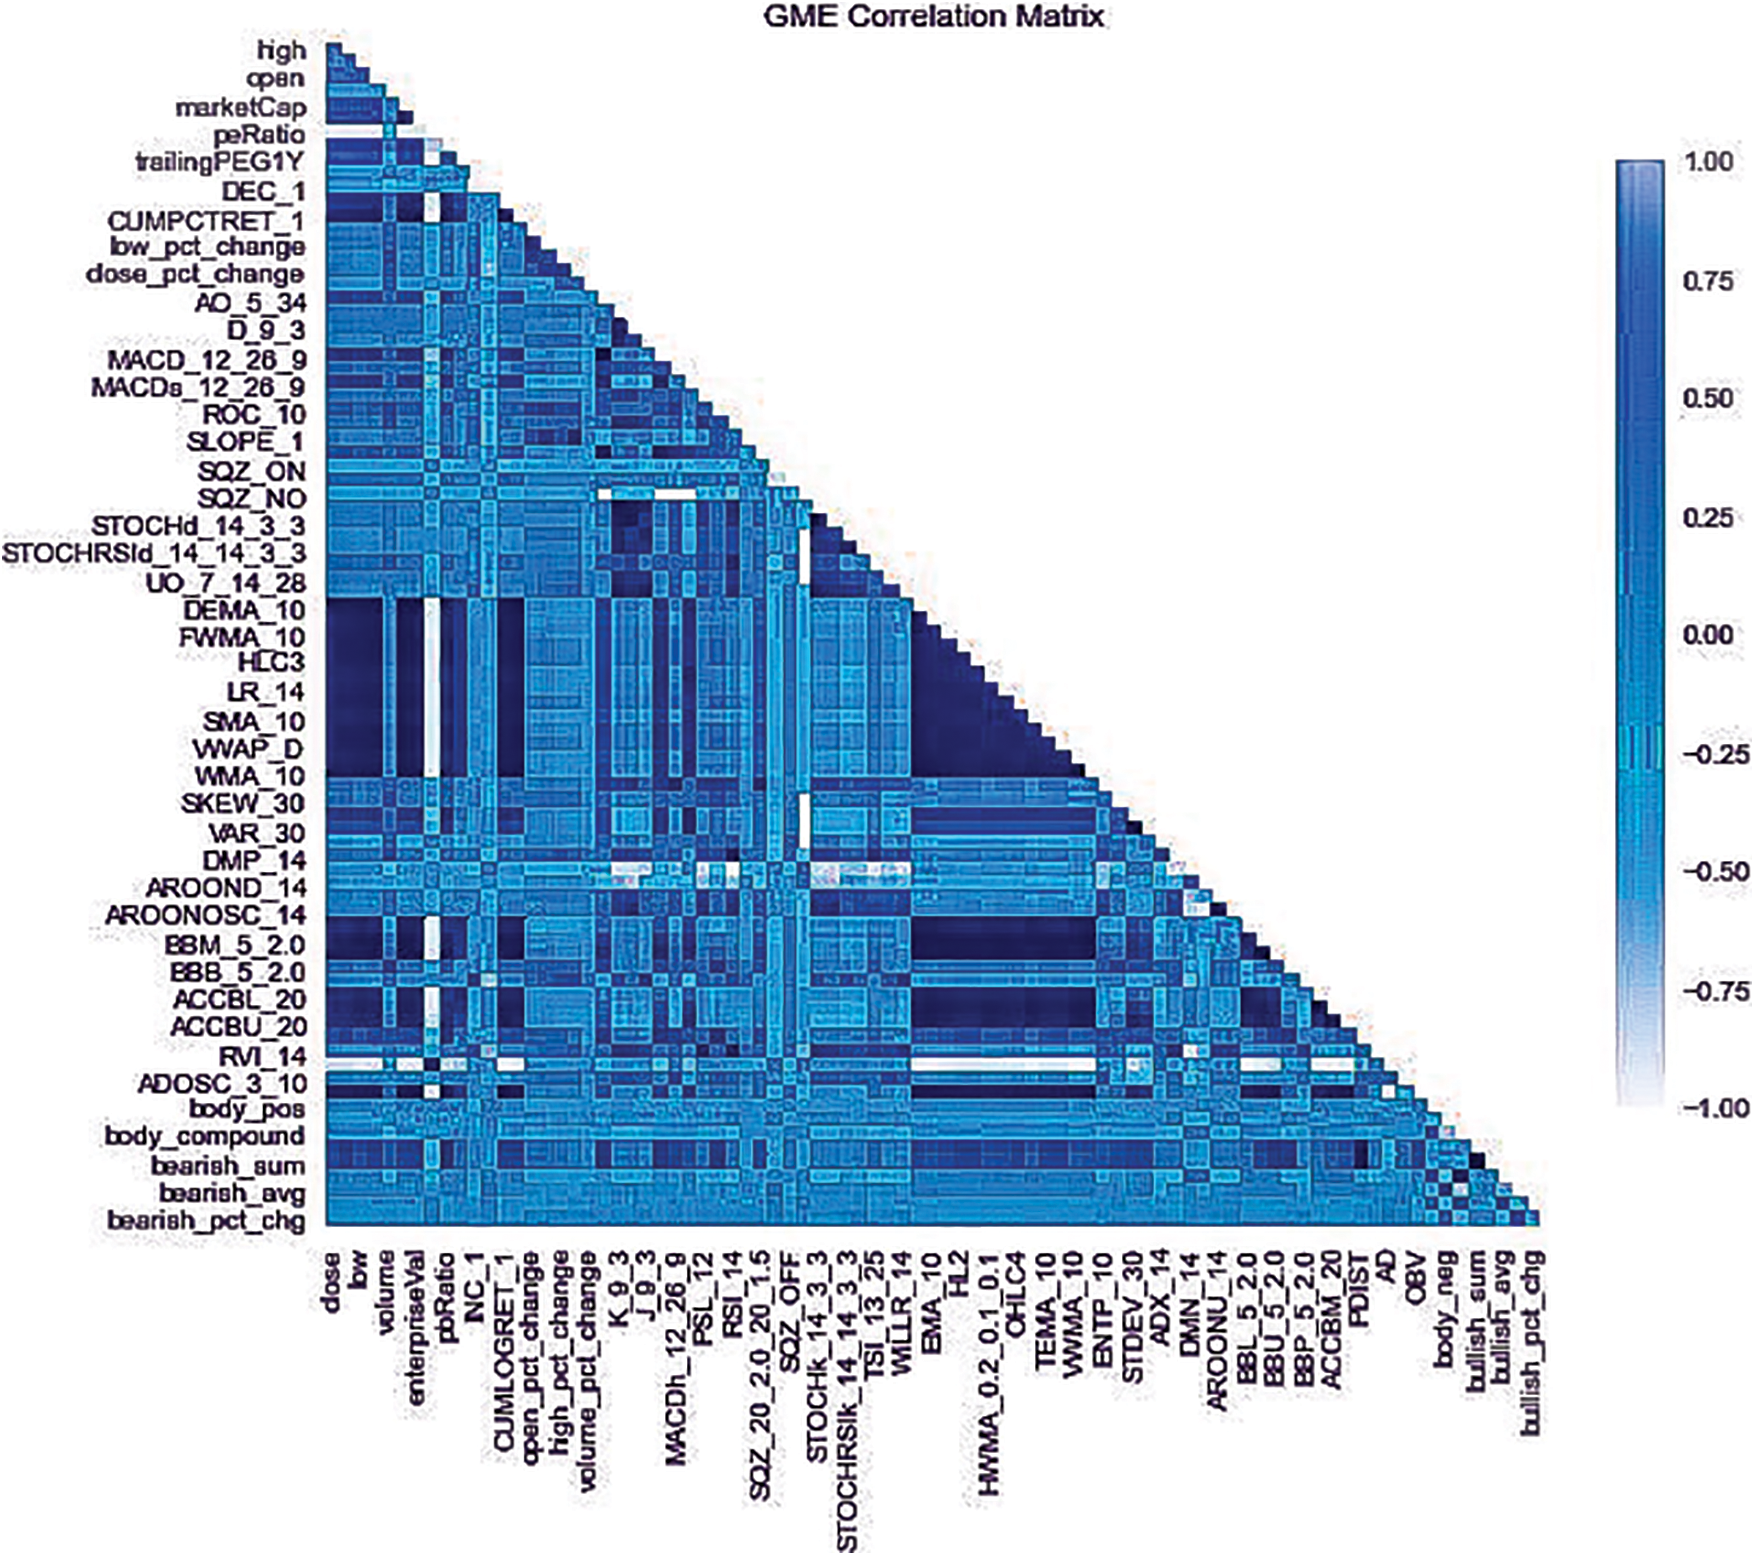
Figure 1: Correlation heatmap for GME
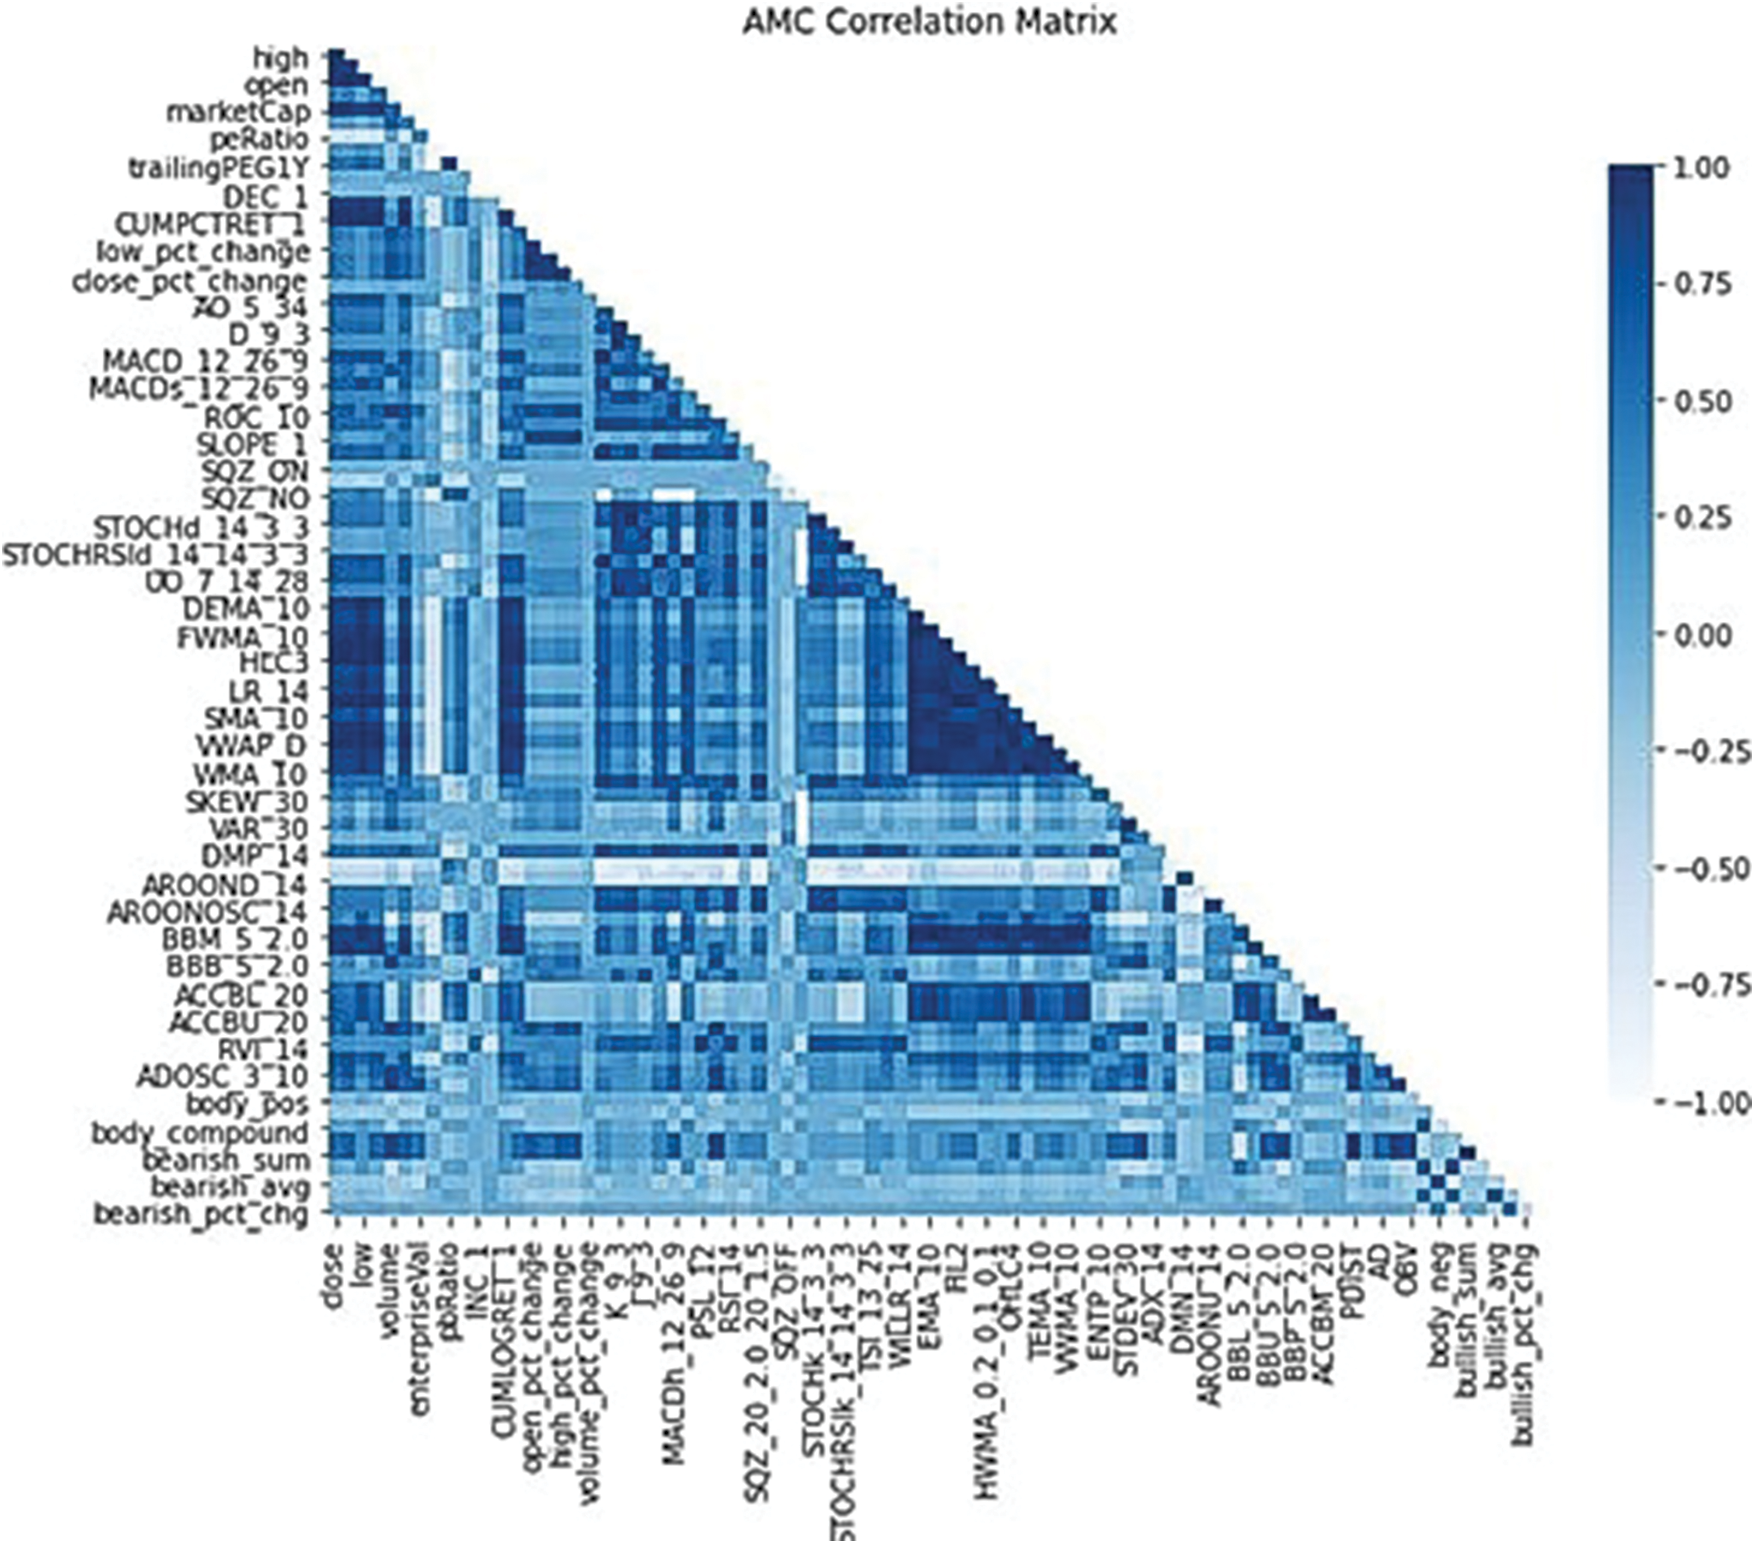
Figure 2: Correlation heatmap for AMC
The PyCaret library in Python is used to develop the models for both prediction and anomaly detection. The library includes a regression and anomaly detection module containing several machine learning algorithms. Across the modules, PyCaret handles many useful workflow steps such as preprocessing, imputation for missing data, feature selection, and more. PyCaret allows users to compare all the models available in their regression module. This capability is used for comparing the 26 algorithms [30] and moving forward with the top five based on the R2 score. The performance metrics used to determine the performance of a model are MAE, MSE, RMSE, R2, RMSLE, and MAPE, similar to what is used by other researchers in regression work [31]. The process of model development for each ticker is identical. All the models were trained using a train:test ratio set at 80:20. Feature selection is done followed by 10-fold cross-validation, and a time-series folding strategy; and since the data is a time-series no shuffling is performed. The models were developed on the Amazon Web Services (AWS) platform using Amazon SageMaker [32].
In this section, the results of the experiments, and the analysis of the results for both the $GME and $AMC stocks are presented.
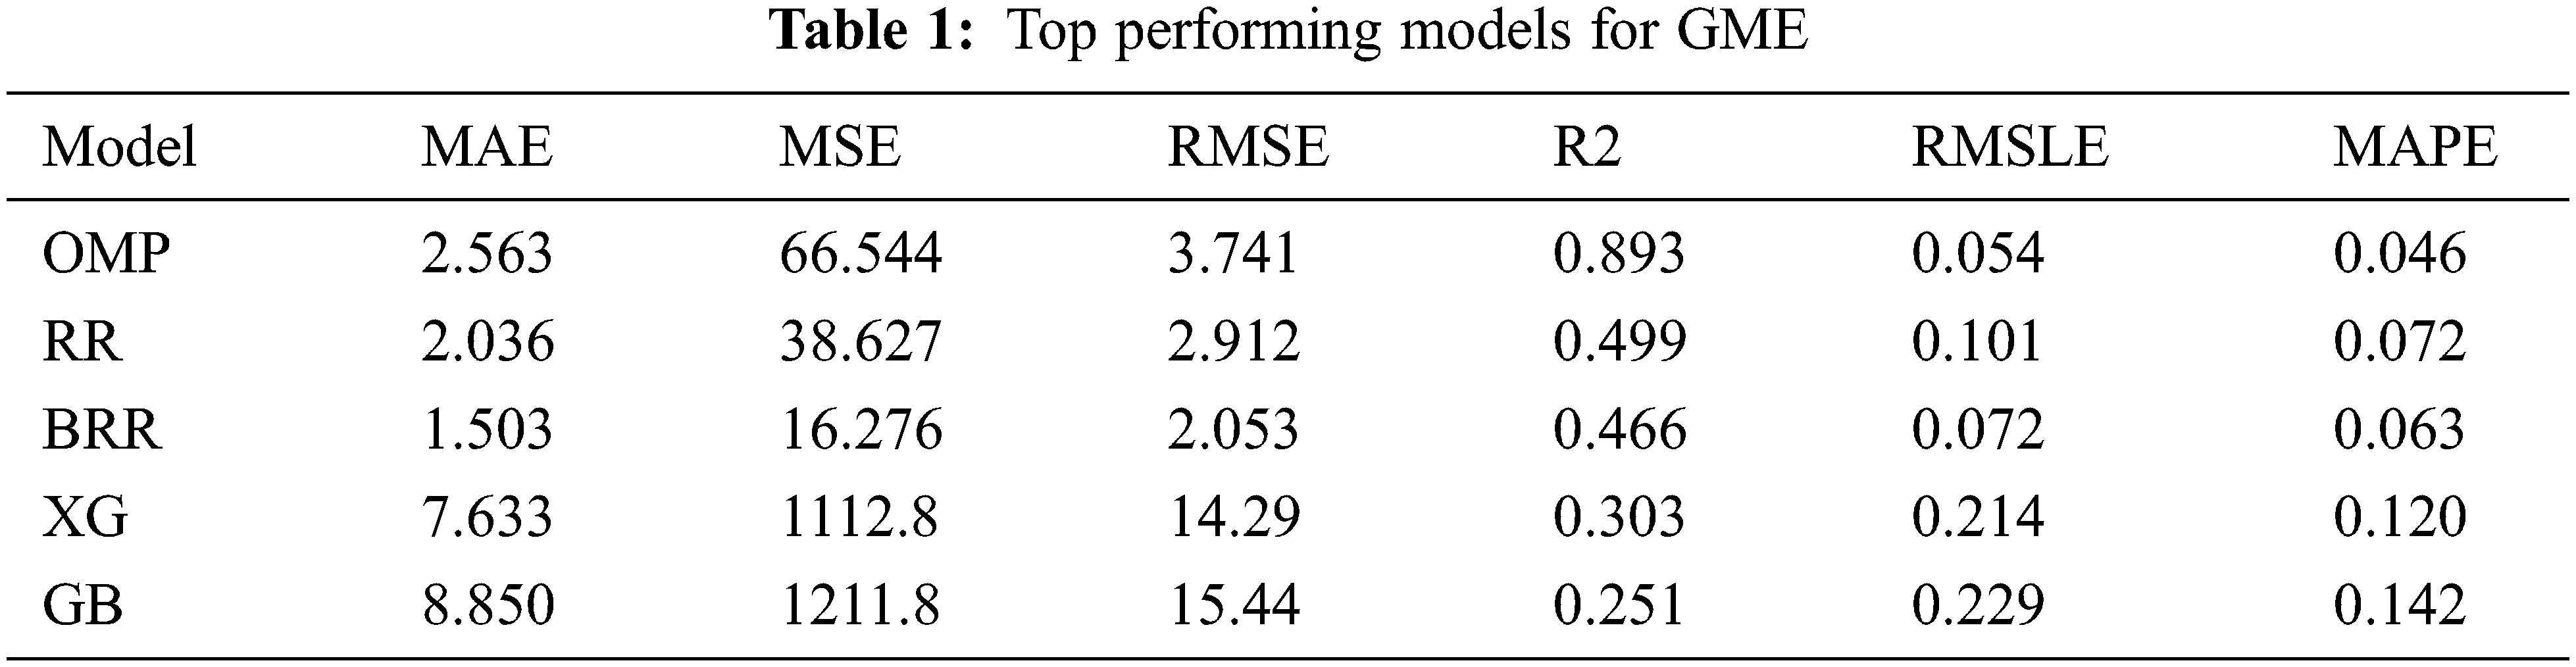
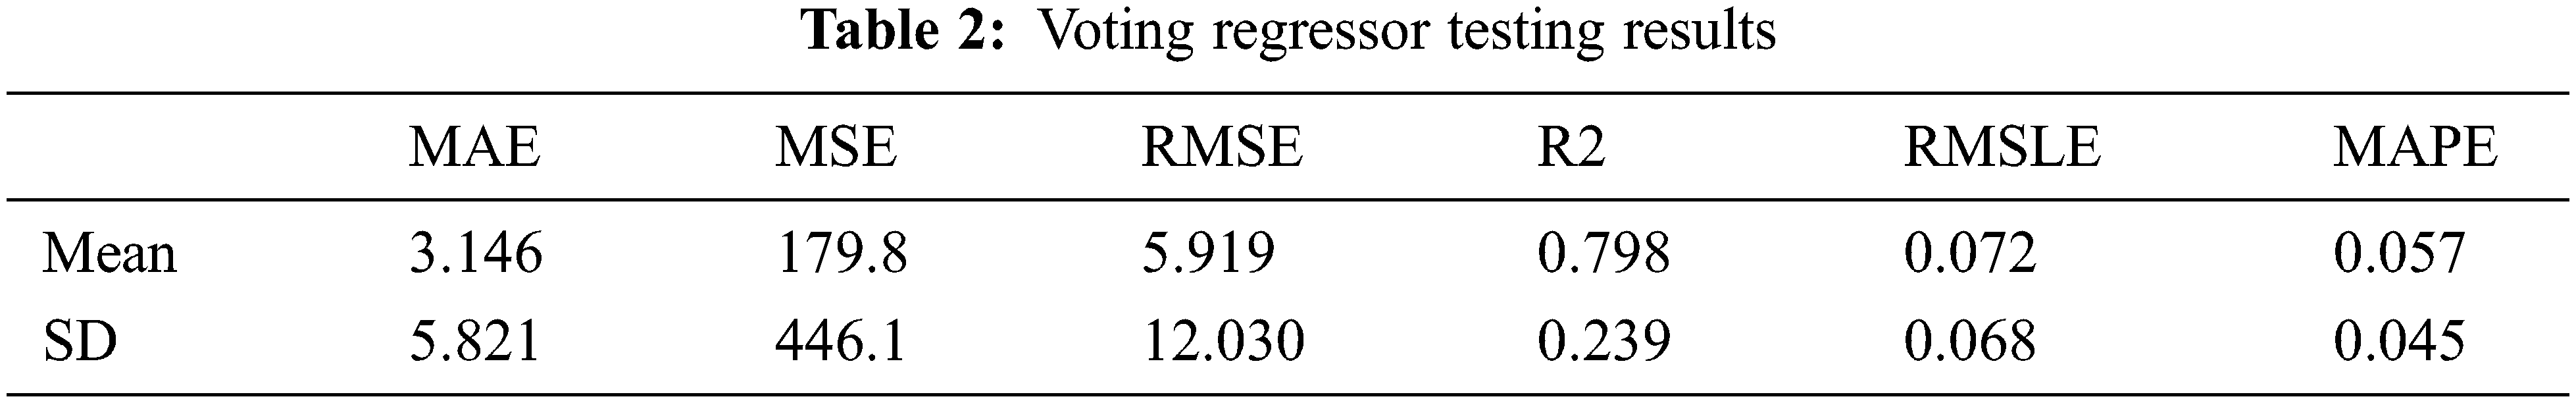
When comparing the above models, the top five performers for the $GME data are Orthogonal Matching Pursuit (OMP), Bayesian Ridge Regression (BRR), Ridge Regression (RR), XGBoost (XG), and Gradient Boost (GB), respectively. As shown in Table 1, orthogonal matching pursuit outperforms its peers in the R2 metric. However, it can be seen that Ridge Regression and Bayesian Ridge Regression outperform the other algorithms in the RMSE, MSE, and MAE performance metrics. After comparing the models’ results, a voting regressor was constructed using the top performers. Contrary to expectations, the voting regressor performs poorly on the test data. Table 2 shows the results of the voting regressor, and its performance isn’t better than any of the models in Table 1.
The prediction error for $GME for this voting regressor is shown in Fig. 3, which reveals the poor performance. To understand what contributed to the poor performance shown in Fig. 3, each model within the voting regressor is tuned and the results are analyzed. To tune each model, the PyCaret function, tune_model, is used which has built-in hyperparameter tuning and outputs a scoring grid with cross-validated scores by fold [33]. The PyCaret tune_model function performs 10 iterations of hyperparameter tuning by default and optimizes the R2 parameter by default for regression experiments. A large number of iterations require more computing resources. The number of iterations used in the experiments was 20, and the R2 metric was selected for optimization. The tuning process starts with the top performing model, the OMP model because it has the best R2 score, and then working through each model. The tuned OMP model performs very poorly on test data shown in Fig. 4 when compared with the other four and it was therefore removed from the voting regressor, leaving only four models.
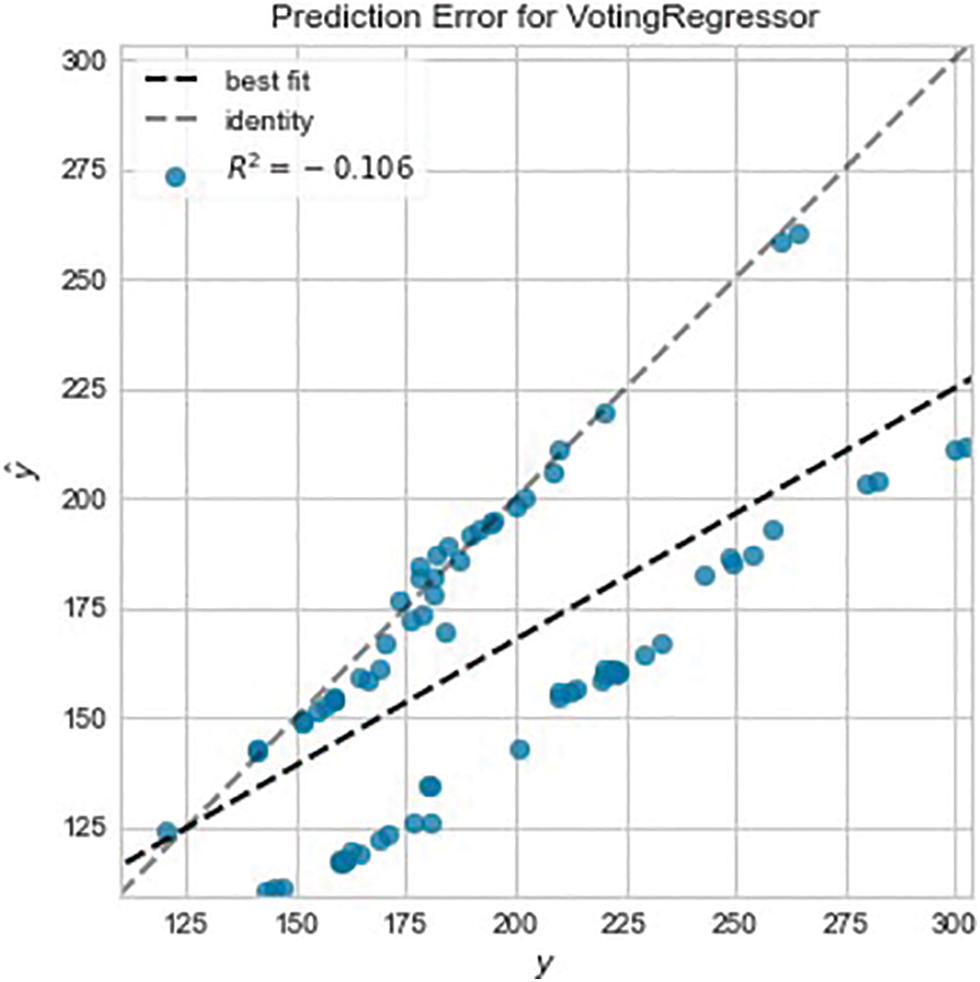
Figure 3: Prediction error for GME voting regressor
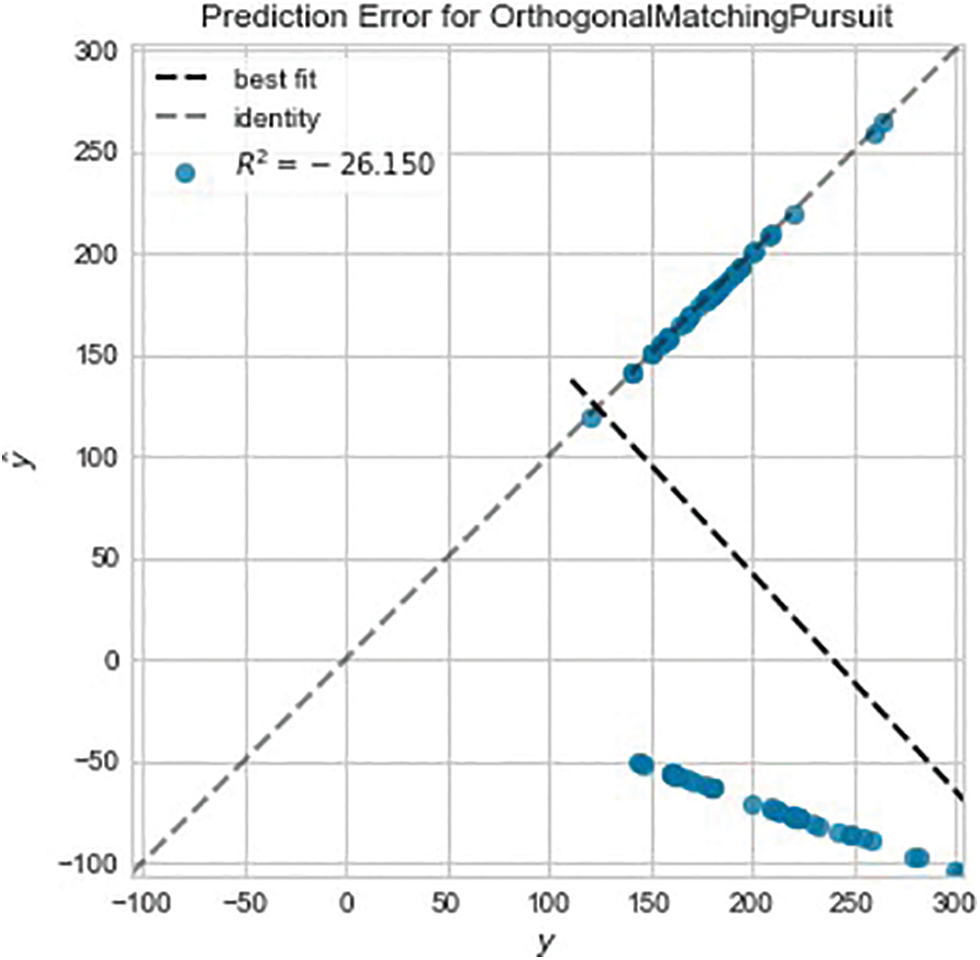
Figure 4: Prediction error for orthogonal matching pursuit
The performance of the new voting regressor on the training data is shown in Table 3, and it shows an improvement after removing the OMP model. Fig. 5 shows the prediction error on the test data before tuning the models.
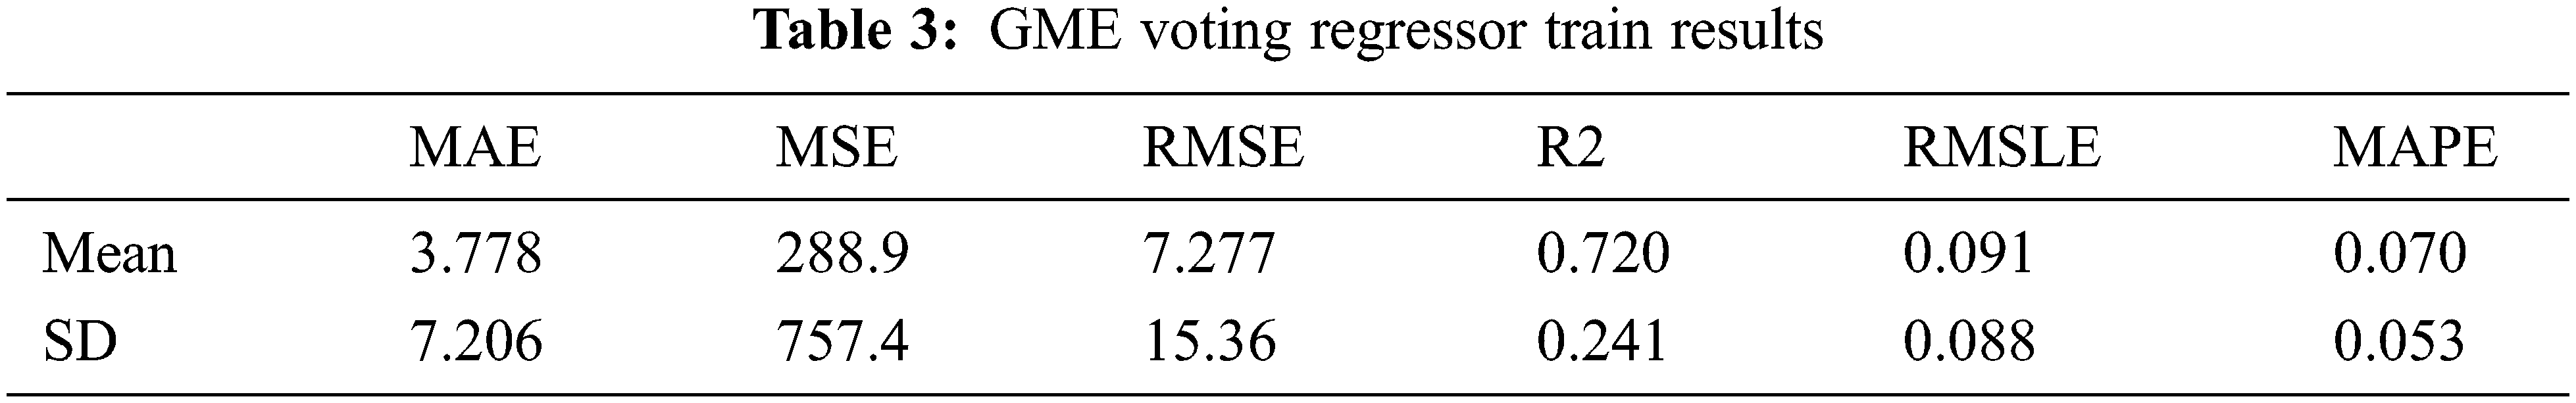
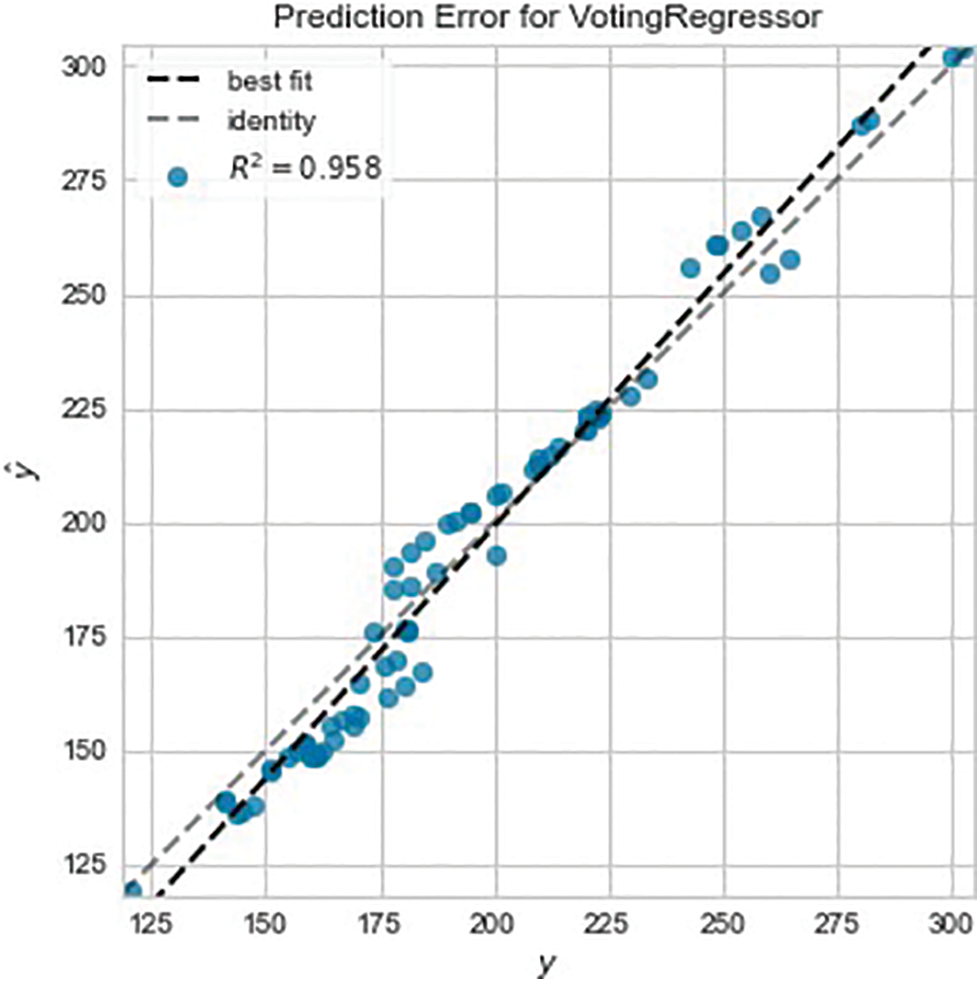
Figure 5: Untuned voting regressor prediction error
Fig. 6 shows the prediction error on the test data after tuning the models and it shows an improvement by achieving an R2 score of 0.983 compared to 0.958 before the tuning. Table 4 shows the overall results of the improved regressor; showing an RMSE of 4.931 and a score of 3.8403 for the MAE, and it can be inferred that there is an even distribution of errors. After analyzing the predictions made by the model, Fig. 7 shows how well the model performs when predicting the $GME stock. Fig. 7 shows normal behavior until January 2021 when $GME substantially grew in popularity among users on Reddit, specifically the sub-Reddit WallStreetBets. The abnormal activity occurred as predicted by the model after that date.
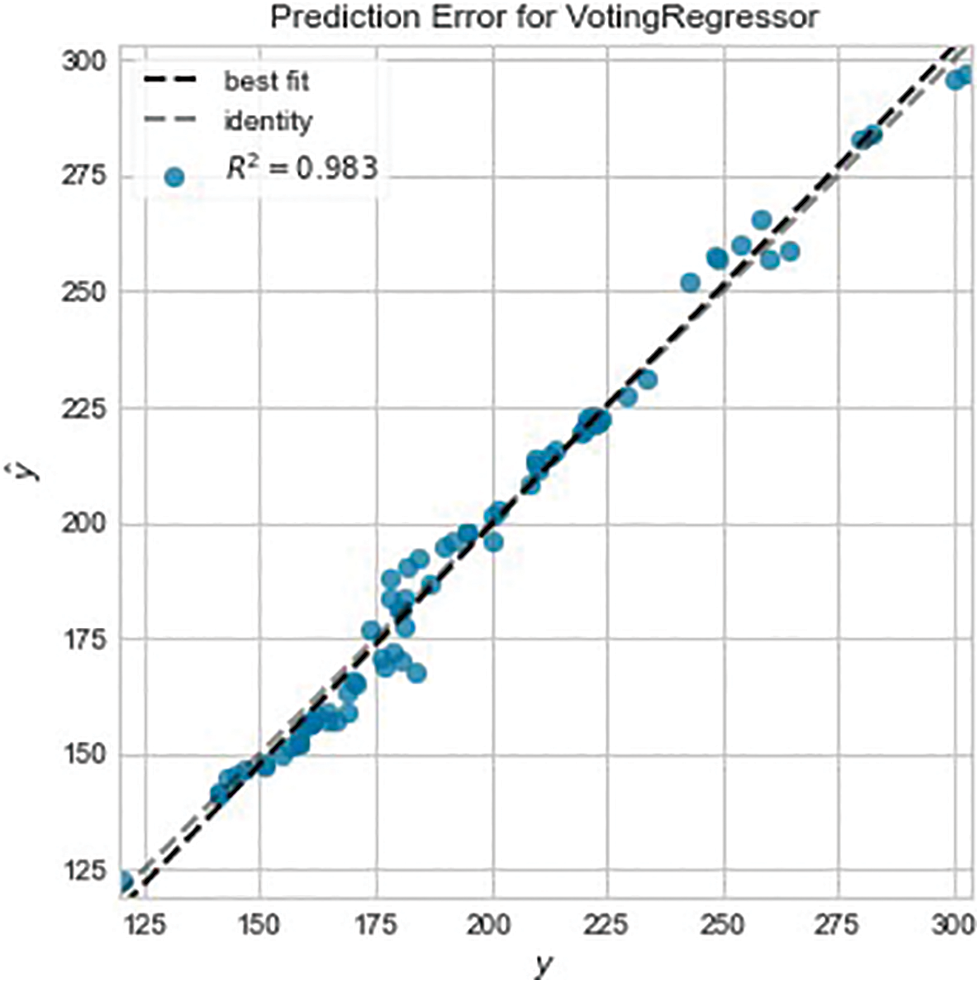
Figure 6: Tuned voting regressor prediction error
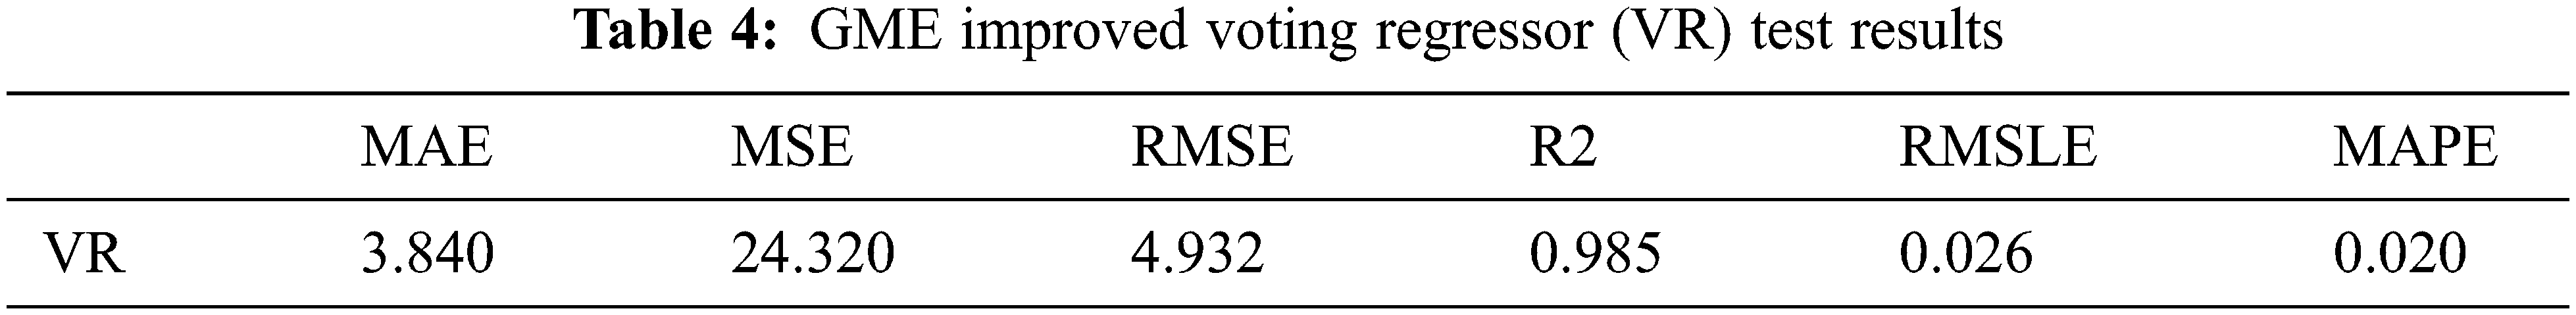
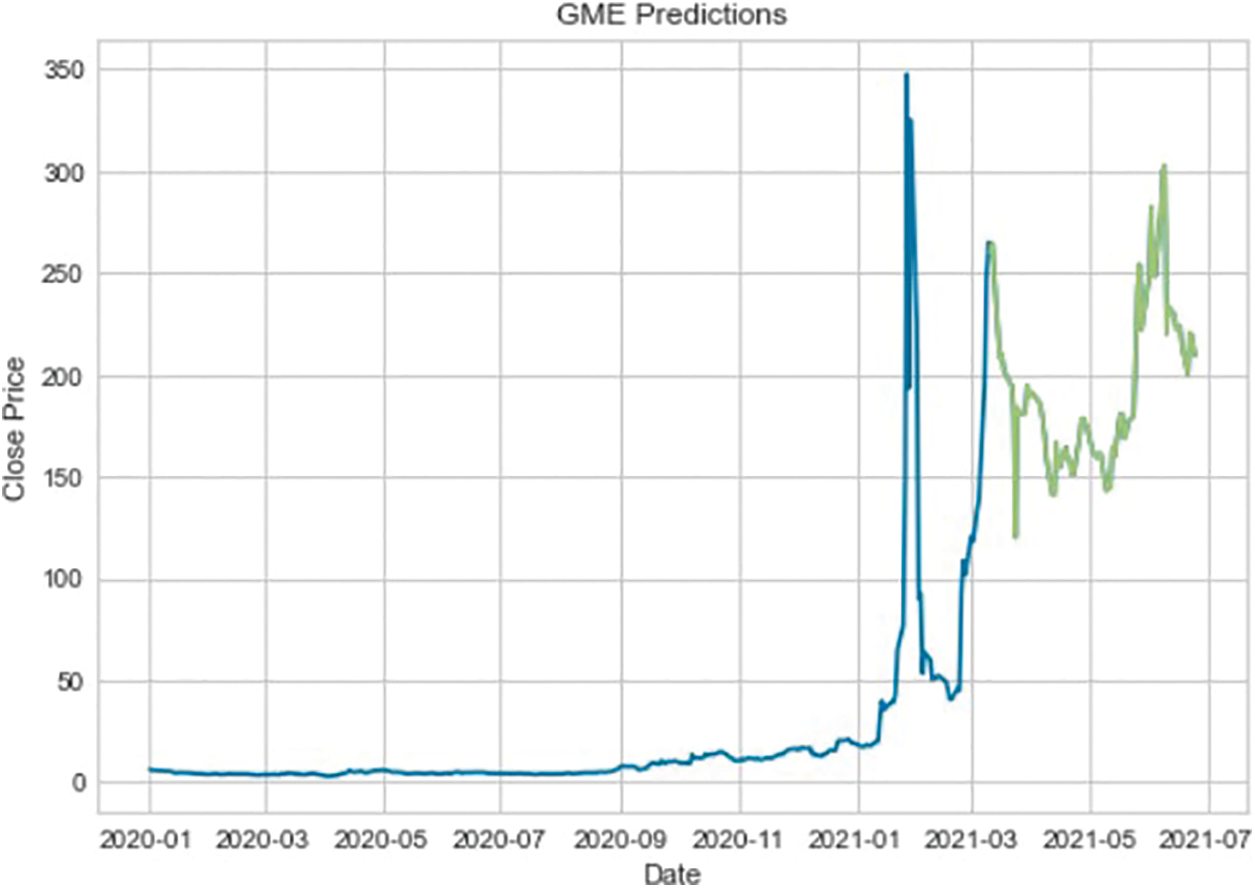
Figure 7: GME prediction chart
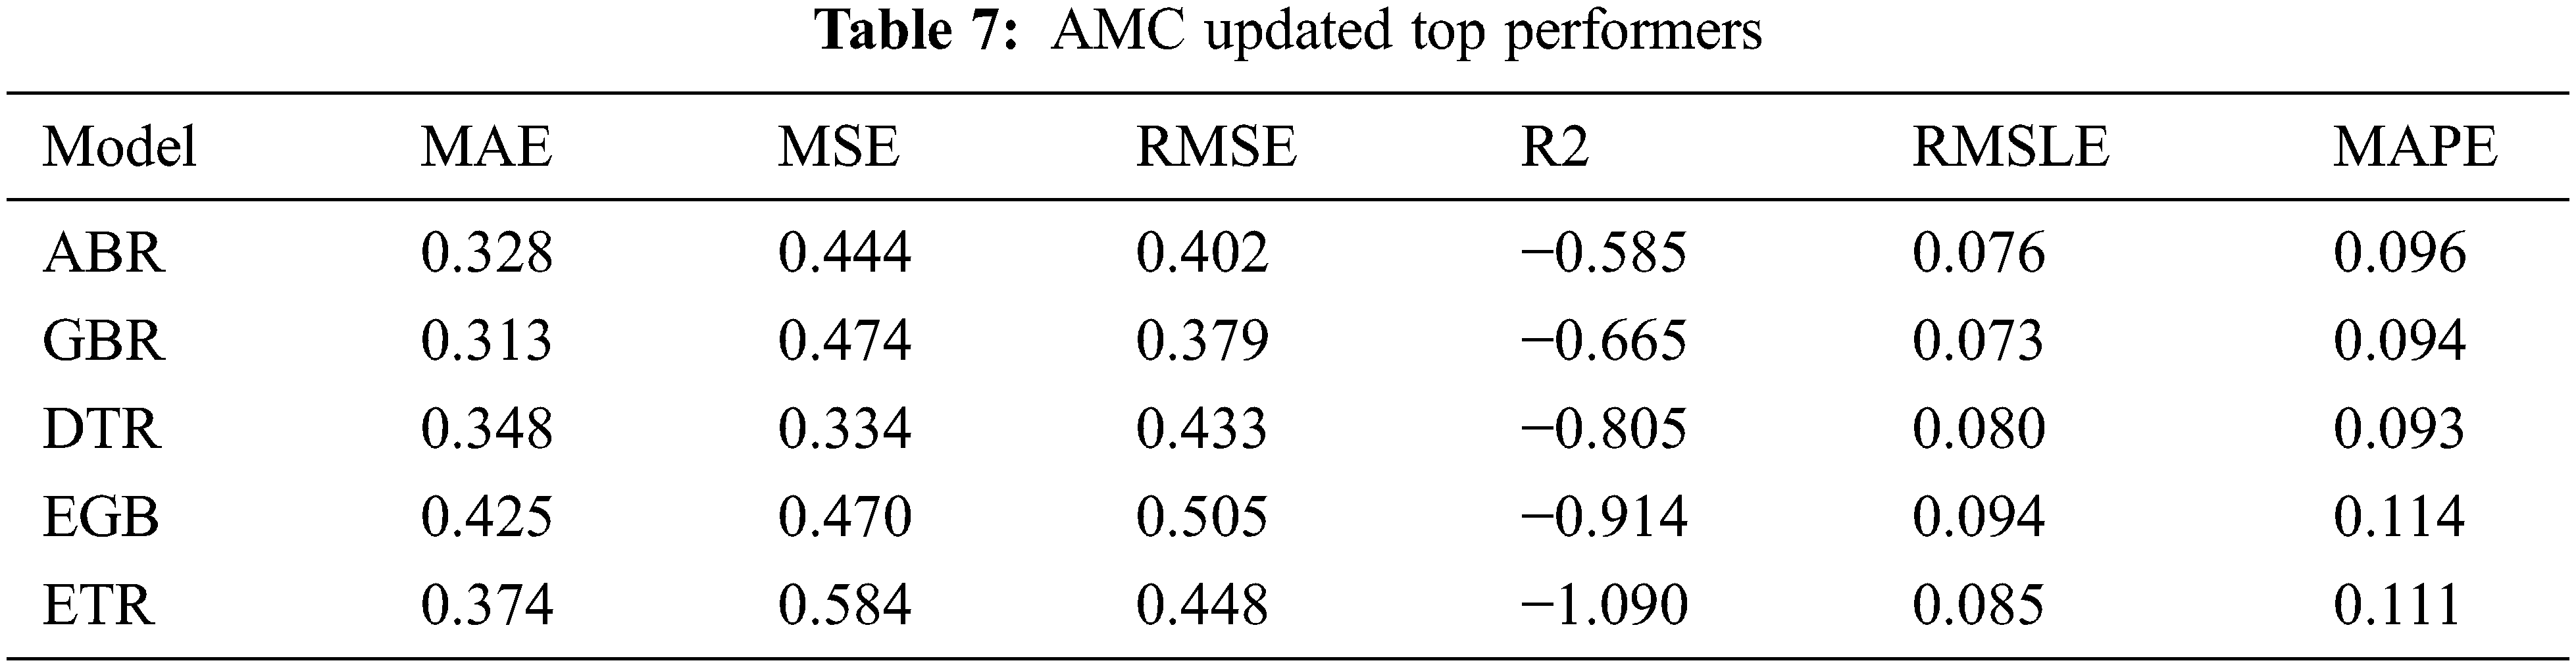
The modeling process done for $GME is repeated for $AMC. The top five performers were the Huber Regressor (HR), Lasso Regressor (LR), Elastic Net (EN), Gradient Boost Regressor (GBR), and Extra Trees Regressor (ETR) as shown in Table 5. The top performers are quite different except for GBR which was also a top performer with $GME. Again, the top performers are combined to create a voting regressor and apply the resulting model to the training data. The results of this step are shown in Table 6. The results on the training data certainly fall behind when compared to the voting regressor applied on $GME, however, when this model is applied to the testing data, an acceptable goodness of fit can be seen. Figs. 10 and 11 show the prediction error for the voting regressor, with Fig. 9 being before tuning and Fig. 10 being after the tuning. Although the R2 score does not compare to that of the model applied to $GME, the goodness of fit looks good. Table 7 displays the performance metrics on the testing data and Fig. 11 shows the performance when predicting stock price movement. It is interesting to note that the model performed well in such an anomalous period where the behavior pattern varies drastically compared to the past. Perhaps this can be attributed to past volatile behavior although Fig. 11 does not support this assumption.
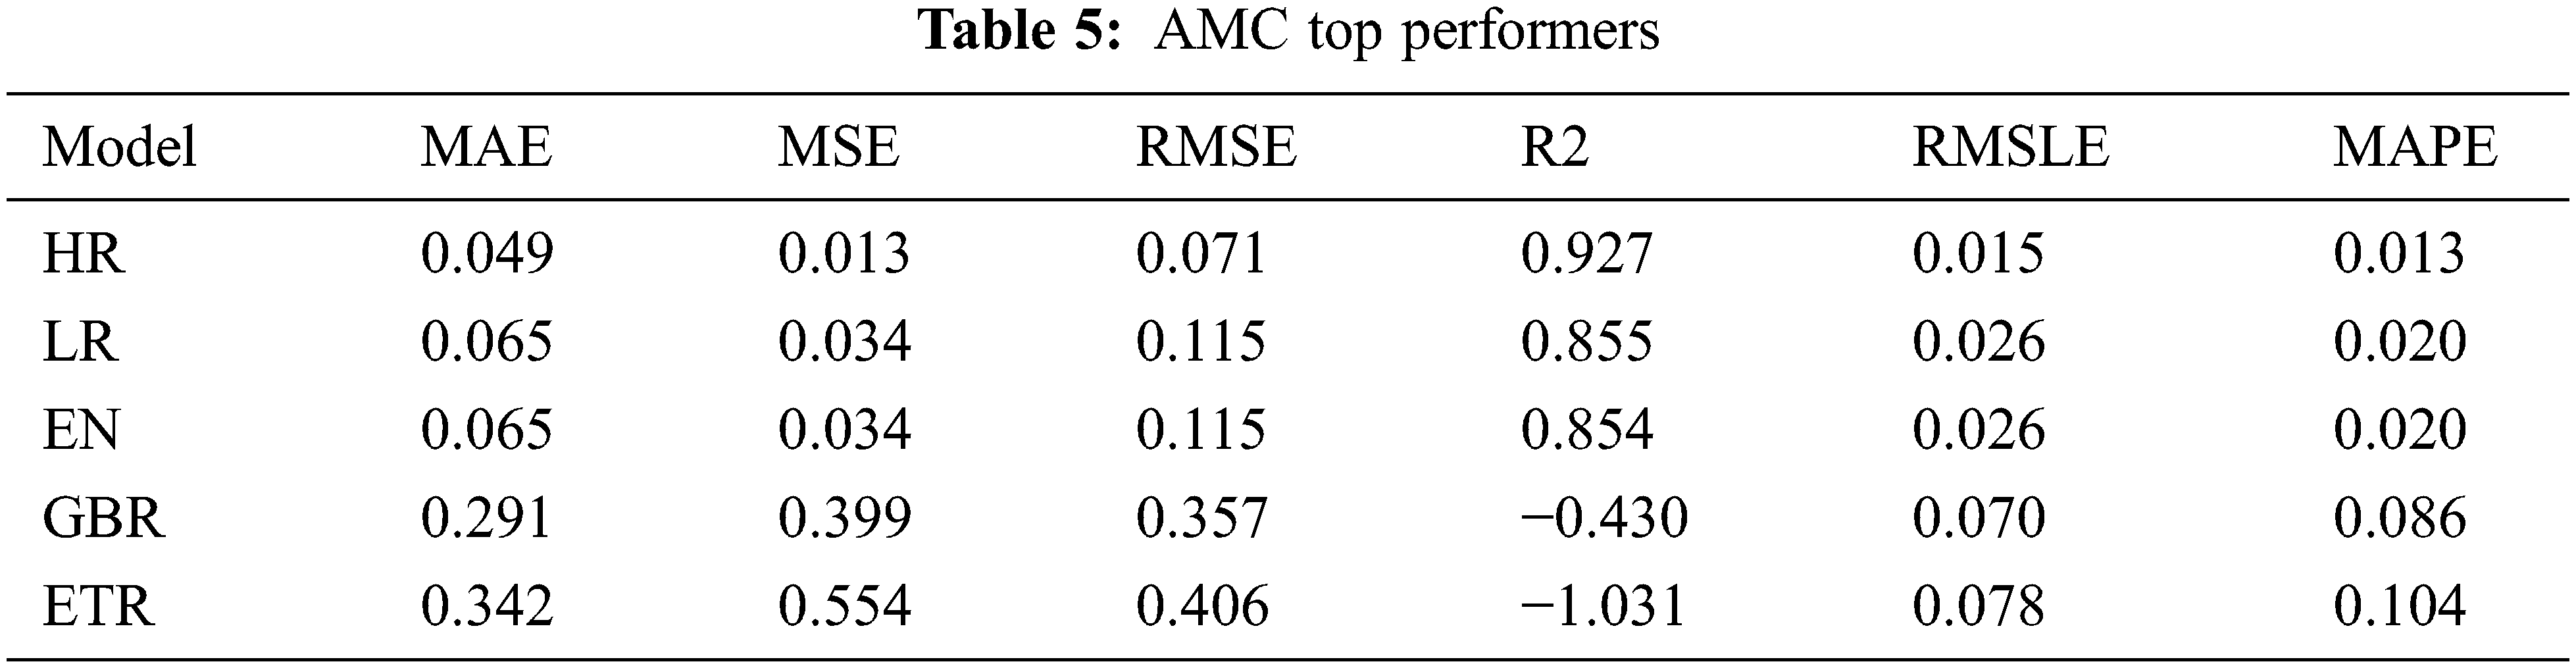
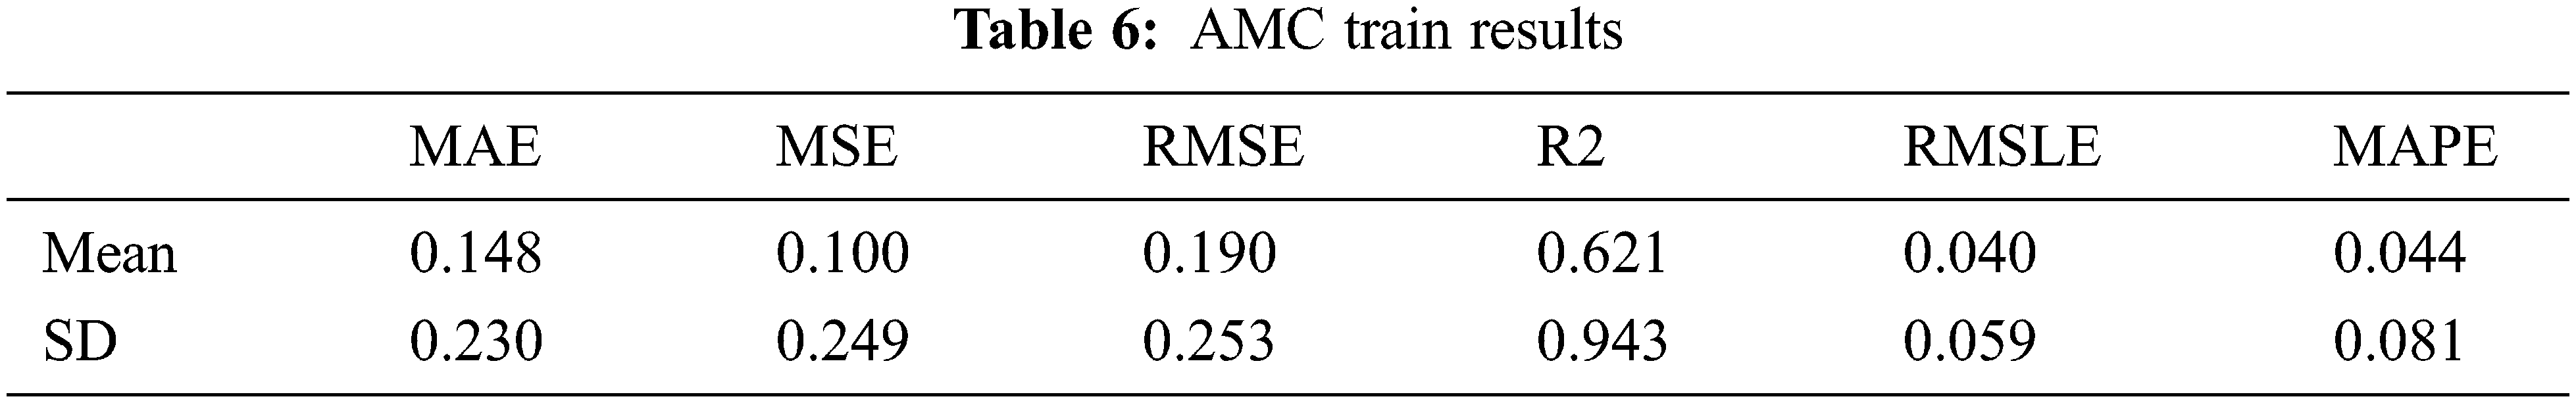
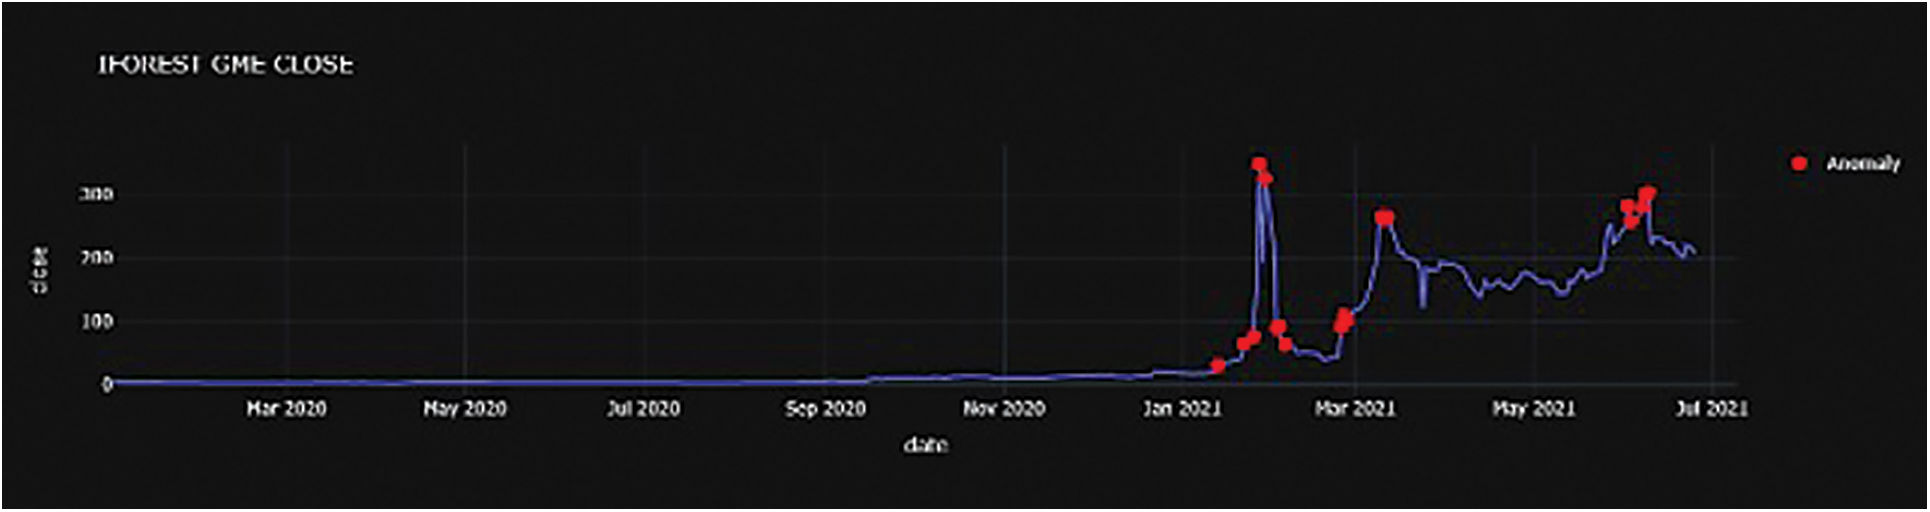
Figure 8: GME anomaly chart
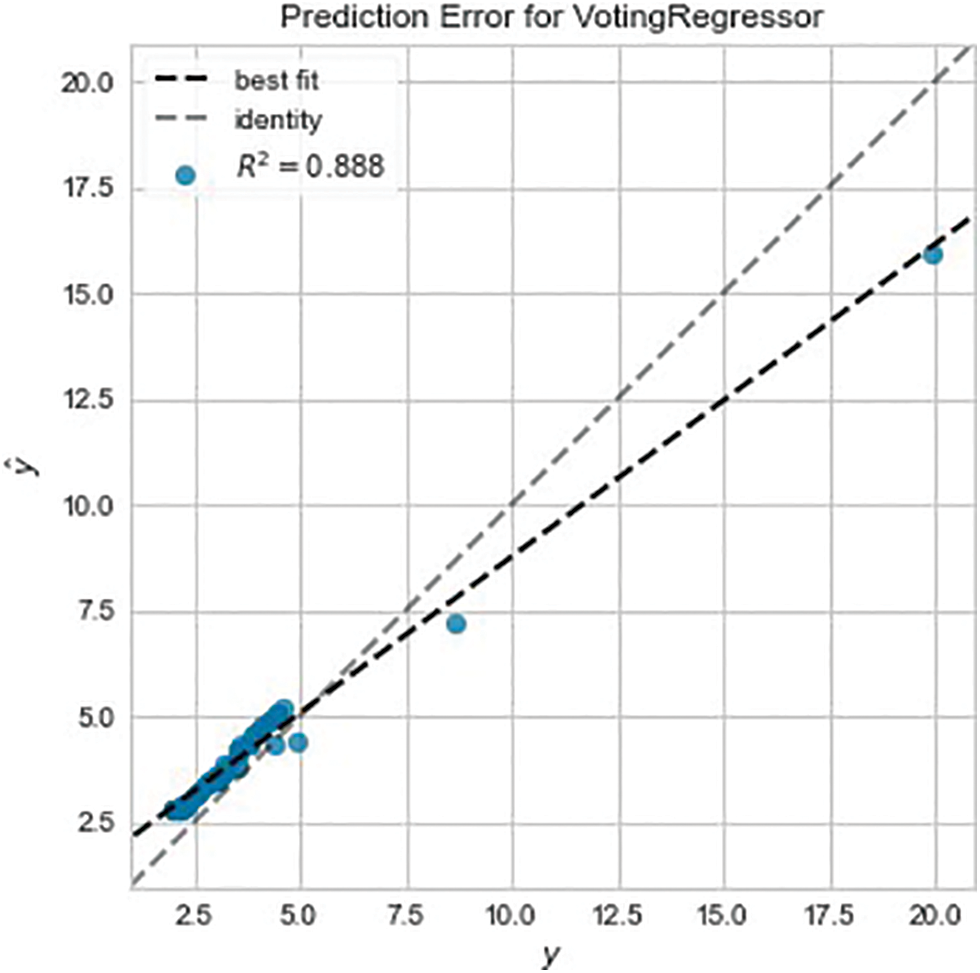
Figure 9: AMC prediction error pre-tuning
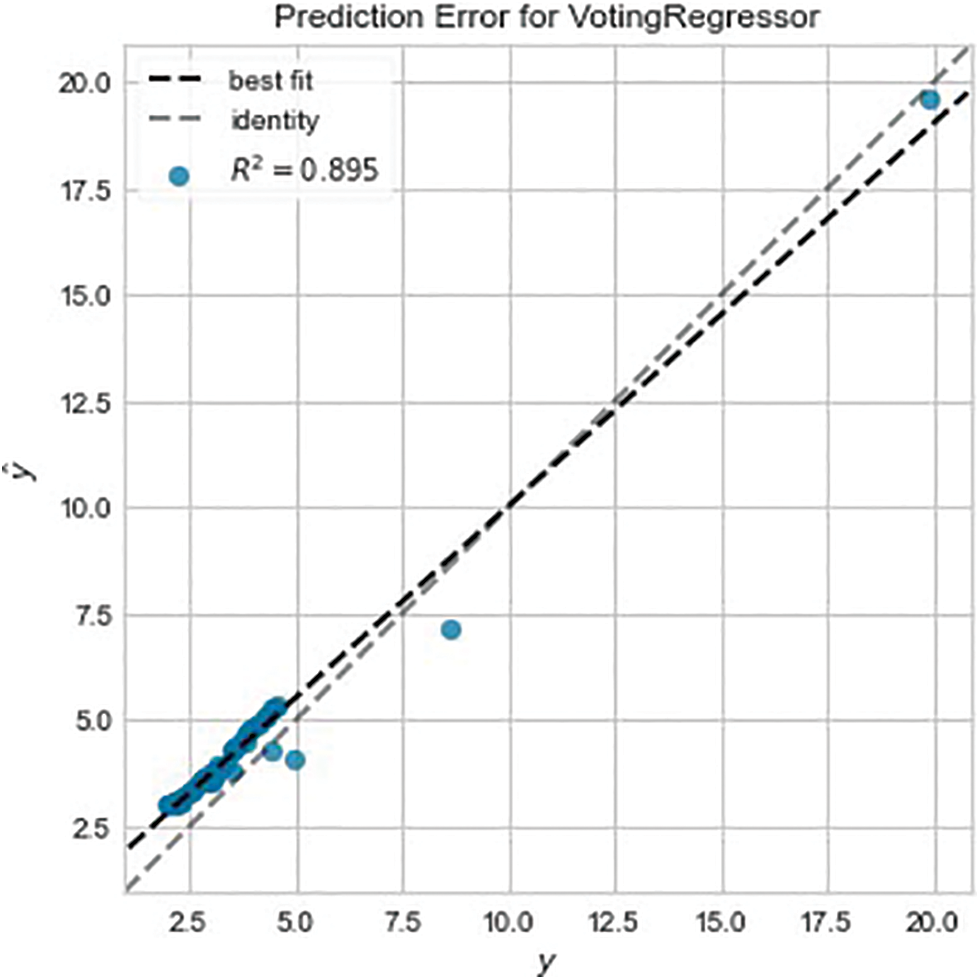
Figure 10: AMC prediction error post-tuning
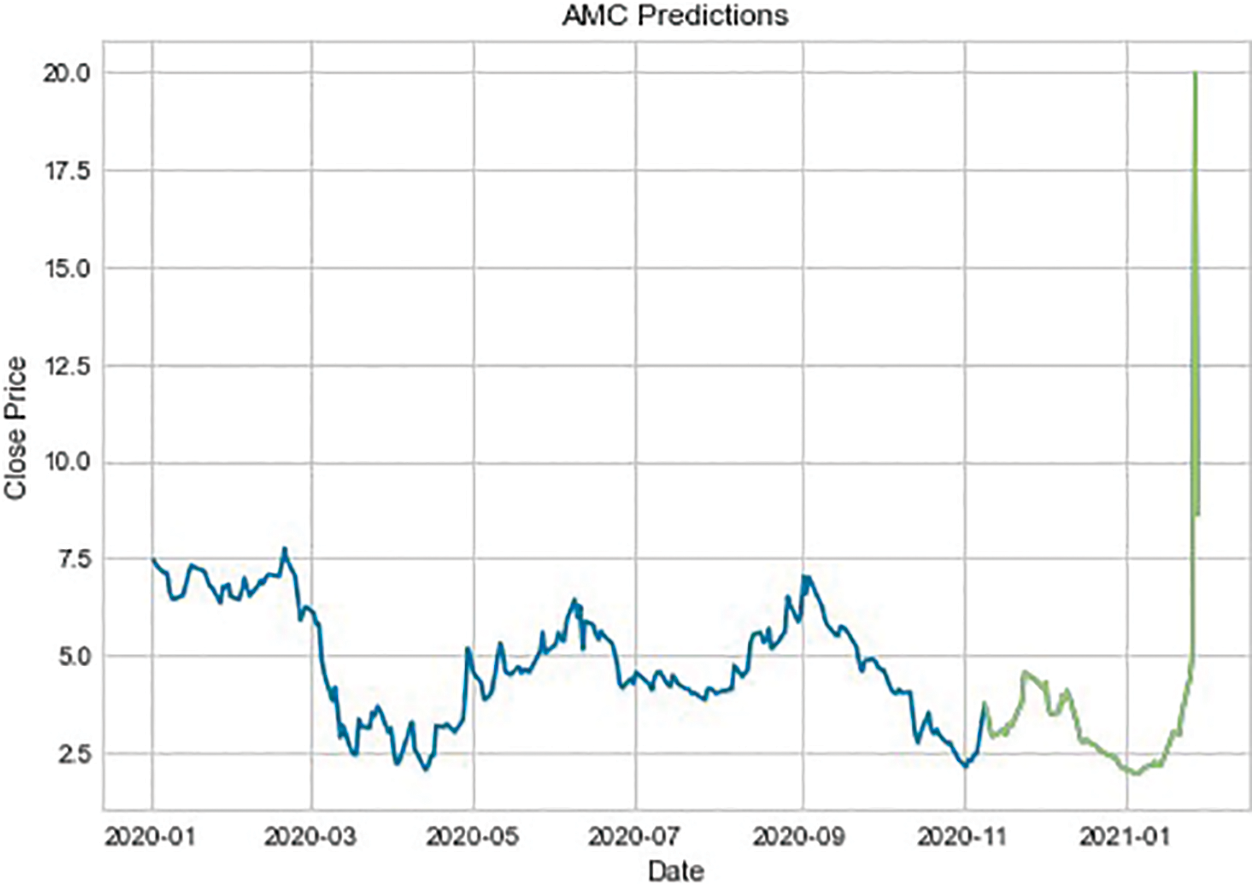
Figure 11: AMC prediction chart
The performance results of the anomaly detection approaches that were used on the datasets are presented in this section. PyCaret’s iForest (Isolation Forest) model was applied to the dataset for each ticker. Due to the large number of features in the dataset and the absence of feature selection in the anomaly detection module, PCA was used to reduce the feature set.
PCA was used because it is frequently applied to reduce the feature set size during feature engineering, for example, as explained in Section 2.2 in the work of Tanaka-Yamawaki et al. [11]. The iForest model is selected due to its superior performance compared to other anomaly detection techniques [6,8]. The first step is to apply iForest to the $GME dataset and create a plot to visualize the anomalies detected as shown in Fig. 8. Fig. 8 shows, in red dots, the numerous anomalies detected after January 2021. There are points marked as anomalous before the price run on January 28th, 2021, as well as other dates in time [34]. When cross-referencing these dates with news articles and other resources, it is discovered that the dates identified match what happened to the stock price movement [34]. Further investigation revealed a Reddit user who shows activity on most of the anomalous dates, leading to the conclusion that this user could be considered a market manipulator.
The output of the iForest model contains the original features with anomaly labels (1 and 0) as well as an anomaly score. The anomaly detection model output is then fed into the voting regressor models that were developed.
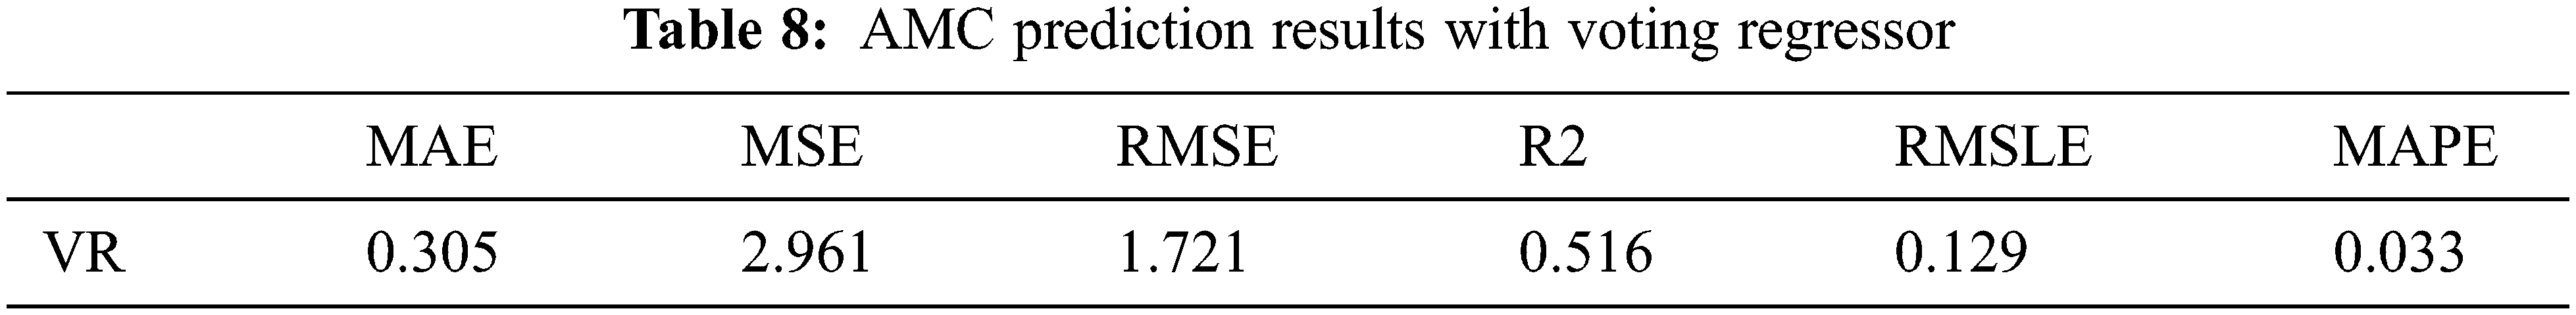
The prediction error and evaluation metrics for $GME show no improvement. For $AMC, a different voting regressor than the original is applied due to the change in top performers after inputting the iForest output. Table 7 contains the new $AMC top performers and Fig. 12 shows the anomalous dates identified. The prediction results for $AMC using the voting regressor are shown in Table 8, and it does not show any significant improvement in the R2 score. However, improvements are seen in the MAE and RMSLE metrics. Nevertheless, this failure to fit the data from anomaly labels and anomaly scores leads to the conclusion that using anomaly detection as a source for additional features for price prediction requires further study.
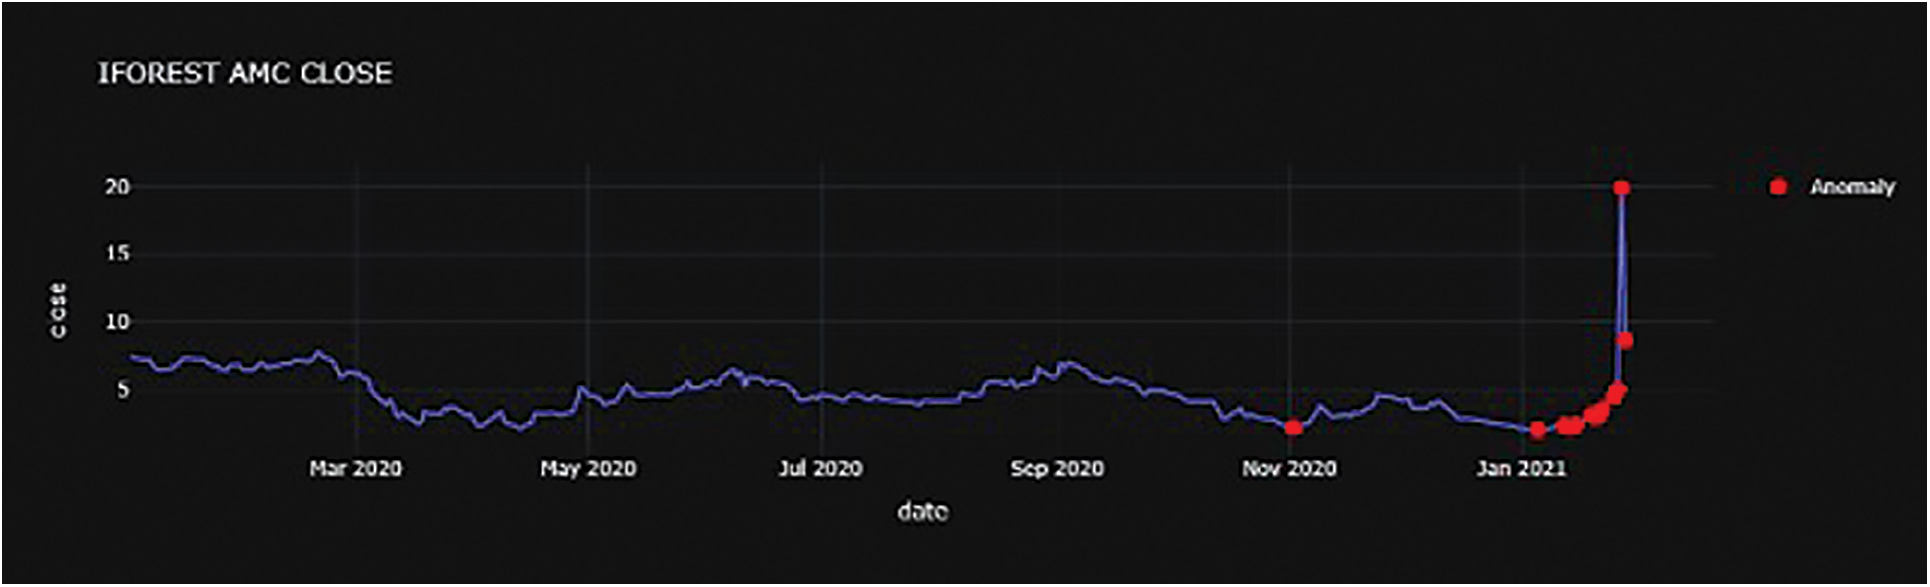
Figure 12: AMC anomaly chart
To further understand the relationships between features in anomalous data, the correlation coefficient is computed. Previously, a heatmap was created to visualize the correlation between features to identify the importance among features and gauge what could impact price movement before prediction. In this analysis, the correlation amongst the data identified as anomalous is inspected to further understand the relationships between features to get a better understanding of what was causing deviant behavior. The correlation coefficient with respect to the closing price for both tickers is computed. It is noted that in both datasets that there are very strong positive correlations between the closing price and several technical indicators, similar to the earlier observation. A very strong positive correlation between the bullish sum of users and the close price is noticed as shown in Fig. 13. Furthermore, the percent change in bullishness in Fig. 13 very strongly negatively correlates with the close price amongst the anomalous data, indicating a change in public sentiment for the respective ticker that results in a negative price movement.
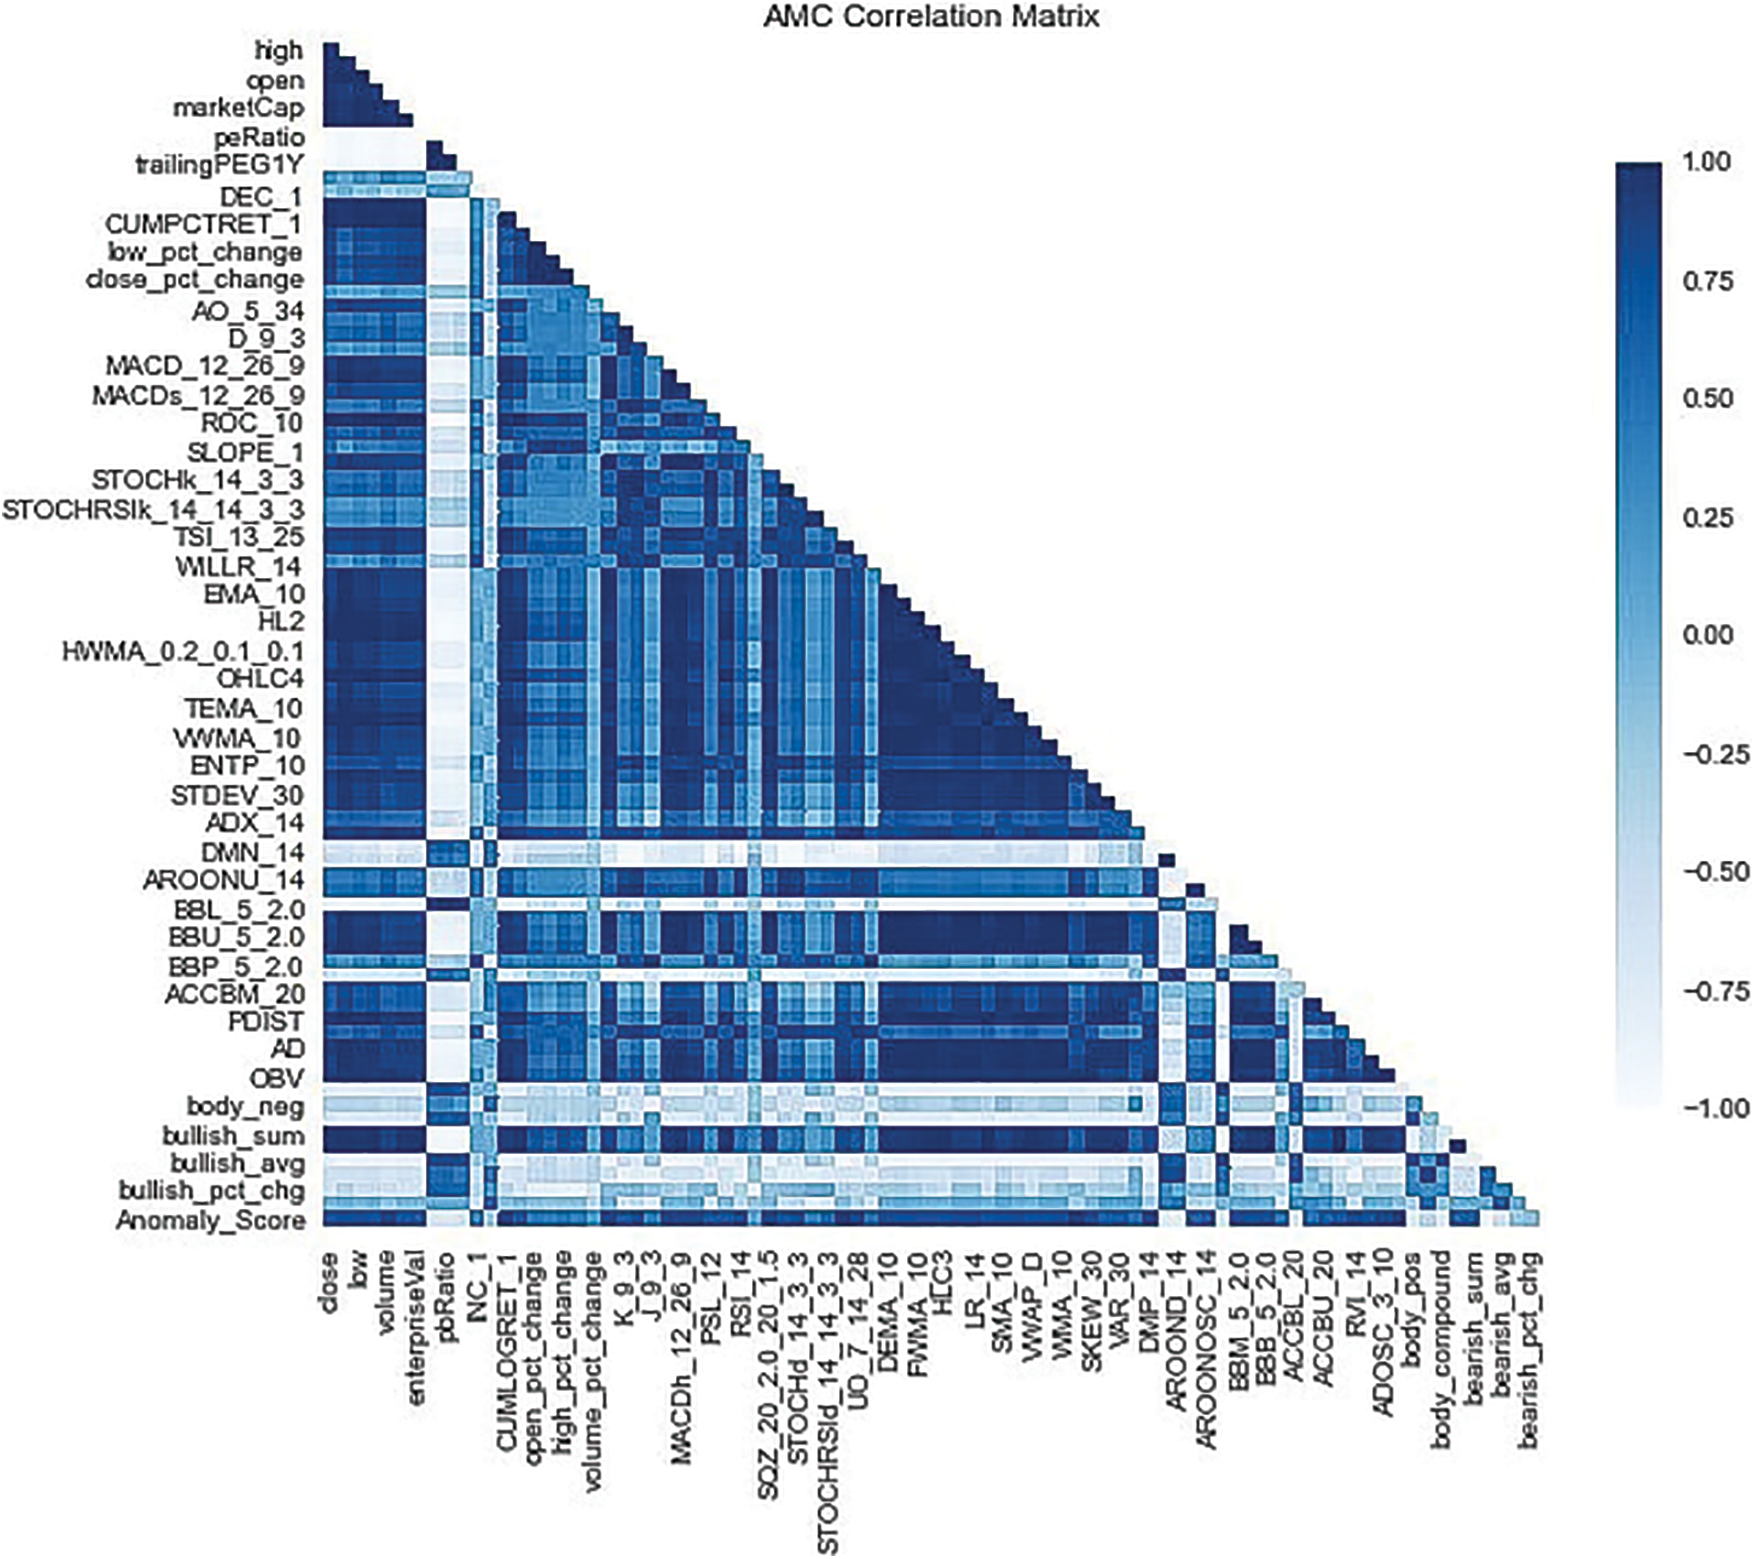
Figure 13: AMC anomaly correlation heatmap
Fig. 13 displays many very strong positive correlations, leading to the conclusion that those technical indicators are useful in predicting anomalous data. It can also be seen that there is an extreme negative correlation between the price-to-book ratio and numerous features including the closing price, which could be indicative of overvaluation. Fig. 14 shows a more even correlation amongst features, with the price-to-book ratio showing mixed correlations, yet consistent with Fig. 13 as it remains strongly negatively correlated with the closing price. Also noted are the strong positive relationships between the sentiment features (bullish/bearish) and the closing price as well as numerous features. Based on prior knowledge, $GME is a widely popular topic of discussion on Reddit, and using this knowledge together with Fig. 14 it can be inferred that sentiment drives the price in the anomalous data.
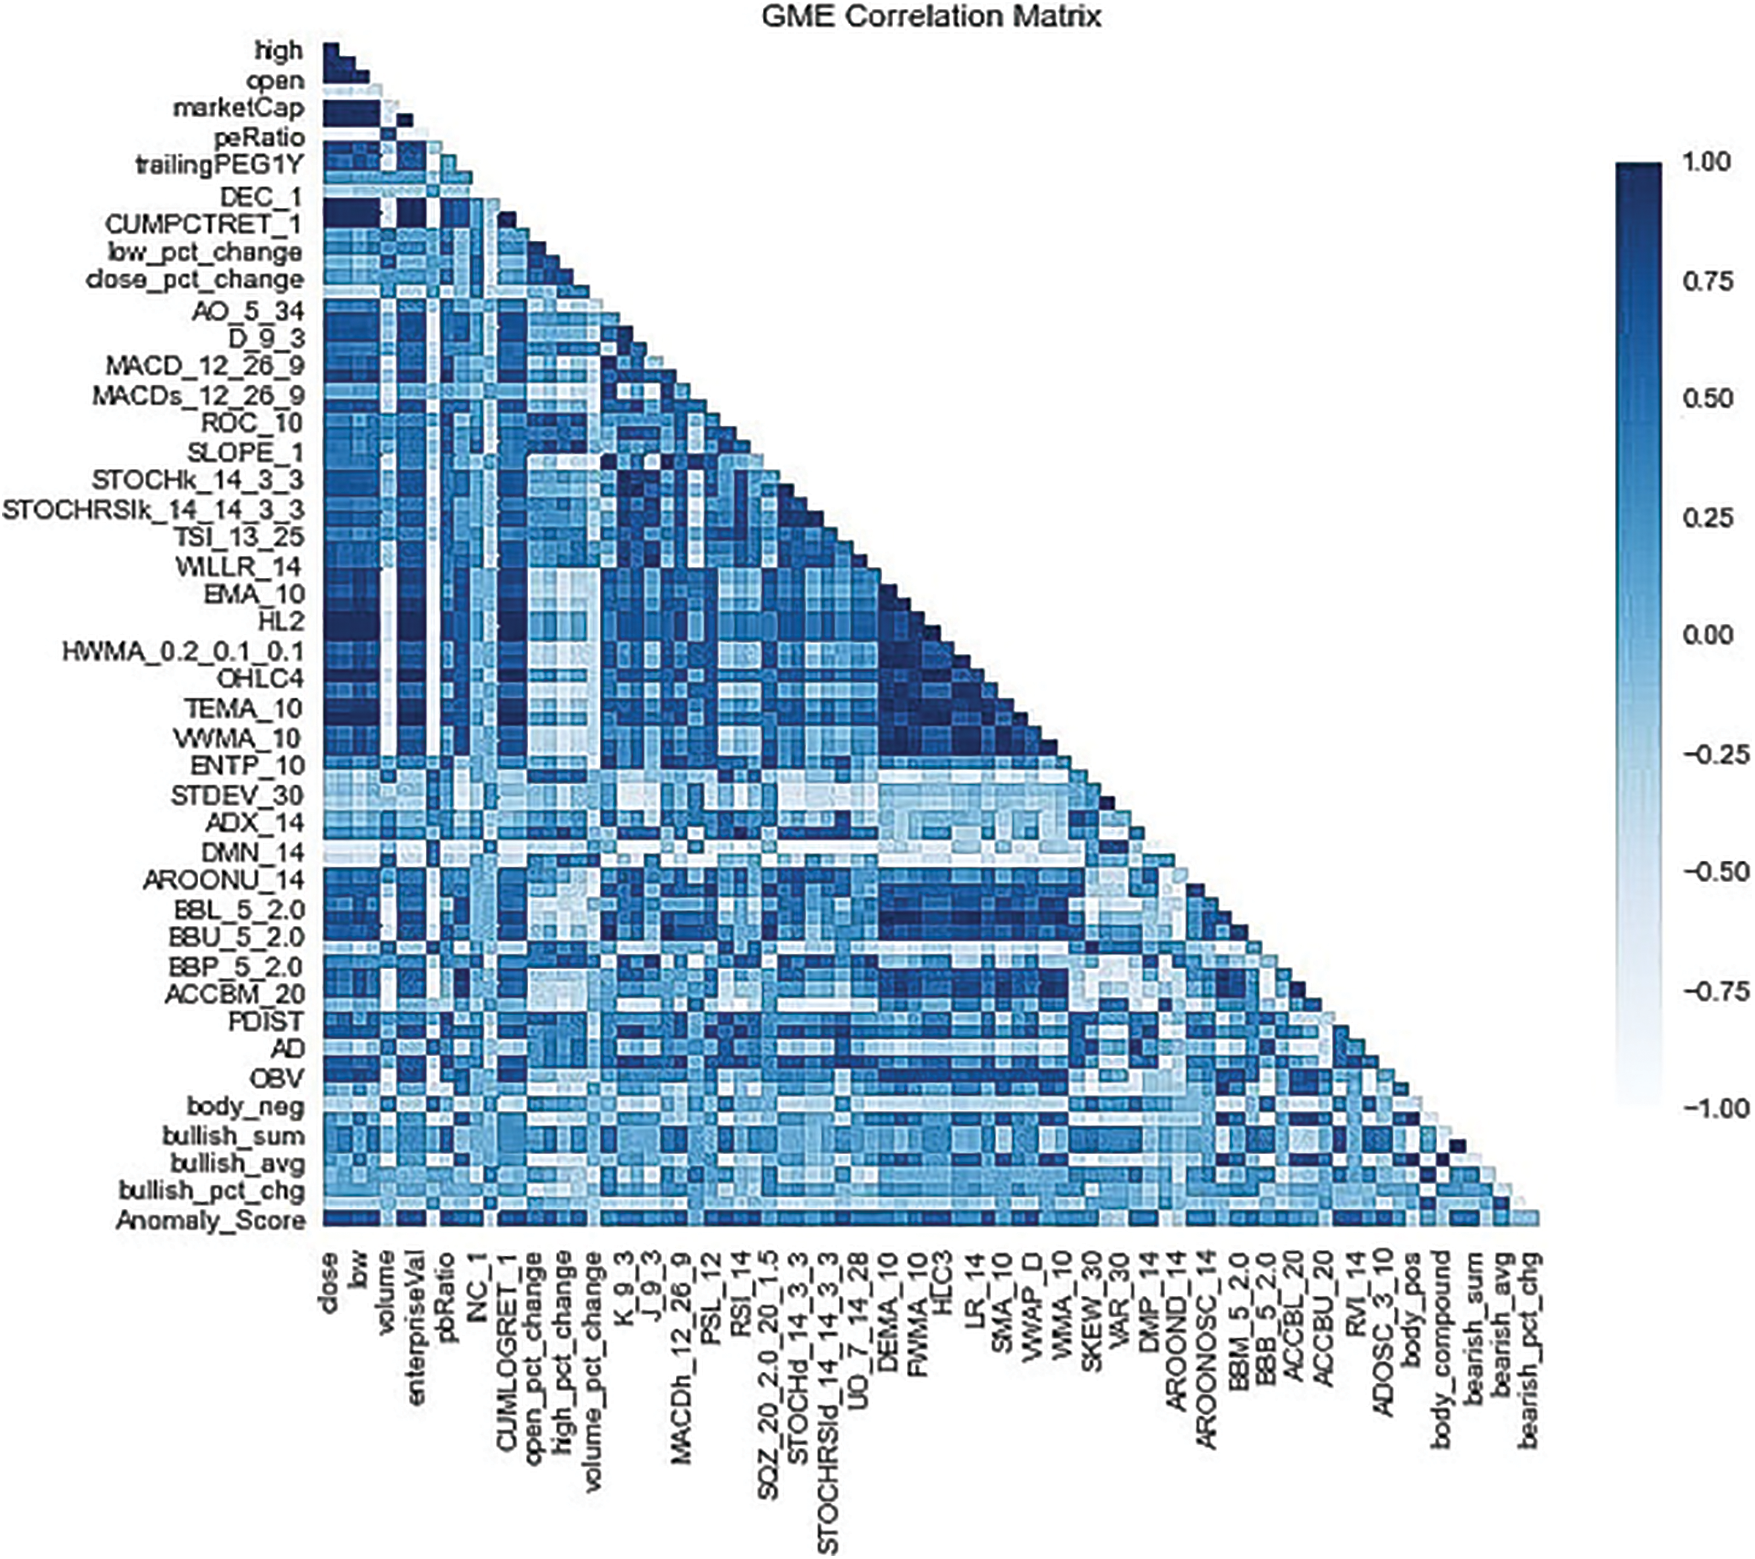
Figure 14: GME anomaly correlation heatmap
Based on this research work, it is concluded that when good features engineering is done, machine learning models can perform well in stock price movement prediction. This work was able to identify several relationships among features that may prove useful in future work. Suggestions for future research include expanding the tickers used to cover a wide range of meme stocks. Additionally, collecting data from more social media platforms such as StockTwits and Twitter could prove useful and allow for more robust data. The social media data collected and used in this paper contains Reddit comments regarding a specific keyword. Future research should focus on Reddit submissions to further refine the anomaly detection process, allowing for a more accurate analysis of potential market movers and the effects of social media sentiment on price movement. Lastly, market simulation containing gains and losses would provide further support for research, allowing readers to interpret the monetization of stock market prediction.
Acknowledgement: The authors would like to thank Amazon AWS for the summer 2021 grant that allowed us to port and complete this research on the SageMaker platform and for the support from the AWS US Higher Ed. Team.
Funding Statement: The authors received no specific funding for this study.
Conflicts of Interest: The authors declare that they have no conflicts of interest to report regarding the present study.
References
1. M. Egan, “It’s not just gamestop. market bubble fears are rising,” 2021. [Online]. Available: https://www.cnn.com/2021/01/29/investing/gamestop-bubble-wall-street/index.html. [Google Scholar]
2. D. Vena, J. Hall and B. Withers, “GameStop and AMC highlight the most important lesson for investors to learn,” 2021. [Online]. Available: https://www.fool.com/investing/2021/02/16/gamestop-and-amc-highlight-the-most-important-less/. [Google Scholar]
3. L. Francus, “A tale of two memes: How GameStop and AMC impacted the credit market, moody analytics,” 2021. [Online]. Available: https://www.moodysanalytics.com/articles/2021/a%20tale%20of%20two%20memes%20-%20how%20gamestop%20and%20amc%20impacted%20the%20credit%20market. [Google Scholar]
4. E. Fama, “Random walks in stock market prices,” Financial Analysts Journal, vol. 21, no. 5, pp. 55–59, 1965. [Google Scholar]
5. A. Bernal, S. Fok and R. Pidaparthi, “Financial market time series prediction with recurrent neural networks,” 2012. [Online]. Available: http://cs229.stanford.edu/proj2012/BernalFokPidaparthiFinancialMarketTimeSeriesPredictionwithRecurrentNeural.pdf. [Google Scholar]
6. M. Ballings, D. Poel, N. Hespeels and R. Gryp, “Evaluating multiple classifiers for stock price direction prediction,” Expert Systems with Applications, vol. 42, no. 20, pp. 7046–7056, 2015. [Google Scholar]
7. E. Ampomah, Z. Qin and G. Nyame, “Evaluation of tree-based ensemble machine learning models in predicting stock price direction of movement,” Information, vol. 11, no. 6, pp. 332–352, 2020. [Google Scholar]
8. N. Bhardwaj and M. A. Ansari, “Prediction of stock market using machine learning algorithms,” International Research Journal of Engineering and Technology, vol. 6, no. 5, pp. 5994–6005, 2019. [Google Scholar]
9. L. Khaidem, S. Saha, S. Basak, S. Kar and S. Dey, “Predicting the direction of stock market prices using random forest,” 2016. [Online]. Available: https://doi.org/10.48550/arXiv.1605.00003 [Google Scholar] [CrossRef]
10. N. Milosevic, “Equity forecast: Predicting long term stock price movement using machine learning,” 2018. [Online]. Available: https://doi.org/10.48550/arXiv.1603.00751 [Google Scholar] [CrossRef]
11. M. Tanaka-Yamawaki and S. Tokuoka, “Adaptive use of technical indicators for the prediction of intra-day stock prices,” Physica A: Statistical Mechanics and its Applications, vol. 383, no. 1, pp. 125–133, 2007. [Google Scholar]
12. S. Dey, Y. Kumar, S. Saha and S. Basak, “Forecasting to classification: Predicting the direction of stock market price using xtreme gradient boosting,” 2016. [Online]. Available: https://doi.org/10.13140/RG.2.2.15294.48968 [Google Scholar] [CrossRef]
13. K. Chen, Y. Zhou and F. A. Dai, “LSTM-Based method for stock returns prediction: A case study of China stock market,” in Proc. of the 2015 IEEE Int. Conf. on Big Data, Santa Clara, CA, USA, pp. 2823–2824, 2015. [Google Scholar]
14. M. Roondiwala, H. Patel and S. Varma, “Predicting stock prices using LSTM,” International Journal of Science and Research, vol. 6, no. 4, pp. 1754–1756, 2017. [Google Scholar]
15. A. Dingli and K. S. Fournier, “Financial time series forecasting–A deep learning approach,” International Journal of Machine Learning and Computing, vol. 7, no. 5, pp. 118–122, 2017. [Google Scholar]
16. S. Selvin, R. Vinayakumar, E. A. Gopalakrishnan, V. K. Menon and K. P. Soman, “Stock price prediction using LSTM, RNN, and CNN-sliding window model,” in Proc. of the 2017 Int. Conf. on Advances in Computing, Communications and Informatics (ICACCI), Manipala, India, pp. 1643–1647, 2017. https://doi.org/10.1109/ICACCI.2017.8126078 [Google Scholar] [CrossRef]
17. X. Lin, Z. Yang and Y. Song, “The application of echo state network in stock data mining,” In: T. Washio, E. Suzuki, K. M. Ting and A. Inokuchi (Eds.Advances in Knowledge Discovery and Data Mining, Springer-Verlag Berlin, Heidelberg, Germany, vol. 5012, pp. 932–937, 2008. [Google Scholar]
18. X. Lin, Z. Yang and Y. Song, “Short-term stock price prediction based on echo state networks,” Expert Systems with Applications, vol. 36, no. 3, pp. 7313–7317, 2009. [Google Scholar]
19. J. Dan, W. Guo, W. Shi, B. Fang and T. Zhang, “Deterministic echo state networks-based stock price forecasting,” Abstract and Applied Analysis, vol. 2014, pp. 1–6, 2014. [Google Scholar]
20. M. L. Mitchell and H. Mulherin, “The impact of public information on the stock market,” Journal of Finance, vol. 49, no. 3, pp. 923–950, 1994. [Google Scholar]
21. V. S. Pagolu, K. N. Reddy, G. Panda and B. Majhi, “Sentiment analysis of twitter data for predicting stock market movements,” in Proc. of the 2016 Int. Conf. on Signal Processing Communication, Power and Embedded System (SCOPES), Paralakhemundi, India, pp. 1345–1350, 2016. [Google Scholar]
22. A. Khedr, S. E. Salama and N. Yaseen, “Predicting stock market behavior using data mining technique and news sentiment analysis,” International Journal of Intelligent Systems and Applications, vol. 9, no. 7, pp. 22–30, 2017. [Google Scholar]
23. F. Xu and V. Keelj, “Collective sentiment mining of microblogs in 24-hour stock price movement prediction,” in Proc. of the 16th IEEE Conf. on Business Informatics, Geneva, Switzerland, pp. 60–67, 2014. [Google Scholar]
24. Y. Zhai, A. Hsu and S. K. Halgamuge, “Combining news and technical indicators in daily stock price trends prediction,” In: D. Liu, S. Fei, Z. Hou, H. Zhang and C. Sun (Eds.Advances in Neural Networks, 2007. Lecture Notes in Computer Science, vol. 4493. Berlin, Heidelberg: Springer. https://doi.org/10.1007/978-3-540-72395-0_132 [Google Scholar] [CrossRef]
25. M. Ahmed, N. Choudhury and S. Uddin, “Anomaly detection on Big data in financial markets,” in Proc. of the 2017 IEEE/ACM Int. Conf. on Advances in Social Networks Analysis and Mining, Sydney, Australia, pp. 998–1001, 2017. [Google Scholar]
26. M. Ahmed, A. N. Mahmood and M. R. Islam, “A survey of anomaly detection techniques in financial domain,” Future Generation Computer Systems, vol. 55, pp. 278–288, 2016. https://doi.org/10.1016/j.future.2015.01.001 [Google Scholar] [CrossRef]
27. A. Anandakrishnan, S. Kumar, A. Statnikov, T. Faruquie and D. Xu, “Anomaly detection in finance: Editors’ introduction,” in Proc. of the KDD 2017: Workshop on Anomaly Detection in Finance, Halifax, Nova Scotia, Canada, vol. 71, pp. 1–7, 2018. [Google Scholar]
28. Tiingo API. 2022. [Online]. Available: https://api.tiingo.com/. [Google Scholar]
29. C. Hutto and E. Gilbert, “VADER: A parsimonious rule-based model for sentiment analysis of social media text,” in Proc. of the Eighth Int. AAAI Conf. on WebLogs and Social Media, Ann Arbor, Michigan, USA, vol. 8, no. 1, pp. 216–225, 2014. [Google Scholar]
30. PyCaret Classification. 2020. [Online]. Available: https://pycaret.readthedocs.io/en/latest/api/classification.html. [Google Scholar]
31. J. Wang and J. Wang, “Forecasting stock indexes using principal component analysis and stochastic time effective neural networks,” Neurocomputing, vol. 156, no. 2015, pp. 68–78, 2015. [Google Scholar]
32. Amazon SageMaker Studio. 2022. [Online]. Available: https://aws.amazon.com/sagemaker/studio. [Google Scholar]
33. PyCaret Optimize. 2021. [Online]. Available: https://pycaret.gitbook.io/docs/get-started/functions/optimize. [Google Scholar]
34. GME timeline, GameStop Short FTD Squeeze Timeline. 2021. [Online]. Available: https://gmetimeline.com/. [Google Scholar]
Cite This Article
 Copyright © 2023 The Author(s). Published by Tech Science Press.
This work is licensed under a Creative Commons Attribution 4.0 International License , which permits unrestricted use, distribution, and reproduction in any medium, provided the original work is properly cited.
 Downloads
 Citation Tools