
 Submit a Paper
 Propose a Special lssue
 Open Access
ARTICLE

Mechanisms Influencing Learning Gains Under Information Security: Structural Equation Modeling with Mediating Effect
1 National University of Defense Technology, Wuhan, 430000, China
2 Information Engineering University, Zhengzhou, 450000, China
3 Henan University, Zhengzhou, 450000, China
* Corresponding Author: Teng Zong. Email:
Intelligent Automation & Soft Computing 2023, 36(3), 3447-3468. https://doi.org/10.32604/iasc.2023.035456
Received 22 August 2022; Accepted 23 November 2022; Issue published 15 March 2023
 View Full Text
 Download PDF
Abstract
With the expanding enrollments in higher education, the quality of college education and the learning gains of students have attracted much attention. It is important to study the influencing factors and mechanisms of individual students’ acquisition of learning gains to improve the quality of talent cultivation in colleges. However, in the context of information security, the original data of learning situation surveys in various universities involve the security of educational evaluation data and daily privacy of teachers and students. To protect the original data, data feature mining and correlation analyses were performed at the model level. This study selected 12,181 pieces of data from X University, which participated in the Chinese College Student Survey (CCSS) from 2018 to 2021. A confirmatory factor analysis was conducted and a structural equation modeling was conducted using AMOS 24.0. Through hypothesis testing, this study explored the mechanisms that influence learning gains from the perspectives of student involvement, teacher involvement, and school support. The results indicated that the quality of student involvement has an important mediating effect on learning gains and that a supportive campus environment has the greatest influence on learning gains. Establishing positive emotional communications between teachers and students is a more direct and effective method than improving the teaching level to improve the quality of student involvement. This study discusses the implications of these results on the research and practice of connotative development in higher education.Keywords
To build a country with a powerful education, colleges need to develop a good education development ecology. With the gross enrollment rate of higher education in China exceeding 50%, the education stage has officially entered popularization through massification [1]. Therefore, greater attention should be paid to the quality and efficiency of education provided in China. In the context of deepening education reform, China has undertaken innovative strategies in the proposition orientation of college entrance examinations, the setting of examination subjects, and the university teaching model. However, a mature evaluation system has not yet been developed for higher education. Based on the innovative development of higher education, the key to improving the quality of higher education is to correctly evaluate the current situation of education.
The new generation of data science and technology has profoundly affected the field of education by supporting the development of education in the direction of intelligence. The application of data science in the field of educational evaluation provides new ideas for the collection, processing, mining, and evaluation of educational data. At the same time, it also poses security risks to educational evaluation data and the privacy of teachers and students [2]. Although the survey items were revamped, they still reflected participants’ personal habits. Teachers and students have been encouraged to participate in the evaluation of the educational process. However, concerns regarding data security have created psychological resistance. As a result, the enthusiasm of teachers and students to participate in learning surveys has weakened, and not everyone has taken such research seriously. The quality of the resultant survey data is poor. Making the acquisition and application of educational evaluation data more convenient and making the analysis method increasingly scientific is an important subject of higher education research at the present stage. Currently, multi-source education data gradually covers the entire educational process. Through the in-depth analysis of students’ knowledge, ability, and emotion, it has profound research and practical significance to recognize the education situation, transform the education mode, highlight the education focus, optimize the education process, and improve the education quality.
How do we evaluate the effectiveness of higher education reform for the entire country? How can the quality of education be evaluated for a college? How do we evaluate college students’ learning gains? These issues will be the focus of attention in the field of future education evaluation. From the perspectives of college students, this study analyzed the main factors and correlations that affect individual learning gains during school. Based on the classic student learning engagement theory, the first part of this paper presents seven hypotheses that affect learning gains. The second part expounds the tools and methods used for conducting the research, as well as the construction of the indicator system. Through confirmatory factor analysis, the reliability and validity are tested to ensure the stability and reliability of the indicator system. The third part constructs a structural equation model based on the mediating effect by respectively verifying the research hypotheses. The last part analyzes the model fit and interpretability, discusses the mechanism that affects learning gains, and puts forward suggestions for higher education management decision-making and future research directions.
A growing body of research is focusing on the influence of experiences in school and the university characteristics on students. This study promotes the development of the student learning engagement theory. An important topic in this era is how to promote students’ development, explore the factors and causes of students’ progress, explain the external motivation behind students’ development, and improve the quality of university education. There have been a number of internationally influential learning engagement theories for a long time (see Fig. 1).
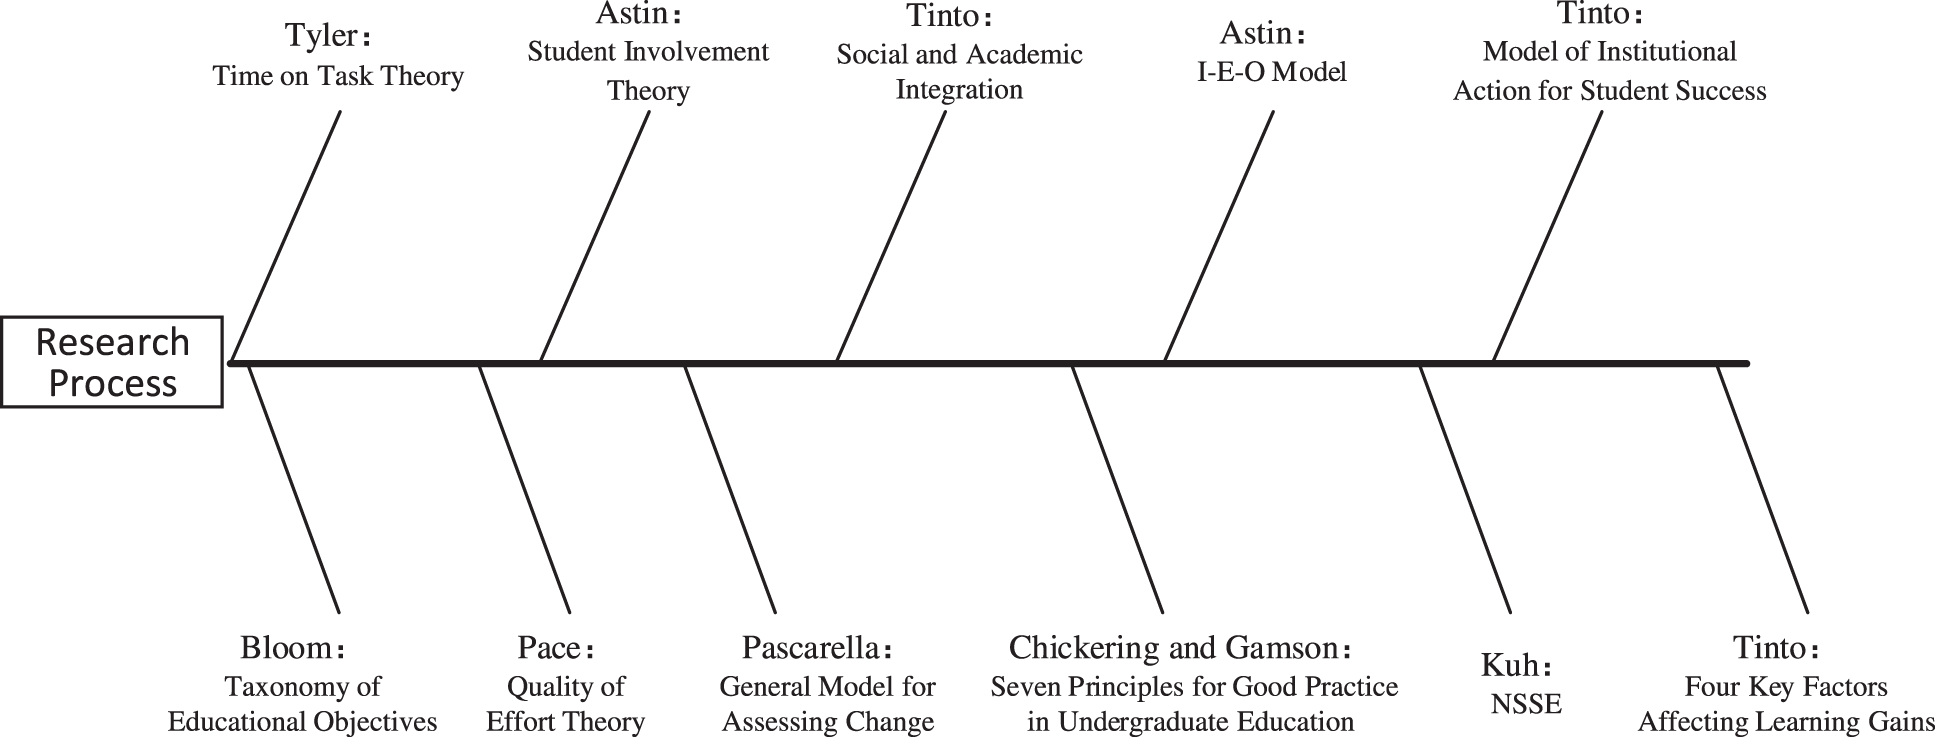
Figure 1: Student engagement research process
Tyler proposed the Time on Task Theory. He believed that the learning gains of students were positively correlated with the time and energy they spent completing their academic tasks [3]. Bloom subsequently proposed a taxonomy of educational objectives in the cognitive field [4].
Pace proposed the Quality of Effort Theory based on Tyler’s work. In his opinion, the learning gains of students were related to not only the time and energy they spent on completing their academic tasks, but also to the quality of the efforts exerted by them [5].
Astin proposed the Student Involvement Theory based on extensive research. He agreed with the ideas of Pace and proposed that student effort quality should be raised to student involvement, which could be subdivided into physical and psychological involvement. The connotation of “involvement” includes not only student independent learning, but also all academic, social, and extra-curricular activities, such as learning interaction between teachers and students and learning exchange between students [6]. Thus far, research on college student learning has expanded from individual student involvement to teacher involvement and peer assistance.
Pascarella proposed a general model for assessing change that can explain the development of college students’ cognitive ability by analyzing student background information (such as entrance characteristics), campus interpersonal interaction, and student effort quality [7].
Tinto integrated sociological theories into the study of learning engagement and further proposed the concept of “social and academic integration.” He believed that learning gains depend not only on students’ individual involvement, but also on school environment integration. The connotation of “integration” not only emphasizes the participation and investment of students in campus culture, but also includes the support of resources, environment, atmosphere, and policies provided by colleges in the education process [8]. Tinto’s perspective prompted a significant change in the theory of learning engagement, moving from merely emphasizing students’ individual involvement to focusing on the integration of individual involvement and college environment support.
Chickering and Gamson proposed seven principles for good practice in undergraduate education [9]. This study provides an important basis for educational evaluation and theoretical support to analyze student learning gains.
Astin proposed the Input-Environment-Outcome Model (I-E-O). “Input” mainly refers to the basic characteristics of students, including their background and learning or social experience before entrance. “Environment” refers to the learning experience of students in school, covering the measures taken by the school to promote student development, such as the campus culture, educational philosophy, curriculum, and so on. “Outcome” refers to the intellectual development of students after enrollment, including changes in cognition, skills and values through interaction with the school and the surrounding environment. The model attempts to explain the impact of the environment on student groups and individual development, especially focusing on instructional planning and management policies. However, it does not explain why or how students change in theory but guides researchers to study the impact of higher education experience on students in terms of concepts or methods [10].
Kuh further improved the Learning Engagement Theory. On the premise of integrating the seven principles of good practice in undergraduate education with the taxonomy of educational objectives in the cognitive field, he presided over and promoted the development of the National Survey of Student Engagement (NSSE). The NSSE has been widely adopted by many universities worldwide and has become the most influential tool in college student learning surveys [11].
Tinto proposed a model of institutional action for student success based on the Student Integration Theory [12]. Tinto further optimized the model of institutional action for student success, and proposed that academic expectations, school environment support, assessment and feedback, and student engagement are four key factors that affect learning outcomes [13].
Systematic research on the university experience survey in China began in 2007 when Professor Shi’s team at the Institute of Education, Tsinghua University introduced the NSSE. Since then, related research on the development, application, and theoretical model construction of the NSSE has been conducted. As far as theoretical innovation is concerned, most of the existing research is the induction and inheritance of classic learning engagement theory, lacking enrichment and development of theoretical connotations. As far as the survey tools are concerned, although the questionnaires have been improved according to actual needs in the application of different types of universities, the reliability of the adjusted questionnaires and the stability of the model lack scientific validation. Therefore, the findings need to be examined. In terms of research methods, most current empirical research adopts descriptive statistics, regression analysis, or norm comparison with the five-dimensional indicators proposed in the original NSSE questionnaire. There is a lack of high-quality research on exploring the complex relationships between the factors of learning engagement through targeted model-building.
By summarizing the above classical theories, it can be seen that research on college impact has expanded from the perspective of students to teachers and then further to the perspective of the school environment. Quality of student involvement (QSI), quality of teacher involvement (QTI), and supportive campus environment (SCE) have become three key factors for universities to improve the quality of talent cultivation. These are the most closely related influencing factors for analyzing student learning gains (SLG). Through the above literature review, this study obtained the specific connotations of each factor.
The QSI reflects the individual efforts of the students in the learning process. From the teachers’ perspective, QTI is divided into effective teaching practice (ETP) and the emotional support of teachers and students (EST-S). The ETP reflects the guiding effect of teaching practice on students. The EST-S reflects the emotional communication and interaction between teachers and students in the teaching process. SCE reflects students’ perceptions of the policies and facilities provided by the school to ensure learning, and SLG reflects students’ perceptions of their own learning gains in the learning process.
After sorting out the relevant theories and connotations, this research proposes a hypothesis model (see Fig. 2).
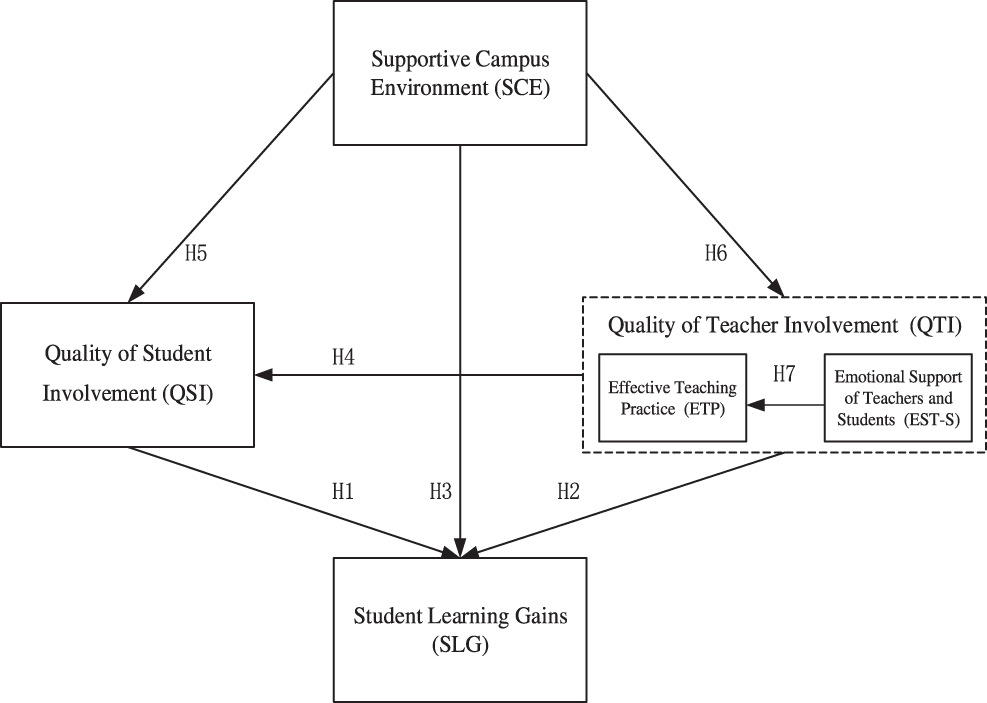
Figure 2: The hypothesis model
H1: The quality of student involvement is positively related to student learning gains.
H2: The quality of teacher involvement includes two factors, effective teaching practice and the emotional support of teachers and students, which are positively related to students’ learning gains.
H3: Supportive campus environment is positively related to student learning gains.
H4: From the perspective of the quality of teacher involvement, the effective teaching practice and emotional support of teachers and students are positively related to the quality of learning involvement, thereby increasing student learning gains.
H5: Supportive campus environments have a positive effect on the quality of learning involvement, thereby increasing students’ learning gains.
H6: Supportive campus environments can improve the quality of teacher involvement, which has a positive effect on effective teaching practice and emotional support for teachers and students.
H7: Regarding the quality of teacher involvement, the better the emotion between teachers and students, the more conducive it is to developing effective teaching practice.
This study used the Chinese College Student Survey (CCSS) as a survey tool. The CCSS was developed by Tsinghua University in 2009 on the basis of the NSSE to track and investigate the learning and development of Chinese college students. In the questionnaire design, the CCSS adopted a Likert scale, which was convenient for quantifying the original information obtained and converting it into measurable digital information. The questions were divided into three categories according to the type of option: four-point scale, five-point scale, and seven-point scale. To normalize the data, the results of the questionnaire were recorded using a percentage system and the max-min standardization was used for the follow-up research.
Structural equation model (SEM) was used in this study. SEM includes a measurement model and a structural model (see Fig. 3). The measurement model mainly carries out a factor analysis to investigate the supporting relationship between the latent variables and observed variables. Its elements include latent, observed, and error variables. The structural model mainly conducts a path analysis to investigate the internal influence relationships of the latent variables. Its elements include latent variables and the residual term of structural equations [14].
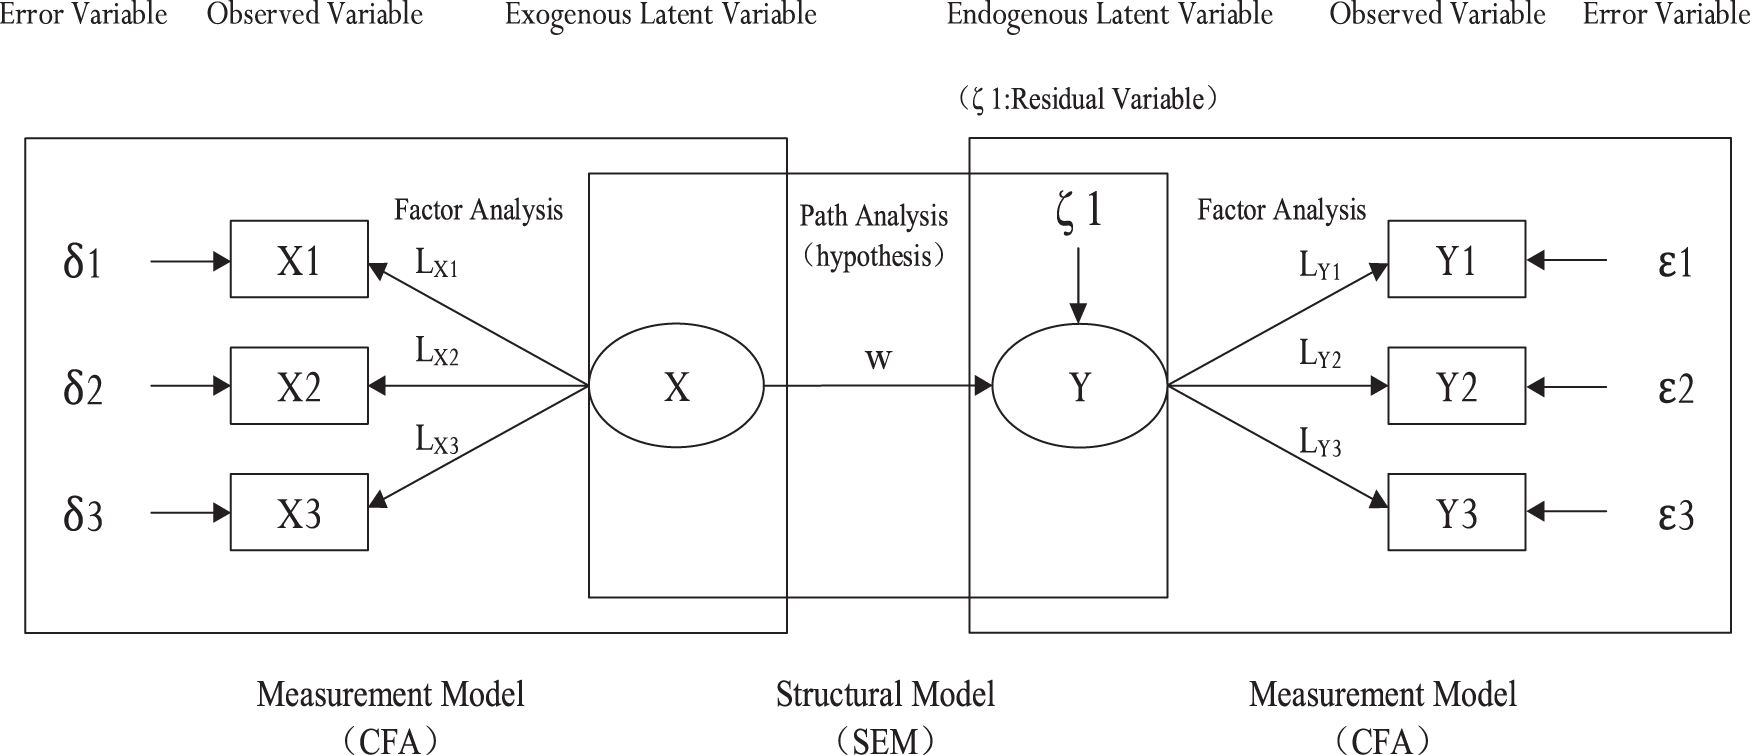
Figure 3: Relationship between measurement model and structural model
The measurement model can usually be expressed as follows:
where
The structural model can usually be expressed as follows:
where Y is an endogenous latent variable,
A SEM-based multivariate analysis is essentially an analysis of the variance model. By comparing the significance of the difference between the hypothetical relationship proposed in the study (the model covariance matrix) and the relationship formed by the actual data collected (the sample covariance matrix), it was judged that the hypothetical relationship reflects the actual situation [15].
AMOS 24.0 software was used in this study, mainly dealing with structural equation model analysis, covariance structure analysis, or causal analysis [16]. SEM provides a maximum-likelihood estimation of the entire system in a hypothesis model and allows for the use of data for the evaluation of variables [17]. This study adopts a two-step strategy to test the hypothesized model. First, the measurement model was confirmed using confirmatory factor analysis (CFA). SEM analysis was then performed to measure the model fit and path coefficients of the hypothesized model.
3.2 Data Collection and Research Sample
According to the latest official data provided by the Institute of Education at Tsinghua University, more than 100 universities participate in the CCSS program each year, obtaining more than 300,000 valid data. This study selected survey data of X universities’ participation in the CCSS from 2018 to 2021. Students of different grades and majors were randomly selected according to the proportion of personnel per year to form the survey sample. The completion of the questionnaire was organized by the college to ensure that students had sufficient time to finish responding and to minimize the poor quality of responses due to time constraints.
After a preliminary descriptive statistical analysis of the samples, this research obtained 12,728 questionnaires over four years. There were 12,181 effective questionnaires, with an effective rate of 95.70%. In the available data, 7,736 students (63.51%) majored in science and engineering; 4,445 students (36.49%) majored in languages, humanities, and social sciences. As shown in Table 1, there were six years of enrollment represented in the four-year survey: 2015 (7.77%), 2016 (9.48%), 2017 (16.42%), 2018 (22.07%), 2019 (21.74%), 2020 (15.91%), and 2021 (6.61%).

3.3 Construction of the Measurement Model
First, each questionnaire topic was treated as an observed variable. The questionnaire items in the CCSS that were weakly related to factors influencing learning gains were eliminated. With reference to the hypotheses, all the contents in the questionnaire that were closely related to student learning gains were retained in principle (69 items in total).
The second step was to classify the reserved observed variables according to a hypothetical model based on the preliminary eliminations. CFA was performed individually on the latent variables. The importance of CFA in social and behavioral sciences is much greater than in building models [18]. A good CFA guarantees the accuracy of the model evaluation and results [19]. The main function of this step was to judge whether the observed variables truly describe the corresponding latent variables, delete the observed variables that do not meet the reliability requirements of the topic, and merge the highly related observed variables to extract higher-level latent variables. After the verification, the number of observed variables decreased from 69 to 43.
The last step was to package any excess observed variables and ensure that the measurement effect of the tool was effective. Each latent variable should have at least three questions, preferably five to seven [20]. Therefore, it was necessary to package the observed variables under QSI and SLG in this study. The main methods of variable packaging include summation and mean methods. Compared with directly deleting redundant observed variables, the variable packaging method ensures that information is not lost. In this study, the results after the mean method obeyed normal distribution patterns, so the model fit was better. After variable packaging, the number of observed variables was merged from 43 to 24, while the actual questionnaire title still referred to 43.
After the above steps, the measurement model can be obtained:
This research used an eleven-item scale to measure the quality of student involvement (QSI). It has multi-item subscales corresponding to five dimensions: (1) participation in class (e.g., “Proactively answer/think about questions in class for which the teacher has no established answers”); (2) preview before class (e.g., “Prepare lectures on a research topic in class”); (3) record the learning process (e.g., “Focus on taking notes in class”); (4) knowledge digestion (e.g., “Ask other students to help you understand the course content”); and (5) summary after class (e.g., “Summarize what you have learned in the course”).
This study adopted a six-item scale to measure effective teaching practice (ETP) as a central component of the level of teaching practice. Sample items include “Clearly explain the course objectives and requirements,” and “Give students a certain degree of autonomy in the teaching process.”
To evaluate the emotional communication between teachers and students, this study used a four-item scale to measure the emotional support of teachers and students (EST-S). Sample items include “Discuss topics, ideas, or concepts in the course with the teacher after class,” and “Discuss issues such as outlook on life and values with the teachers.”
A four-item scale was used to measure the supportive campus environment (SCE). It reflects the support and convenience provided by policies and facilities throughout the learning process. Sample items include “Provide support and services for your physical and mental health (health care, psychological counseling, etc.),” and “Participate in various campus cultural and sports activities (art performances, sports competitions, etc.).”
This research used an eighteen-item scale to measure student learning gains (SLG). It has multi-item subscales corresponding to five dimensions: (1) memory ability (e.g., “Possess profound professional knowledge and skills”); (2) innovative ability (e.g., “Use innovative ideas or methods to solve problems”); (3) analysis ability (e.g., “Independently analyze digital information (numbers, charts, data, etc.) and draw conclusions”); (4) evaluation ability (e.g., “Judge and evaluate the digital information and conclusions put forward by others”); and (5) comprehensive ability (e.g., “Integrate the views learned in different courses when doing homework”).
3.4 Applicability Test of the Measurement Model
The applicability test of the measurement model is the key to ensuring the reliability of quantitative research. It is also an important basis for model design, including the test of reliability and validity. The detection indicators selected in this study were as follows:
Composite reliability (CR) is the composition of the reliability of observed variables, which indicates the internal consistency of all observed variables under a latent variable. A higher CR indicates higher internal consistency of the observed variables [21]. CR can be defined as follows:
where
Average of variance extracted (AVE) calculates the average explanatory power of all observed variables under a latent variable [22]. AVE can be defined as follows:
where
To measure the internal consistency reliability, convergent validity, and discriminant validity of each latent variable in our proposed model, CFA was performed on the five constructs of QSI, ETP, EST-S, SCE, and SLG (see Table 2). The results show that the CR of all latent variables ranges from 0.83 to 0.95, exceeding the 0.60 CR threshold, which indicates that the internal consistency of variables is reliability [21]. In addition, the factor loadings for each item in the model are significant (all p < 0.001), indicating preliminary evidence of the convergent validity of the measurement model. Meanwhile, the AVE of all latent variables ranges from 0.56 to 0.81, exceeding the 0.50 AVE threshold, which indicates that the convergent validity of variables is acceptable [22].

Furthermore, Table 3 shows that the estimated correlations between almost all latent variables are less than the square root of AVE in each structure, with the exception of the fact that the Pearson correlations between QSI and SLH and between EST-S and SLH are slightly larger than the arithmetic square root of their respective AVE (differences of 0.03 and 0.08, respectively). However, the results are still within the acceptable range, which provides initial support for discriminant validity [23].

4 Structural Modeling and Hypothesis Testing
Based on the reliability of the index system, the proposed hypotheses were tested individually and a learning gains influence mechanism model was constructed. The calculation of the standard error in the model is related to the sample size. Larger sample sizes can make the model more accurate for estimating the path coefficient. However, as the sample size increases, the standard error becomes so small that all assumed path coefficients are significant, leading to misjudgment of the results. Therefore, the research randomly selected small samples (N = 848) for the hypothesis test to determine the significance level of the path coefficient and then carried out model verification of full samples (N = 12181).
4.1 Test of the Simple Regression Analysis Model
For H1–H3, this research used a direct impact model of QSI, ETP, EST-S, and SCE on SLG. This can verify the magnitude of the direct impact of each latent variable on student learning gains. Since the effect of this model was equivalent to multiple linear regression, this research called it a simple regression analysis model (see Fig. 4) and performed hypothesis testing. In Fig. 4, e36 refers to the measurement residual of the endogenous latent variable (SLG).
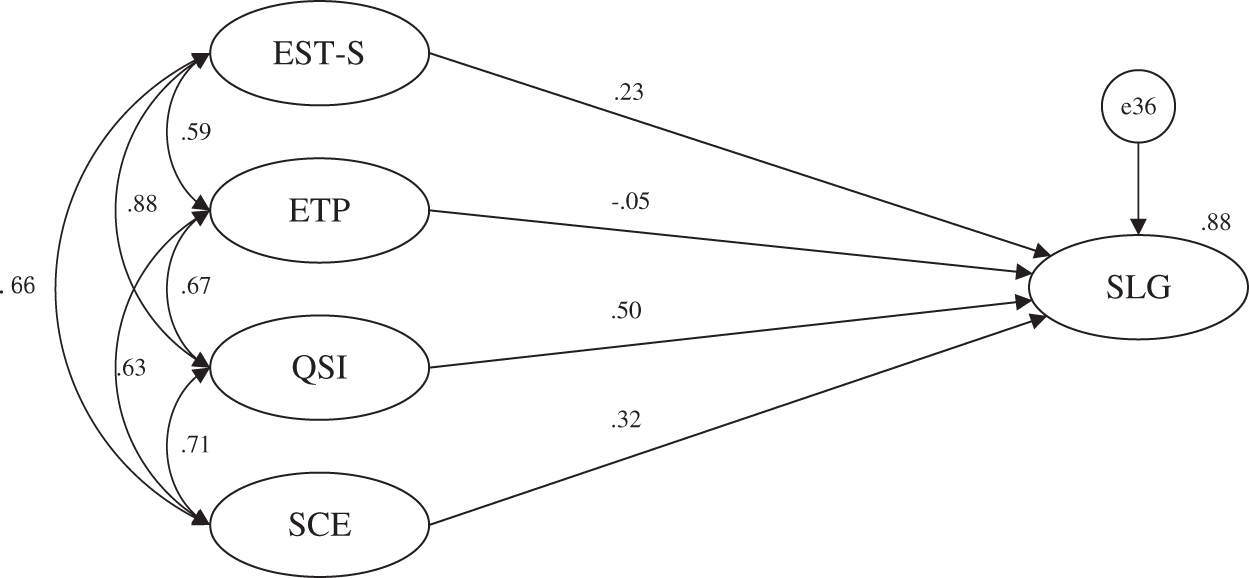
Figure 4: Simple regression analysis model (N = 848)
According to the statistical results in Table 4, QSI, SCE, and EST-S have significant effects on SLG, whereas ETP has no significant effect on SLG. Thus, H1 and H3 are supported, and H2 is partially supported.

4.2 Test of the “XX-QSI–SLG” Mediation Model
It is unreasonable that ETP, as the main means of college education, has no significant influence on learning gains. This is a clue to exploring how ETP affects QSI, which is found to be a key variable. In addition to having a direct impact on learning gains, it also acts as a “bridge” so that various factors related to daily teaching and management can also affect SLG by acting on QSI (see Fig. 5). QSI plays a bridging role in the relationship between teaching and management on learning gain, which is called a mediating effect. In this study, this is called the “XX-QSI-SLG” mediation model. In Fig. 5, e35–36 refer to the measurement residuals of the corresponding endogenous latent variables.
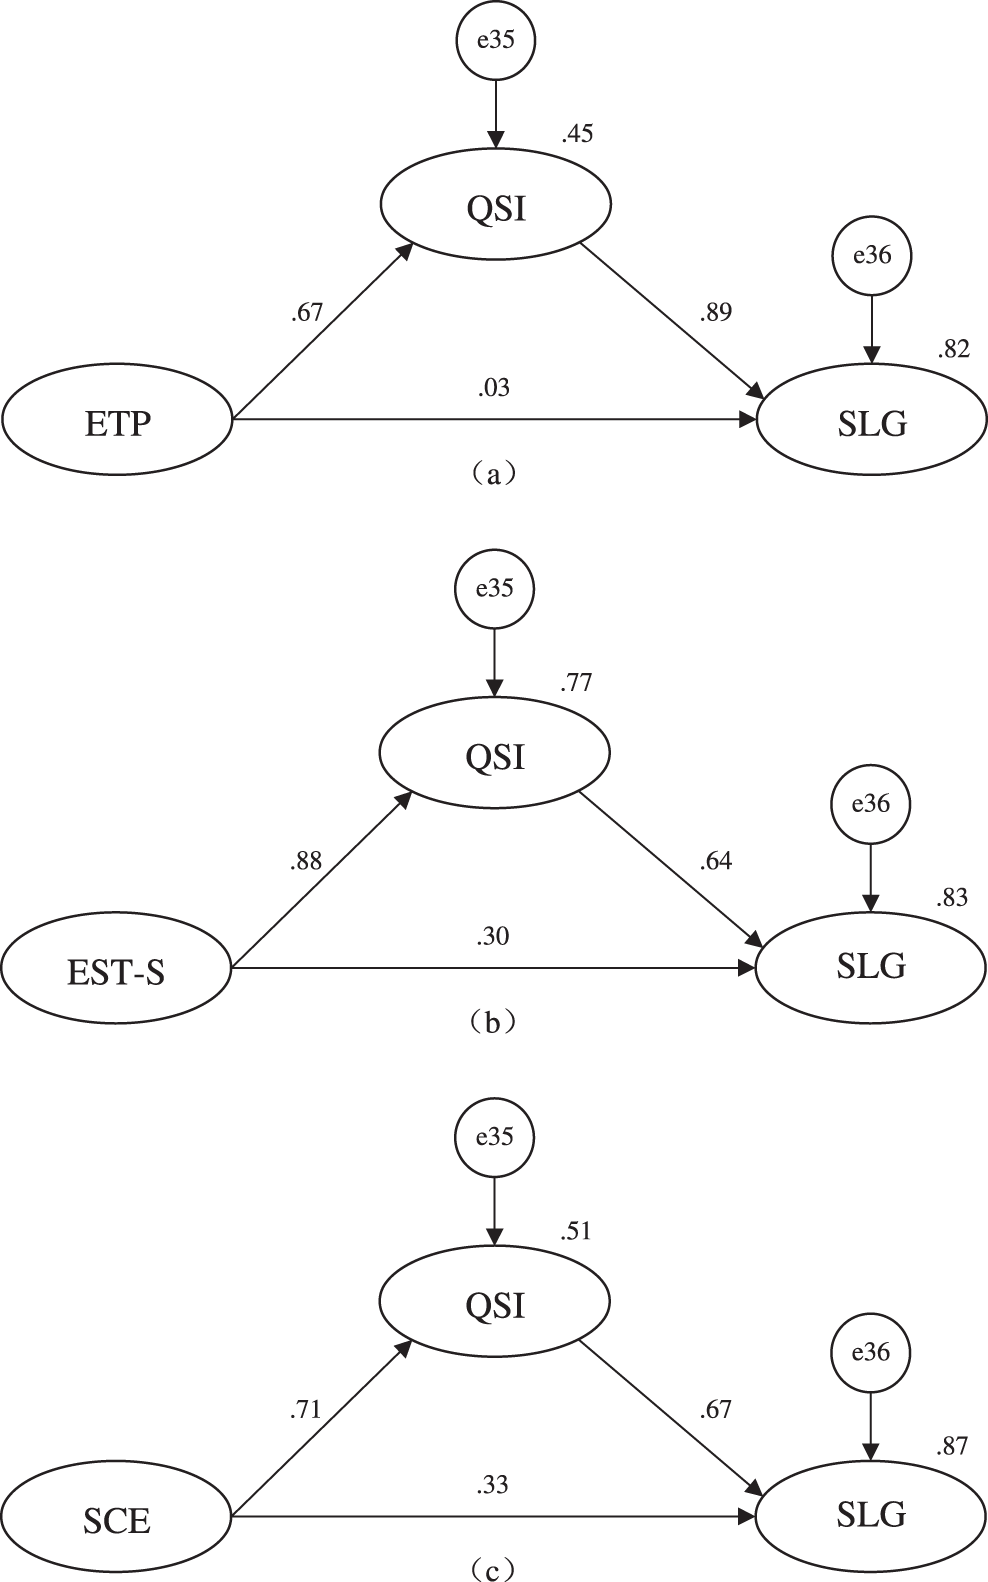
Figure 5: “XX-QSI–SLG” mediation model (N = 848)
In the model analysis, if the independent variable X has an indirect impact on the dependent variable Y through another variable M, it is called a mediating effect, and M is called a mediator (see Fig. 6). Among them, if X only affects Y through M, it is called full mediation; if X directly affects Y and indirectly affects Y through M, it is called partial mediation [24]. The total effect of X on Y is the sum of the direct and indirect effects.
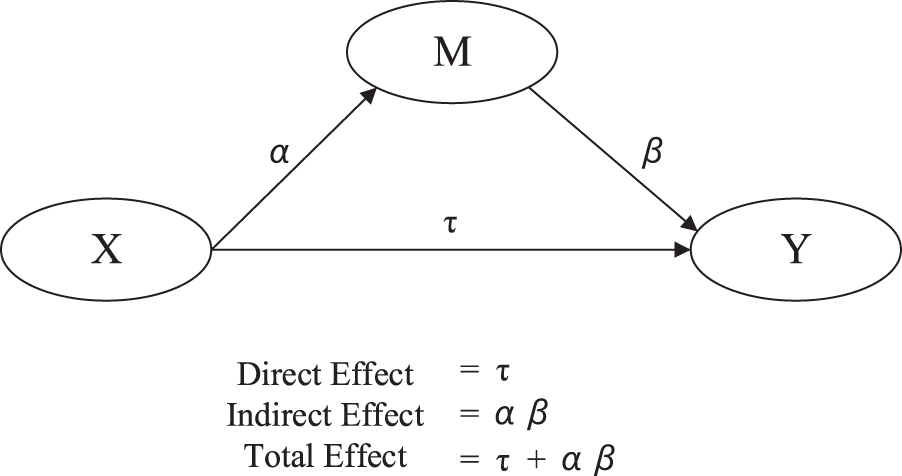
Figure 6: Mediating effect
Three methods are commonly used to test the mediating effects. The causal steps approach sequentially tests the significance levels of the path coefficients α and β. If α is significant and β is significant, there is a mediating effect [25]. However, when the mediating effect is weak, the statistical test power of this method is poor. In follow-up research, some scholars have proposed that if the path coefficients α and β are significant, it cannot be shown that αβ is also significant. Therefore, the product of the coefficients approach (i.e., Sobel Test) is the second method. Since the indirect effect of mediation is the product of the path coefficients α and β, the key to this method is to test the significance level of αβ. If αβ is significant, a mediating effect exists. However, there is still a certain error in the test accuracy of this method; even if the mediating effect does not exist (i.e., αβ = 0), as long as β is significant, a significant mediating effect is obtained [26]. The bootstrap-based confidence interval (CI) approach is the most common and effective testing method. Using bootstrap method to process the original sample can ensure that the data obey the normal distribution more. The estimated mediating effects are arranged from smallest to largest to form a confidence interval of 99% (from the 0.5 Percentile to the 99.5 percentile), which is called Percentile 99% CI. Another modified confidence interval (called Bias-corrected 99% CI) is the translation interval corrected after the estimated value of the mediating effect of the original sample is compared with the value of the 50th percentile. The z-test is a method to test the difference in the mean value using the theory of standard normal distribution for large samples. When the results of the two interval estimates do not contain 0 or the z-value is greater than 1.96, a corresponding impact effect exists [27].
Through analysis of the test methods, the confidence interval approach was adopted to test the mediating effect in this study. Hayes suggested that bootstrapping 5000 times is optimal [28]. It is found that only in the direct effect of ETP on SLG, the bias-corrected 99% confidence interval and the percentile 99% confidence interval contain 0, and the z-value of the product of coefficients is less than 1.96 (see Table 5). Therefore, it is concluded that ETP has no direct effect on SLG and its indirect effect is the total effect. EST-S and SCE have indirect, direct and total effects on SLG. After verification, the results show that QSI plays a full mediation role in the relationship between ETP and SLG. In other words, ETP indirectly affects SLG by affecting QSI. In addition, QSI partially mediates the effects of EST-S and SCE on SLG. The analysis shows that EST-S and SCE affect SLG not only directly, but also indirectly by affecting QSI.

4.3 Test of the Mediation Combination Model
H4 and H5 were added to the construction of the structural model, and the three tested models of “XX-QSI–SLG” were combined (called the Mediation Combination Model, see Fig. 7). It is found that teaching and management factors directly affect SLG on the one hand and indirectly affect SLG through QSI on the other hand. In Fig. 7, e35–36 refer to the measurement residuals of the corresponding endogenous latent variables.
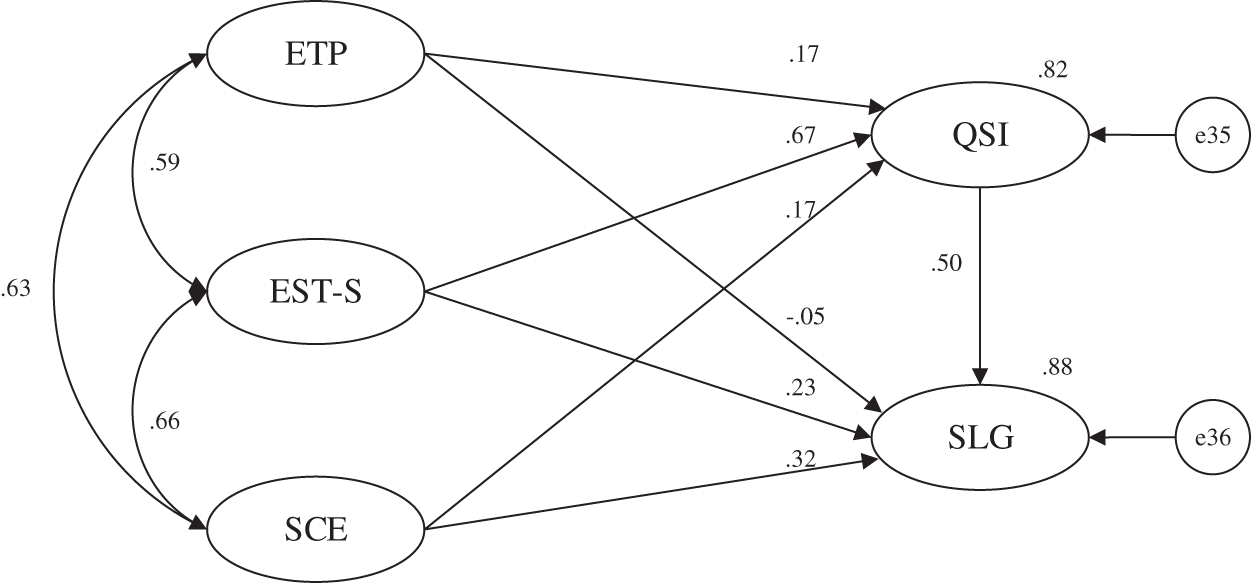
Figure 7: Mediation combination model (N = 848)
According to the test results in Table 6, the mediation combination model still conforms to the original influence rule. SCE and EST-S have a direct effect on SLG. Meanwhile, SCE, EST-S, and ETP all indirectly affect SLG through QSI. The above results show that H4 and H5 are supported.

4.4 Test of the Learning Gains Influence Mechanism Model
To further improve the structural model, this research successively verified whether the resources and environmental support provided by the school, as well as daily management and guidance, had a direct impact on the emotional communication between teachers and students and the teaching practice in the classroom. Simultaneously, in the process of teaching investment, it was verified whether EST-S had a direct impact on ETP. Therefore, H6 and H7 were added to the model for testing (Fig. 8). In Fig. 8, e35–38 refer to the measurement residuals of the corresponding endogenous latent variables.
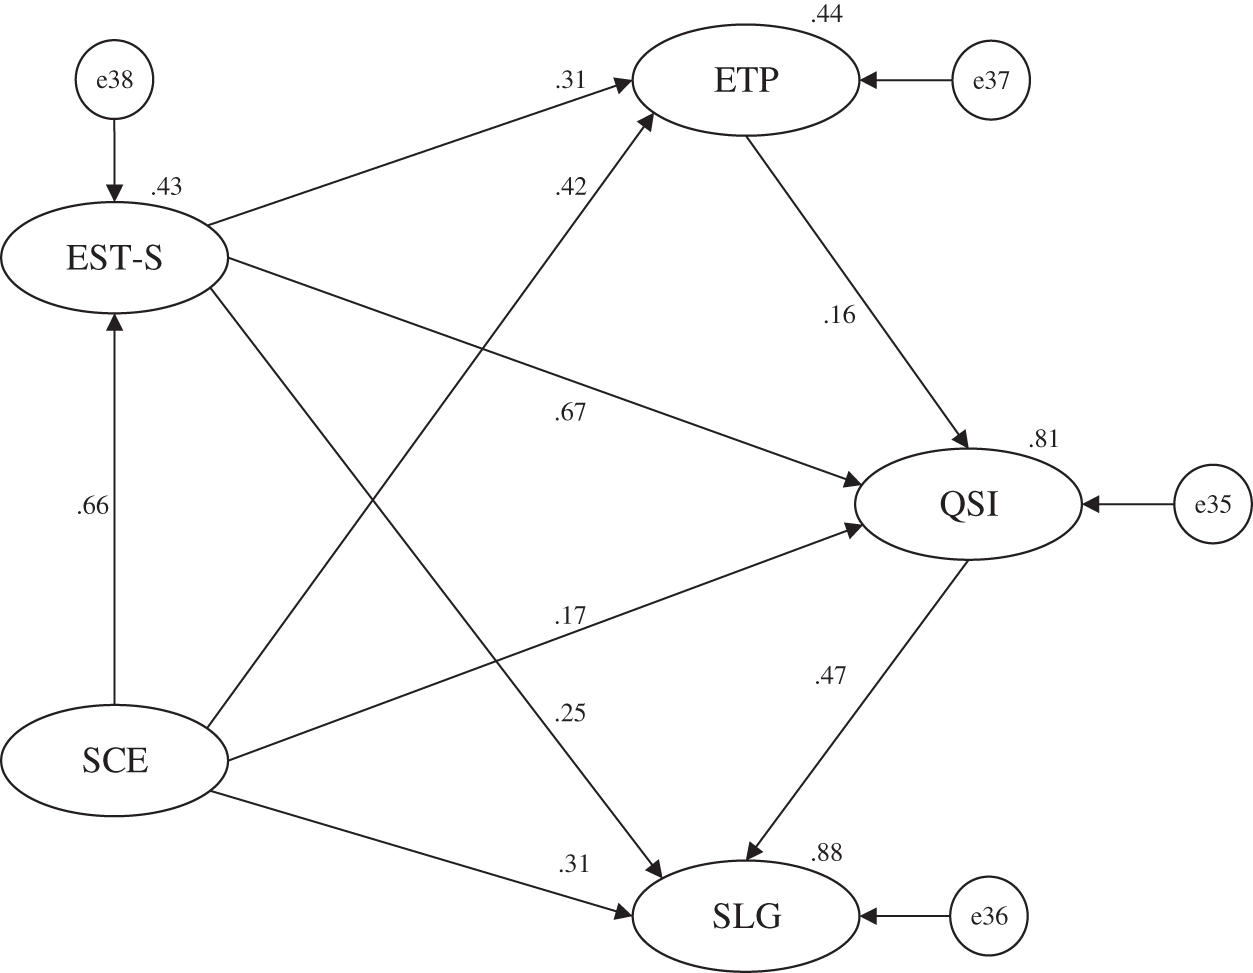
Figure 8: Learning gains influence mechanism model (N = 848)
According to the test results in Table 7, the significance level of the original influence relationship remains valid. In addition, we find that SCE has a significant impact on both EST-S and ETP, and EST-S has a significant internal effect on ETP. Thus, H6 and H7 are supported. School environmental support has a direct impact on teaching investment in two ways. At the same time, it also confirms the direct impact of EST-S on ETP in teaching investment.

After the above four-step model testing process, this research preliminarily constructed the learning gains influence mechanism model in a small sample and verified all the proposed hypotheses. The results show that student investment, teacher investment, and school support are the three key perspectives for analyzing the mechanism of student learning gains and improving the quality of talent cultivation. SCE, EST-S, and QSI have direct effects on SLG, whereas ETP has no significant effect. QSI plays a crucial mediating role in the influence mechanism. In addition to having a direct impact on SLG, QSI also acts as a “bridge” between other variables, indirectly affecting SLG. SCE has a direct impact on two aspects of the teaching investment process (EST-S and ETP). In the process of teaching investment, EST-S has a direct effect on ETP. Therefore, the rationality of the learning gains influence mechanism model was verified using a small sample.
4.5 Test of Structural Model Based on Full Data
To verify the reliability of the learning gains influence mechanism model, the experiment not only carried out the exploration with small samples, but also needed to verify the model with full data (see Fig. 9). This step can check whether the stability of the structural model is sufficient to eliminate misjudgments caused by factors such as data contingency and determine the universal significance of the relationships [29]. In Fig. 9, e35–38 refer to the measurement residuals of the corresponding endogenous latent variables.
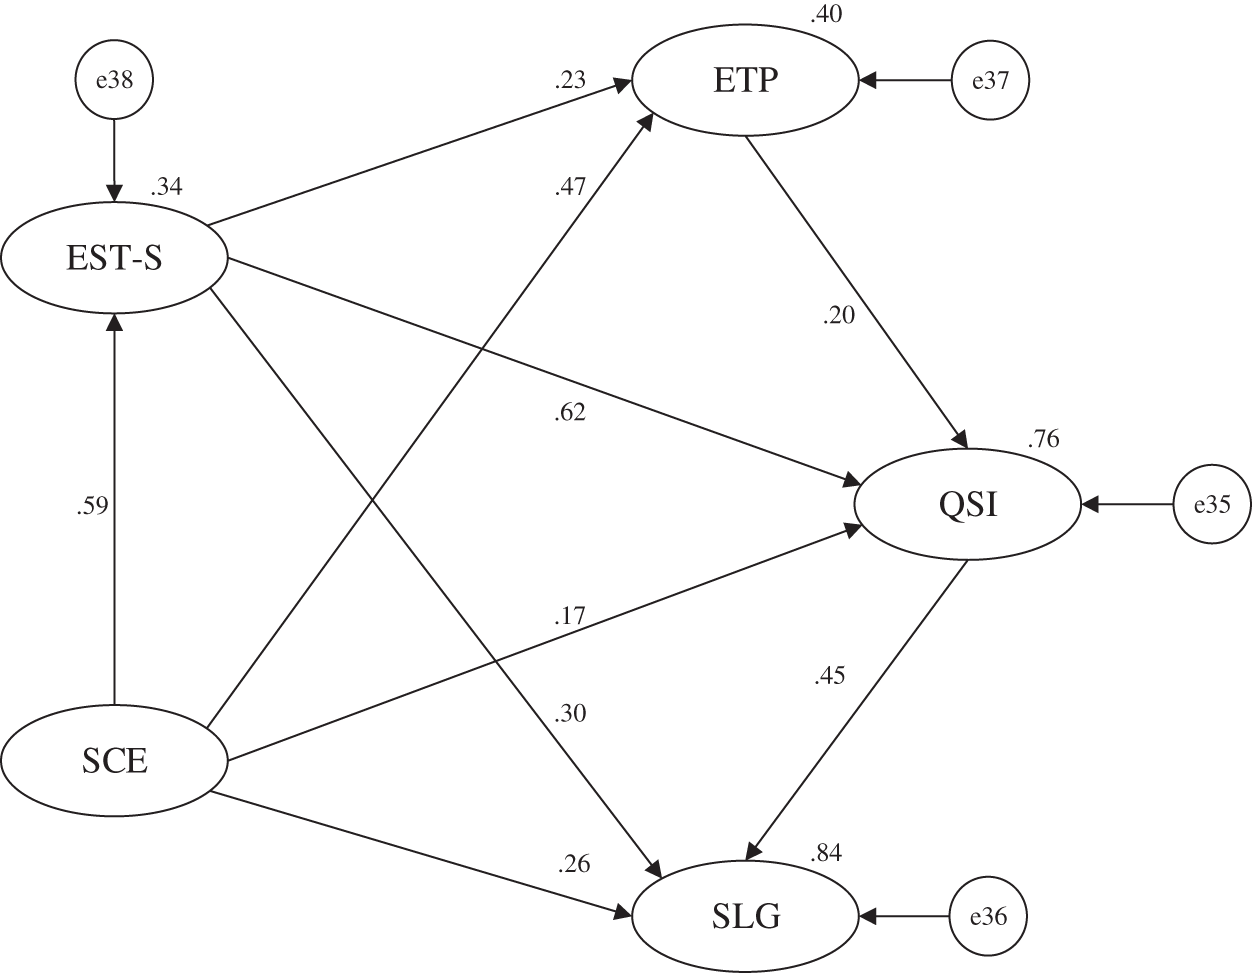
Figure 9: Learning gains influence mechanism model (N = 12181)
The test results in Table 8 show that all the path coefficients of the structural model are significant under the full data and are consistent with the significance level of small samples. The verification results show that the stability of the model is acceptable and universally representative.

Model fit refers to the consistency between the hypothetical overall model and data samples extracted in reality. SEM reflects the fitting of the model to practical problems by comparing the difference between the sample covariance matrix and model covariance matrix. The comprehensive index used to represent the overall difference between the two matrices is called the fit index. A good fit index has the following characteristics: first, the index size is unrelated to the sample size; second, the fit index can avoid too many model parameters, resulting in too complicated model; third, the fit index can sensitively provide poor fitting feedback to inappropriate hypothesis models [30]. Therefore, this study selected the following overall fit indices.
The goodness-of-fit index (GFI) indicates the similarity between the constructed model and the sample data, that is, the proportion of model covariance to explain sample covariance. GFI is between 0 and 1, and the value increases with increasing sample size. It is recommended that the value of GFI above 0.8 is acceptable, and above 0.9 is ideal. The adjusted goodness-of-fit index (AGFI) mainly adjusts the GFI according to the degree of freedom, partially eliminating the impact of sample size on the index. However, it will still increase with increasing sample size. The AGFI values ranged from 0 to 1. The closer the value is to 1, the better is the fitting degree. It is suggested that the value of AGFI above 0.8 is acceptable, and above 0.9 is ideal [31].
The root mean square error of approximation (RMSEA) combines the effects of dispersion tendency and degrees of freedom, so it is less affected by the sample size. Simultaneously, RMSEA is highly sensitive to the measurement error of the model and limits the complexity of the model. Currently, this is considered an important fitting index. It is suggested that the value of RMSEA below 0.08 is acceptable and below 0.05 is ideal [32].
The non-normed fit index (NNFI) is hardly affected by sample size, and the complexity of the model is considered. The value of NNFI is mostly between 0 and 1 and may be greater than 1. It is suggested that the value of NNFI above 0.9 is acceptable [33].
The comparative fit index (CFI) reflects the difference between the hypothetical model and the actual sample and also considers the discreteness of the hypothetical model and the central chi-square distribution. It is suggested that the value of CFI exceeding 0.9 is acceptable [34].
The learning gains influence mechanism model was verified under full data, and the fitting degree of the model was obtained (see Table 9). It is usually meaningful to test the fitting degree for identified models (including exactly identified and overidentified models). After testing, the degree of freedom of the learning gains influence mechanism model is 243. It indicates that the sample moment is larger than the number of estimated parameters and that the model is overidentified. The result is in accordance with the requirement of a positive-definite model. On this basis, the fitting degree can be analyzed. The chi-square value is susceptible to the systematic influence of the sample size. The total number of samples used in this study is 12,181, and the chi-square value of the model is 16,250.103. The large chi-square value is caused by the large sample size. GFI and AGFI of the model are above 0.8 and close to 0.9. RMSEA is between 0.05 and 0.08. NNFI and CFI values are greater than 0.9.

The above analysis shows that the learning gains influence mechanism model has a good fitting degree. The model is credible and generally reflects the reality of the college student learning gains process.
After the above analysis, this study tested the significance level of all paths and the fit indices of the model. This section presented an in-depth analysis of the effect of each latent variable on the mechanism influencing learning gains.
Through structural modeling and hypothesis testing, the learning gains influence mechanism model was developed. After model fit analysis, this study found that the model had a good overall fitting degree, and that each hypothesis path was significant. To further explore the influence relationship among the latent variables in the model, path analysis under normalization was required to account for the degree of explanation and influence patterns of specific endogenous latent variables in the model.
In SEM analysis, R2 represents squared multiple correlations, reflecting the proportion of all dependent variable correlations explained by independent variables in multivariate statistics [35]. AMOS computes the squared multiple correlation for each endogenous latent variable using the following formula:
where
When the R2 of endogenous latent variables in the model reaches 0.19, it indicates that the interpretive ability of variables is weak, 0.33 indicates that the interpretive ability is medium, and 0.67 indicates that the interpretive ability is strong [36]. Through the test results of the learning gains influence mechanism model under full data, this study obtained the R2 of each endogenous latent variable of the model as shown in Table 10.
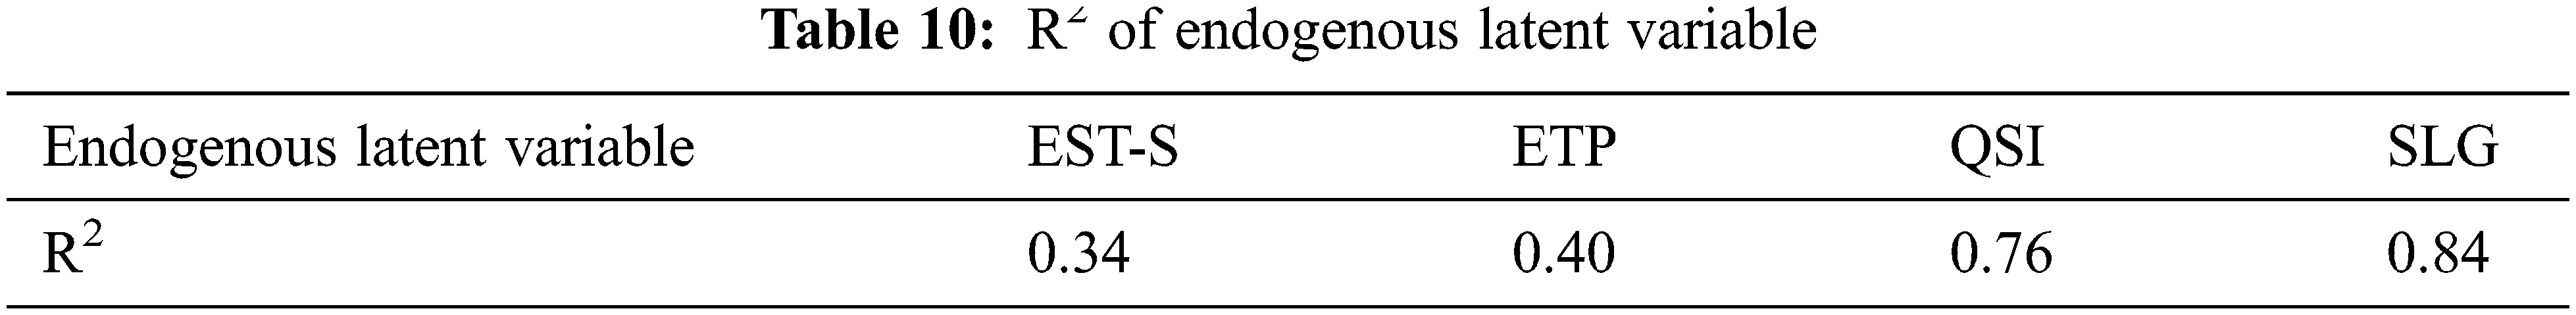
SCE, EST-S, ETP, and QSI reflect 84% of the variation in SLG, indicating a strong ability to explain this variable (see Table 10). Based on the results in Table 11, it can be concluded that the direct effects on SLG under standardization include SCE, EST-S, and EST-S. Among them, QSI has the largest direct effect on SLG. Moreover, SCE, EST-S, and ETP have an indirect effect on SLG. SCE has the largest indirect effect, while ETP has the smallest indirect effect and no direct effect. In summary, ETP (39.3%) has the largest total effect on SLG, which is mainly reflected by the indirect effect of mediating variables such as QSI, EST-S, and ETP. The total effect of EST-S (32.1%) on SLG is second largest. Among them, the direct and indirect effects are approximately half, and the indirect effect is mainly realized through the mediator (QSI). The third variable in the total effect of SLG is QSI (23.8%), whose effect is generated solely through a direct effect. Finally, ETP (4.8%) has the smallest effect on SLG, ranking fourth.

The above analysis shows that the supportive campus environment has the most significant impact on student learning gains. Therefore, from the perspective of school management, providing more convenient policies and favorable resources is the most effective way to help students learn. Quality of student involvement has the largest direct effect on student learning gains and is the most important mediator. The emotional support of teachers and students and the supportive campus environment both indirectly affect student learning gains, mainly by affecting the quality of student involvement. This shows that improving the quality of student involvement is the most important and direct way to help students learn. In addition, effective teaching practice can only indirectly increase student learning gains by improving the quality of student involvement, and cannot directly affect it.
Similarly, it is shown that SCE, EST-S, and ETP in the model explain 76% of the variation in QSI, indicating a strong ability to explain this variable (see Table 10). Based on the results in Table 12, the factors that have a direct impact on QSI under normalization are SCE, EST-S, and ETP. The direct effect of ETP on QSI is dominant. SCE and EST-S have indirect effects on QSI, with SCE having the most significant indirect effect. In terms of the total effect, EST-S (43.7%) has the largest effect on QSI, mainly through a direct effect. The second factor influencing QSI is SCE (43.1%), which indirectly affects QSI by affecting EST-S. ETP (13.2%) is the least influential factor on QSI and only has a direct effect.

Through the above analysis, it can be concluded that there is a significant difference between teaching and education in improving the quality of student involvement in colleges. In contrast, classroom teaching behavior has a smaller impact on improving the quality of student involvement, while investing more emotion in the teaching process has a greater impact on improving the quality of student involvement. This shows that stimulating students’ enthusiasm for active learning is more important than improving the teaching mode. On the basis of ensuring the teaching form and content, universities should pay more attention to the interaction with students in class and after class, so as to truly implement the transformation of education from “teaching” to “learning”. Therefore, it can be concluded that establishing good emotional communication between teachers and students is the most direct and effective way to improve the quality of student involvement. In addition, the supportive campus environment plays an important role.
Likewise, the study shows that the model explains 34% of EST-S and 40% of ETP (see Table 10). This indicates that the explanatory ability of the model for the two variables of teaching engagement is moderate. Based on the results in Table 13, SCE has the largest direct effect on EST-S and ETP. The direct effect of EST-S on ETP is relatively small. SCE also has an indirect effect on ETP. In terms of total effect, SCE plays a dominant role in the impact of EST-S and ETP.

Teachers can improve the quality of teaching investment by enhancing the emotional support and providing more effective teaching practice. From the above analysis, it can be concluded that providing more abundant educational resources, environment and policy support for universities is the most direct and effective way to improve teacher-student emotional interaction and teaching practice. For universities, school management decisions play a very important role in ensuring the scientific and orderly progress of daily teaching, contributing to the emotional interaction between teachers and students inside and outside the classroom, and improving the overall teaching quality.
This study focused on the influencing mechanism of student learning gains. It selected and restructured the observed variables in the CCSS and constructed an index system. The applicability and stability of the index system were satisfactory. On this basis, this study established a QSI-mediated learning gains influence mechanism model and concluded that the overall fit of the model was good.
This study had some limitations. First, this study lacked in-depth research on the adaptive transformation of the university experience survey. It did not consider the influence of X University’s management characteristics on learning gains. For universities, the influence of school culture and educational philosophy on students is an important factor in determining the quality of school management. Second, all the data used in this study were collected from X University only. There was no horizontal comparison of the analysis results, and the data structure was not sufficiently rich enough, which also contributed to the limitation of the study to some extent. In addition, the survey data used in the study included private data from teachers and students, reflecting their personal habits in teaching and learning. Protecting data security to reassure teachers and students, inviting more people to participate in surveys and encouraging them to provide more authentic personal data are important efforts to improve the reliability of research.
Future research could improve the existing questionnaires and adapt them according to the characteristics of X University. Combined with student values and future development characteristics, the content of the original questionnaire can be optimized based on CCSS to develop an effective evaluation tool suitable for evaluating the educational quality of X University. It will have a broad application prospect for evaluating the quality of university education to carry out research around the university experience survey. Future research can be carried out by constructing a multi-institution, large samples, horizontal comparisons and vertical development research system. Simultaneously, the effective introduction of data privacy protection technology to conduct research on students’ and teachers’ behaviors will greatly improve reliability of the data and stability of the model. Therefore, the influence mechanism of learning gains based on SEM can be further studied to provide a decision-making foundation for scientific management of universities.
Funding Statement: This work was supported by the Education Department of Henan, China. The fund was obtained from the general project of the 14th Plan of Education Science of Henan Province in 2021 (No. 2021YB0037).
Conflicts of Interest: The authors declare that they have no conflicts of interest regarding this study.
References
1. D. G. Wu, “Exploring the ‘Chinese road’ of higher education popularization,” China Higher Education Research, vol. 330, no. 2, pp. 4–9, 2021. [Google Scholar]
2. J. Evans, “Social computing unhinged,” Journal of Social Computing, vol. 1, no. 1, pp. 1–13, 2020. [Google Scholar]
3. F. T. Wu and Q. Zhang, “Learning behavioral engagement: Definition, analysis framework and theoretical model,” China Educational Technology, vol. 372, no. 1, pp. 35–41, 2018. [Google Scholar]
4. Y. M. Feng and Y. Li, “Criticism on bloom’s taxonomy of educational objectives,” Journal of East China Normal University(Educational Sciences), vol. 37, no. 2, pp. 63–72, 2019. [Google Scholar]
5. W. Chen, “Reliability and validity analysis of CSEQ and its inspiration,” University Education, vol. 116, no. 2, pp. 191–195, 2020. [Google Scholar]
6. Q. Long and J. Ni, “A review of college impact models in the United States,” Fudan Education Forum, vol. 350, no. 5, pp. 47–54, 2015. [Google Scholar]
7. T. T. Patrick, W. Bao and Y. Huang, “Missing the forest for the trees: Rethinking the influences on student learning in the United States,” Peking University Education Review, vol. 16, no. 1, pp. 72–84, 2018. [Google Scholar]
8. L. L. Li, “Unveiling the ‘Black box’ of higher education: The development of college students from the perspective of student engagement,” Heilongjiang Researches on Higher Education, vol. 39, no. 5, pp. 1–6, 2021. [Google Scholar]
9. D. B. Mccabe and M. L. Meuter, “A student view of technology in the classroom does it enhance the seven principles of good practice in undergraduate education?” Journal of Marketing Education, vol. 33, no. 2, pp. 149–159, 2011. [Google Scholar]
10. S. H. Defi and Y. Heri, “Vocational high school (SMK) students accounting competence prediction model by using astin I-E-O model,” Dinamika Pendidikan, vol. 12, no. 2, pp. 98–113, 2018. [Google Scholar]
11. X. Li and M. Alexander, “Framework construction for student engagement assessment: Interview with professor alexander McCormick, director of national survey of student engagement in the USA,” Journal of China Examinations, vol. 152, no. 6, pp. 86–93, 2021. [Google Scholar]
12. J. Liu, “A review of the theories related to college student departure,” Comparative Education Review, vol. 36, no. 5, pp. 84–89, 2014. [Google Scholar]
13. S. G. Wei, M. Chen, J. C. Zhang and H. D. Lei, “The theoretical basis, the questionnaire framework and the reliability and validity of the student survey of learning and development,” Research in Higher Education of Engineering, vol. 2, no. 3, pp. 114–120, 2015. [Google Scholar]
14. D. W. Philip, “Pandemic policymaking,” Journal of Social Computing, vol. 35, no. 1, pp. 14–26, 2021. [Google Scholar]
15. H. Z. Qiu and B. F. Lin, “Components of a structural equation model,” in Principles and Applications of Structural Equation Model, 2nd ed., vol. 1. Beijing, China: China Light Industry Press, pp. 25–38, 2019. [Google Scholar]
16. F. F. Guo and J. H. Shi, “Study on the relationship between curriculum-based assessment and undergraduate learning of academic disciplines,” Journal of Higher Education, vol. 324, no. 5, pp. 63–70, 2014. [Google Scholar]
17. J. X. You, C. L. Wang, T. Mirzaei and H. P. Gong, “Online interaction mechanism based on structural equation model,” Journal of Tongji University (Natural Science), vol. 48, no. 5, pp. 764–770, 2020. [Google Scholar]
18. D. Volkan, T. Selcuk, S. Florentin and B. Said, “Using sieve of eratosthenes for the factor analysis of neutrosophic form of the five facet mindfulness questionnaire as an alternative confirmatory factor analysis,” CMES-Computer Modeling in Engineering & Sciences, vol. 129, no. 2, pp. 953–971, 2021. [Google Scholar]
19. X. Y. Tian, C. J. Zheng, S. Y. Guo and G. R. He, “Various reliability coefficient methods under multilevel confirmatory factor analysis,” Psychological Exploration, vol. 39, no. 5, pp. 461–467, 2019. [Google Scholar]
20. S. L. Li and Y. Zhang, “Research on deep learning measurement model based on factor analysis,” Educational Science Research, vol. 405, no. 3, pp. 58–63, 2022. [Google Scholar]
21. L. P. Lin, W. X. Liu and Z. Y. Lin, “Reliability and validity evaluation of the internet population quality of life scale based on PLS-SEM,” Chinese Journal of Health Statistics, vol. 37, no. 6, pp. 866–869, 2020. [Google Scholar]
22. Y. Zhang, W. Mo, Y. Zhang, H. R. Gao, N. Li et al., “Development and application of Chinese pupils’ computational thinking scale,” China Educational Technology, no. 10, pp. 49–57, 2020. [Google Scholar]
23. Y. Wang and J. Cai, “Organizational resilience scale development and its reliability and validity verification,” Statistics & Decision, vol. 35, no. 5, pp. 178–181, 2019. [Google Scholar]
24. Z. L. Wen, J. Fang, J. Y. Xie and J. Y. Ouyang, “Methodological research on mediation effects in China’s mainland,” Advances in Psychological Science, vol. 30, no. 8, pp. 1692–1702, 2022. [Google Scholar]
25. S. Wang, D. L. Hou, Y. X. Guo and L. Dai, “The mediation effect of innovation in the domestic and international economic development circulation,” Technology Analysis & Strategic Management, vol. 34, pp. 1–13, 2022. [Google Scholar]
26. Z. Wang, A. Buu, D. K. Lohrmann, P. C. Shih and H. C. Lin, “The role of family conflict in mediating impulsivity to early substance exposure among preteens,” Addictive Behaviors, vol. 115, pp. 106779, 2021. [Google Scholar] [PubMed]
27. I. J. A. Pesigan and F. C. Shu, “SEM-Based methods to form confidence intervals for indirect effect: Still applicable given nonnormality, under certain conditions,” Frontiers in Psychology, vol. 11, pp. 571928, 2020. [Google Scholar] [PubMed]
28. A. F. Hayes, “Beyond baron and kenny: Statistical mediation analysis in the new millennium,” Communication Monographs, vol. 76, no. 4, pp. 408–420, 2009. [Google Scholar]
29. X. K. Yuan, J. Gu and S. L. Liu, “Sensitivity of sample for simulation-based reliability analysis methods,” CMES-Computer Modeling in Engineering & Sciences, vol. 126, no. 1, pp. 331–357, 2021. [Google Scholar]
30. D. Shi, C. Distefano, A. Maydeu-Olivares and T. Lee, “Evaluating SEM model fit with small degrees of freedom,” Multivariate Behavioral Research, vol. 57, pp. 1–36, 2020. [Google Scholar]
31. K. Wang, Y. Xu, C. L. Wang, M. Tan and P. Y. Chen, “A corrected goodness-of-fit index (CGFI) for model evaluation in structural equation modeling,” Structural Equation Modeling, vol. 27, no. 5, pp. 735–749, 2019. [Google Scholar]
32. C. Gao, D. Shi and A. Maydeu-Olivares, “Estimating the maximum likelihood root mean square error of approximation (RMSEA) with non-normal data: A monte-carlo study,” Structural Equation Modeling, vol. 27, no. 2, pp. 192–201, 2020. [Google Scholar]
33. Y. Y. Xu, J. J. Zheng, W. Xia, Y. Li, G. H. Xu et al., “Functioning evaluation for patients with chronic diseases using world health organization disability assessment schedule 2.0,” Chinese Journal of Rehabilitation Theory and Practice, vol. 25, no. 9, pp. 993–999, 2019. [Google Scholar]
34. X. Zhang and V. Savalei, “Examining the effect of missing data on RMSEA and CFI under normal theory full-information maximum likelihood,” Structural Equation Modeling, vol. 27, no. 2, pp. 1–21, 2019. [Google Scholar]
35. J. L. Y. Kwan and W. Chan, “Comparing squared multiple correlation coefficients using structural equation modeling,” Structural Equation Modeling, vol. 21, no. 2, pp. 225–238, 2014. [Google Scholar]
36. K. L. Forthman, J. M. Colaizzi, H. W. Yeh, R. Kuplicki and M. P. Paulus, “Latent variables quantifying neighborhood characteristics and their associations with poor mental health,” International Journal of Environmental Research and Public Health, vol. 18, no. 3, pp. 1202, 2021. [Google Scholar] [PubMed]
Cite This Article
 Copyright © 2023 The Author(s). Published by Tech Science Press.
This work is licensed under a Creative Commons Attribution 4.0 International License , which permits unrestricted use, distribution, and reproduction in any medium, provided the original work is properly cited.
 Downloads
 Citation Tools