
 Submit a Paper
 Propose a Special lssue
 Open Access
ARTICLE

Enhanced Crow Search with Deep Learning-Based Cyberattack Detection in SDN-IoT Environment
1 Department of Computer and Self Development, Preparatory Year Deanship, Prince Sattam bin Abdulaziz University, AlKharj, Saudi Arabia
2 Department of Computer Sciences, College of Computer and Information Sciences, Princess Nourah Bint Abdulrahman University, P. O. Box 84428, Riyadh, 11671, Saudi Arabia
3 Department of Computer Sciences, College of Computing and Information System, Umm Al-Qura University, Mecca, Saudi Arabia
4 Department of Information Systems, College of Computer and Information Sciences, Princess Nourah Bint Abdulrahman University, P. O. Box 84428, Riyadh, 11671, Saudi Arabia
5 Research Centre, Future University in Egypt, New Cairo, 11845, Egypt
6 Department of Information System, College of Computer Engineering and Sciences, Prince Sattam bin Abdulaziz University, AlKharj, 16436, Saudi Arabia
* Corresponding Author: Abdelwahed Motwakel. Email:
Intelligent Automation & Soft Computing 2023, 36(3), 3157-3173. https://doi.org/10.32604/iasc.2023.034908
Received 31 July 2022; Accepted 14 November 2022; Issue published 15 March 2023
 View Full Text
 Download PDF
Abstract
The paradigm shift towards the Internet of Things (IoT) phenomenon and the rise of edge-computing models provide massive potential for several upcoming IoT applications like smart grid, smart energy, smart home, smart health and smart transportation services. However, it also provides a sequence of novel cyber-security issues. Although IoT networks provide several advantages, the heterogeneous nature of the network and the wide connectivity of the devices make the network easy for cyber-attackers. Cyberattacks result in financial loss and data breaches for organizations and individuals. So, it becomes crucial to secure the IoT environment from such cyberattacks. With this motivation, the current study introduces an effectual Enhanced Crow Search Algorithm with Deep Learning-Driven Cyberattack Detection (ECSADL-CAD) model for the Software-Defined Networking (SDN)-enabled IoT environment. The presented ECSADL-CAD approach aims to identify and classify the cyberattacks in the SDN-enabled IoT environment. To attain this, the ECSADL-CAD model initially pre-processes the data. In the presented ECSADL-CAD model, the Reinforced Deep Belief Network (RDBN) model is employed for attack detection. At last, the ECSA-based hyperparameter tuning process gets executed to boost the overall classification outcomes. A series of simulations were conducted to validate the improved outcomes of the proposed ECSADL-CAD model. The experimental outcomes confirmed the superiority of the proposed ECSADL-CAD model over other existing methodologies.Keywords
The Internet of Things (IoT) network is an interconnected and distributed network of embedded mechanisms that interact via wired or wireless communication technology [1]. It can also be described as a network of physical devices empowered with limited computation, memory and interactions abilities. These abilities are embedded in network connectivity software and electronic devices such as the actuators and the sensors for multiple purposes such as collecting, exchanging and processing the data [2]. The IoT gadgets produce a huge volume of data, due to which the conventional processing, collection and storage methods cannot meet the quality requirements or the customer’s needs. The huge volumes of data are utilized for multiple activities such as predictions, assessments, pattern analyses and behavioural analyses [3]. Moreover, the existing data processing systems find it challenging to handle the heterogeneous data generated by IoT gadgets. So, a need exists to develop novel data processing systems to gain insights from the data produced by IoT devices. Machine Learning (ML) is one of the data processing techniques suitable for evaluating computational patterns and providing embedded intelligence in IoT gadgets [4]. Fig. 1 illustrates the infrastructure of the Software-Defined Networking (SDN) approach.
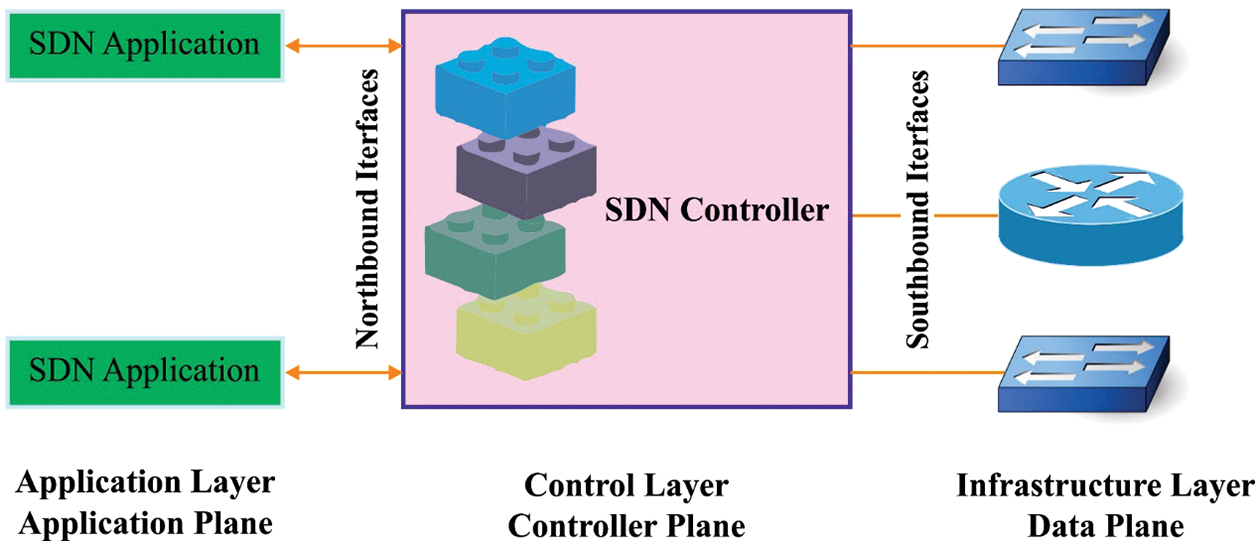
Figure 1: Structure of the SDN architecture
ML techniques help companies and individuals to gain insights from human-generated data using smart devices and a set of relevant machines. It is described as the capability of a smart gadget to automate or change the behaviour or a situation related to the information and is considered to play an important role in IoT solutions [5]. ML methods are utilized in density estimation, classification, and regression tasks. Various applications like malware detection, Computer Vision (CV), bio-informatics, speech recognition, authentication and fraud detection utilize ML techniques [6]. Similarly, it is also used in the IoT platform to offer intelligent services. There is no integrated approach to secure the entire IoT structure. IoT security is an important networking parameter, and the history of cyberattacks imposes a severe need to develop security measures [7]. Currently, the SDN-assisted structure not only improves the heterogeneous capability of the IoT network and its dynamic atmosphere but also provides a chance to ease the network management process [8]. It offers an effective and efficient identification method without exhaustion and a platform for resource-limited gadgets that do not burden a security solution [9]. For SDN surveillance, an optimal technique was proposed by incorporating the Intrusion Detection System (IDS) in SDN architecture. Due to the quick evolution of the Artificial Intelligence (AI) technique that possesses the programmable attributes of the SDN environment, the security stages are enhanced by combining the SDN mechanism into an AI-related security solution [10]. Several AI-related methods are used as network traffic detection techniques, such as Decision Trees (DT), Genetic Algorithms (GA), Fuzzy Logic (FL), Naive Bayesian (NB), k-Nearest Neighbor (KNN) and ANNs with phenomenal accuracy levels and ideal outcomes.
Aslam et al. [11] devised an Adaptive ML-related SDN-assisted Distributed Denial of Service (DDoS) attack Detection and Mitigation (AMLSDM) structure. The presented AMLSDM structure involves the SDN-assisted security system for IoT gadgets with the help of the adaptive ML classification method. This study aimed to achieve an effective detection and mitigation of DDoS assaults. The presented structure used the ML approaches in an adaptive multi-layered feed-forwarding technique to successfully identify the DDoS assaults so as to evaluate the static attributes of the examined network traffic. Alzahrani et al. [12] illustrated the application of an ML technique as an IDS to observe the network traffic and identify the malicious performance in the SDN controller. Traditional tree-related ML approaches were selected and developed to demonstrate the attack detection outcomes.
Dake et al. [13] formulated a novel MADDPG-compiled multi-agent structure in SDN for effective multi-path routing optimization and malevolent DDoS traffic prevention and detection in the networks. Both the MARL negotiators collaborated in a similar atmosphere to accomplish a network optimization task in a short period. Nguyen et al. [14] introduced a new traffic monitoring structure like DeepMonitor for SDN-related IoT networks. This method aimed to provide a finely-grained traffic analysis report for various IoT traffic forms at the network edges. To be specific, the author initially used an intellectual flow rule match-field control scheme named DeepMonitor agent for the SDN-related IoT edges. In this study, the authors considered their maximal flow-table capability and the need for different granularity levels. The author applied the control optimization issue for every edge node by following the Markov Decision Procedure (MDP). Then, the author projected a Double Deep Q-network (DDQN) method to gain an optimum flow rule match-field method.
In the study conducted earlier [15], an SDN-enabled Deep Learning (DL)-driven structure was devised to detect the threats in the IoT atmosphere. The existing Cuda-Deep Neural Network (DNN)-Gated Recurrent Unit (GRU), i.e., Cu-DNNGRU and Cuda-bidirectional LSTM (Cu-BLSTM) methods, were implemented for an effectual threat detection outcome. Ribeiro et al. [16] introduced an anomaly-related technique that employed the ML approaches over continuous data streams for the purpose of identifying intrusions in the SDN-enabled IoT atmosphere. In order to characterize the anomalies, the author examined structure assault, a type of DDoS assault. This attack type considered the effects of resource depletion and bandwidth depletion. Further, these kinds of attacks exert a heavy impact on the complete SDN environment. The other type of attack, i.e., the bandwidth depletion attack, targets the channel between the controller and the switches either by HTTP or UDP flooding protocols.
The current study introduces an effective Enhanced Crow Search Algorithm with Deep Learning-Driven Cyberattack Detection (ECSADL-CAD) model for the SDN-enabled IoT environment. The presented ECSADL-CAD approach aims to identify and classify the cyberattacks in the SDN-enabled IoT environment. To attain this, the proposed ECSADL-CAD model pre-processes the initial data. In the presented ECSADL-CAD model, the Reinforced Deep Belief Network (RDBN) model is employed for attack detection. At last, the ECSA-based hyperparameter tuning process is executed to boost the overall classification outcomes. A series of experiments were conducted to ensure the improved outcomes of the proposed ECSADL-CAD model.
2 The Proposed ECSADL-CAD Model
The current study introduced a new ECSADL-CAD model for attack detection in the SDN-enabled IoT environment. The presented ECSADL-CAD approach aims to identify and classify the cyberattacks in the SDN-enabled IoT environment. To attain this, the proposed ECSADL-CAD model pre-processes the data at the initial stage. In the presented ECSADL-CAD model, the RDBN model is employed for attack detection. At last, the ECSA-based hyperparameter tuning process is executed to boost the overall classification outcomes. Fig. 2 illustrates the overall process of the ECSADL-CAD approach.
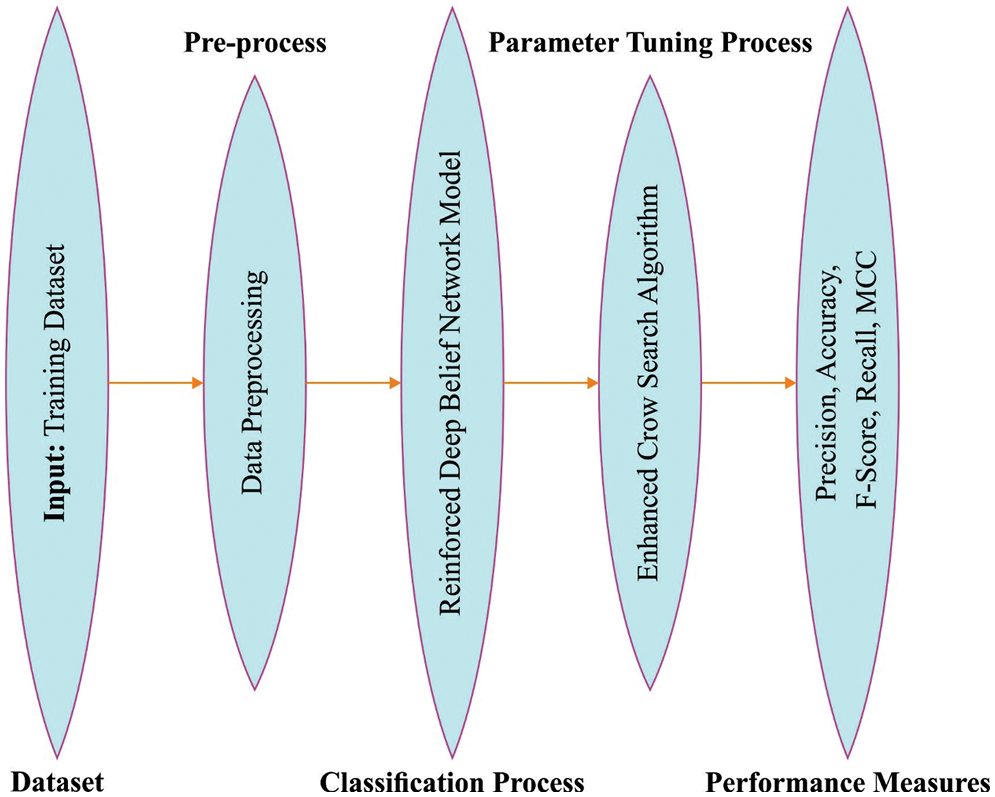
Figure 2: Overall process of the ECSADL-CAD approach
2.1 RDBN-Based Data Classification
In the presented ECSADL-CAD model, the RDBN model is employed for attack detection. Restricted Boltzmann Machine (RBM) is an undirected probability graph method that depends on the energy using the visible layer (VL) and the hidden layer (HL) [17]. The RBM structure is denoted by (a). The VL is comprised of N input parameter,
In Eq. (1), Z refers to the normalization constant.
The energy function is determined as follows.
In Eq. (3),
In this study, the HL input is a binary value, and the VL input v is a real value. Hence, the RBM exploits the Gaussian-Bernoulli method.
Based on the conditional distribution
Now
Here,
The DBN approach has multiple HLs and a two-hidden layer. It represents a combination of the undirected and the directed relations. The two topmost layers are directly connected, whereas the others are directly connected. The
In Eq. (7),
The RDBN training method is the same as that of the DBN approach. The supervised and unsupervised learning methods are integrated into the training method. Initially, the previous training model exploits the unsupervised learning method to attain the primary RBM network parameter. Next, the RL model is incorporated with the trained RBM to establish the reinforced RBM (RRBM). Then, the RRBM contains the stacked RDBN. The supervised learning approach completes the network training process through the labels that are interconnected with the topmost layer using the BP approach.
The weight matrices in the RRBM are trained to complete the representation among its neighbouring layers. In this study, the distribution of the weighted matrix
2.2 ECSA Based Hyperparameter Tuning
The ECSA-based hyperparameter tuning process is executed to boost the overall classification outcomes. The CSA approach has some specific limitations that get reflected in two subsequent features [18]. (1) The population diversity is adapted using
Various CSA techniques are suggested to resolve this limitation. The chaotic CSA method exploits the chaotic searching method’s randomness and ergodicity to enhance its optimization capability. But, in the case of a large space with multi-parameter optimization issues, the chaotic CSA approach experiences a few challenges, for instance, lengthy computation time. Further, it is also incapable of finding the optimum solution. The dynamic CSA approach and an adoptive CSA method upgrade the location dynamically based on the adoptive approach to fit into the iteration variations. In the fuzzy-based CSA approach, the fuzzy concept is presented in the CSA method that accelerates the convergence efficacy to a specific range. The ENCSA approach follows two methods such as the periodic fight migration approach and an adaptive fight step adjustment method. The local development and the global exploration capabilities can be improved via an adaptive fight step adjustment approach. Furthermore, the diversity of the population is also preserved with the help of the periodic fight migration approach to prevent the model from getting trapped in local maxima.
Periodic fight migration strategy
The Migration Frequency (MF) is incorporated by preserving the crow population diversity. Initially, the crows that are judged should migrate. When a crow needs to migrate, the crow flies to another place to search. Once there is no need for a crow to migrate, the crow either follows or searches for others, as shown below:
In Eq. (8), R characterizes an arbitrary value within
The crow’s migration formulation is devised so that the crow group doesn’t transfer to an arbitrary location. However, it follows the crow with an optimum location from the group.
Adaptive fight step adjustment strategy
In this work, the fight distance is a predetermined value. Hence, the searching capability of a crow cannot be modified by increasing the number of iterations. An adoptive fight step size is developed. The searching capability of the crows has altered once the iteration count increases, which is mathematically expressed below.
By expanding the search, the fight step size becomes progressively smaller. Initially, the crow is a large fight step size that makes the crow have a strong global searching ability. Then, the fight step size of the crow becomes small, which in turn makes the crow reinforce the local development ability.
Acceleration search factor
The adaptive searching step can reinforce local development and global searching abilities. The Acceleration Search Coefficient
In Eq. (10),
Initially, the
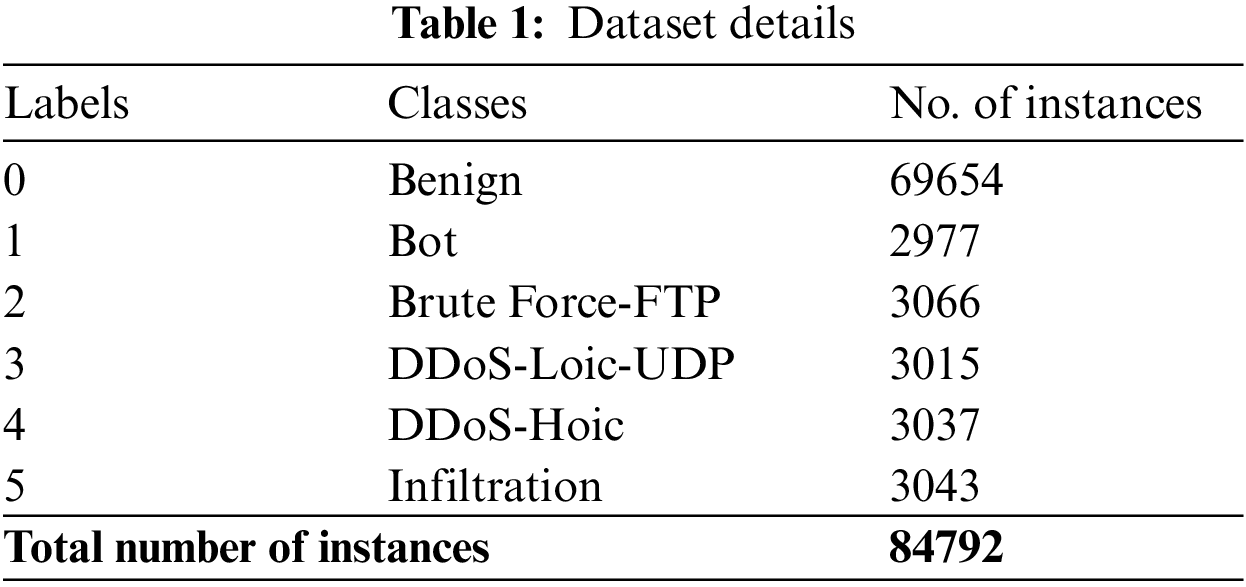
The proposed ECSADL-CAD approach was experimentally validated utilizing the CICIDS-2018 dataset. The test dataset includes a total of 84,792 samples under six class labels, and the details are depicted in Table 1.
The classification outcomes of the proposed ECSADL-CAD model are presented in the form of a confusion matrix in Fig. 3. With the entire dataset, the proposed ECSADL-CAD model categorized 69,047 samples as class 0, 2,865 samples as class 1, 3,020 samples as class 2, 2,956 samples as class 3, 2,946 samples as class 4 and 2,825 samples as class 5. On the other hand, with 70% of the TR dataset, the ECSADL-CAD approach categorized 48,328 samples under class 0, 2,012 samples under class 1, 2,123 samples under class 2, 2,046 samples under class 3, 2,075 samples under class 4 and 1,961 samples under class 5. Moreover, with 30% of the TS dataset, the proposed ECSADL-CAD system categorized 20,719 samples as class 0, 853 samples as class 1, 897 samples as class 2, 910 samples as class 3, 871 samples as class 4 and 864 samples as class 5.
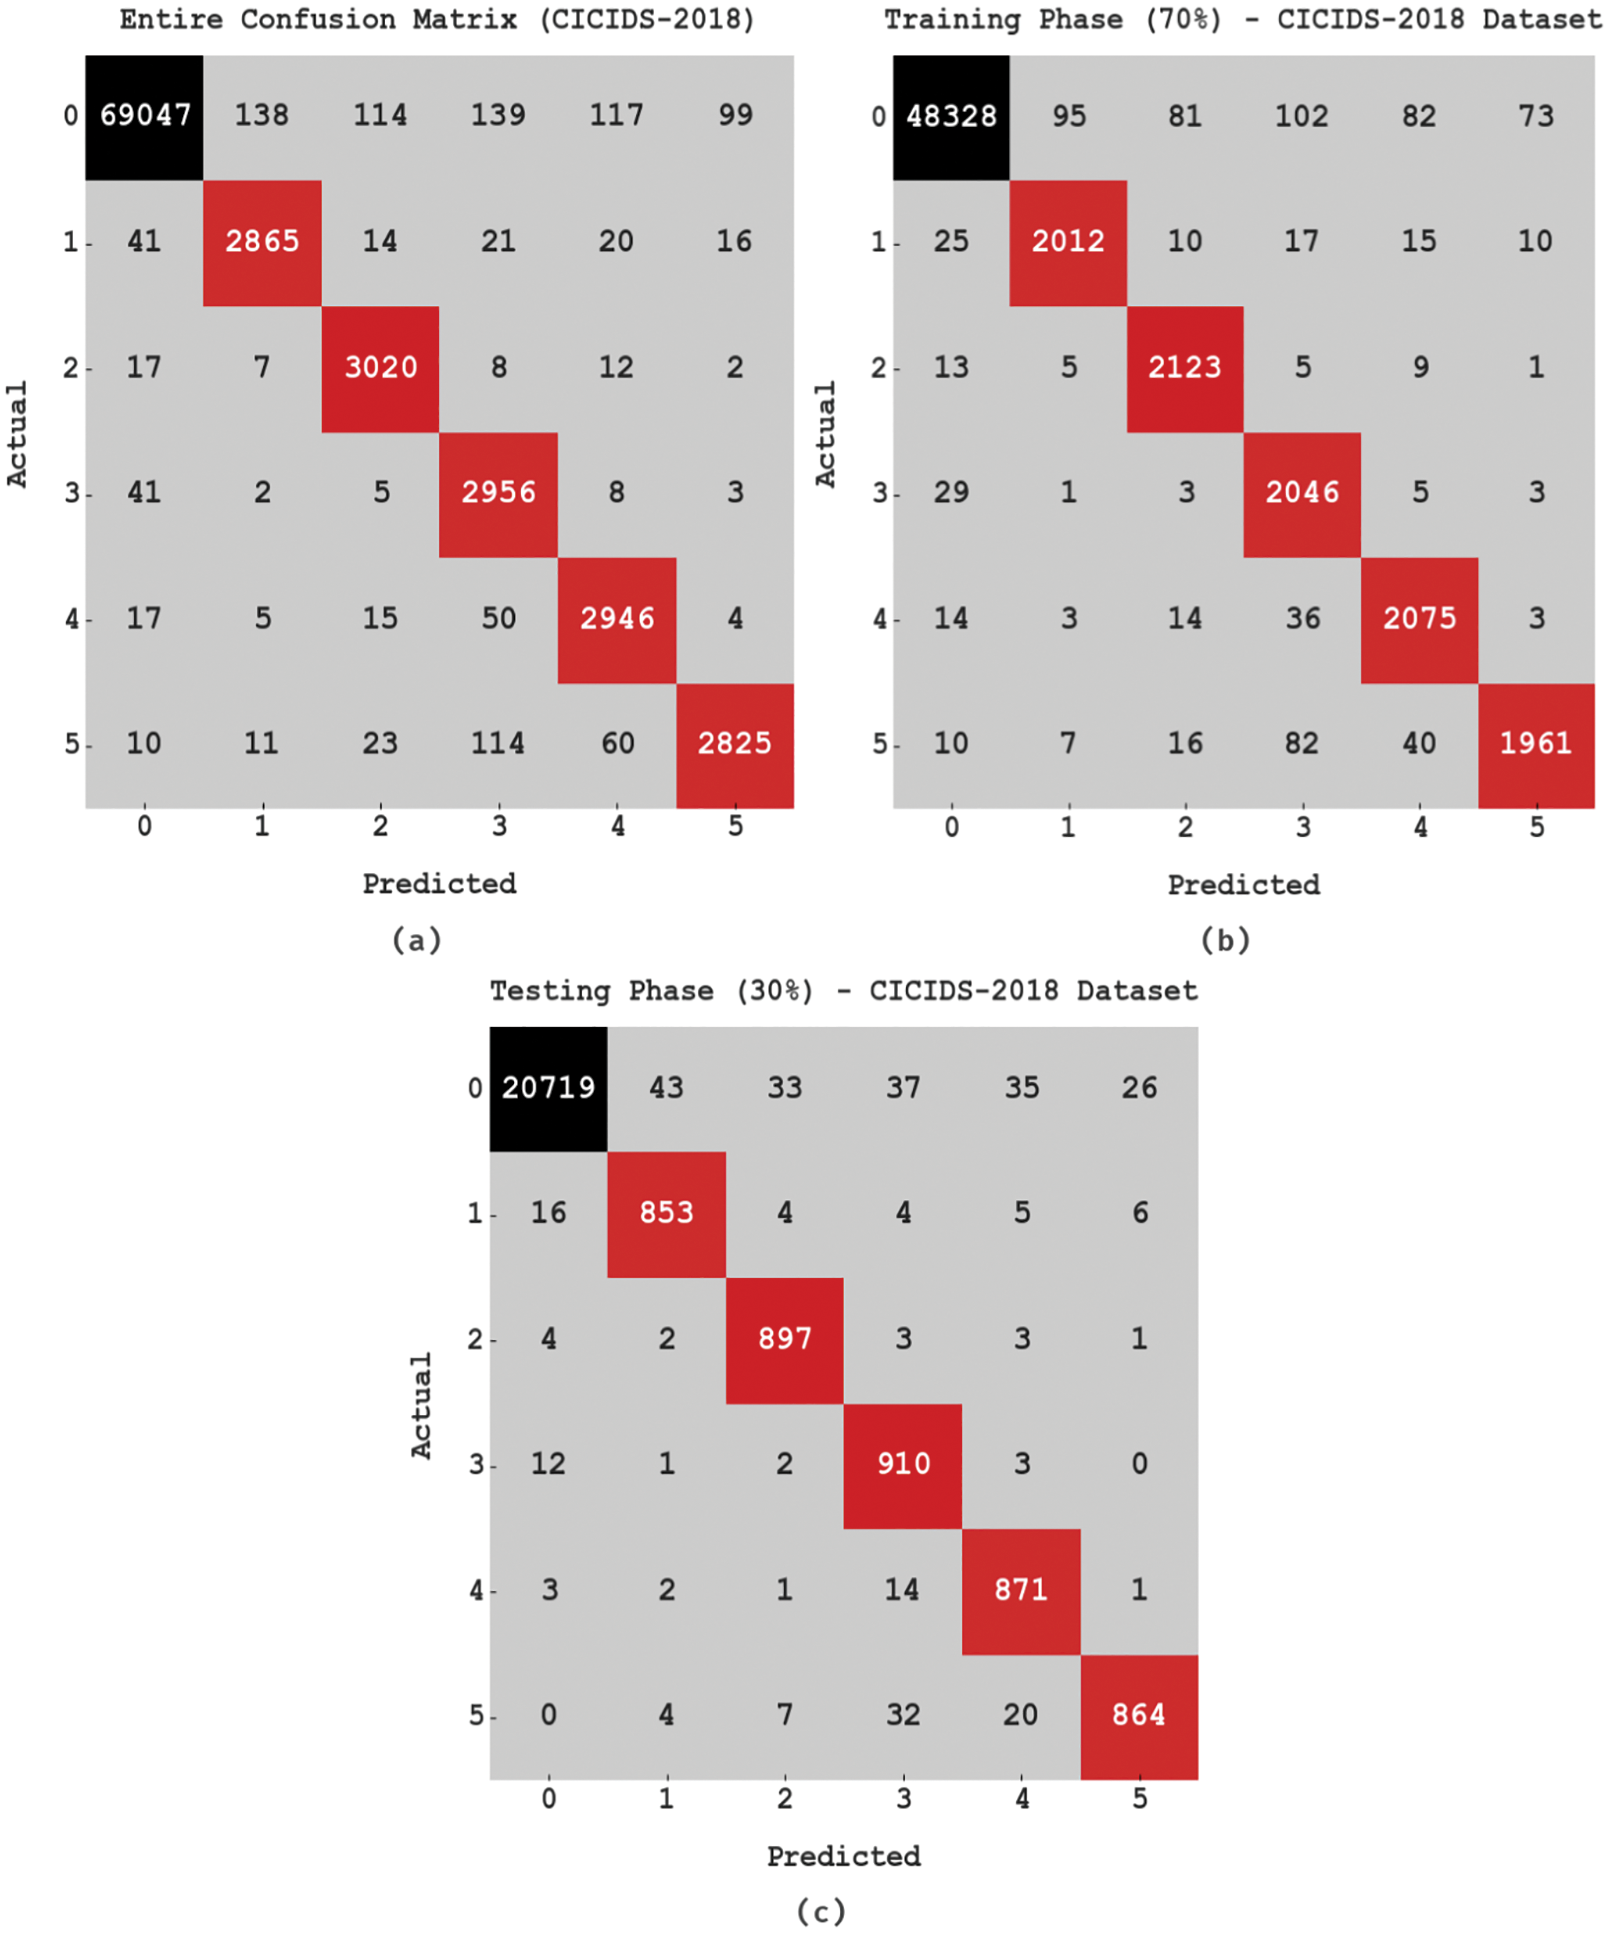
Figure 3: Confusion matrices of the ECSADL-CAD approach (a) Entire dataset, (b) 70% of TR data, and (c) 30% of TS data
Table 2 and Fig. 4 depict the results of the proposed ECSADL-CAD technique on the entire dataset. The ECSADL-CAD method recognized the class 0 samples with
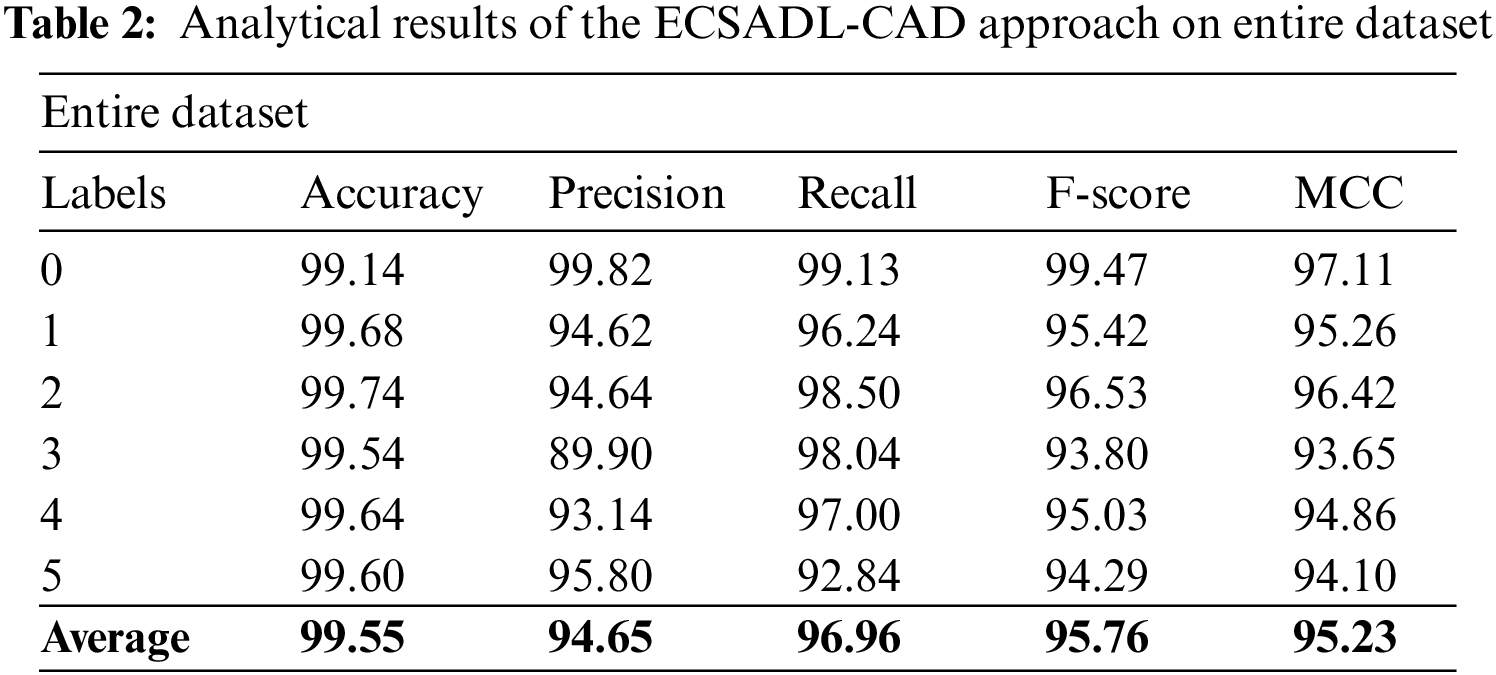
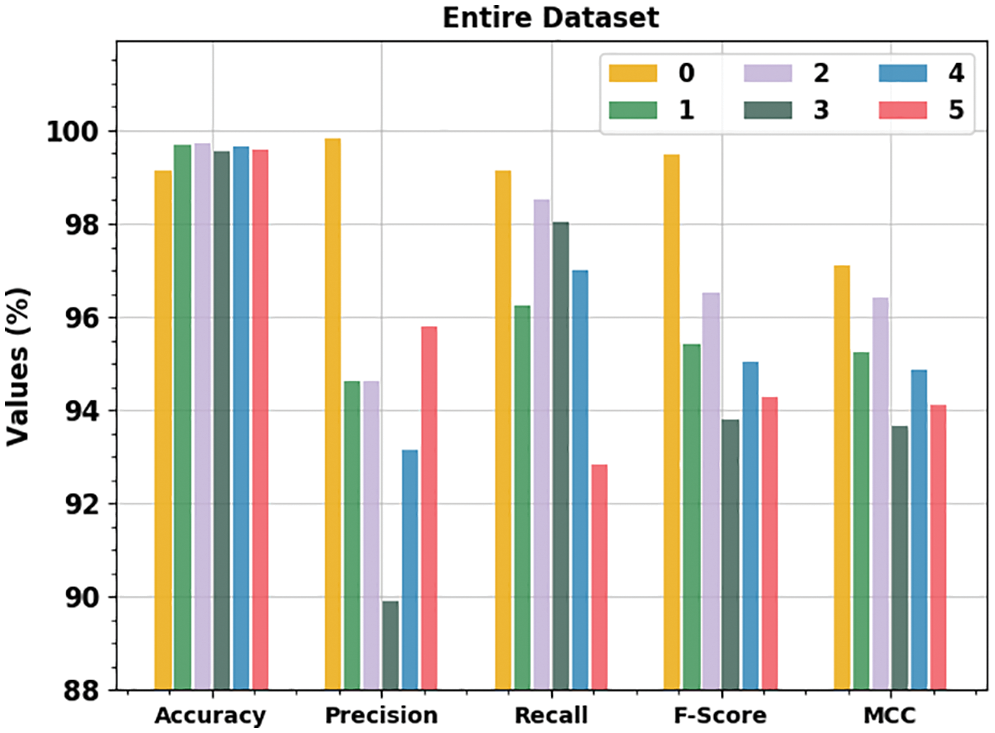
Figure 4: Analytical results of the ECSADL-CAD approach on the entire dataset
Fig. 5 provides the average results of the ECSADL-CAD model on different classes. These results confirmed the effectual performance of the proposed ECSADL-CAD model with average
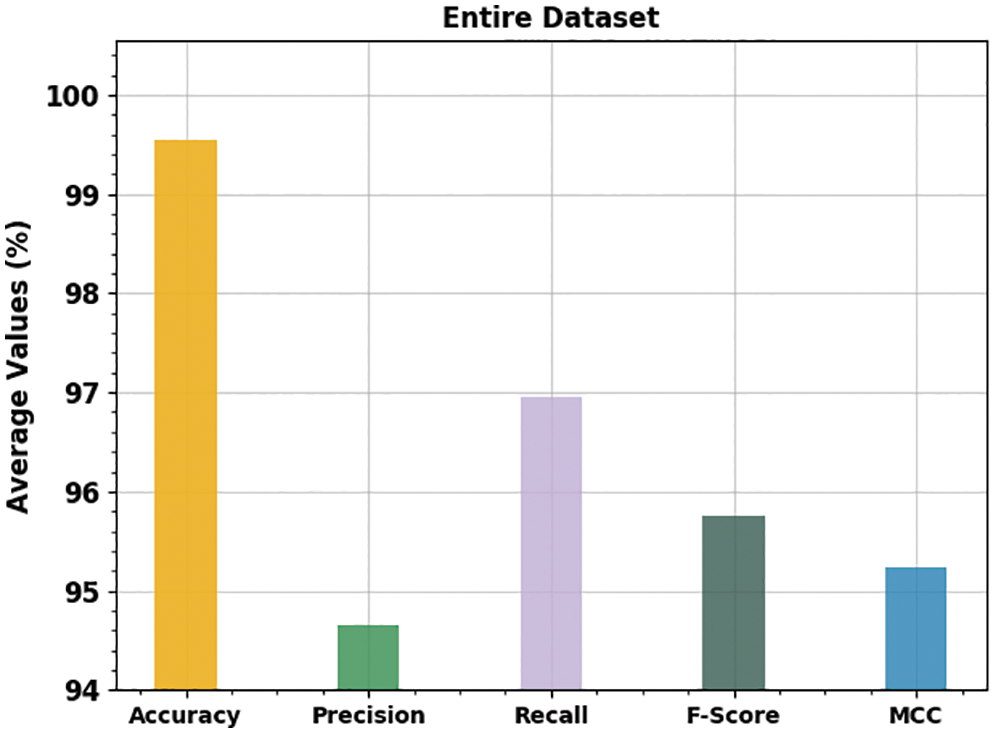
Figure 5: Average analytical results of the ECSADL-CAD approach on entire dataset
Table 3 and Fig. 6 demonstrate the outcomes of the proposed ECSADL-CAD approach on 70% of the TR data. The ECSADL-CAD technique recognized the class 0 samples with
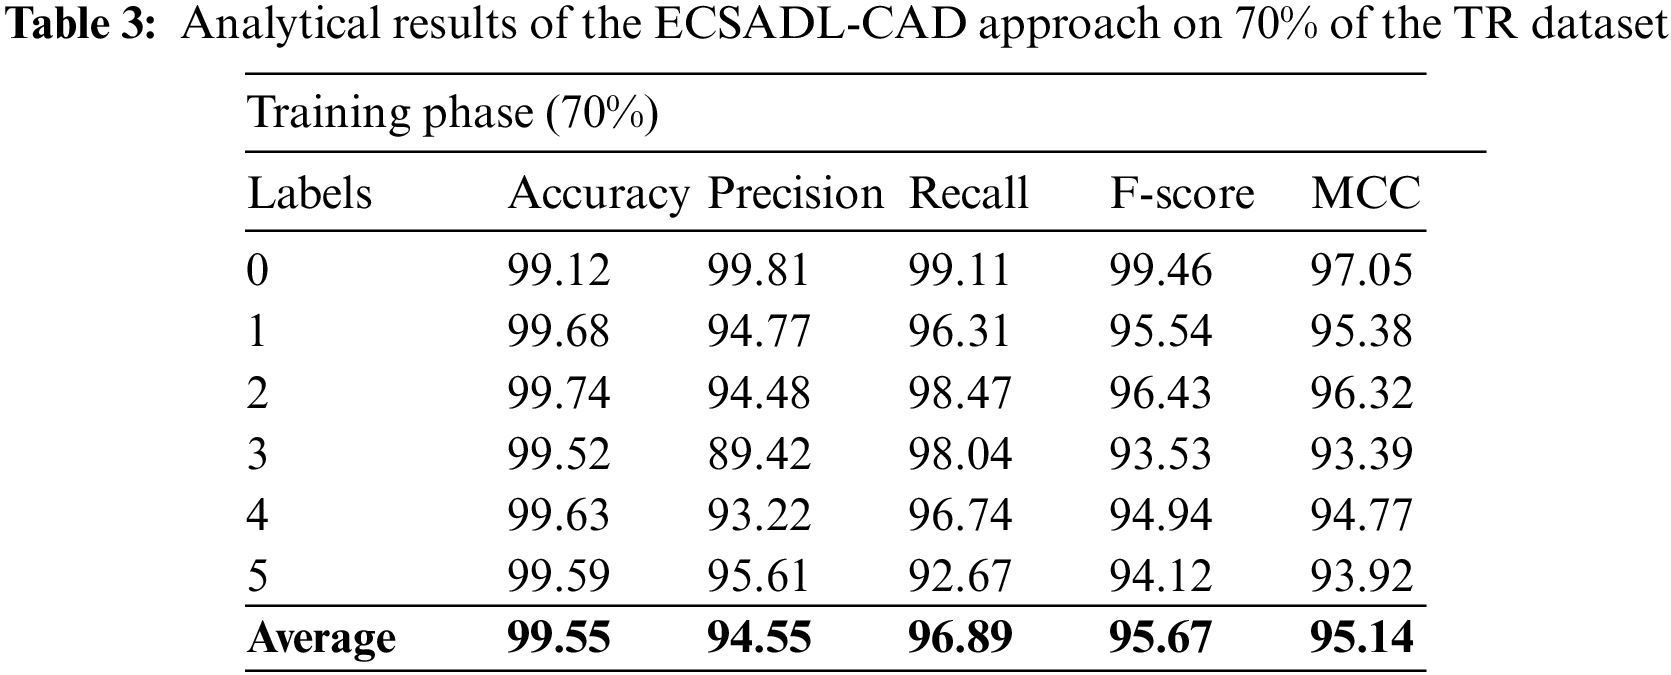
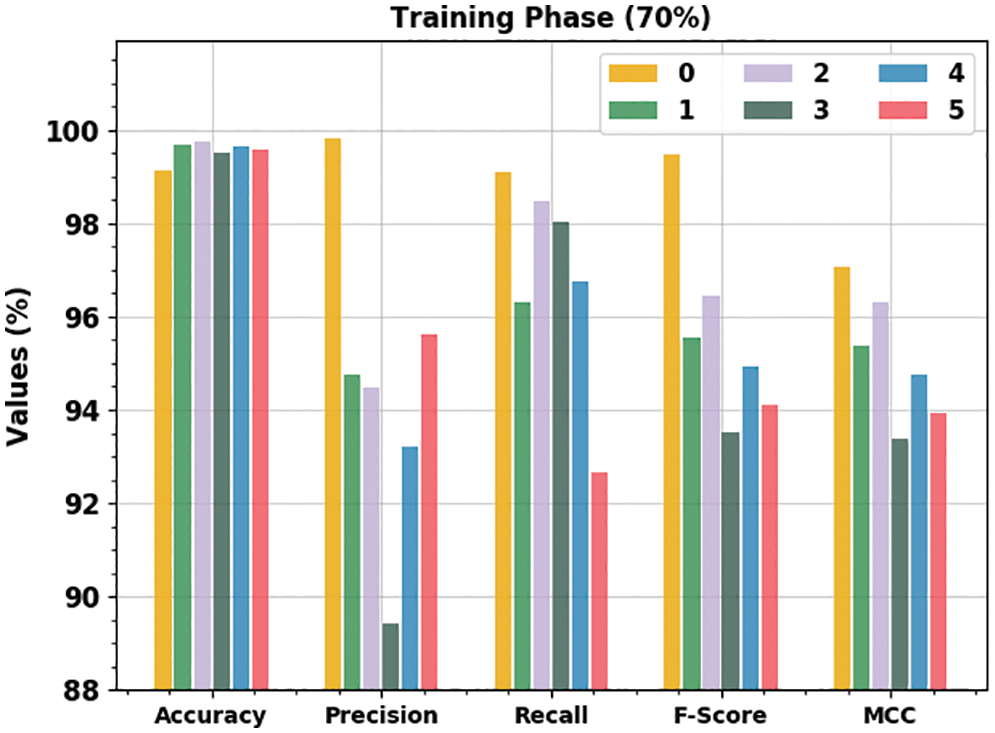
Figure 6: Analytical results of the ECSADL-CAD approach on 70% of the TR data
Fig. 7 offers the average outcomes of the ECSADL-CAD approach under distinct classes. These outcomes reveal the effectual performance of the ECSADL-CAD approach with average
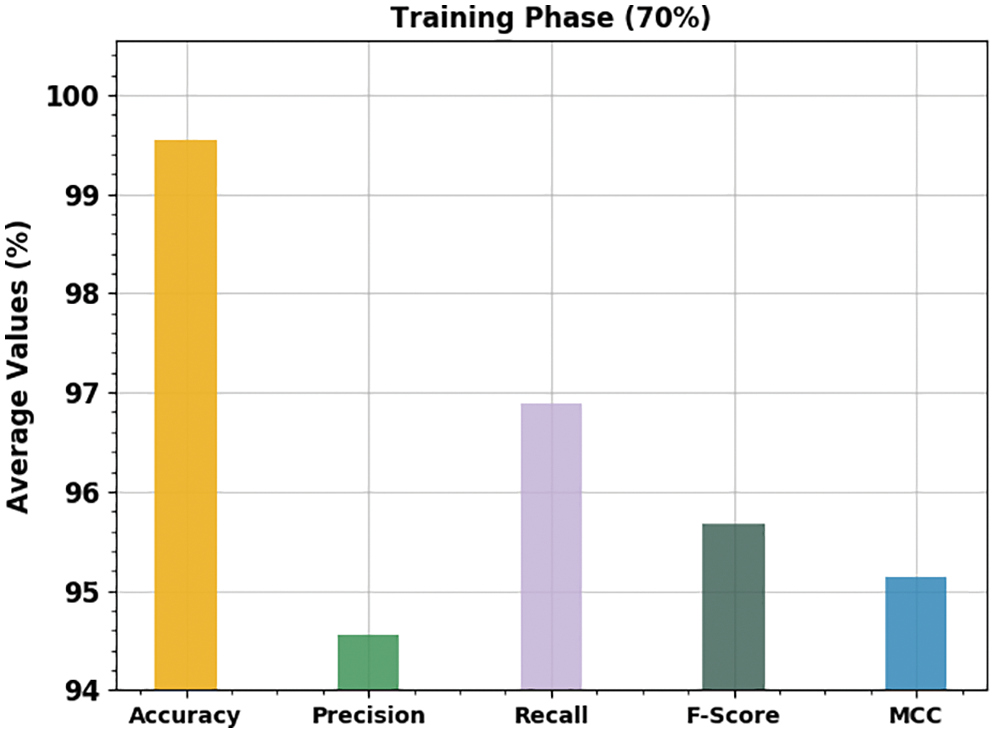
Figure 7: Average analytical results of the ECSADL-CAD approach on 70% of the TR dataset
Table 4 and Fig. 8 illustrate the outcomes of the ECSADL-CAD approach on 30% of the TS data. The ECSADL-CAD technique recognized the class 0 samples with
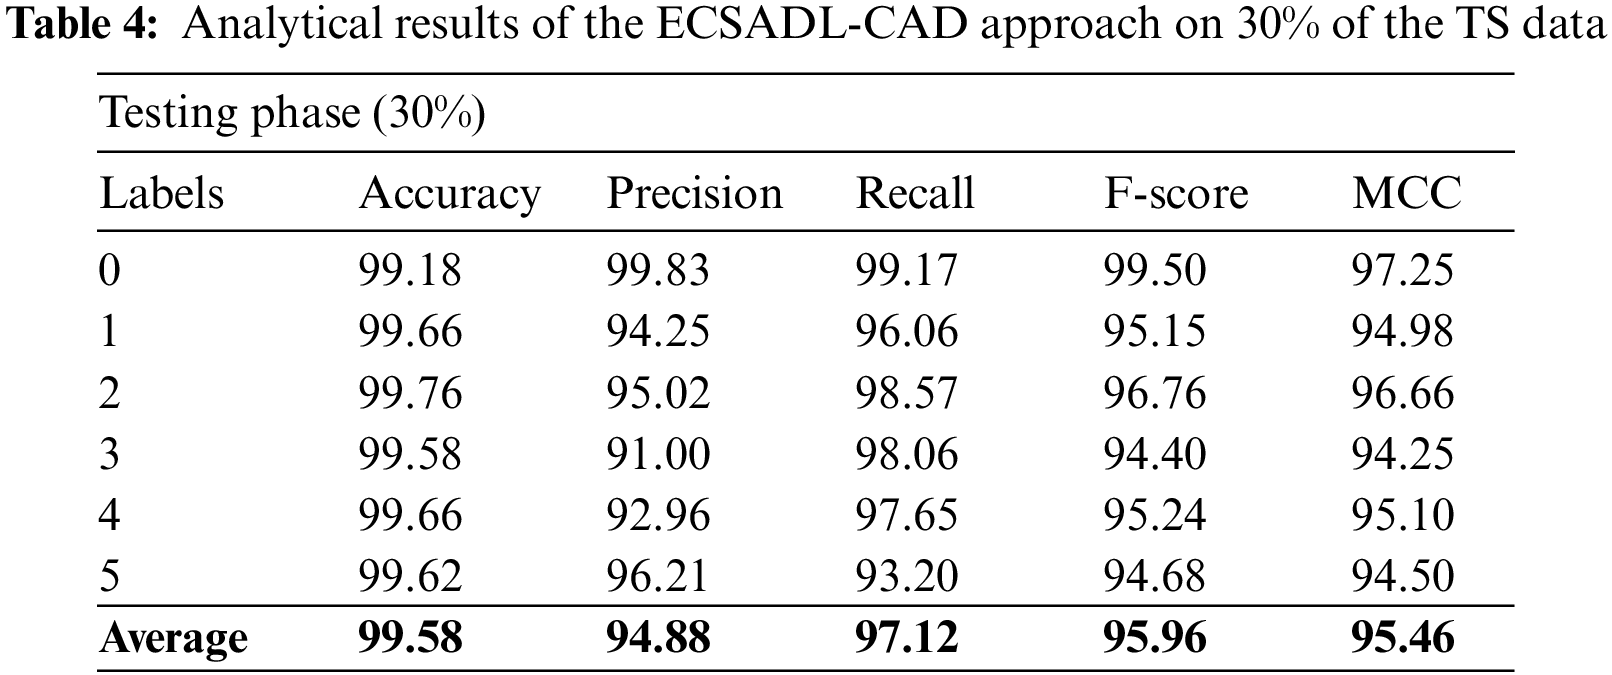
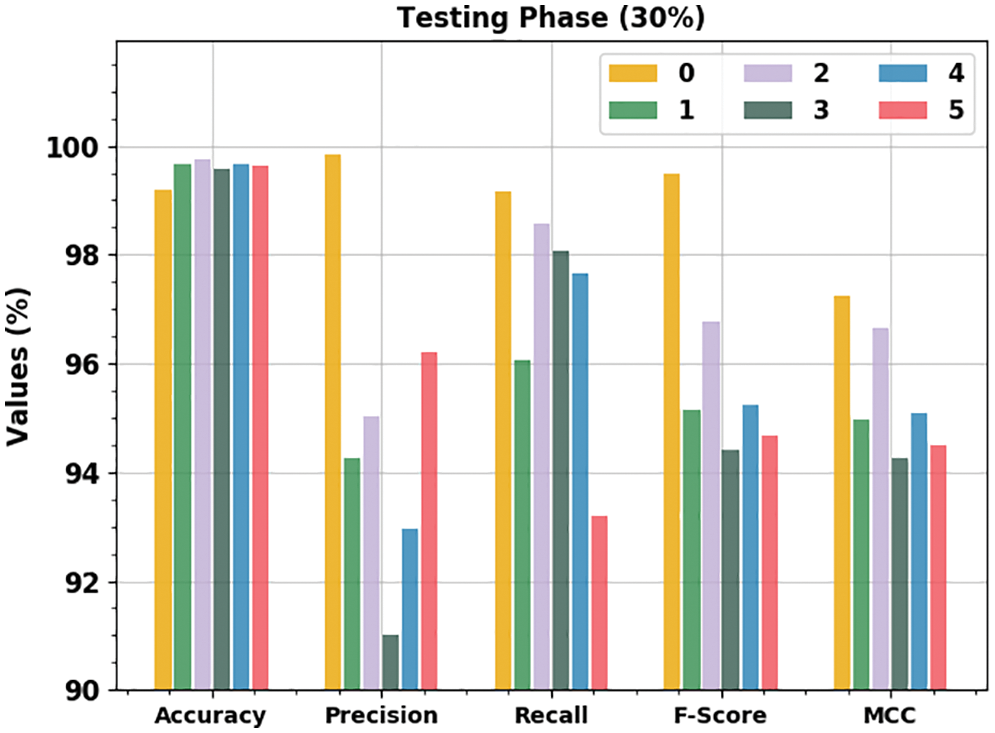
Figure 8: Analytical results of the ECSADL-CAD approach on 30% of the TS data
Fig. 9 illustrates the average results accomplished by the proposed ECSADL-CAD technique under different classes. These outcomes reveal the effectual performance of the ECSADL-CAD technique with average
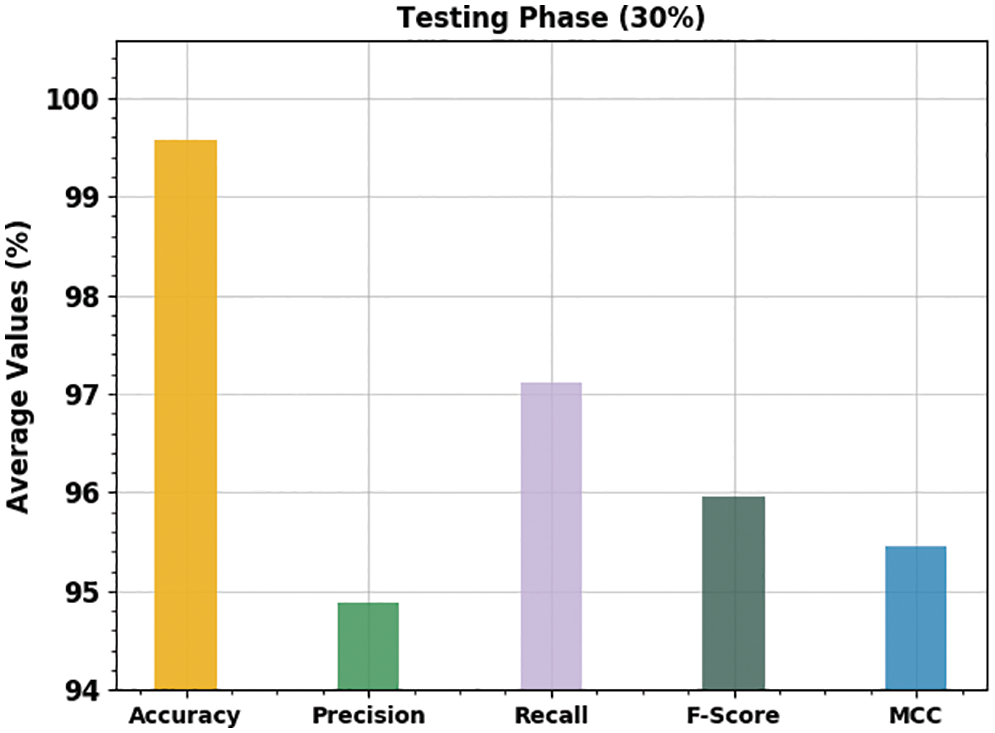
Figure 9: Average analysis results of the ECSADL-CAD approach on 30% of the TS data
Both Training Accuracy (TRA) and Validation Accuracy (VLA) values, acquired by the proposed ECSADL-CAD approach on the test dataset, are shown in Fig. 10. The experimental results infer that the proposed ECSADL-CAD approach achieved the maximal TRA and VLA values, whereas the VLA values were superior to the TRA values.
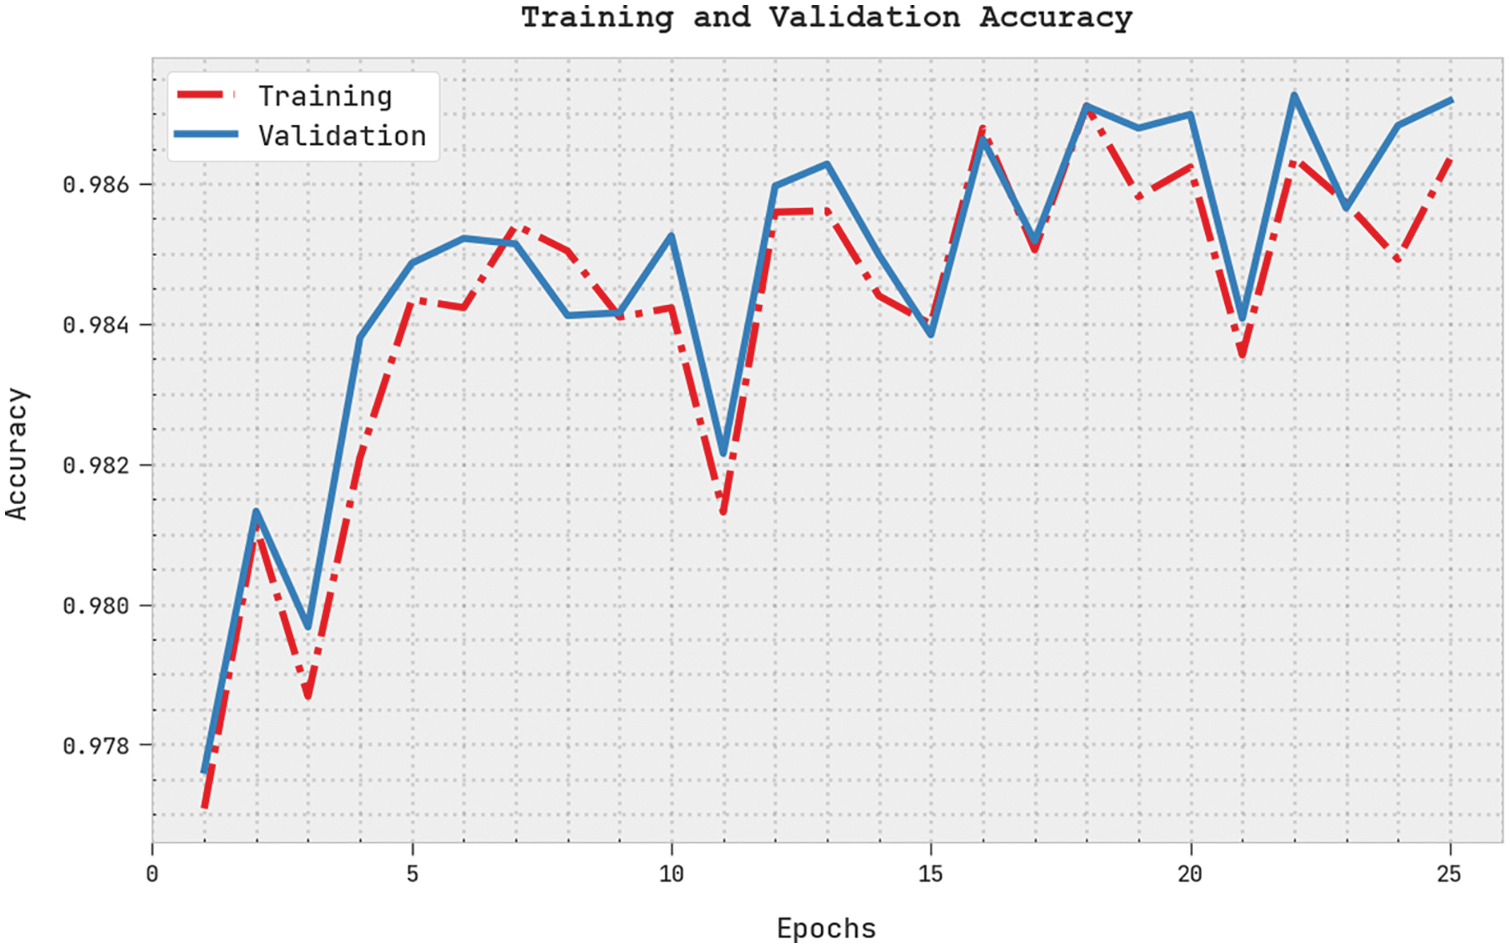
Figure 10: TRA and VLA analyses results of the ECSADL-CAD approach
Both Training Loss (TRL) and Validation Loss (VLL) values, realized by the ECSADL-CAD methodology on the test dataset, are depicted in Fig. 11. The experimental results reveal that the ECSADL-CAD system achieved the least TRL and VLL values, whereas the VLL values were lesser than the TRL values.
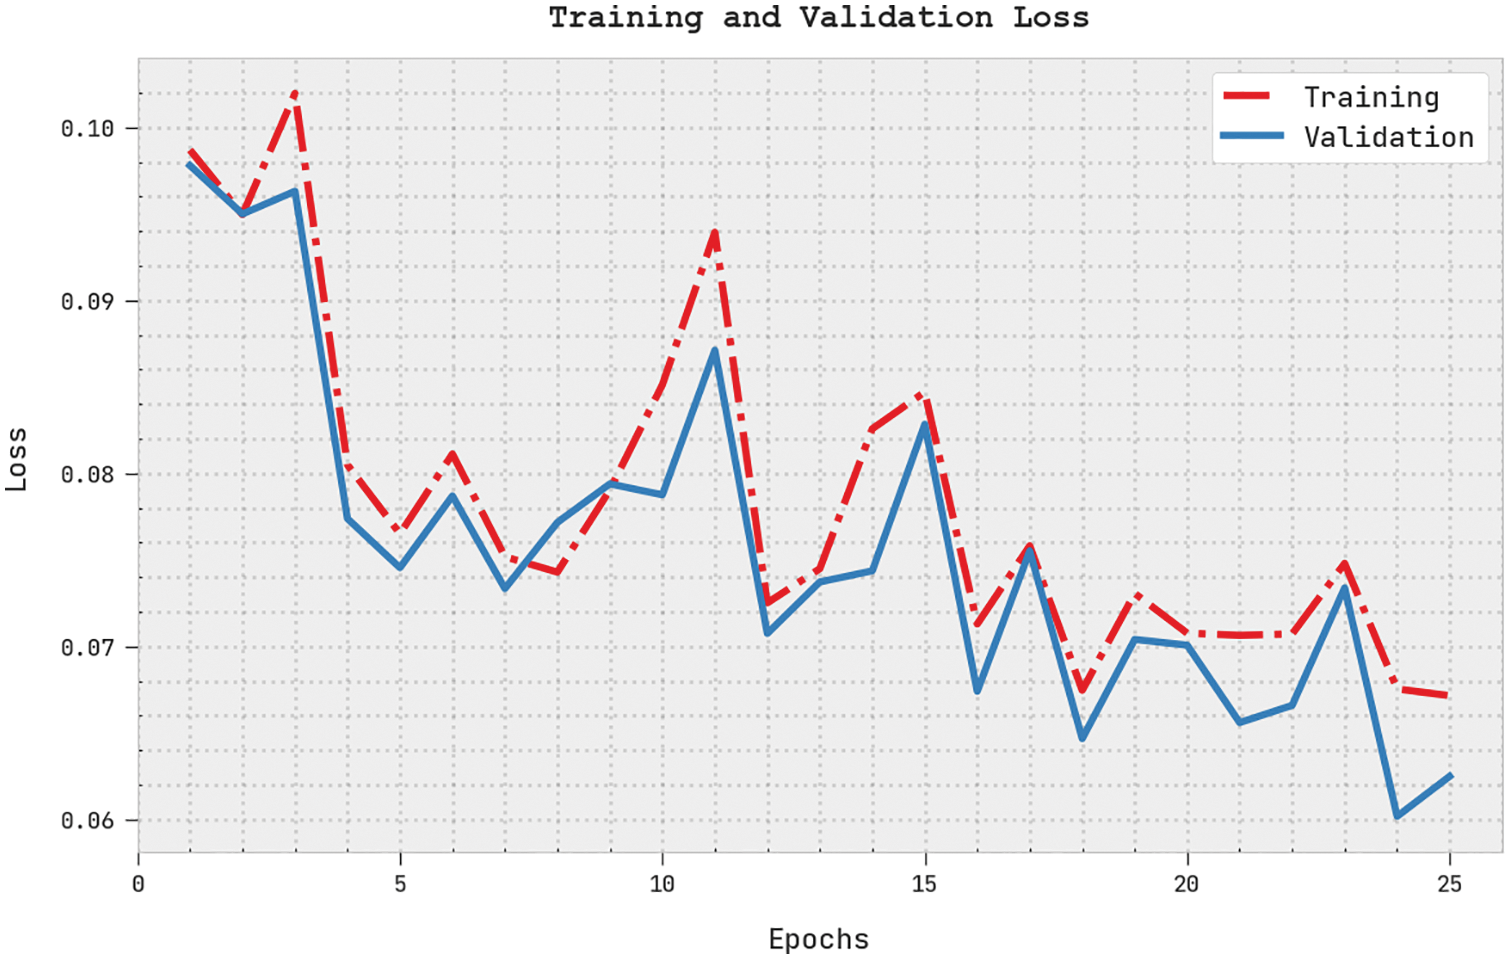
Figure 11: TRL and VLL analyses results of the ECSADL-CAD approach
In order to validate the superior performance of the ECSADL-CAD approach, an extensive comparative analysis was conducted, and the results are shown in Table 5 [15]. Fig. 12 reports the detailed
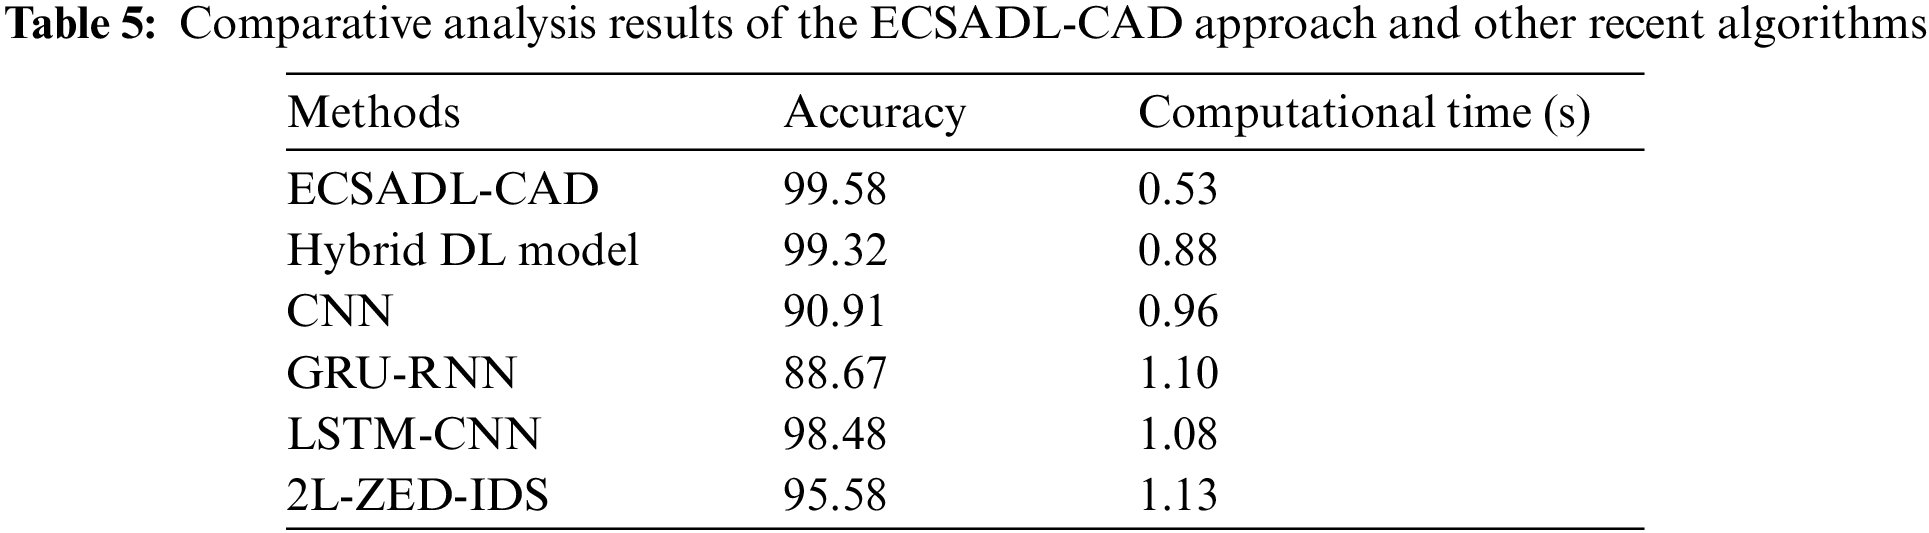
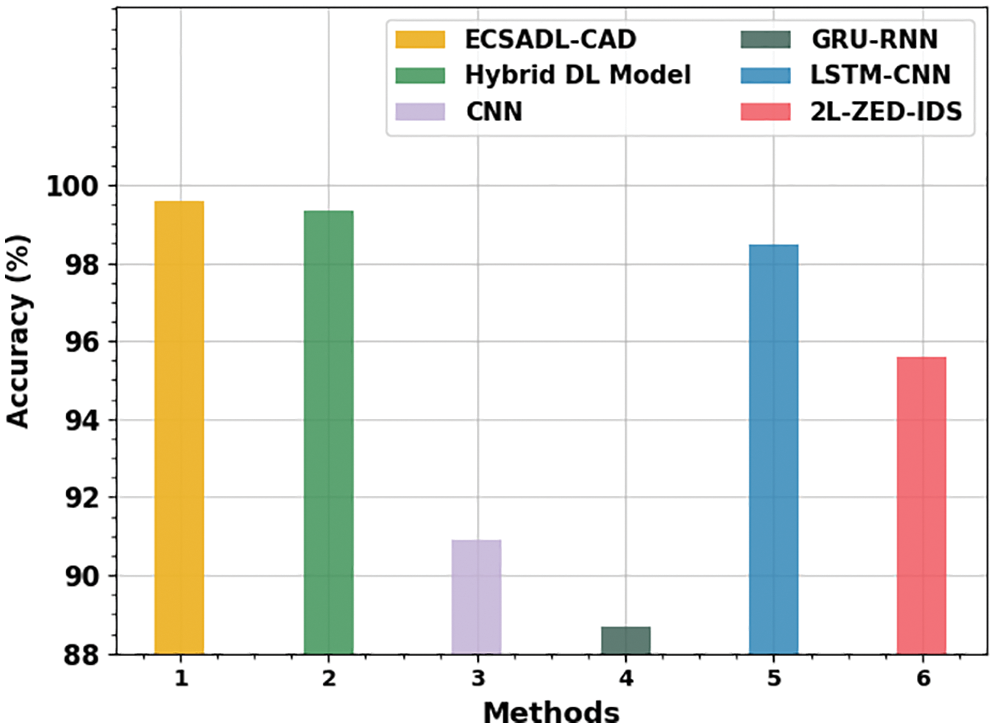
Figure 12:
Fig. 13 shows the detailed CT inspection results of the ECSADL-CAD approach and other recent DL techniques. The outcomes denote that 2L-ZED-IDS and the GRU-RNN systems attained the least performance with maximum CT values such as 1.13 and 1.10 s correspondingly. Afterwards, the LSTM-CNN technique reported a low CT value of 1.08 s. Besides, the CNN technique gained considerable performance with a CT of 0.96 s.
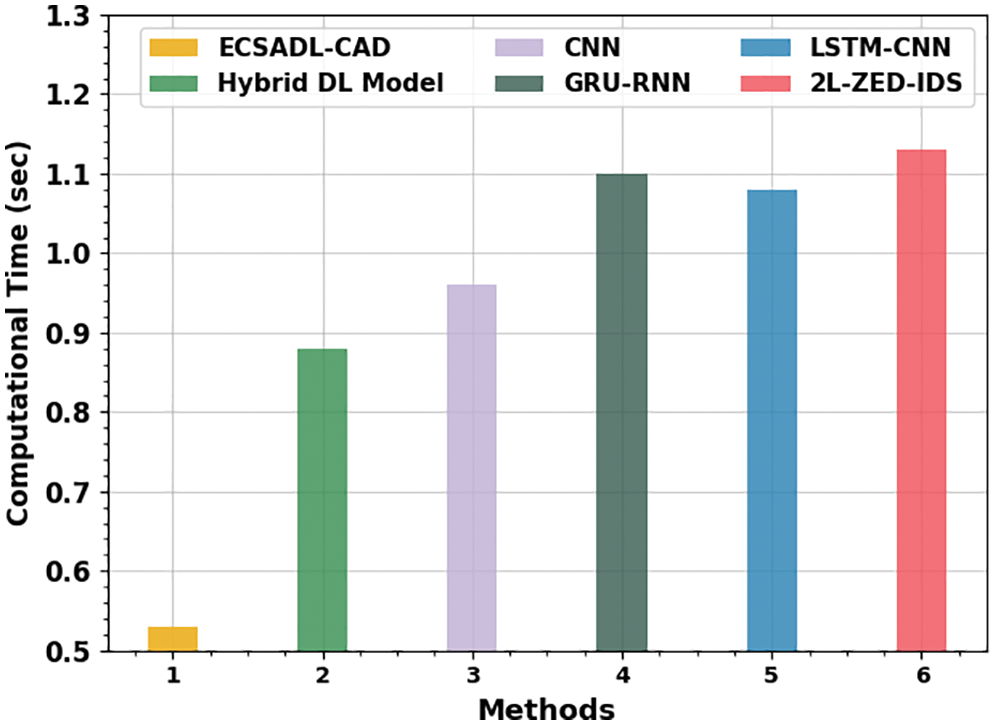
Figure 13: CT analysis results of the ECSADL-CAD approach and other recent algorithms
Following, the hybrid DL algorithm produced a near-optimum CT of 0.88 s. But, the proposed ECSADL-CAD technique demonstrated an enhanced outcome with a CT of 0.53 s. Hence, the ECSADL-CAD model can be established as a productive tool to secure the IoT environment.
The current article introduced a new ECSADL-CAD model for attack detection in the SDN-enabled IoT environment. The presented ECSADL-CAD approach aims to identify and classify the cyberattacks in the SDN-enabled IoT environment. To attain this, the ECSADL-CAD model pre-processes the data at the initial stage. In the presented ECSADL-CAD model, the RDBN model is employed for attack detection. At last, the ECSA-based hyperparameter tuning process gets executed to boost the overall classification outcomes. A series of simulations were conducted to validate the enhanced outcomes of the proposed ECSADL-CAD model. The experimental values confirmed the superior performance of the ECSADL-CAD model over other existing methodologies with a maximum accuracy of 99.58%. In the future, the feature selection approaches and the outlier removal processes can be incorporated to improve the classification results.
Funding Statement: Princess Nourah bint Abdulrahman University Researchers Supporting Project Number (PNURSP2022R77), Princess Nourah bint Abdulrahman University, Riyadh, Saudi Arabia. The authors would like to thank the Deanship of Scientific Research at Umm Al-Qura University for supporting this work by Grant Code: (22UQU4331004DSR15).
Conflicts of Interest: The authors declare that they have no conflicts of interest to report regarding the present study.
References
1. N. Sultana, N. Chilamkurti, W. Peng and R. Alhadad, “Survey on SDN based network intrusion detection system using machine learning approaches,” Peer-to-Peer Networking and Applications, vol. 12, no. 2, pp. 493–501, 2019. [Google Scholar]
2. A. Wani and R. Khaliq, “SDN-based intrusion detection system for IoT using deep learning classifier (IDSIoT-SDL),” CAAI Transactions on Intelligence Technology, vol. 6, no. 3, pp. 281–290, 2021. [Google Scholar]
3. T. A. Tang, L. Mhamdi, D. McLernon, S. A. R. Zaidi, M. Ghogho et al., “DeepIDS: Deep learning approach for intrusion detection in software defined networking,” Electronics, vol. 9, no. 9, pp. 1533, 2020. [Google Scholar]
4. J. Shu, L. Zhou, W. Zhang, X. Du and M. Guizani, “Collaborative intrusion detection for VANETs: A deep learning-based distributed SDN approach,” IEEE Transactions on Intelligent Transportation Systems, vol. 22, no. 7, pp. 4519–4530, 2020. [Google Scholar]
5. W. Li, Y. Wang, W. Meng, J. Li and C. Su, “BlockCSDN: Towards blockchain-based collaborative intrusion detection in software defined networking,” IEICE Transactions on Information and Systems, vol. 105, no. 2, pp. 272–279, 2022. [Google Scholar]
6. A. S. Reddy, B. R. Reddy and A. S. Babu, “An improved intrusion detection system for sdn using multi-stage optimized deep forest classifier,” International Journal of Computer Science & Network Security, vol. 22, no. 4, pp. 374–386, 2022. [Google Scholar]
7. M. A. Ferrag, L. Shu, H. Djallel and K. K. R. Choo, “Deep learning-based intrusion detection for distributed denial of service attack in agriculture 4.0,” Electronics, vol. 10, no. 11, pp. 1257, 2021. [Google Scholar]
8. W. Li, Y. Wang, Z. Jin, K. Yu, J. Li et al., “Challenge-based collaborative intrusion detection in software-defined networking: An evaluation,” Digital Communications and Networks, vol. 7, no. 2, pp. 257–263, 2021. [Google Scholar]
9. P. Jayasri, A. Atchaya, M. S. Parveen and J. Ramprasath, “Intrusion detection system in software defined networks using machine learning approach,” International Journal of Advanced Engineering Research and Science, vol. 8, no. 4, pp. 241–247, 2021. [Google Scholar]
10. S. K. Dey and M. M. Rahman, “Effects of machine learning approach in flow-based anomaly detection on software-defined networking,” Symmetry, vol. 12, no. 1, pp. 7, 2019. [Google Scholar]
11. M. Aslam, D. Ye, A. Tariq, M. Asad, M. Hanif et al., “Adaptive machine learning based distributed denial-of-services attacks detection and mitigation system for SDN-enabled IoT,” Sensors, vol. 22, no. 7, pp. 2697, 2022. [Google Scholar] [PubMed]
12. A. O. Alzahrani and M. J. Alenazi, “Designing a network intrusion detection system based on machine learning for software defined networks,” Future Internet, vol. 13, no. 5, pp. 111, 2021. [Google Scholar]
13. D. K. Dake, J. D. Gadze, G. S. Klogo and H. N. Mensah, “Multi-agent reinforcement learning framework in sdn-iot for transient load detection and prevention,” Technologies, vol. 9, no. 3, pp. 44, 2021. [Google Scholar]
14. T. G. Nguyen, T. V. Phan, D. T. Hoang, T. N. Nguyen and C. So-In, “Federated deep reinforcement learning for traffic monitoring in sdn-based iot networks,” IEEE Transactions on Cognitive Communications and Networking, vol. 7, no. 4, pp. 1048–1065, 2021. [Google Scholar]
15. D. Javeed, T. Gao, M. T. Khan and I. Ahmad, “A hybrid deep learning-driven SDN enabled mechanism for secure communication in Internet of Things (IoT),” Sensors, vol. 21, no. 14, pp. 4884, 2021. [Google Scholar] [PubMed]
16. A. de R. L. Ribeiro, R. Y. C. Santos and A. C. A. Nascimento, “Anomaly detection technique for intrusion detection in sdn environment using continuous data stream machine learning algorithms,” in IEEE Int. Systems Conf. (SysCon), Vancouver, BC, Canada, pp. 1–7, 2021. [Google Scholar]
17. X. Wang, G. Huang, Z. Zhou, W. Tian, J. Yao et al., “Radar emitter recognition based on the energy cumulant of short time Fourier transform and reinforced deep belief network,” Sensors, vol. 18, no. 9, pp. 3103, 2018. [Google Scholar] [PubMed]
18. T. R. Gadekallu, M. Alazab, R. Kaluri, P. K. R. Maddikunta, S. Bhattacharya et al., “Hand gesture classification using a novel CNN-crow search algorithm,” Complex & Intelligent Systems, vol. 7, no. 4, pp. 1855–1868, 2021. [Google Scholar]
Cite This Article
 Copyright © 2023 The Author(s). Published by Tech Science Press.
This work is licensed under a Creative Commons Attribution 4.0 International License , which permits unrestricted use, distribution, and reproduction in any medium, provided the original work is properly cited.
 Downloads
 Citation Tools