
 Submit a Paper
 Propose a Special lssue
 Open Access
ARTICLE

A Hybrid Deep Learning Approach for PM2.5 Concentration Prediction in Smart Environmental Monitoring
1 Faculty of Information Technology, HUTECH University, Ho Chi Minh City, Vietnam
2 Natural Language Processing and Knowledge Discovery Laboratory, Faculty of Information Technology, Ton Duc Thang University, Ho Chi Minh City, Vietnam
3 Faculty of Computing Fundamentals, FPT University, Ho Chi Minh City, Vietnam
4 Laboratory for Artificial Intelligence, Institute for Computational Science and Artificial Intelligence, Van Lang University, Ho Chi Minh City, Vietnam
5 Faculty of Information Technology, Van Lang University, Ho Chi Minh City, Vietnam
* Corresponding Author: Tuong Le. Email:
Intelligent Automation & Soft Computing 2023, 36(3), 3029-3041. https://doi.org/10.32604/iasc.2023.034636
Received 22 July 2022; Accepted 22 December 2022; Issue published 15 March 2023
 View Full Text
 Download PDF
Abstract
Nowadays, air pollution is a big environmental problem in developing countries. In this problem, particulate matter 2.5 (PM2.5) in the air is an air pollutant. When its concentration in the air is high in developing countries like Vietnam, it will harm everyone’s health. Accurate prediction of PM2.5 concentrations can help to make the correct decision in protecting the health of the citizen. This study develops a hybrid deep learning approach named PM25-CBL model for PM2.5 concentration prediction in Ho Chi Minh City, Vietnam. Firstly, this study analyzes the effects of variables on PM2.5 concentrations in Air Quality HCMC dataset. Only variables that affect the results will be selected for PM2.5 concentration prediction. Secondly, an efficient PM25-CBL model that integrates a convolutional neural network (CNN) and Bidirectional Long Short-Term Memory (Bi-LSTM) is developed. This model consists of three following modules: CNN, Bi-LSTM, and Fully connected modules. Finally, this study conducts the experiment to compare the performance of our approach and several state-of-the-art deep learning models for time series prediction such as LSTM, Bi-LSTM, the combination of CNN and LSTM (CNN-LSTM), and ARIMA. The empirical results confirm that PM25-CBL model outperforms other methods for Air Quality HCMC dataset in terms of several metrics including Mean Squared Error (MSE), Root Mean Squared Error (RMSE), Mean Absolute Error (MAE), and Mean Absolute Percentage Error (MAPE).Keywords
Machine learning and deep learning have been developing very rapidly and have been applied in many fields such as economics [1,2], engineering [3,4], and natural language processing [5]. Recently, there are a lot of research applying deep learning to analyzing and predicting time series. Kocheturov et al. [6] developed a new method for mining complex temporal patterns in multivariate time series. This study proposed the Extended Vertical List structure to track positions of the first state of the pattern inside records. In addition, this structure can link them to appropriate positions of the prefix. This method will be used to extract the features of the multivariate time series. Next, Gu et al. [7] proposed a new active multi-source transfer learning (MultiSrcTL) approach for time series prediction. The results on six benchmark datasets indicate that the applicability and effectiveness of MultiSrcTL algorithm. Then, Le et al. [8] developed a new model, which is a combination of a convolutional neural network (CNN) and bidirectional long short-term memory (Bi-LSTM), for forecasting the electric energy consumption on various variations of the individual household electric power consumption dataset in various time spans including various timespan datasets such as real-time, short-term, medium-term, and long-term datasets. Next, Le et al. [9] developed MEC-TLL framework for the multiple electric energy consumption forecasting utilizing transfer learning and LSTM. This study proposed a cluster-based strategy for transfer learning the LSTM models to reduce the processing time. The results confirmed that MEC-TLL saves processing time while keeping outstanding performance. Vo et al. [10] proposed BOP-BL model for predicting oil prices that change over time. BOP-BL has two following modules: (i) Three Bi-LSTM layers are used in the first module. This module aims to learn useful information features in forward and backward directions. (ii) The second module has a fully connected layer to predict the oil price using extracted features. Zhang et al. [11] developed a deep learning-based framework for time series prediction in finance. The proposed model integrates the advantages of CEEMD, PCA, and LSTM to improve the performance in predicting the stock indices. Therefore, deep learning has been widely used in time series predictions in many different fields. Recently, Vo et al. [12] collects the monthly water consumption with 16,244 households in Can Tho city, Vietnam for three years from 2018 to 2020. Then, a new approach using Bi-LSTM for predicting the monthly household water consumption was developed.
In recent years, there have been many studies on air pollution using machine learning and deep learning [13,14] when air pollution has become a severe problem in urban cities. Air pollution occurs in industrial cities or with high construction density. In such contexts, the surrounding air contains many things such as gases, dust, fumes, or odors in high enough quantities. This situation is harmful to the health of humans and animals. One of the biggest killers in this age is air pollution. In 2015, polluted air was the reason for 6.4 million deaths in the world including 2.8 million from household air pollution and 4.2 million from outdoor air pollution [15]. Therefore, it is necessary to develop models to accurately predict air pollution levels to have suitable strategies. Zhang et al. [16] developed a hybrid approach, where multiple static sensors and mobile sensors are utilized to monitor the air quality. In addition, this study also builds a machine learning model which utilizes the collected data for training and provides the predicted information about air quality. Zeinalnezhad et al. [17] proposed two models of semi-experimental nonlinear regression and adaptive neuro-fuzzy inference system (ANFIS). This system aims to predict the concentration of four important pollutants including CO, SO2, O3, and NO2. Schürholz et al. [18] proposed a framework that includes context-aware computing concepts to merge LSTM with other information. This model was evaluated by an application in the Melbourne Urban Area (Victoria, Australia) which provides high values of the precision metric. Ma et al. [19] introduced the problem of predicting air quality for the new stations that lack training data. They then developed a transfer learning-based stacked Bi-LSTM model (TLS-BLSTM) to predict air quality in this situation. The results indicate that TLS-BLSTM achieved 35.21% lower in terms of RMSE for the experimented three pollutants in new stations. Chang et al. [20] utilized an Aggregated LSTM model that combines three kinds of stations: local air quality monitoring stations, industrial areas stations, and external pollution sources stations. This approach was verified by the dataset collected by Taiwan Environmental Protection Agency between 2012 and 2018. This model obtained the best experimental results compared with SVM-based Regression, Gradient Boosted Tree Regression, LSTM, etc. The above forecasting models are applied to predict air pollution in smart cities. The current state of air pollution is having a very serious impact on human life, causing 5% of mortality from tracheal, bronchial, and lung cancers, 3% of mortality from cardiopulmonary disease, and about 1% mortality from acute respiratory infections in children under 5 years of age [21]. The prevention and mitigation of consequences of air pollution are very urgent issues today. The accurate forecast of air pollution helps to warn people when the pollution index exceeds the permissible threshold through public announcements or an automatic messaging system. People will plan to carry out their daily activities in places with less air pollution or limit going out and take necessary precautions. This problem of air pollution forecasting is very important in contributing to the protection of public health.
Among all the particulate matters of air pollution problem, PM2.5 is of particular concern. Therefore, there is also a lot of research on PM2.5 concentration prediction. Feng et al. [22] used Multi-layer Perceptron, Ma et al. [23] utilized XGBoost classifier, Wang et al. [24] made use of the artificial neural network, and Pak et al. [25] employed Deep learning for PM2.5 concentration prediction in several cities in China. Xu et al. [26] developed a spatial ensemble-based approach for hourly PM2.5 concentrations prediction around Beijing railway station in China while Sun et al. [27] proposed a novel stacking-driven ensemble approach to predict hourly PM2.5 concentration in the winter of the Beijing-Tianjin-Hebei, China. Liu et al. [28] proposed a novel factory-aware attention mechanism by a LSTM neural network (FAA-LSTM) to forecast the PM2.5 concentrations. Next, Ma et al. [29] developed a Lag-FLSTM (Lag layer-LSTM-Fully Connected network) model based on Bayesian Optimization (BO) for multivariate PM2.5 concentration forecasting at the Wayne County in Michigan, the U.S. Xu et al. [30] developed a temporal-spatial-regression-tree model to predict the distribution of PM2.5. However, the above models cannot be applied to another location which has dataset with many different features. As well as, with the importance of PM2.5 predictions, this study proposes a hybrid deep learning approach for PM2.5 concentration prediction in Ho Chi Minh City, Vietnam. From that result, smart systems in smart city can warn to protect the health of their citizens as a short-term strategy. In addition, managers will have appropriate long-term strategies to protect the environment.
The major contributions of this study are summarized as follows.
• This study analyzes the effects of variables on PM2.5 concentrations in the Air Quality HCMC dataset.
• PM25-CBL model that integrates CNN and Bidirectional Long Short-Term Memory (Bi-LSTM) is developed.
• This study conducts the experiment to evaluate the predictability of the proposed approach and LSTM, Bi-LSTM, CNN, CNN-LSTM, CNN-Bi-LSTM, and ARIMA models. The results indicate that the PM25-CBL model outperforms other experimental methods for the Air Quality HCMC dataset in terms of MSE, RMSE, MAE, and MAPE metrics.
The remainder of this article is organized as follows. The detail of the Air Quality HCMC dataset and PM25-CBL model that integrates CNN and Bi-LSTM for PM2.5 concentration prediction, are presented in Section 2. The experiments are conducted in Section 3. Finally, Section 4 gives the conclusion of this study. Several future works are introduced in this section.
2.1 The Air Quality HCMC Dataset
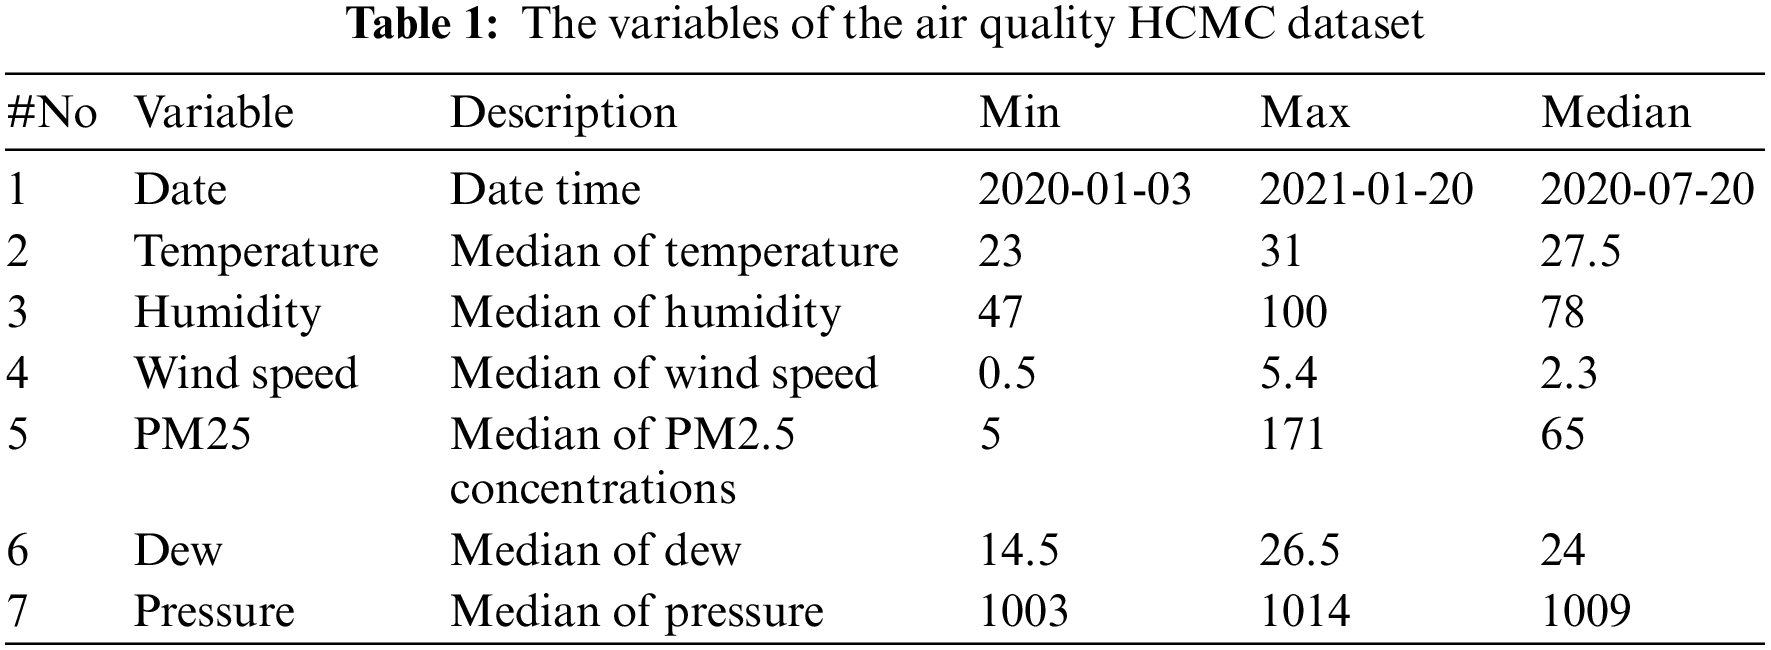
The Vietnam Air Quality Data Series [31] provides daily air quality values for several cities in Vietnam. This study focuses on PM2.5 concentration prediction in Ho Chi Minh City, Vietnam. Therefore, only air quality values in Ho Chi Minh City are selected. Seven variables include the date, temperature, humidity, wind speed, PM2.5 concentrations (μg/m³), dew, and pressure in Air Quality HCMC dataset attached with the descriptions and basic statistics are shown in Table 1.
Before further analysis, this study preprocesses the data first. To avoid the effects of dimensional difference and improve processing time, six variables including temperature, humidity, wind speed, PM2.5 concentrations, dew, and pressure are normalized by the Min-Max Scaler as the following equation:
Then, the correlations between temperature, humidity, wind speed, dew, and pressure with PM2.5 concentrations in Air Quality HCMC dataset are shown in Fig. 1. The last column of the scatter plot matrix indicates that temperature, dew, humidity, and wind speed have a low negative correlation with PM2.5 concentrations while pressure has a low positive correlation with PM2.5 concentrations. Therefore, this study will use all variables including temperature, dew, humidity, wind speed, and pressure in the proposed model.
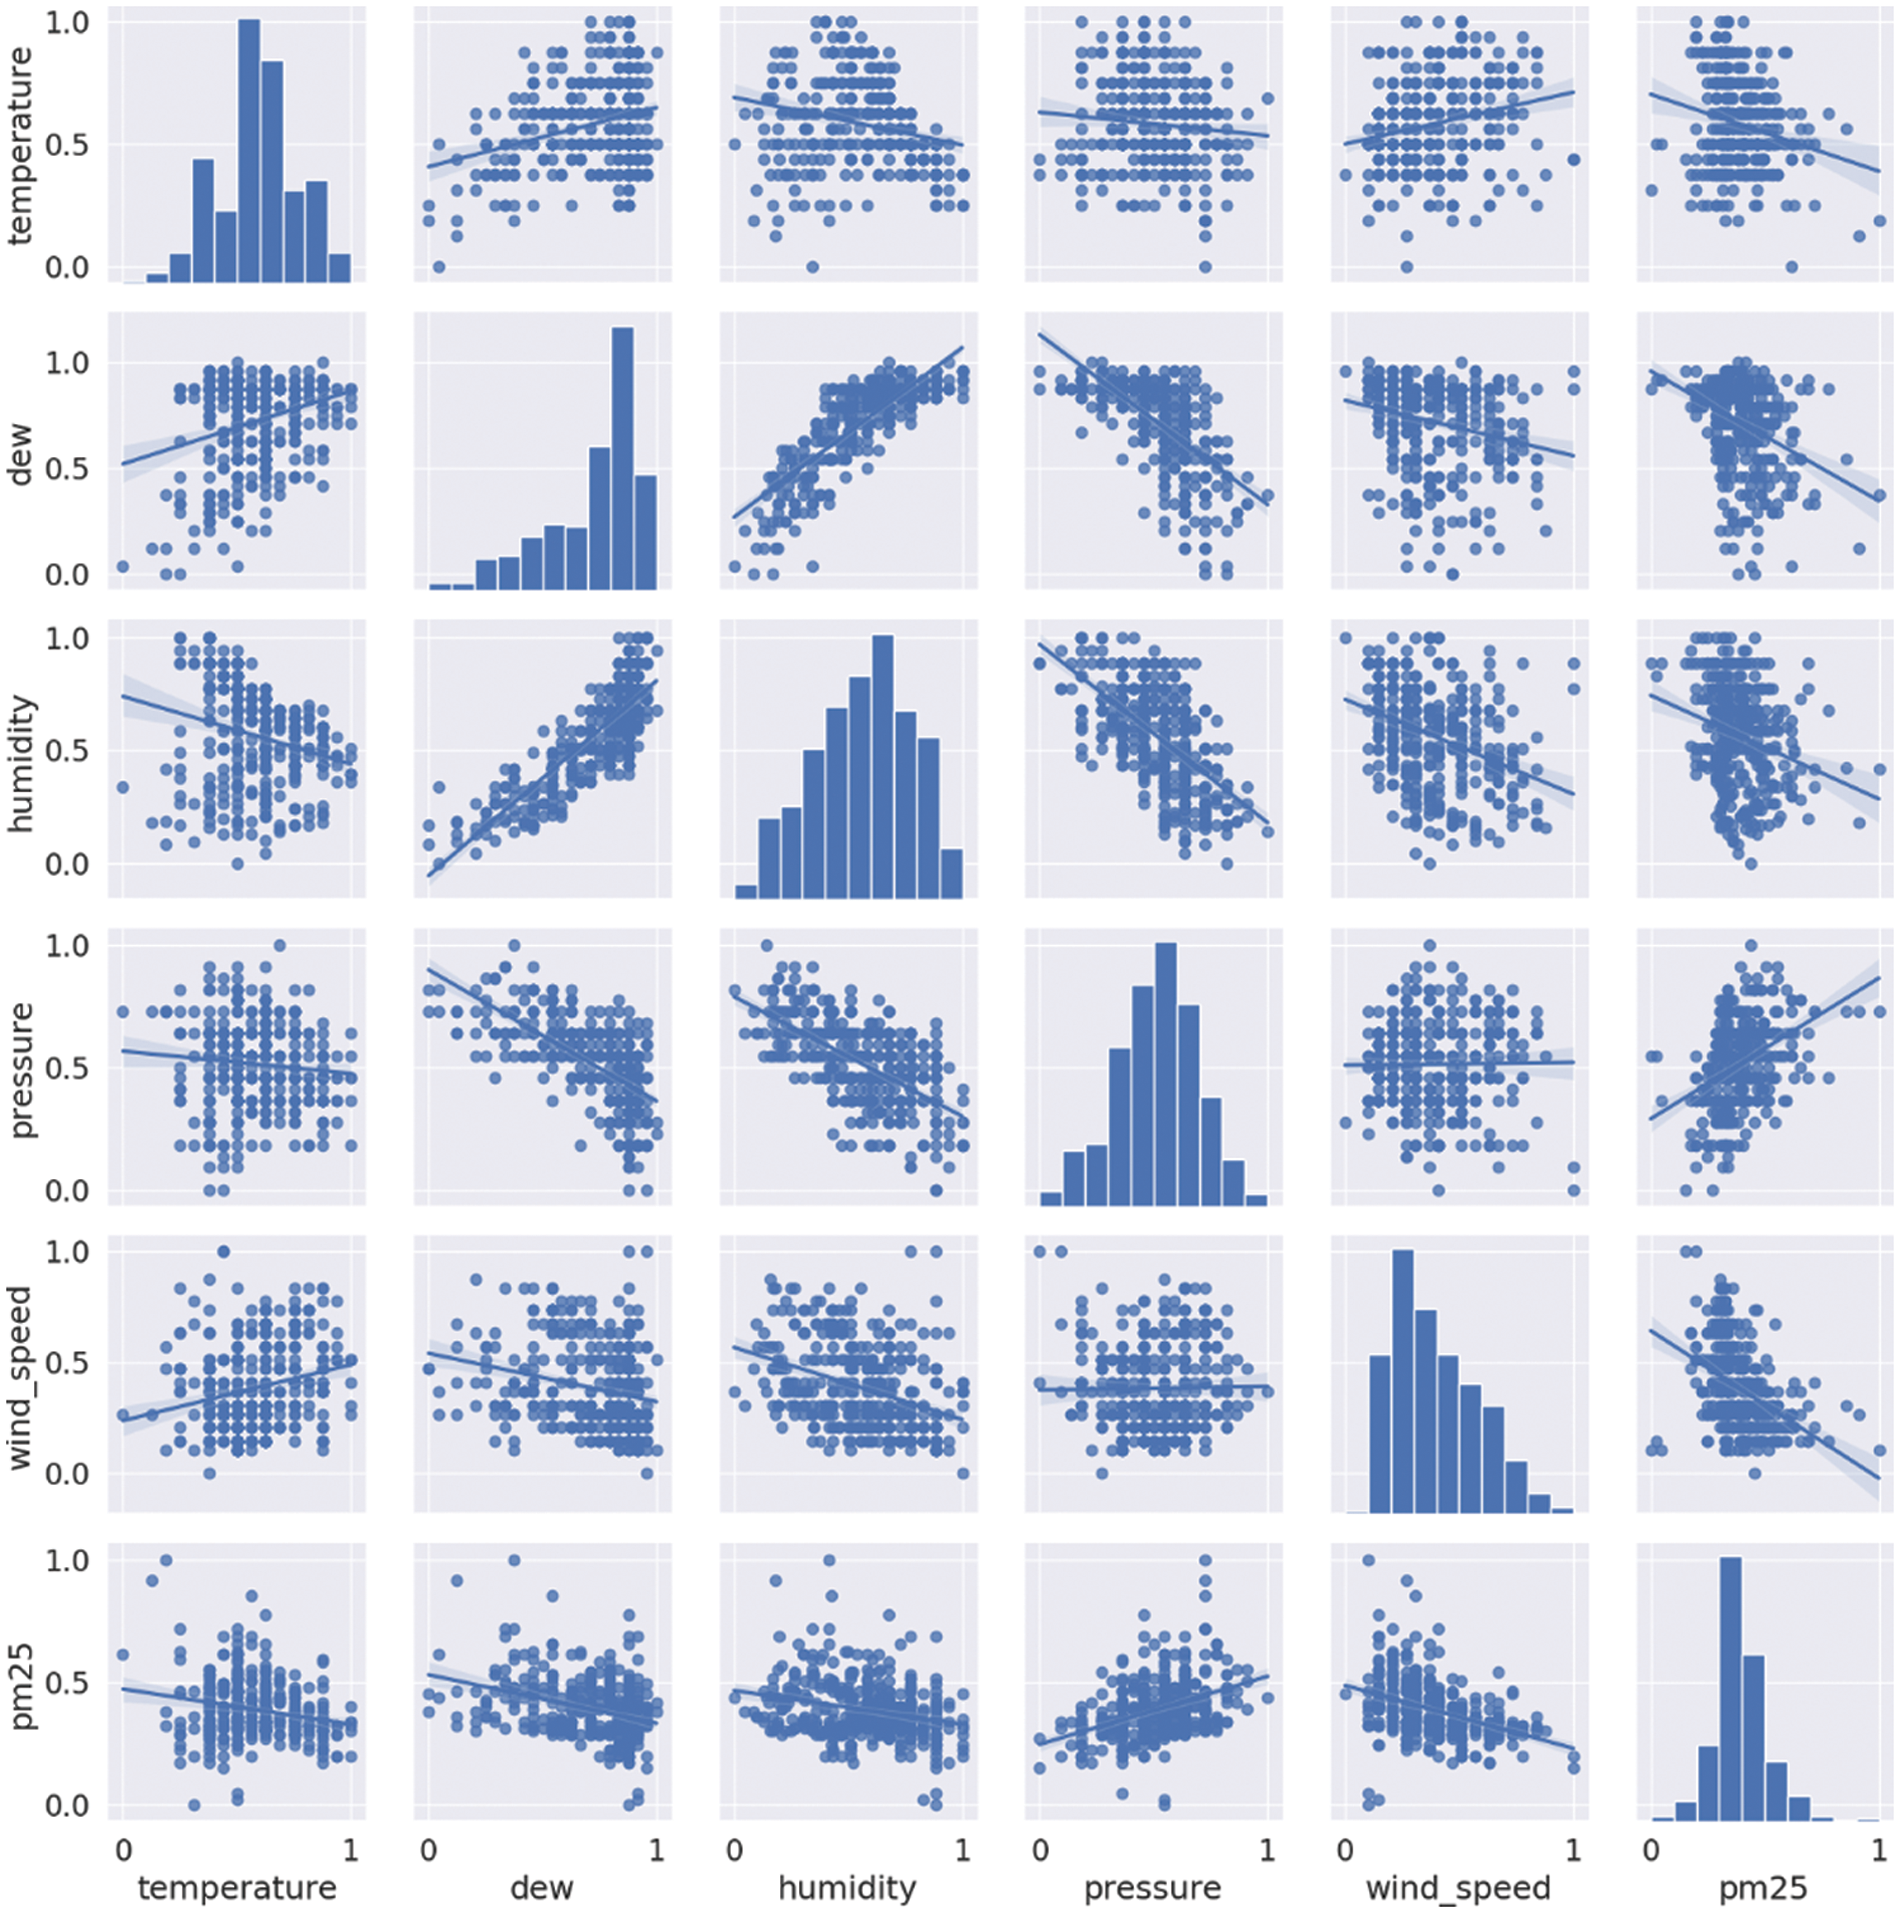
Figure 1: A scatter plot matrix for air quality HCMC dataset
2.2 PM25-CBL: A Hybrid Deep Learning Approach for PM2.5 Concentration Prediction
This section presents the overall architecture of a hybrid deep learning approach named the PM25-CBL model for PM2.5 concentration prediction in the Air Quality HCMC dataset. This model shown in Fig. 2 is the combination of CNN and Bi-LSTM, the latest deep learning models to solve the time series prediction problem. The proposed model consists of two following phases. In the training phase, six input variables from Air Quality HCMC dataset are put into the CNN module for extracting features. The extracted features will be passed to the Bi-LSTM module. Then, PM25-CBL can predict the PM2.5 concentrations by the fully connected module. In the testing phase, only five features including temperature, humidity, wind speed, dew, and pressure are passed to the trained model to predict PM2.5 concentrations in the testing set.
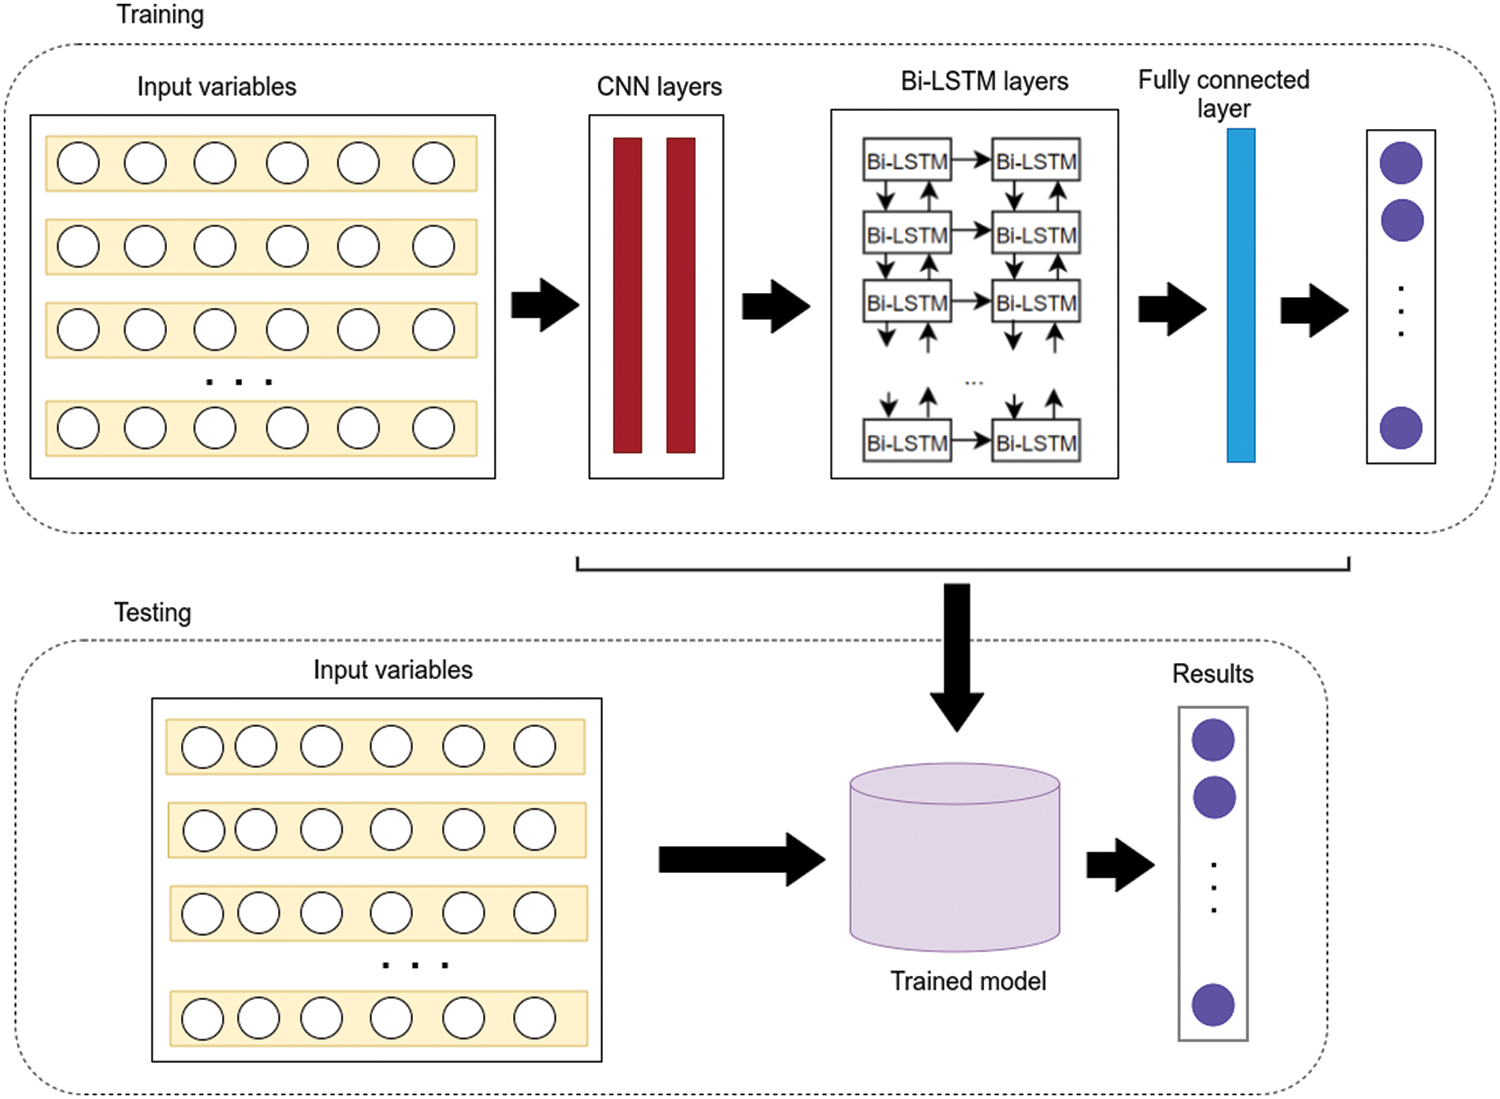
Figure 2: PM25-CBL model
CNN module. This module utilizes two one-dimensional (1D) convolution layers for analyzing the input variables in Air Quality HCMC dataset. Each 1D convolution layer is followed by an 1D max-pooling layer to reduce the computational complexity. Specifically, this CNN module aids to eliminate the feature redundancies by applying the filters on the input time series data.
For detail, the left of Fig. 3 is the input time series data. At a data point in that time series, there are six variables. The red and yellow windows in Fig. 3 represent the filters. In the PM25-CBL model, we opt for the size of filters with 64 and kernel size with 2 to apply for our model. The number of the extracted feature dimensions is N × 1 after convolution with the red filter, where N is based on the number of input data dimensions, the size of the filter, and the convolution step length. The yellow window indicates another filter, which can be followed by other filters. Suppose that we have M filters, then the extracted feature dimension will be N × M. Finally, the output of this process will push into the activation function (ReLU), allowing the PM25-CBL model to learn faster and perform better.
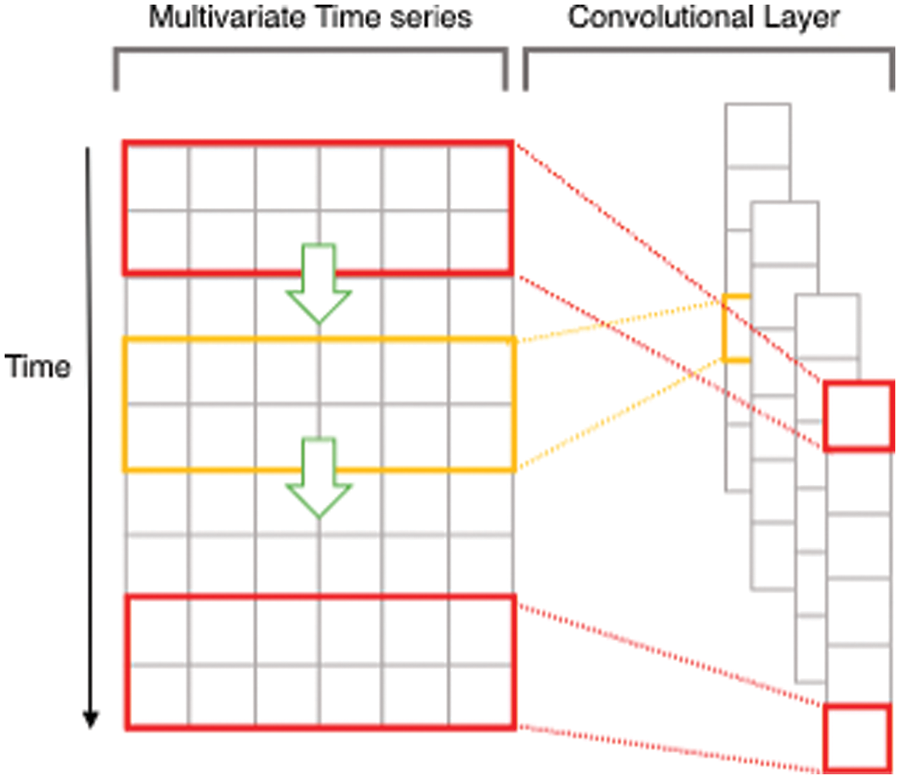
Figure 3: The process of 1D convolution layer for multivariate time series data [32]
Bi-LSTM module. To understand Bi-LSTM, this study first briefs the LSTM network as follows. This network, which first introduced by Graves and Schmidhuber [33], aims to improve performances of the traditional recurrent neural networks (RNNs). An LSTM-based model uses a unique set of memory cells instead of the hidden layer neurons in RNNs model. LSTM networks filter information through the gate structure to maintain and update the state of memory cells. The input, forget, and output gates are three main types of gate structure in a memory cell. Each memory cell in an LSTM-based model has two types of nonlinear activation function: sigmoid and tanh functions. Fig. 4 shows the diagram for a memory cell at the time step t.
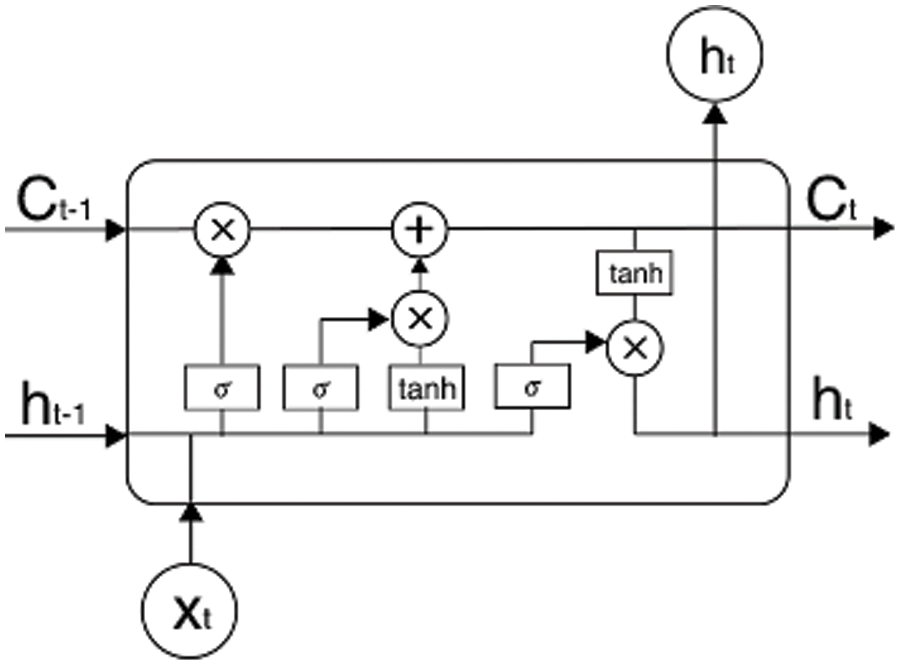
Figure 4: A memory cell at the time step t
The forget gate in a memory cell provides which cell state information will be discarded. In Fig. 4, the memory cell takes
In Eq. (2),
The input gate identifies how much of the current moment input
The output gate determines how much of the current cell state will be discarded. The output information,
Then the cell state (
LSTM network only analysis one directional of a sequence which leads to reduce its effectiveness. Meanwhile, both forward and backward directional information on the sequence may contain interesting patterns. Therefore, Bi-LSTM which considers both forward and backward directions in the sequence [34] was introduced. This model’s fundamental idea is that it looks at a particular sequence from the front-to-back and back-to-front. In which an LSTM layer is for forwarding processing while the remaining layer is for backward processing. In this way, the network could capture the change of PM2.5 concentrations in both its past and future.
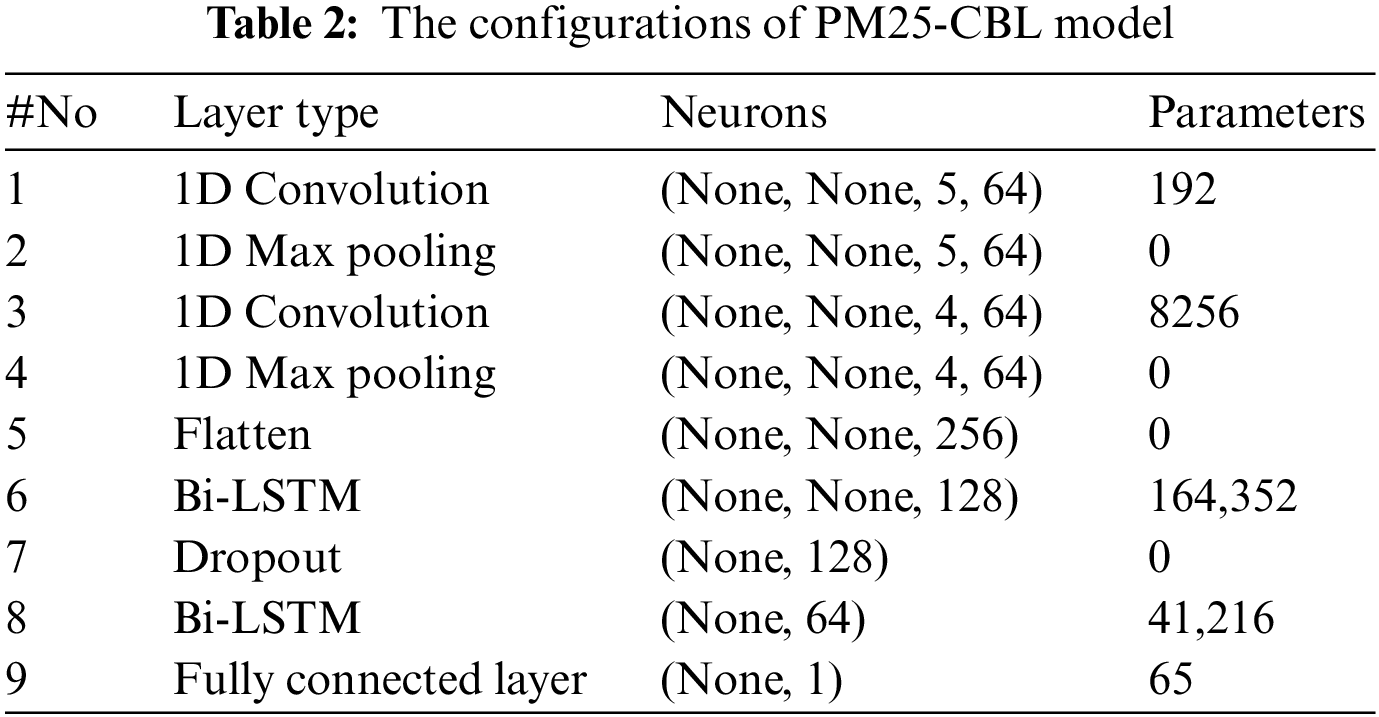
Fully connected module. Finally, the outputs of Bi-LSTM are fed to the fully connected module which consists of a fully connected layer to generate the PM2.5 concentrations, which helps to reduce the learning parameters in the model instead of following many fully connected layers. Finally, the configurations of the PM25-CBL model are presented in Table 2.
This section evaluates our approach and several state-of-the-art models for time series prediction including LSTM, Bi-LSTM, CNN, CNN-Bi-LSTM, CNN-LSTM and ARIMA for Air Quality HCMC dataset. The above methods are implemented in the Keras framework and executed in the Ubuntu computer with an Intel Core i7-4790 K (4.0 GHz × 8 cores), 32 GB of RAM, and GeForce GTX 1080 Ti. To demonstrate the effectiveness of PM25-CBL model, the Air Quality HCMC dataset is divided into 5-folds with 20% for testing set and the remaining of this dataset for training set. This study utilizes four following common performance metrics to compare the experimental methods.
The first metric, MSE, is the average squared difference between the predicted values given by the machine learning model and the actual values. Meanwhile, the second metric namely RMSE is the square root of the MSE. They are determined by the following equations.
Next, MAE gives the average magnitude of the prediction errors and ignores their directions by the absolute operator. Meanwhile, MAPE provides prediction accuracy in the percentage of a forecasting method. The following equations can obtain them.
Firstly, the loss values during training and testing phases were tracked, which are shown in Fig. 5. The results confirm that the loss of training and testing phases are stable after 20 epochs. Therefore, our model will be trained in 20 epochs. Besides, this study utilizes batch size at 30 and Adam optimizer for PM25-CBL model. The Adam optimizer has an initial learning rate of 0.001.
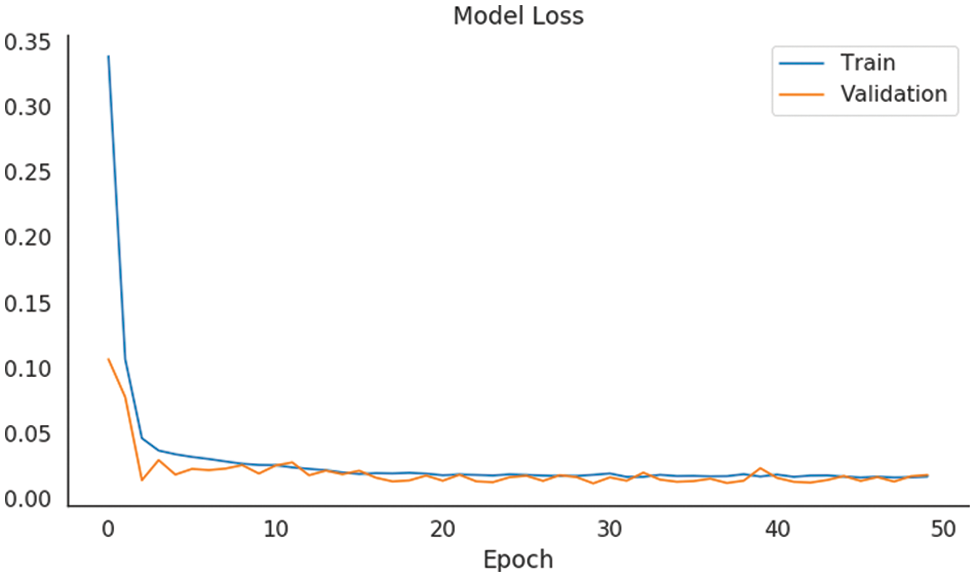
Figure 5: The loss values of PM25-CBL model in training and testing phases
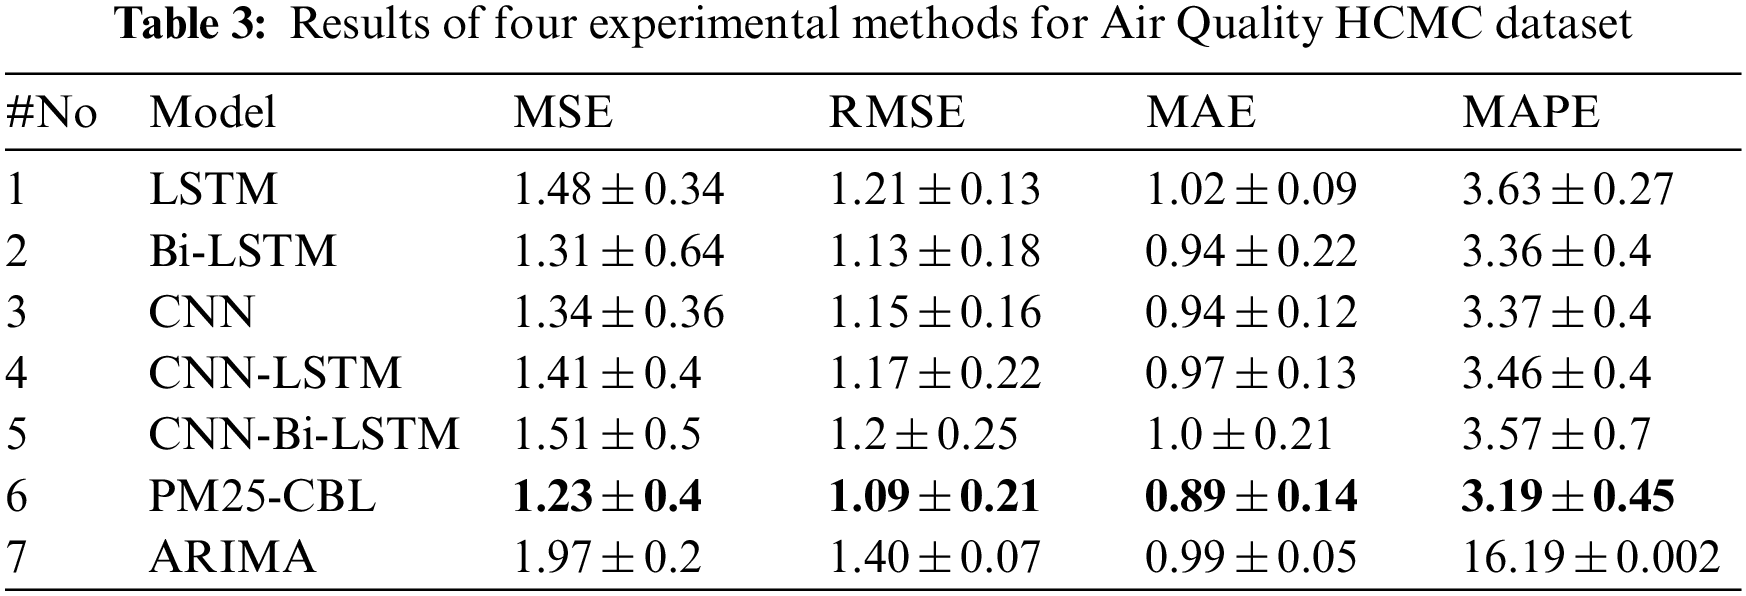
Secondly, this section reports the performances of the experimental methods, including LSTM, Bi-LSTM, CNN, CNN-LSTM, CNN-Bi-LSTM, ARIMA and the proposed approach for the Air Quality HCMC dataset in terms of MSE, RMSE, MAE, and MAPE. The experimental results in Table 3 show that our approach achieves the best values of MSE, RMSE, MAE, and MAPE at 1.23, 1.09, 0.89, and 3.19, respectively. For the MSE metric, the proposed approach improves 12.7% compared with CNN-LSTM, improves 6.1% compared with Bi-LSTM, improves 16.9% compared with LSTM, improves 8.2% compared with CNN, improves 18.5% compared with CNN-Bi-LSTM, and improves 37.6% compared with ARIMA. Likewise, our approach improves from 3.5% to 22% in the RMSE metric, from 5.3% to 12.7% in the MAE metric, and from 5% to 80% in the MAPE metric compared with the remaining experimental methods. Therefore, the proposed method outperforms LSTM, Bi-LSTM, CNN, CNN-LSTM, CNN-Bi-LSTM, and ARIMA models in all performance metrics.
Finally, this study evaluates the processing time of the experimental methods for the Air Quality HCMC dataset. Table 4 indicates that CNN is the best method in both training time and predicting time with 1.31 and 0.027 s, respectively. CNN-LSTM reached 2nd place with 3.255 and 0.107 s for training time and predicting time, respectively. LSTM achieved 3rd place with 3.302 and 0.124 s for training time and predicting time. The proposed method is 4th place with insignificant time gaps compared with the two above methods. Specifically, PM25-CBL is 0.149 s slower than the CNN-LSTM method in training time and 0.063 s in testing time, but it is faster CNN-Bi-LSTM with 1.496 s for training time. Bi-LSTM is the worst method in terms of processing time, with 5.679 and 0.234 for training time and testing time, respectively.
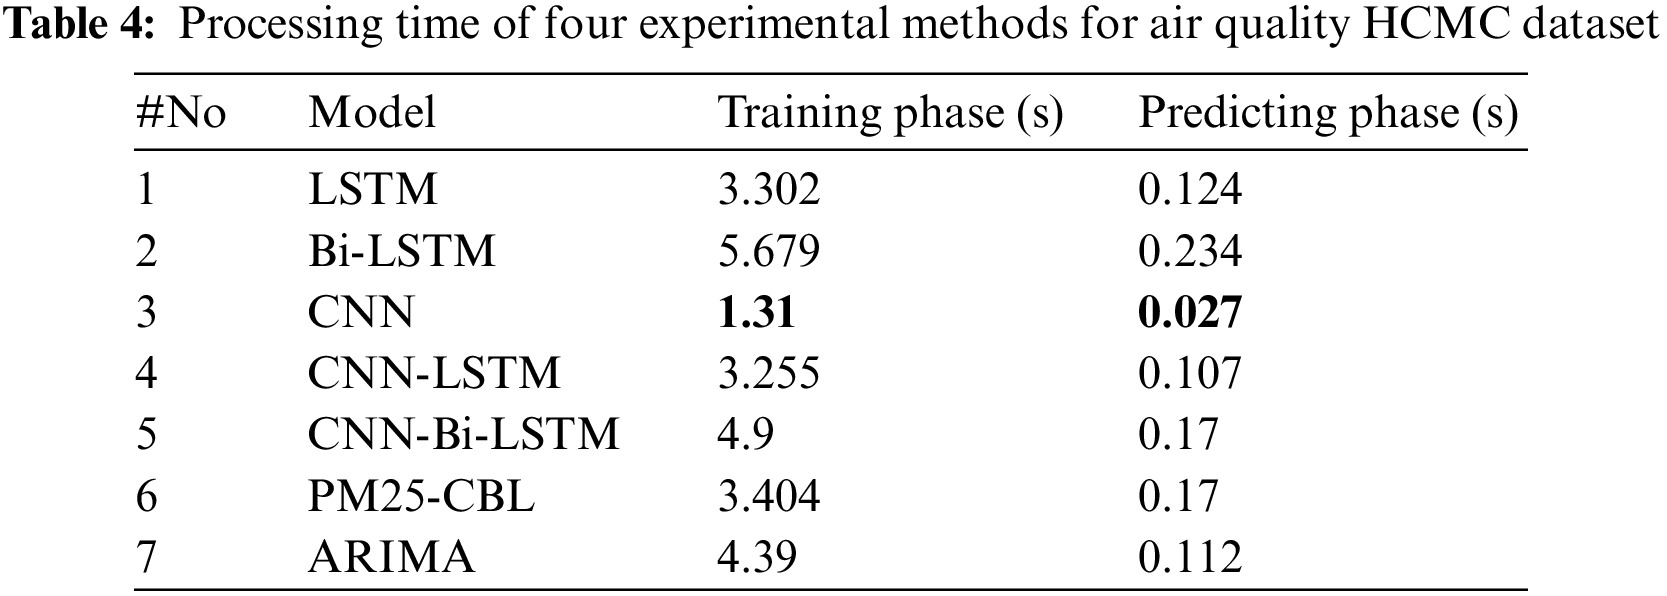
The experimental results on processing time indicate that the proposed method has not achieved the best training and predicting time. It has twice the training time as the best model (CNN). However, training time of the proposed method only takes 3.4 s. This is not significant when hardware has evolved dramatically. In addition, the proposed method achieves the best results in accuracy with MSE, RMSE, MAE, and MAPE metrics. Obviously, with the improvements in terms of performance, the processing time of the proposed method is acceptable compared with CNN, LSTM, Bi-LSTM, CNN-LSTM, and ARIMA models. With the above analysis, the advantage of the proposed model is about predictability while the limitation of the model is the training time. However, the time difference between the methods is not significant., therefore, the proposed method is recommended to be integrated in smart environmental monitoring to automatically provide forecasts for citizens when PM2.5 concentrations reach dangerous thresholds in smart city.
Currently, this study developed a deep learning model for prediction PM2.5 concentration prediction applied in Ho Chi Minh City, Vietnam. Therefore, it is necessary to conduct the study to interact with this model to the system to be able to use it in practice. In addition, the collection of features is still very limited, leading to low accuracy. Therefore, it is necessary to collect more information regarding the environment in the future.
This study developed a hybrid deep learning approach named PM25-CBL model for PM2.5 concentration prediction in Ho Chi Minh City, Vietnam. This study first analyzed the effects of variables on PM2.5 concentrations in the Air Quality HCMC dataset which helps to choose the best variables. Secondly, the PM25-CBL model that integrates CNN and Bi-LSTM is developed. The PM25-CBL model consists of three following modules: CNN, Bi-LSTM, and Fully connected modules. Finally, this study conducts the experiment to compare the performance of the proposed approach and three state-of-the-art frameworks for time series prediction including LSTM, Bi-LSTM, CNN, CNN-LSTM, CNN-Bi-LSTM, and ARIMA. The empirical results confirm that PM25-CBL model outperforms other experimental methods for Air Quality HCMC dataset in terms of several common metrics including MSE, RMSE, MAE, and MAPE.
For future work, we focus on improving the PM2.5 concentration prediction model’s performance by applying several advanced techniques such as evolutionary algorithms to the proposed approach. In addition, the Air Quality datasets in several cities in Vietnam are collected to verify the proposed model.
Funding Statement: The authors received no specific funding for this study.
Conflicts of Interest: The authors declare that they have no conflicts of interest to report regarding the present study.
References
1. T. Le, B. Vo, H. Fujita, N. T. Nguyen and S. W. Baik, “A fast and accurate approach for bankruptcy forecasting using squared logistics loss with GPU-based extreme gradient boosting,” Information Sciences, vol. 494, pp. 294–310, 2019. [Google Scholar]
2. T. Le, “A comprehensive survey of imbalanced learning methods for bankruptcy prediction,” IET Communications, vol. 16, no. 5, pp. 433–441, 2022. [Google Scholar]
3. Q. H. Doan, T. Le and D. K. Thai, “Optimization strategies of neural networks for impact damage classification of RC panels in a small dataset,” Applied Soft Computing, vol. 102, pp. 107100, 2021. [Google Scholar]
4. H. A. Vo, H. S. Le, M. T. Vo and T. Le, “A novel framework for trash classification using deep transfer learning,” IEEE Access, vol. 7, no. 1, pp. 178631–178639, 2019. [Google Scholar]
5. M. T. Vo, R. Sharma, R. Kumar, H. S. Le, B. T. Pham et al., “Crime rate detection using social media of different crime locations and Twitter part-of-speech tagger with Brown clustering,” Journal of Intelligent and Fuzzy Systems, vol. 38, no. 4, pp. 4287–4299, 2020. [Google Scholar]
6. A. Kocheturov, P. Momcilovic, A. Bihorac and P. M. Pardalos, “Extended vertical lists for temporal pattern mining from multivariate time series,” Expert Systems, vol. 36, no. 5, pp. e12448, 2019. [Google Scholar] [PubMed]
7. Q. Gu and Q. Dai, “A novel active multi-source transfer learning algorithm for time series forecasting,” Applied Intelligence, vol. 51, no. 3, pp. 1326–1350, 2021. [Google Scholar]
8. T. Le, M. T. Vo, B. Vo, E. Hwang, S. Rho et al., “Improving electric energy consumption prediction using CNN and Bi-LSTM,” Applied Sciences, vol. 9, no. 20, pp. 4237, 2019. [Google Scholar]
9. T. Le, M. T. Vo, T. Kieu, E. Hwang, S. Rho et al., “Multiple electric energy consumption forecasting using a cluster-based strategy for transfer learning in smart building,” Sensors, vol. 20, no. 9, pp. 2668, 2020. [Google Scholar] [PubMed]
10. H. A. Vo, T. Nguyen and T. Le, “Brent oil price prediction using Bi-LSTM network,” Intelligent Automation & Soft Computing, vol. 26, no. 6, pp. 1307–1317, 2020. [Google Scholar]
11. Y. Zhang, B. Yan and A. Memon, “A novel deep learning framework: Prediction and analysis of financial time series using CEEMD and LSTM,” Expert Systems with Applications, vol. 159, pp. 113609, 2020. [Google Scholar]
12. M. T. Vo, D. Vu, H. Nguyen, H. Bui and T. Le, “Predicting monthly household water consumption,” in Proc. of Int. Conf. on Computing and Communication Technologies, Ho Chi Minh City, Vietnam, pp. 720–724, 2022. [Google Scholar]
13. P. Y. Wong, H. Y. Lee, Y. C. Chen, Y. T. Zeng, Y. R. Chern et al., “Using a land use regression model with machine learning to estimate ground level PM2.5,” Environmental Pollution, vol. 277, pp. 116846, 2021. [Google Scholar] [PubMed]
14. A. Bozdağ, Y. Dokuz and O. B. Gökçek, “Spatial prediction of PM10 concentration using machine learning algorithms in Ankara, Turkey,” Environmental Pollution, vol. 263, pp. 114635, 2020. [Google Scholar] [PubMed]
15. T. Global Burden of Diseases, Injuries, and Risk Factors Study 2015. https://publichealth.wustl.edu/global-burden-diseases-injuries-risk-factors-study-2015, accessed on November 18, 2022. [Google Scholar]
16. D. Zhang and S. S. Woo, “Real time localized air quality monitoring and prediction through mobile and fixed IoT sensing network,” IEEE Access, vol. 8, pp. 89584–89594, 2020. [Google Scholar]
17. M. Zeinalnezhad, A. G. Chofreh, F. A. Goni and J. J. Klemeš, “Air pollution prediction using semi-experimental regression model and Adaptive Neuro-Fuzzy Inference System,” Journal of Cleaner Production, vol. 261, pp. 121218, 2020. [Google Scholar]
18. D. Schürholz, S. Kubler and A. Zaslavsky, “Artificial intelligence-enabled context-aware air quality prediction for smart cities,” Journal of Cleaner Production, vol. 271, pp. 121941, 2020. [Google Scholar]
19. J. Ma, Z. Li, J. C. Cheng, Y. Ding, C. Lin et al., “Air quality prediction at new stations using spatially transferred bi-directional long short-term memory network,” Science of the Total Environment, vol. 705, pp. 135771, 2020. [Google Scholar] [PubMed]
20. Y. S. Chang, H. T. Chiao, S. Abimannan, Y. P. Huang, Y. T. Tsai et al., “An LSTM-based aggregated model for air pollution forecasting,” Atmospheric Pollution Research, vol. 11, no. 8, pp. 1451–1463, 2020. [Google Scholar]
21. A. J. Cohen, H. R. Anderson, B. Ostro, K. D. Pandey, M. Krzyzanowski et al., “The global burden of disease due to outdoor air pollution,” Journal of Toxicology and Environmental Health, Part A, vol. 68, no. 13–14, pp. 1301–1307, 2005. [Google Scholar] [PubMed]
22. R. Feng, H. Gao, K. Luo and J. R. Fan, “Analysis and accurate prediction of ambient PM2. 5 in China using multi-layer perceptron,” Atmospheric Environment, vol. 232, pp. 117534, 2020. [Google Scholar]
23. J. Ma, Z. Yu, Y. Qu, J. Xu and Y. Cao, “Application of the XGBoost machine learning method in PM2. 5 prediction: A case study of Shanghai,” Aerosol and Air Quality Research, vol. 20, no. 1, pp. 128–138, 2020. [Google Scholar]
24. X. Wang, J. Yuan and B. Wang, “Prediction and analysis of PM2. 5 in Fuling District of Chongqing by artificial neural network,” Neural Computing and Applications, vol. 33, pp. 517–524, 2021. [Google Scholar]
25. U. Pak, J. Ma, U. Ryu, K. Ryom, U. Juhyok et al., “Deep learning-based PM2. 5 prediction considering the spatiotemporal correlations: A case study of Beijing, China,” Science of the Total Environment, vol. 699, pp. 133561, 2020. [Google Scholar] [PubMed]
26. Y. Xu and H. Liu, “Spatial ensemble prediction of hourly PM2. 5 concentrations around Beijing railway station in China,” Air Quality, Atmosphere & Health, vol. 13, no. 5, pp. 563–573, 2020. [Google Scholar]
27. W. Sun and Z. Li, “Hourly PM2. 5 concentration forecasting based on feature extraction and stacking-driven ensemble model for the winter of the Beijing-Tianjin-Hebei area,” Atmospheric Pollution Research, vol. 11, no. 6, pp. 110–121, 2020. [Google Scholar]
28. D. R. Liu, Y. K. Hsu, H. Y. Chen and H. J. Jau, “Air pollution prediction based on factory-aware attentional LSTM neural network,” Computing, vol. 103, pp. 75–98, 2021. [Google Scholar]
29. J. Ma, Y. Ding, J. C. Cheng, F. Jiang, V. J. Gan et al., “A Lag-FLSTM deep learning network based on Bayesian optimization for multi-sequential-variant PM2. 5 prediction,” Sustainable Cities and Society, vol. 60, pp. 102237, 2020. [Google Scholar]
30. X. Xu, T. Tong, W. Zhang and L. Meng, “Fine-grained prediction of PM2. 5 concentration based on multisource data and deep learning,” Atmospheric Pollution Research, vol. 11, no. 10, pp. 1728–1737, 2020. [Google Scholar]
31. Dataset on Air Quality in Vietnam in 2020. https://data.opendevelopmentmekong.net/dataset/timelines-dataset-on-air-quality-in-vietnam, accessed on February 18, 2021. [Google Scholar]
32. G. Lai, W. C. Chang, Y. Yang and H. Liu, “Modeling long- and short-term temporal patterns with deep neural networks,” in Proc. of Int. ACM SIGIR Conf. on Research & Development in Information Retrieval, Ann Arbor, MI, USA, pp. 95–104, 2018. [Google Scholar]
33. S. Hochreiter and J. Schmidhuber, “Long short-term memory,” Neural Computation, vol. 9, no. 8, pp. 1735–1780, 1997. [Google Scholar] [PubMed]
34. A. Graves and J. Schmidhuber, “Framewise phoneme classification with bidirectional LSTM and other neural network architectures,” Neural Networks, vol. 18, no. 5–6, pp. 602–610, 2005. [Google Scholar] [PubMed]
Cite This Article
 Copyright © 2023 The Author(s). Published by Tech Science Press.
This work is licensed under a Creative Commons Attribution 4.0 International License , which permits unrestricted use, distribution, and reproduction in any medium, provided the original work is properly cited.
 Downloads
 Citation Tools