
 Submit a Paper
 Propose a Special lssue
 Open Access
ARTICLE

Deep Learning Framework for Landslide Severity Prediction and Susceptibility Mapping
Department of Computer Science and Engineering, SRM Institute of Science and Technology, Vadapalani Campus, 600026, Tamil Nadu, India
* Corresponding Author: G. Bhargavi. Email:
Intelligent Automation & Soft Computing 2023, 36(2), 1257-1272. https://doi.org/10.32604/iasc.2023.034335
Received 14 July 2022; Accepted 14 October 2022; Issue published 05 January 2023
 View Full Text
 Download PDF
Abstract
Landslides are a natural hazard that is unpredictable, but we can prevent them. The Landslide Susceptibility Index reduces the uncertainty of living with landslides significantly. Planning and managing landslide-prone areas is critical. Using the most optimistic deep neural network techniques, the proposed work classifies and analyses the severity of the landslide. The selected experimental study area is Kerala’s Idukki district. A total of 3363 points were considered for this experiment using historic landslide points, field surveys, and literature searches. The primary triggering factors slope degree, slope aspect, elevation (altitude), normalized difference vegetation index (NDVI), and distance from road, lithology, and rainfall are considered. A landslide susceptibility map was generated using the Arc geographic information system (GIS) tool for all the triggering factors using frequency ratio method, Shannon entropy method, Relative effect method, and fuzzy logic method. A new Deep Neural Network (DNN) framework has been developed for the multiclass classification and prediction of landslide hazard zones as low, moderate, high, and very high. Existing works are only uses statistical methods, but the proposed work has used DNN to predict landslide severity at four different level even for semi data with over accurately. The training data for deep learning model are generated using the Sentinel Satellite images and field survey. The label for training the data are generated from the Landslide Susceptibility Index which are generated from statistical method. Among all the statistical method generated data the Shannon Entropy data is the most accurate of the four statistical methods achieves 99.16%, accuracy. The frequency ratio method based data achieves 97.08% accuracy, the relative effect method based data achieves 92.72% accuracy, and the Fuzzy logic method based data achieves 86.60% accuracy.Keywords
Landslides can occur as a result of natural characteristics that influence slope stability, as well as subsequent and triggering factors that can be caused by either natural or anthropogenic factors [1]. There appear to be significant regional and global impacts, such as decreased agricultural productivity, increased soil eroding, habitat destruction and death tolls, and infrastructure damage due to landslides [2]. An avalanche is the result of a slope spreading due to gravity; however, the development can be caused by a variety of factors such as precipitation, quakes, and disintegration. The southern region of India, particularly Kerala, has long been a center of landslide research. An overview of current research into landslide analysis and prediction using satellite images and other Artificial Intelligence approaches are presented. The article focuses [3] on creating a landslide inventory dataset for Kerala’s 2018 rainfall patterns occurrence using visual interpretation of pre-and post-event data on Google Earth Engine. The potential triggering factors for landslides in Kerala are thoroughly discussed. The article [4] focused on the importance of having a distinct training and testing ratio when creating a model for landslide susceptibility mapping. Various train and test ratios were used, including 50:50, 60:40, 70:30, and 80:20.
The Landslides Inventory, according to Martha et al. [5], is required to determine the extent of the damage. It is critical for estimating hazards and prioritizing recovery and relief efforts. The affected area can be mapped and assessed using high-resolution satellite images.
Amatya et al. [6] gives us a glimpse of landslide detection. As the first stage of quick risk assessment and mitigation, this detection is required. When using landslide mapping, the landslide vulnerability region is retrieved using open-source tools. Landslide areas are classified based on their spectral characteristics. Image segmentation is used, then non-susceptible areas are removed using an object-based approach to detect the change, and the output is extracted and classified using an unsupervised algorithm to cluster the objects in an image.
The GIS-Based Slope Unit Approach is used by Baeza et al. [7]. In a landslide inventory, k represents a cluster that splits the region into landslides and non-landslides. As training data for the landslide prediction modeling, the segmented data with the corresponding sample dimension are chosen randomly.
Dikshit et al. [8] gives a concise explanation of the diverse phase of landslides as well as the parameters that influence landslide incidence. Identification, prediction, and patterned classification are important steps in pre and post landslide investigation [9]. Researchers have attempted to clarify landslides and their outcomes using advanced image processing techniques in earth science and made it easy to access high spatial and multi-temporal satellite images. Pre and post-landslide image Transformation detection, image comparison, and the digitization of Digital Elevation Model (DEM) generation is the essential technique for identifying landslides. The existing work focuses on the development and preparation of slope instability in order to calculate landslide estimation, which ultimately reduces risk.
The existing research has not analyzed the major triggering factors that cause landslides, nor has it detailed the severity of the landslide, which is the most important factor in risk assessment and mitigation. There is a massive disconnect between landslide susceptibility mapping and risk assessment. Using satellite images and field survey data, the proposed work classifies and analyses the severity of the landslide. The proposed work emphasizes the development and anticipation of landslide hazards to quantify landslide estimation, eventually reduces the risk.
The following describes the general layout of the research article. Section 2 describes the Study area selection for the experimental work. Section 3 explains the overall architecture of the proposed work Section 4 confines the collection of dataset and preparation of spatial database. Section 5 explains an extensive view of various statistical modeling approaches for landslide susceptibility mapping, and Section 6 specifies the DNN model, parameters tuning and their results. The paper concludes with Section 7 with key findings and future scope of the work.
Devikulam, Idukki located in Kerala, India has been chosen as the study region for this proposed work due to the following reasons.
• Due to persistent torrential rainfall, the Idukki district experienced unfavorable incidents during the 2018 Kerala landslides.
• The study area’s geographic structure is hilly, with undulating roads. This region’s loose red soil and steep surface would then result in debris flow.
• Anthropogenic exercises, which have been expanding and causing uncultivated inclines to fluctuate, are aggressively growing in the study area.
As a result, there is a need to prepare a landslide powerlessness map for the area that organizers and risk managers can use.
Geospatial computation and a vulnerable range map were used to perform a landslide risk zonation analysis in a portion of the Idukki area. The Geography Survey of India lists 5191 notable landslides in Kerala, with 3363 landslides known in the Idukki geographical area by itself. After the 2020 landslide disaster, a total of eight major landslide areas were identified and field observations were conducted in April 2022. The primary causes of these landslides were unusually severe storms, unplanned structural developments, and urbanisation. Before proceeding with the classification process, these field data were compared with the satellite image to determine data compatibility. The field research documents the Landslides, which include debris flows, debris slides, subsidence, creep, and so on. According to press reports, the Idukki district was the worst affected, with over 500 landslides on profitability land and over 1000 landslides within tropical forests [10]. The satellite image of the research area is shown in Fig. 1. with some field observation images.
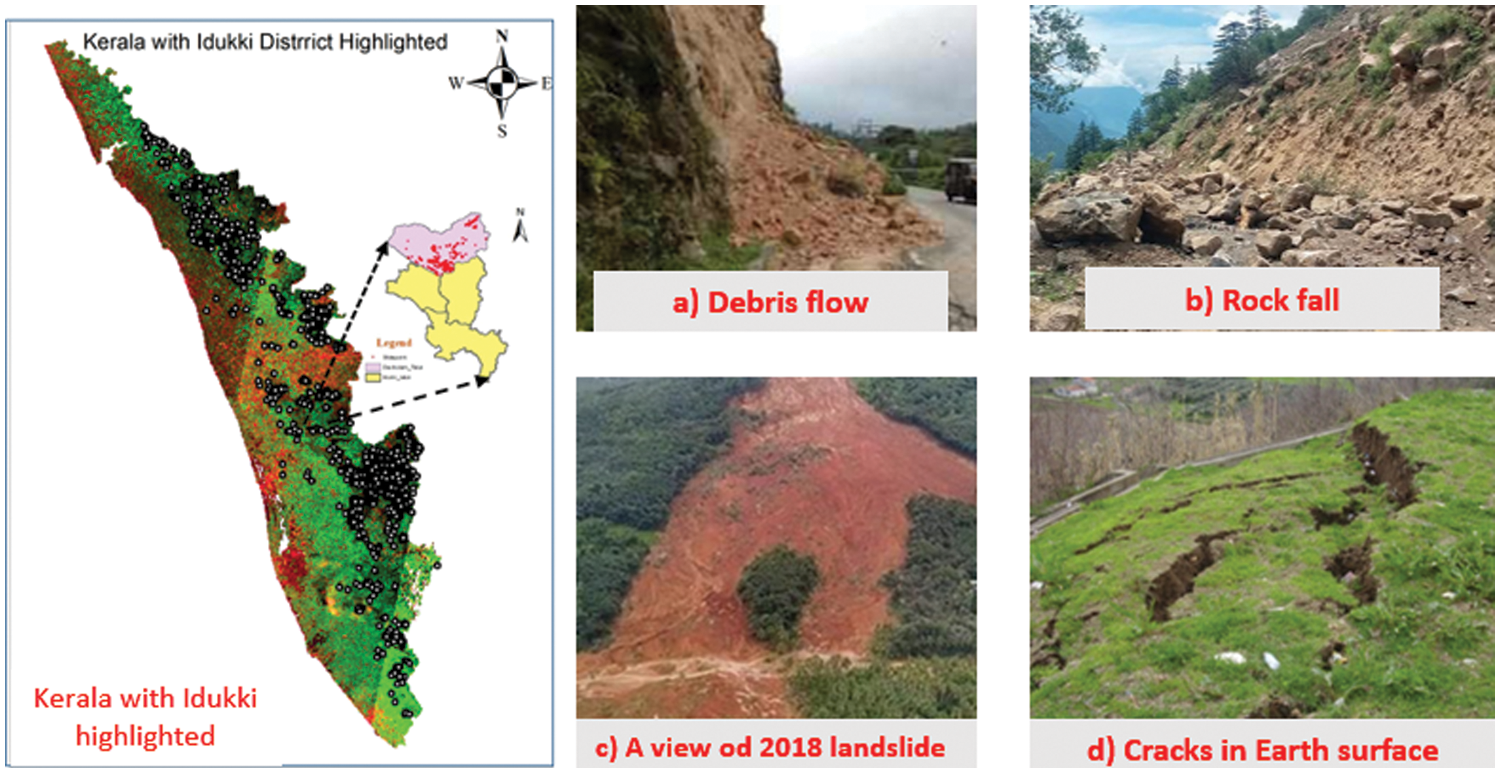
Figure 1: Idukki district (highlighted) from Kerala.1 a) Field survey image for debris flow, b) rock fall, c) A long view of 2018 landslide and d) tension crack in the surface
In this selected study area, the research work is carried out for landslide detection and classification with the following contribution.
1. Using statistical methods such as the frequency ratio method, Shannon entropy method, relative effect method, and fuzzy logic method, the Landslide susceptibility index are computed and incorporated into the map using ArcGIS tool for visualisation.
2. To classify and predict the severity ranges of the landslide, a DNN model is built with optimal parameter using parameter tuning.
The next section with various statistical method used for Landslide Susceptibility Indexing (LSI) generation is discussed.
The spatial database generates a landslide susceptibility mapping using a variety of techniques. This proposed work employs the frequency ratio method, Shannon entropy method, Relative effect method, and fuzzy logic method. The proposed work flow Fig. 2. is depicted in the architectural diagram. The raw data is gathered from satellite images and combined with the field survey data. The primary triggering factors for landslides were chosen for the study area based on the survey. All parameter maps were collected, pre-processed, and raster values were extracted using the ArcGIS tool. The spatial databases compute the relative weightage of all triggering factors using the Frequency Ratio method, Shannon Entropy method, Relative Effect method, and fuzzy logic method. The weight values of all parameters were entered into a raster calculator to generate the LSI. The DNN model uses the LSI values and parameter tuning as input data to classify and predict the occurrence of landslides.
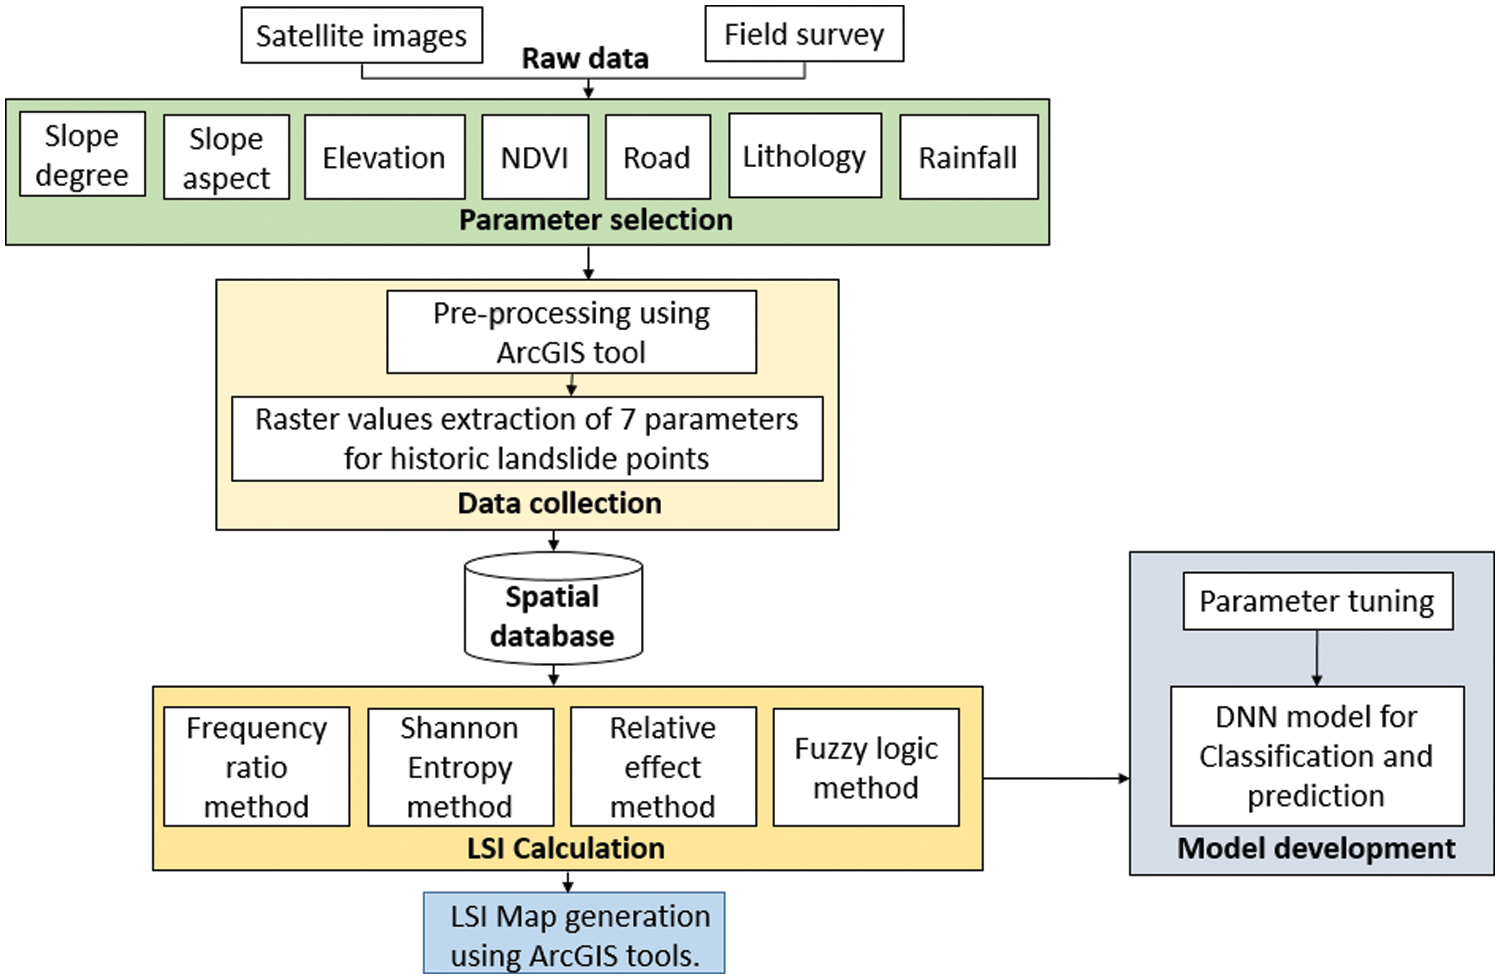
Figure 2: Architectural diagram of the landslide classification and prediction
According to the frequency ratio (FR) method, each of the landslide susceptibility stimulating factors has a distinct landslide frequency and intensity. The relationship connects the location of landslides to the factors that determine landslides in the study region [11]. The factors values are classified into 5 classes based on natural break sorting technique. The frequency ratio of each class in a geographical zone was calculated. The frequency ratio method was used to obtain the proximity of their affinity. In addition, the FR model succeeded in scoring best-suited triggering causes based on their ability to manage landslide occurrences. As a result, the number of landslide incidence pixels (parameter values) in the area must be calculated using a combination of triggering factors. These parameter values are calculated using Geological information system image maps from Bhuvan website. All the individual parameter maps with landslide values are downloaded from this website and fetch together into ArcGIS tool for calculating the landslide incidence pixel. The ArcGIS tool has in built function for combining all the triggering factor pixel values and produces the number of landslide incidence pixels (parameter values). This ArcGIS tool utilised for determining the landslide parameter values using historic landslide values.
The correlation was estimated for every factor by dividing the landslide occurring ratio by the ratio for every class of supposed trigger factors. A ratio for each class identifies the extent of correlation assigned to landslide incidences by the individual aspects. The pixel of the landslide occurrence factor GIS layer is considered landslide susceptible. The pixel values are in the 0 to 1 range. The value 0 denotes a non-landslide area while the value 1 denotes a landslide area. The below Eq. (1) calculates the frequency ratio values.
The Xi represents the Percentage of Landslide Pixel in Class and Yi represents percentage of Pixel in Class. X represents total number of landslide in the Idukki district, Y represents the no. of total pixels in the Idukki district. The landslide susceptibility value implies the general risk of a landslide.
Shannon’s entropy (SE) assess the effect of driving factors on the occurrence of landslides [12]. In landslide vulnerability estimation, SE assumes to mitigate the impact of parameter interpretation within the prescribed zone based on empirical weights assigned to sub-categories of the various parameters [13]. It only considers the weight value of the frequency ratio method to generate the value of the Shannon entropy. Landslide susceptibility index is figured by adding the Shannon entropy values of the 7 considered parameters. The greater the weight of Shannon entropy’s LSI, the greater the effect of parameters in triggering landslides [14]. Shannon’s entropy determines the parameter that has the greatest impact on the possibility of a landslide. Fig. 3 represents the LSI of the Shannon entropy method. It is acquired through the ArcGIS tool by adding all the parameter maps of the study area. The following Eqs. (2)–(4) is used to calculate the weightage of factors responsible.
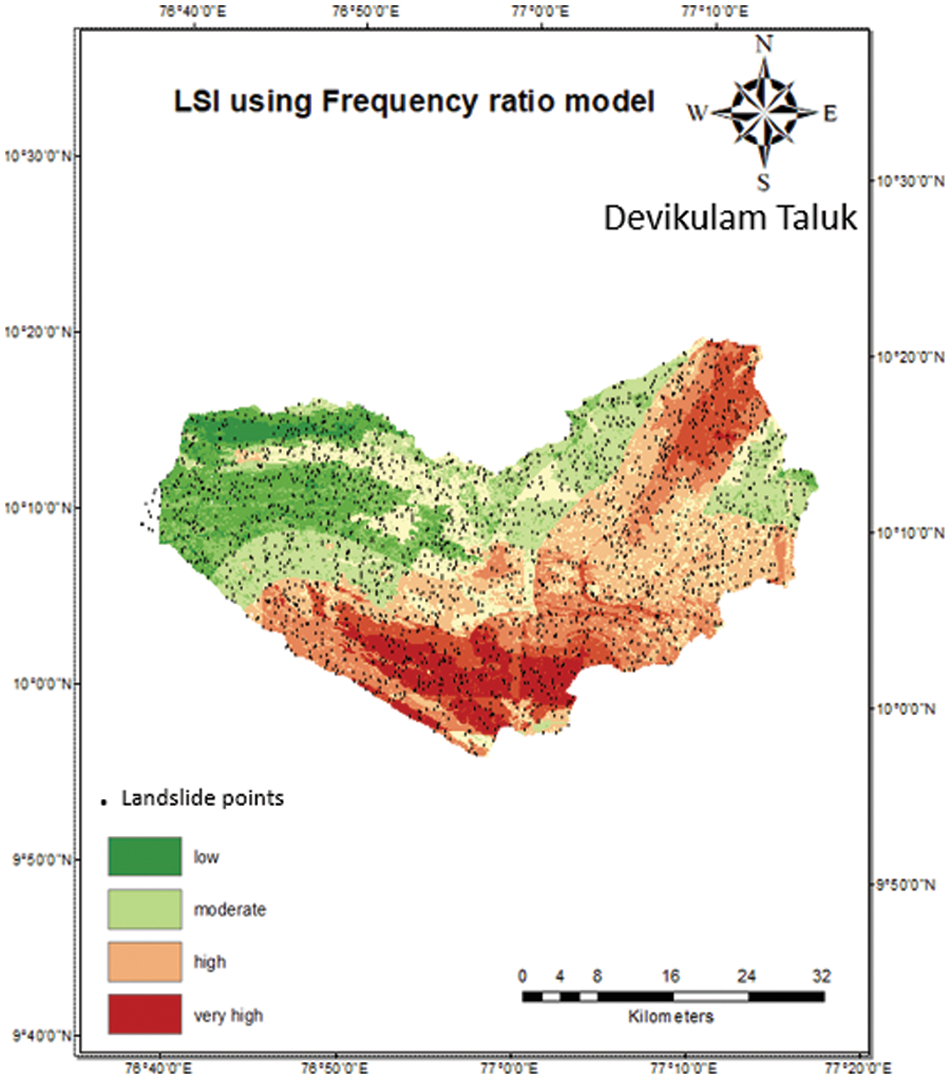
Figure 3: LSI map using frequency ratio model on ArcGIS tool
The Pij is the probability density for each class. Mj is the number of landslide occurrence, Ej is the entropy value, Wj is weightage of causative factors. Using this Wj we should calculate the individual weight of all parameters. The FR values is calculated using the above Eq. (1) represents the frequency ratio which can be utilised to calculate the probability density of each class in Eq. (2). It is required to calculate the entropy value which shows the amount of information present in the every individual parameter. These information can be used as amount of contributing element to make accurate classification. Using this entropy weight of each parameter is calculated according to amount of contribution. More weight values are assigned for more information contributing (entropy) triggering factor. Less weight values are assigned to less information contributing (entropy) triggering factor.
This model depicts the spatial relationships between the landslide event (E) occurring region and the triggering factors (F) that lead to the occurrence of landslides. Each parameter thematic maps are layered together to find LSI [15]. For each parameter, a unit area and landslide points will be considered to calculate the relative effect (RE). The below Eq. (5) defines the RE.
The ɛ is a value between 0 and 1 added to the logarithmic function frequency ratio. The ‘a’ represents a unit area and ‘A’ depicts the whole study area. The ‘sld’ represents no. of points in the unit area and the total number of points in the whole study area is denoted by ‘SLD’ [16]. The landslide susceptibility index (LSI) value is calculated by adding all the weight values of RE by using the Eq. (6) and all the parameter thematic layers are added together to generate the LSI of Relative effect method.
The pixel of the Geographic information System (GIS) layer of the landslide vulnerability component is supposed to be likely to be exposed to landslide in the fuzzy logic model [17]. The fuzzy logic weight values range between 0 and 1. The value 0 denotes ‘less vulnerable to landslide’ and 1 indicates ‘highly sensitive and prone to landslide’. The degree of membership of an individual cluster can be respective values scaling from 0 to 1. Subjective judgement will be used to approximate the degree of membership of an individual cluster [18]. These values can also be derived using Frequency ratio model in this case. We can also derive from multi-criteria decision analysis methods. Using Eq. (1), the frequency ratio weights for each class of the triggering factor were calculated. The historic landslide event occurring zone dataset was treated as a conditional variable, while geographical location factors with precipitation values (which have an impact on the landslide event) were treated as emancipated parameters [19].
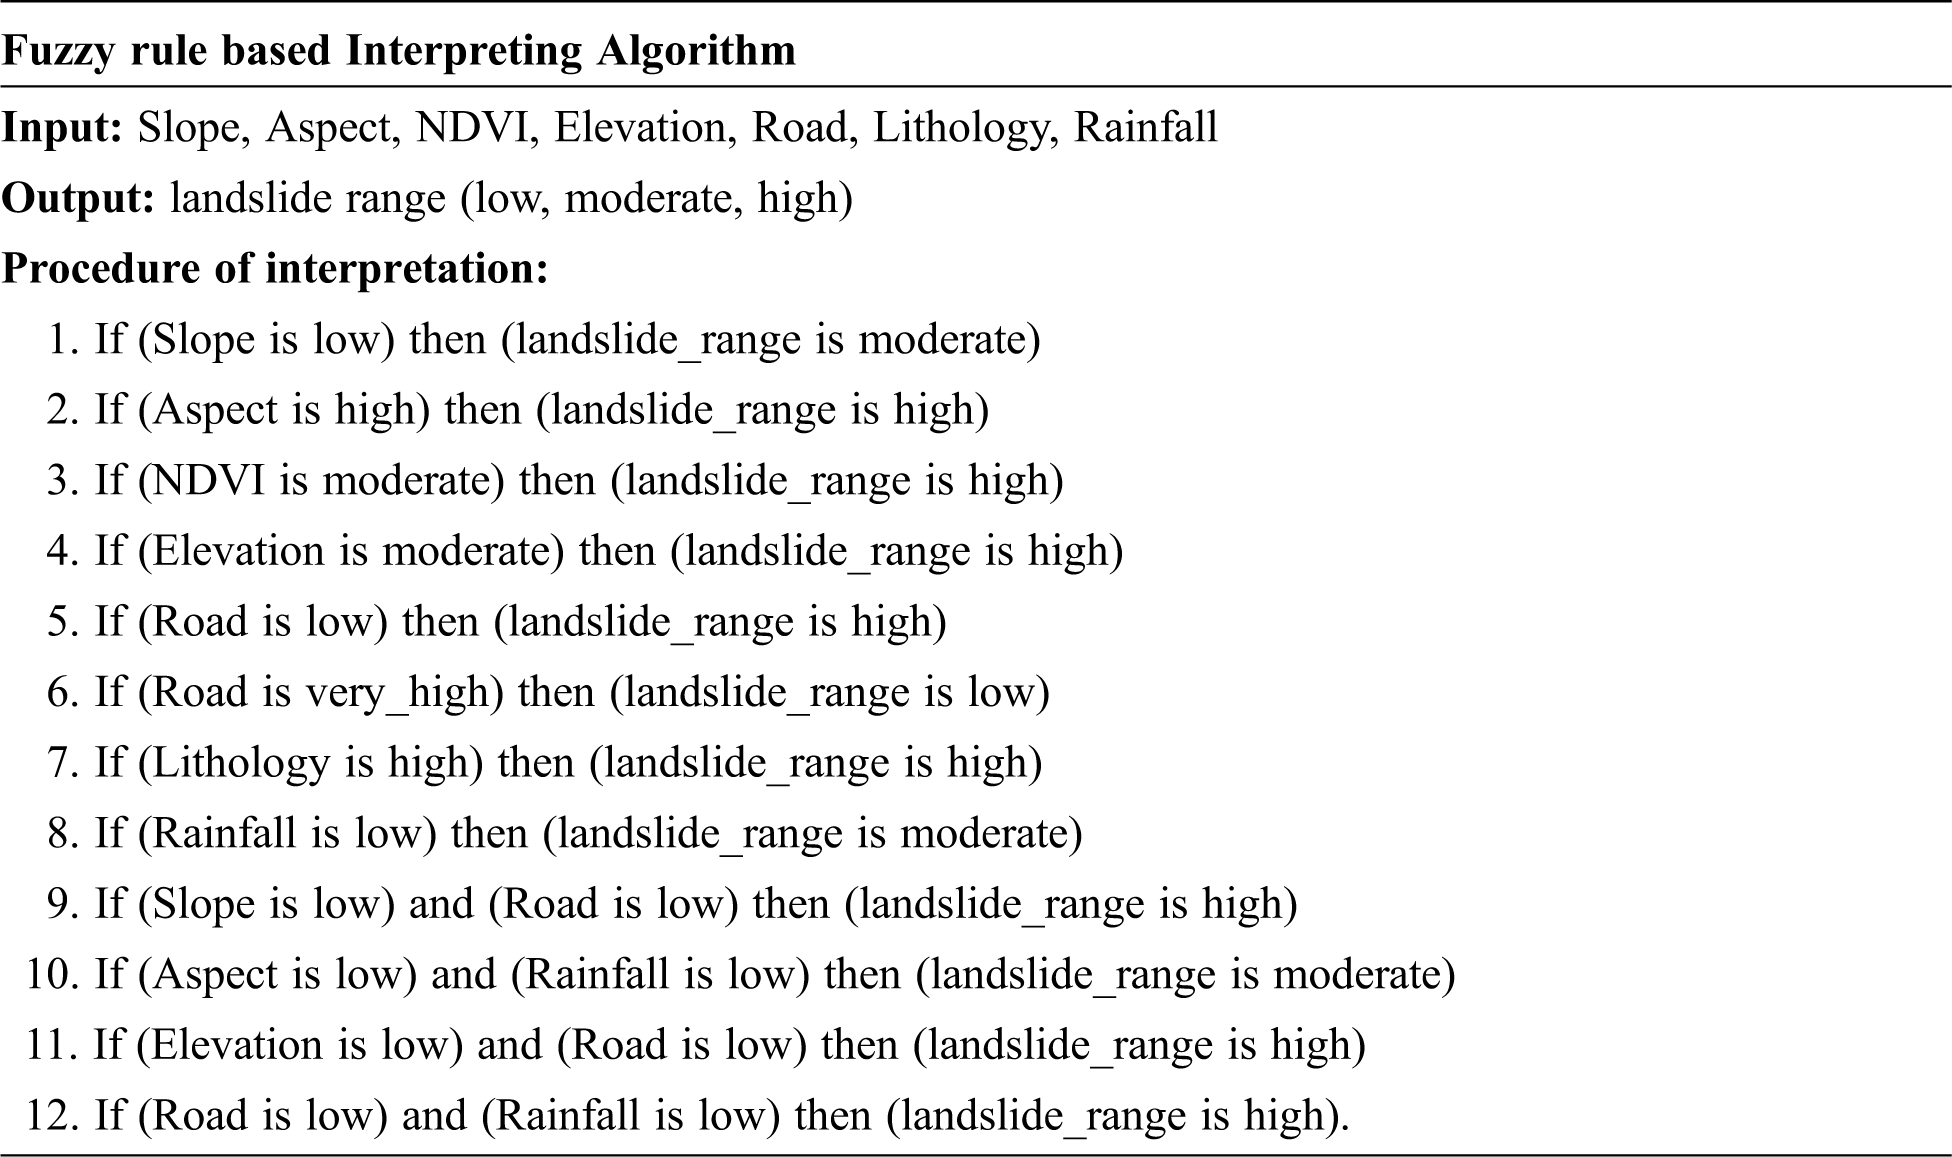
The fuzzy logic model is built with seven input data points, and the output is described by three membership functions, namely low, moderate, and high, using the triangular membership function. Fuzzy rules are used to infer the model. A set of rules are developed to assess the severity of the landslide. For this model, 195 rules were created. Some sample rules are listed below.
To fuzzify the landslide causes conflict, the Frequency ratio values with each class of landslide occurrence factors are regularised in [0,1] to address their enrolment rates degrees using Eq. (7).
The FM is the fuzzy model value; the minimum Frequency ratio value of the triggering factor is Min (FRij); the maximum Frequency ratio value of the triggering factor is Max (FRij); and the maximum and minimum normalisation limits are Max ((FMij)) and Min ((FMij)) [20]. As a result, membership functions for all triggering factors are obtained, and membership functions are assigned to each class of landslide occurrence factor [21]. To find the correlation between the factors chosen and the degree of membership in the landslide and non-landslide zones, membership functions were used [22]. The fuzzy triangular membership function is used to generate the membership function for landslide susceptibility mapping.
A fuzzy overlay approach can combine several reclassified triggering elements to assess the landslide hazard. Fuzzy Sum, product, AND, OR, and Gamma are types fuzzy operators used for incorporating the triggering elements [23]. The operator function ‘Fuzzy Sum’ is used to integrate the membership functions of the triggering elements in order to obtain the fuzzified susceptibility index, which represents the high probability of a landslide occurring or not. The use of the ‘Fuzzy Sum’ operator to integrate the membership functions was driven by the desire to obtain the largest value at each point in order to assess the persuasiveness variables distinguishing the likelihood of a landslide occurring. The ‘Fuzzy Sum’ operator is used in this proposed work to incorporate all of the membership functions of the landslide triggering components. The Eq. (8) was used to calculate the defuzzified landslide susceptibility index.
The µ {Slope angle, aspect, elevation, NDVI, Road, Lithology, Rainfall} is the weightage of the Fuzzy logic model. The Fig. 4 illustrates the LSI for the study area using fuzzy logic model. The fuzzy membership function for uncertainty is works between the factor accuracy and the landslide classification. It differs in terms of the membership function [24]. Before classification, the fuzzy logic method computes the uncertainty membership function for each landslide point in proportion to the total number of occurrences. In contrast to other algorithms that classify landslides without considering the uncertainty value or each category, this relationship is critical in determining the triggering factor.
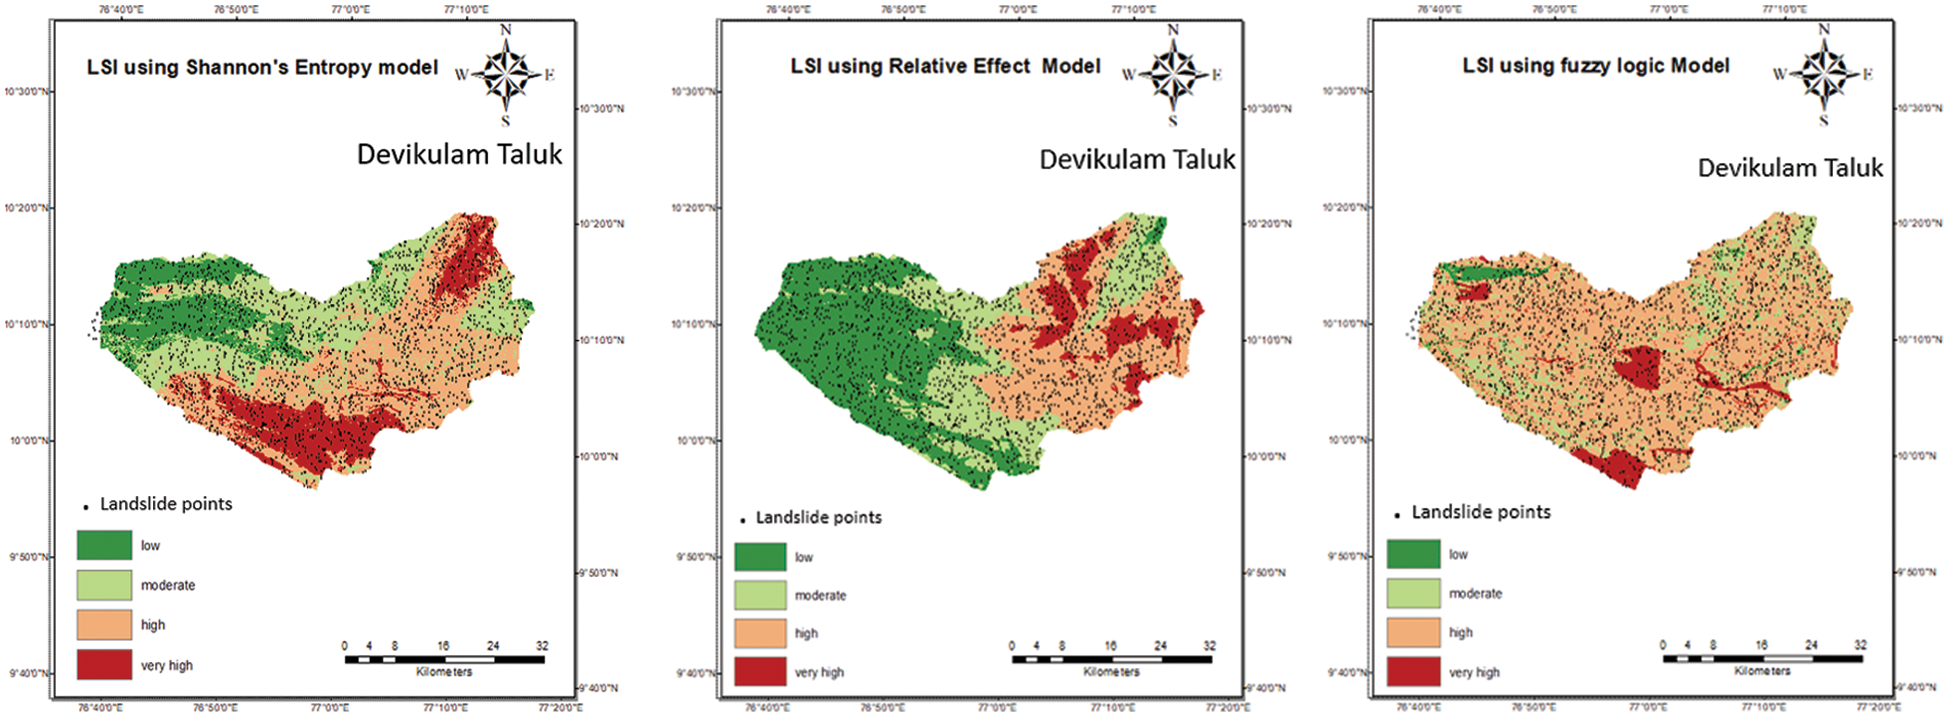
Figure 4: LSI map using shannon entropy model, relative effect model and fuzzy logic model on ArcGIS tool
The presence of triggering factors data in a study area were extracted from Sentinel satellite images which are used to generate landslide susceptibility maps. For this experiment, seven major factors were considered: slope degree, slope aspect, elevation (altitude), normalized difference vegetation index (NDVI), distance from road, lithology, and rainfall. The parameters were chosen depending on the spatial aspects of the study area and the findings of scholarly articles. The United States Geological Survey (USGS) website is used to obtain satellite images. Create a geospatial database for all the parameters to identify landslide impacts using ArcGIS tools.
A 7-layer graph representing the parameter considered in the proposed work is downloaded and fed into the ArcGIS tool from the Geographical Survey of India. Around 3300, historical landslide points are randomly taken into account, and this information was fed into the ArcGIS tool. To extract parameter values for 3300 points, the slide points and 7-layer graph are layered stacked together. The parameter values are calculated using raster values and it is separated into various classes.
The slope degree, slope aspect, and elevation are obtained from a 30 m × 30 m Digital elevation model (DEM). All of the other parameters were obtained from the Landsat satellite. Rainfall is a major causative factor [25]. The Indian Metrological Department (IMD) portal was used to obtain average yearly rainfall data. ArcGIS tool is used to retrieve numerical data for all class values to create a geospatial database. The database was pre-processed and a landslide susceptibility map was created [26]. To incorporate the relationship between landslides and their factors, the parameters were classified into various classes. The database is organized as a table with all of the parameters needed to calculate the weightage for statistical methods.
5 Statistical Methods Results and Analysis
The four statistical methods are used to calculate LSI values for all 7 factors with 5 classes of every factor. The calculations are carried out using Eqs. (1)–(5) and tabulated in Table 1.
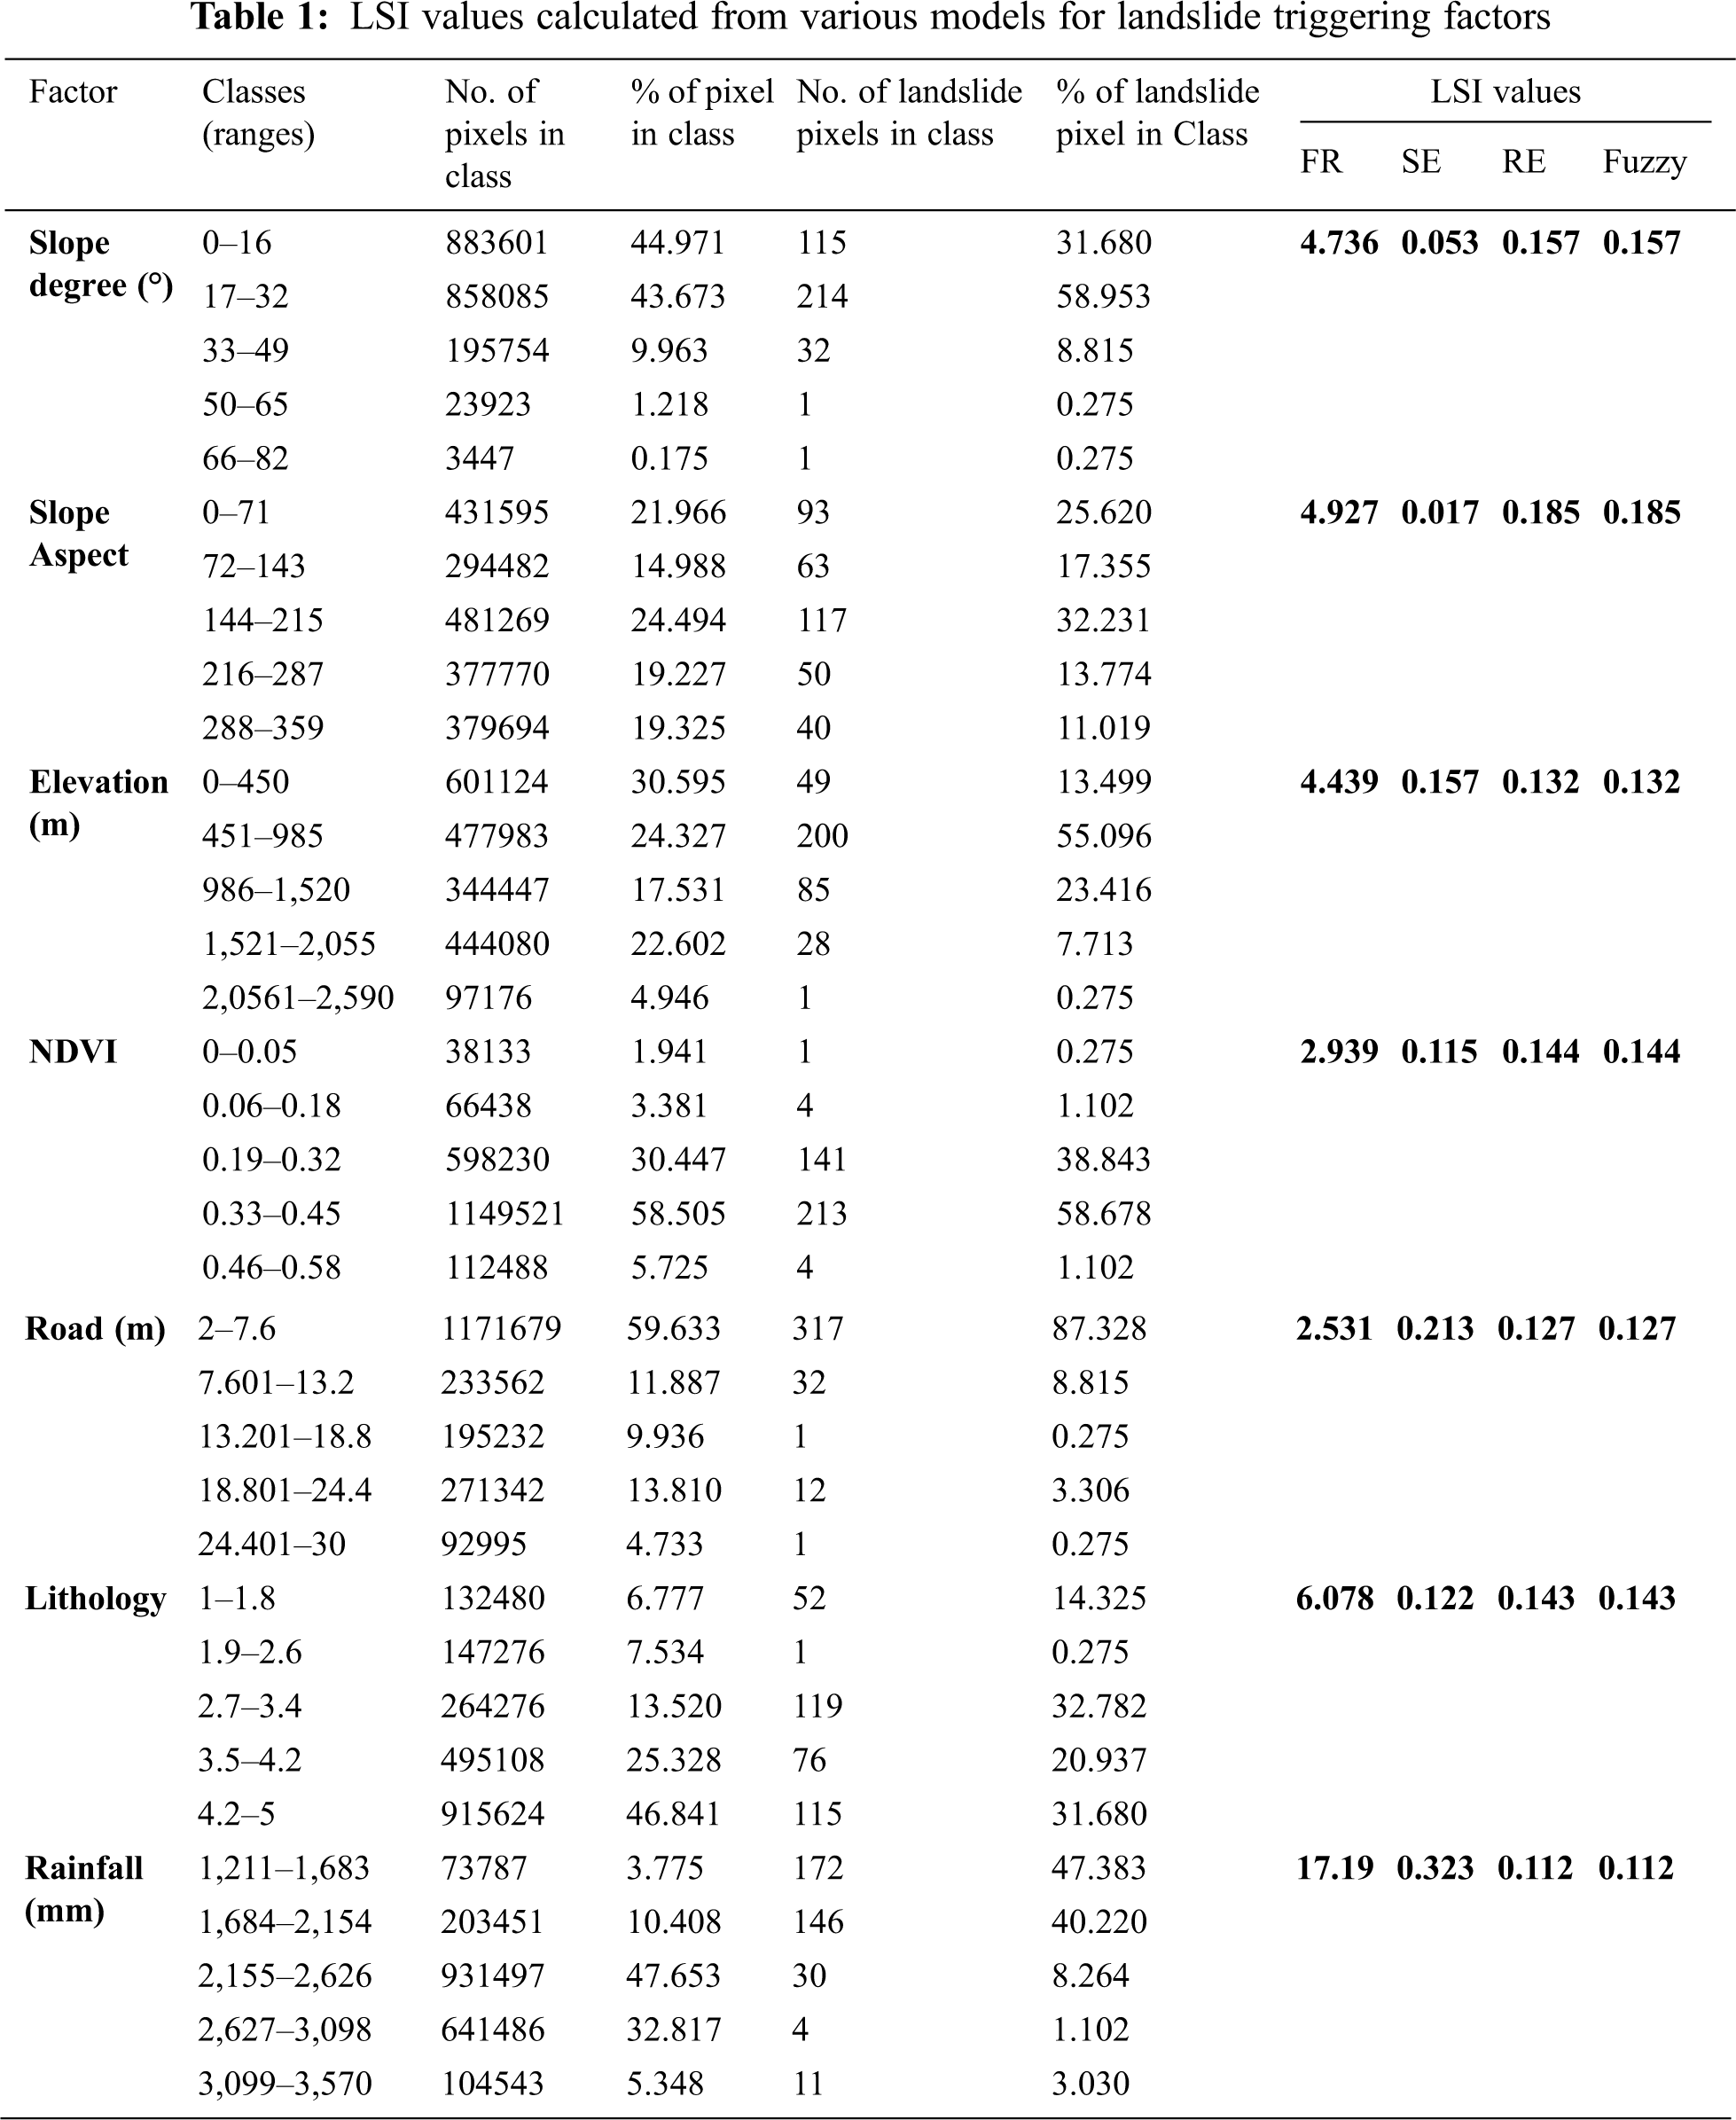
The number of pixel, percentage of pixel values in the Table 1 are extracted as described in data generation section using satellite images and field study. Using the LSI values from the Table 1 visual maps are generated using ArcGIS tool.
In frequency ratio method, the Landslide susceptibility index is figured by adding the frequency ratio values of each parameter. In ArcGIS, all of the parameter maps were combined to express the graphical representation of the study area’s Landslide susceptibility index. Rainfall shows 47% in the range of 1,211 to 1,683 mm precipitation with a frequency ratio of 12.553, according to the frequency ratio model. Similarly, the low frequency ratio value of 0.028 is recorded as the distance to the road factor. The LSI for the study area, calculated using the Frequency ratio method and map is generated ArcGIS mapping tool which is presented in Fig. 3.
Similarly, for Shannon entropy method, Relative effect method, fuzzy logic method LSI maps were generated which is illustrated in Fig. 4 respectively.
6 Deep Learning Modelling and Result Analysis
With 3363 historic landslide points, a DNN model is developed using fine-tuned parameters. The DNN model uses the outcome of the frequency ratio method, Shannon entropy method, Relative effect method, and fuzzy logic method. The DNN architecture uses 7 parameter values as input data for training. The output layer categorises the landslide range as low, moderate, high or very high based on the predominant triggering factors. Choosing the best hyper parameter while maintaining a consistent strategy to improve the model’s reliability and efficiency is one of the most difficult ways of developing deep neural networks models. The set of data has been trained with a diverse distribution of parameter ranges, which are listed in below Table 2. To attain the highest accuracy with the minimum loss, this design tries various parameter which is listed in Table 2 and select the best optimal parameter values were selected by trial and error procedure. The optimal values are selected such that the selected values will achieve the highest accuracy.
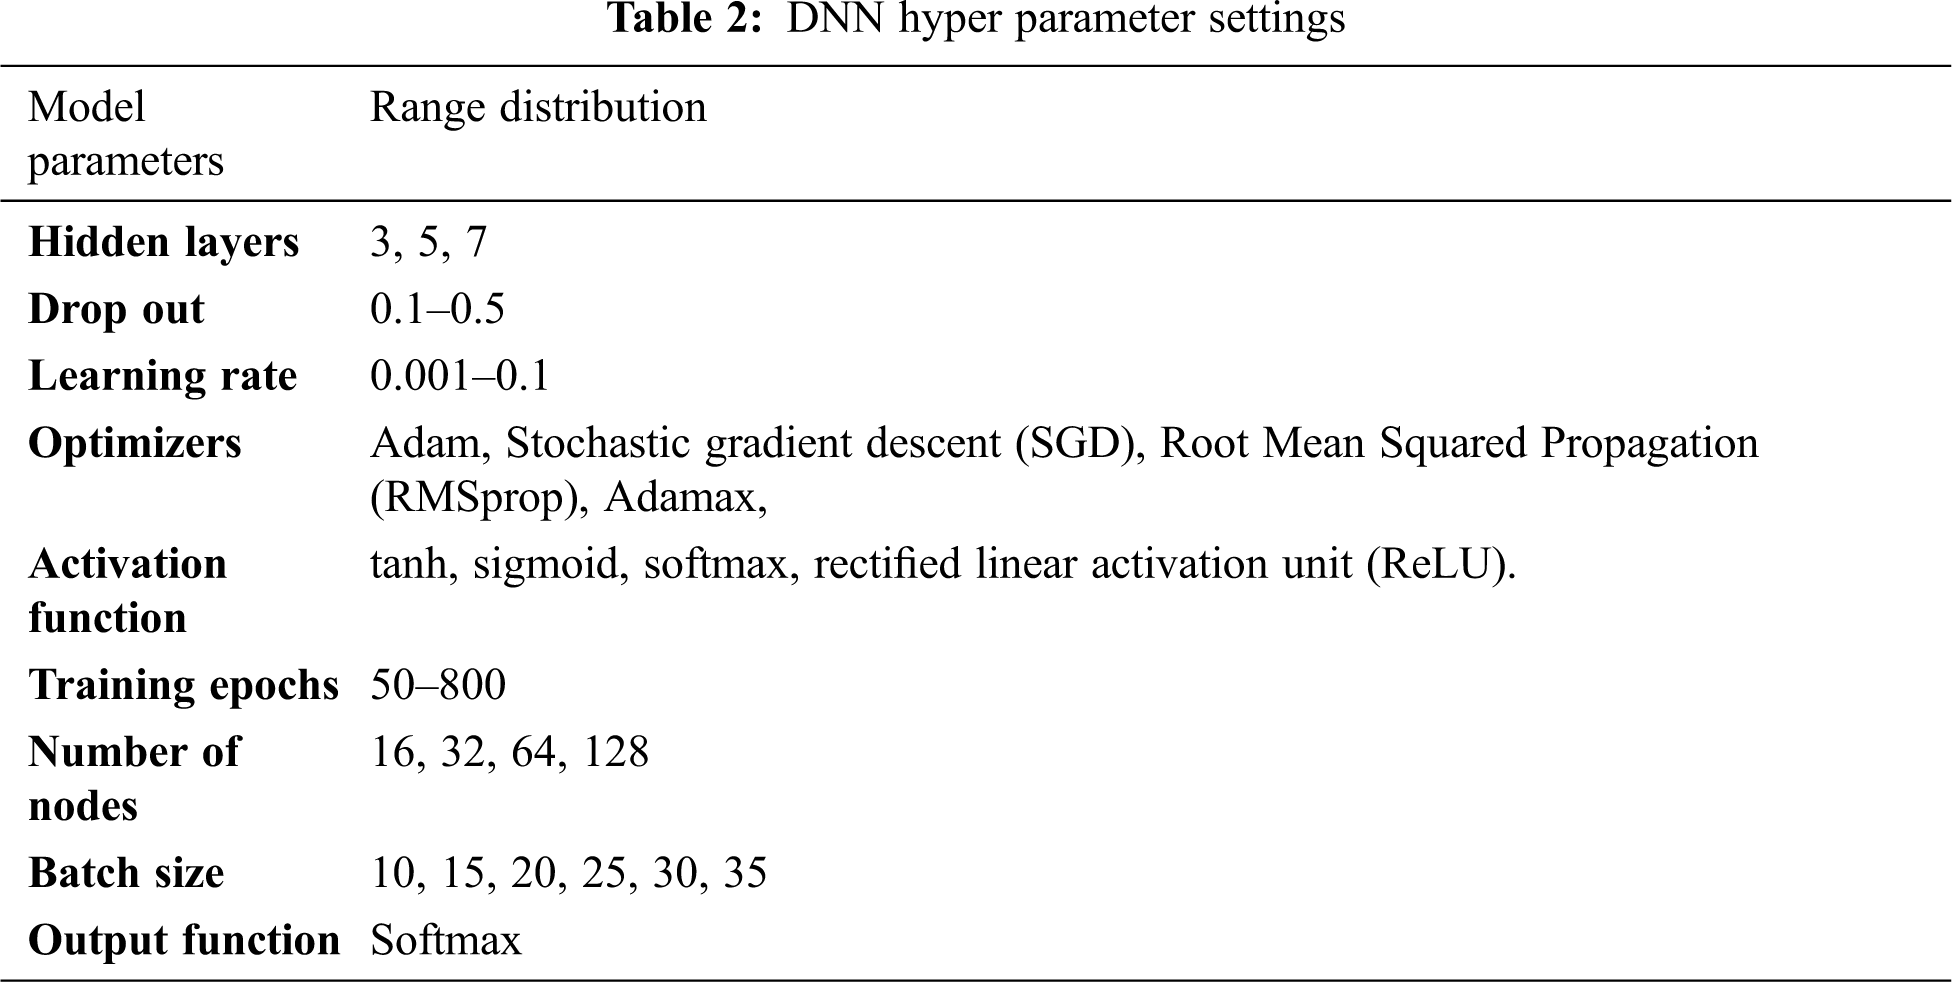
The algorithm explains how to hyper-tune the DNN model for maximum accuracy. The model is designed with 5 hidden layers, Adamax optimizers, Relu activation function with 800 Epochs, and SoftMax output function. The model’s hyper parameters have been iterated for the number of iterations specified to perform classification and prediction accuracy. The parameters are a learning rate in the range of 0.001 to 0.1. Batch sizes of 10 to 35 are considered, with dropout values ranging from 0.1 to 0.5.
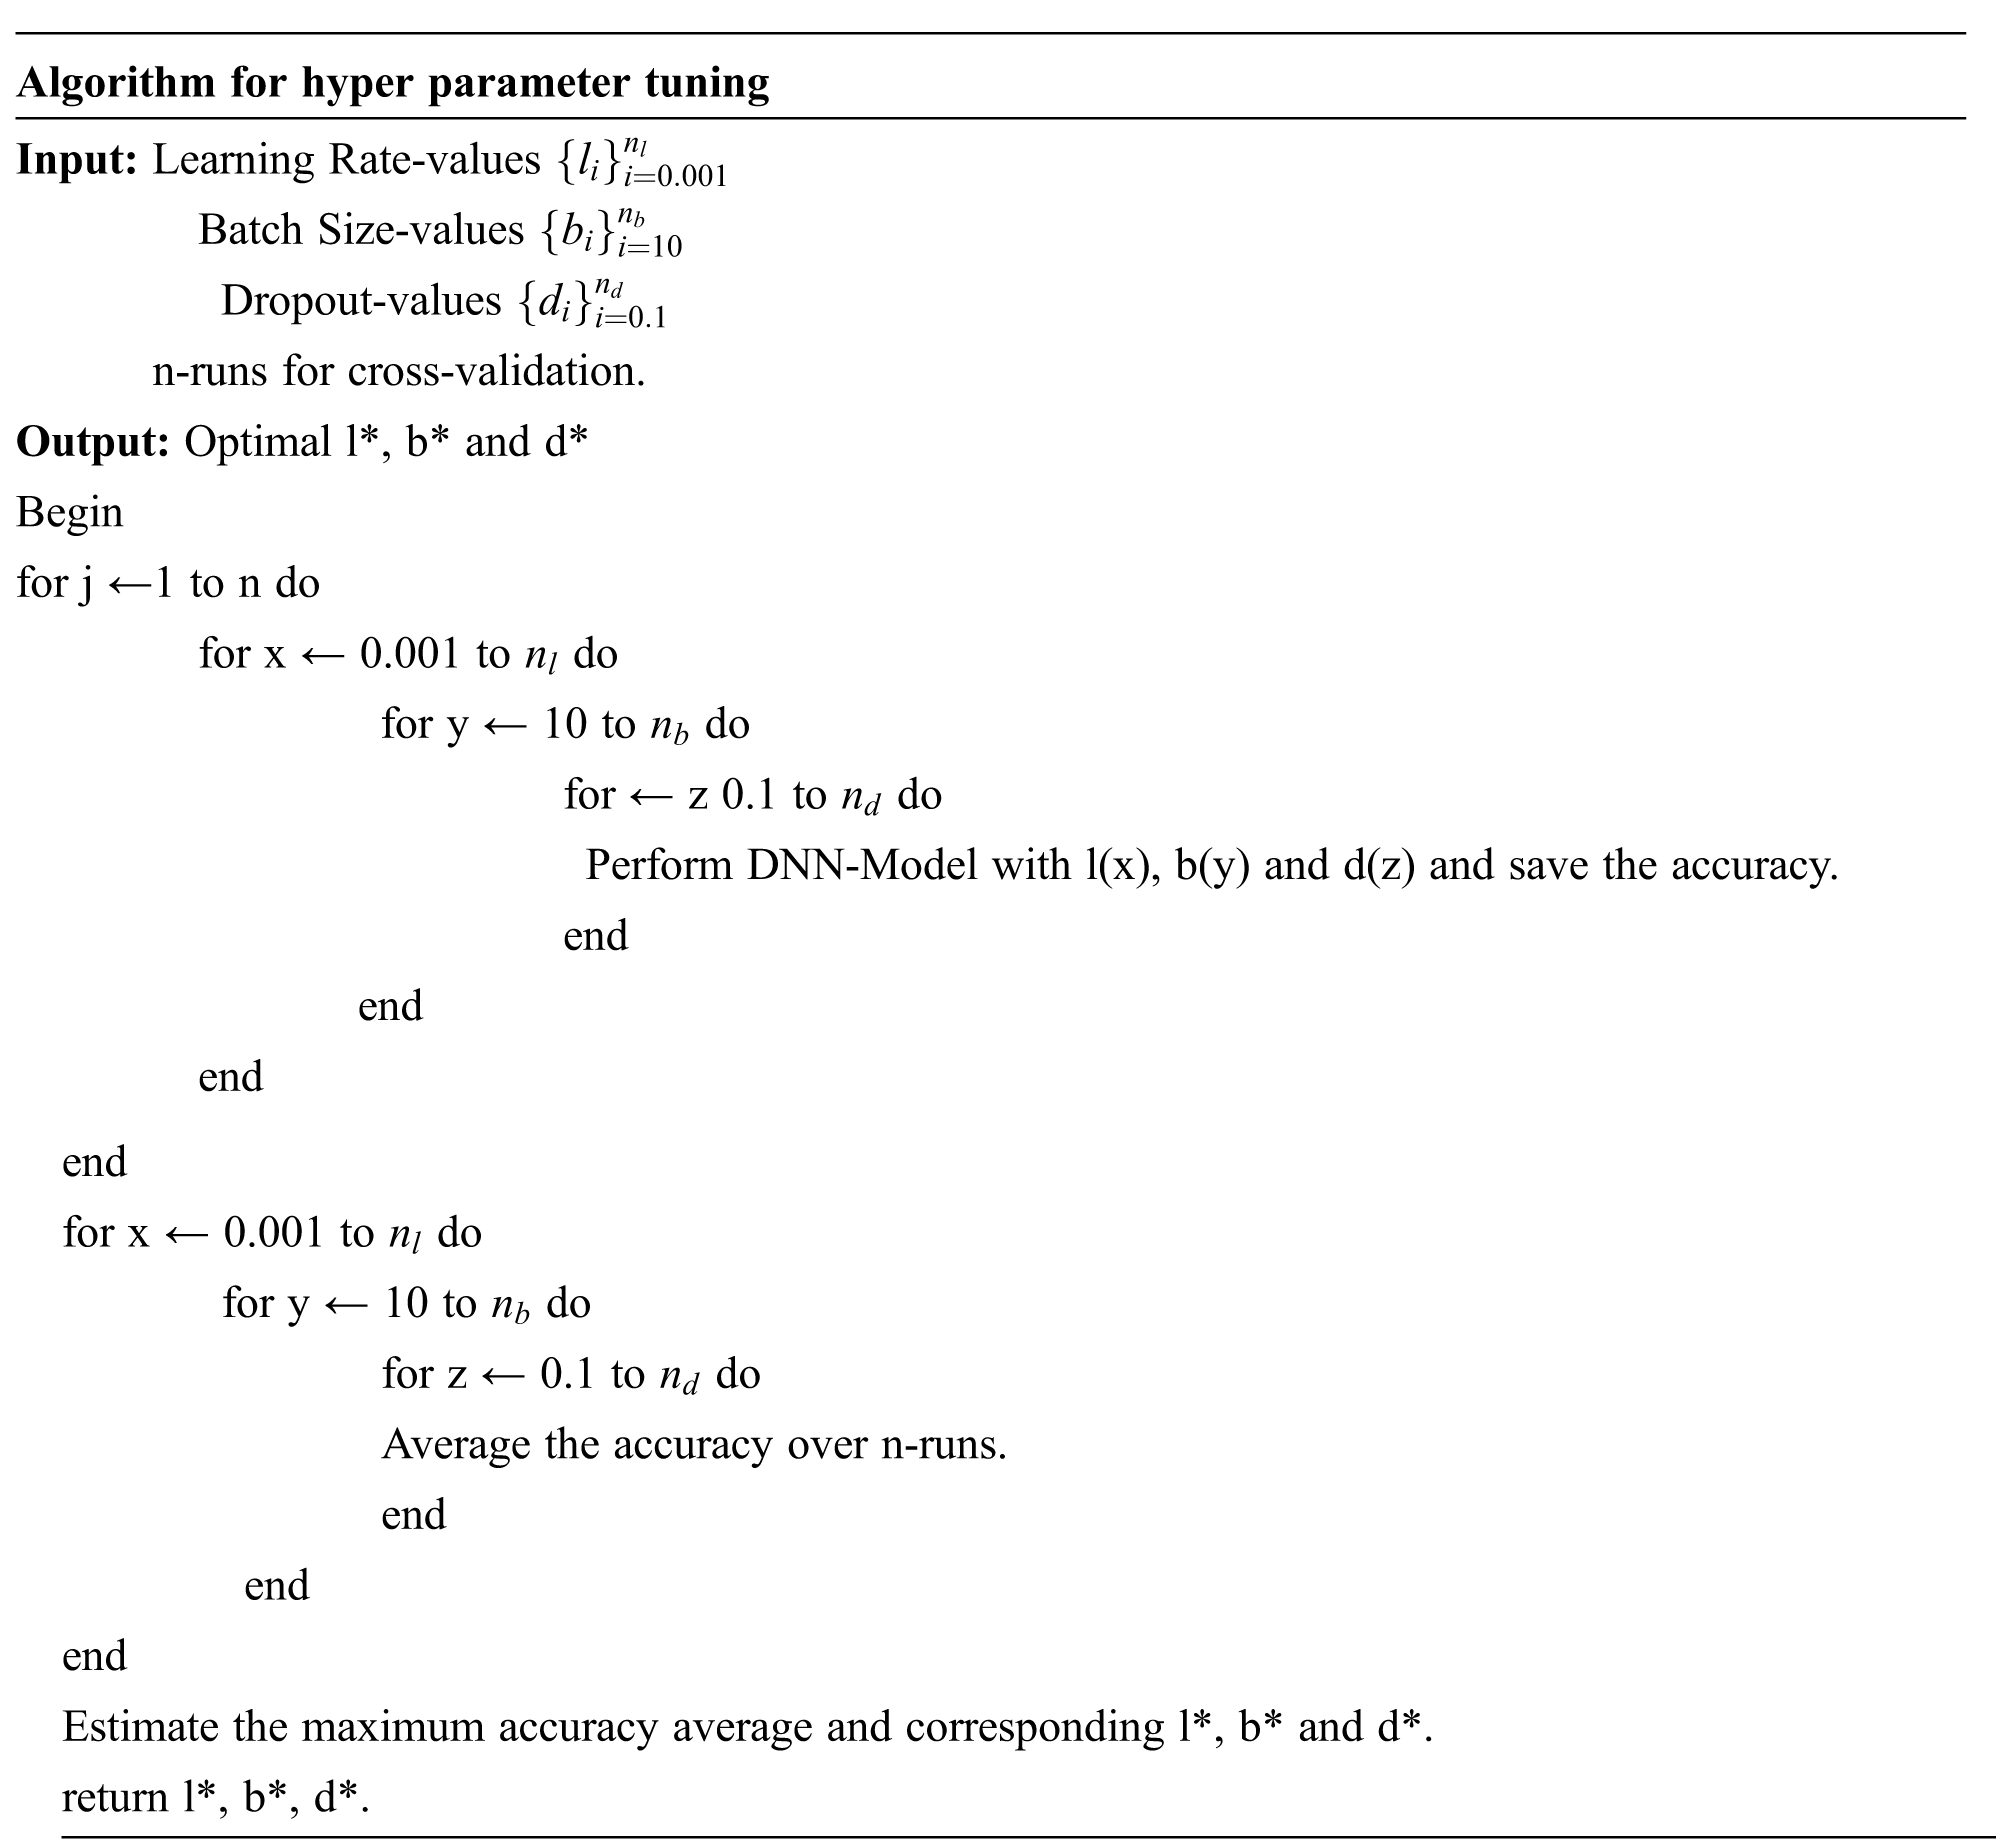
Various learning rates ranging through the algorithm from 0.001 to 0.1 were used in this work. A low learning rate increases the likelihood of seeing a base landslide classification. With the various learning rates, we attempt to find the best-fit model by utilising all of the available streamlining agents such as Adam, SGD, RMSprop, and Adamax with epochs of 50 to 800. Less number of epochs result in misclassification because the neural network did not have enough time to train. An increase number of epochs, on either hand, will result in over fitting, in which the framework can accurately predict the information but not new information. To achieve the best results, the epoch total number must be adjusted. Hidden layers have a diverse range of layers with node counts ranging from 16 to 128.
The DNN framework evaluates the mathematical models and forecasts the landslide severity. The primary evaluation process involves developing a model for mapping landslide susceptibility. It is accomplished through the use of mathematical models such as the frequency ratio method, Shannon entropy method, relative effect method, and fuzzy logic method. A total of 3363 points were used to identify the location of the landslide as well as its severity. Where 70% of the data is used to train the model and the rest 30% is used for test the model. Train the dataset with every possible optimizer at each learning rate. It is observed as the relu activation function, it achieves the highest accuracy in the Adamax optimizer. Accuracy, precision, recall, F-measure were calculated using true positive, true negative, false positive, and false-negative values as performance measure for the DNN model. The Fig. 5. Shows the performance measure for the DNN model in which Shannon entropy model could obtain optimum performance in precision, recall and F-measure. In Fig. 5 the F–measure value is represented in percentage. Shannon Entropy gives the best performance when compared to all the other method with the precision of 95%, recall of 95.07 % and F–measure value of 95 %.
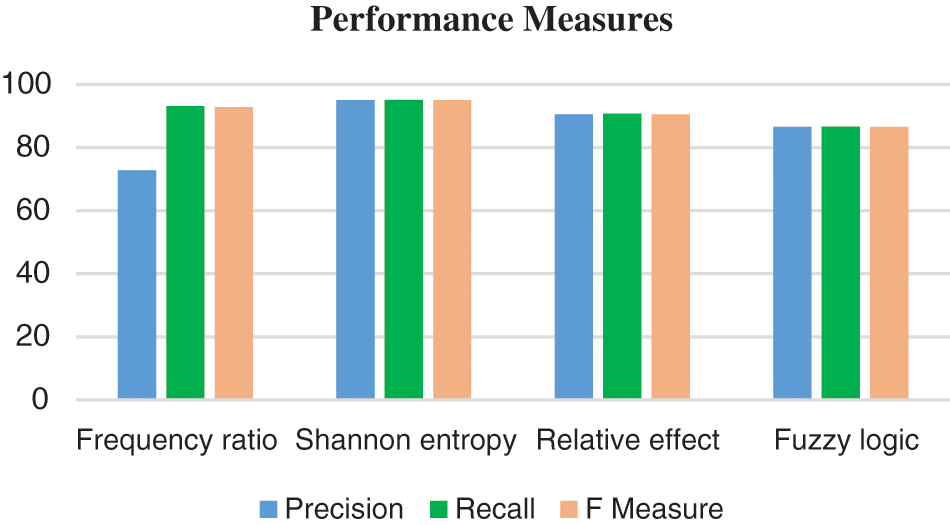
Figure 5: Performance measure obtained for the landslide severity prediction
The accuracy value of the training and testing data are evident in Fig. 6. The epoch value ranges from 0 to 800 on the X-axis, while the accuracy levels are represented on the Y-axis.
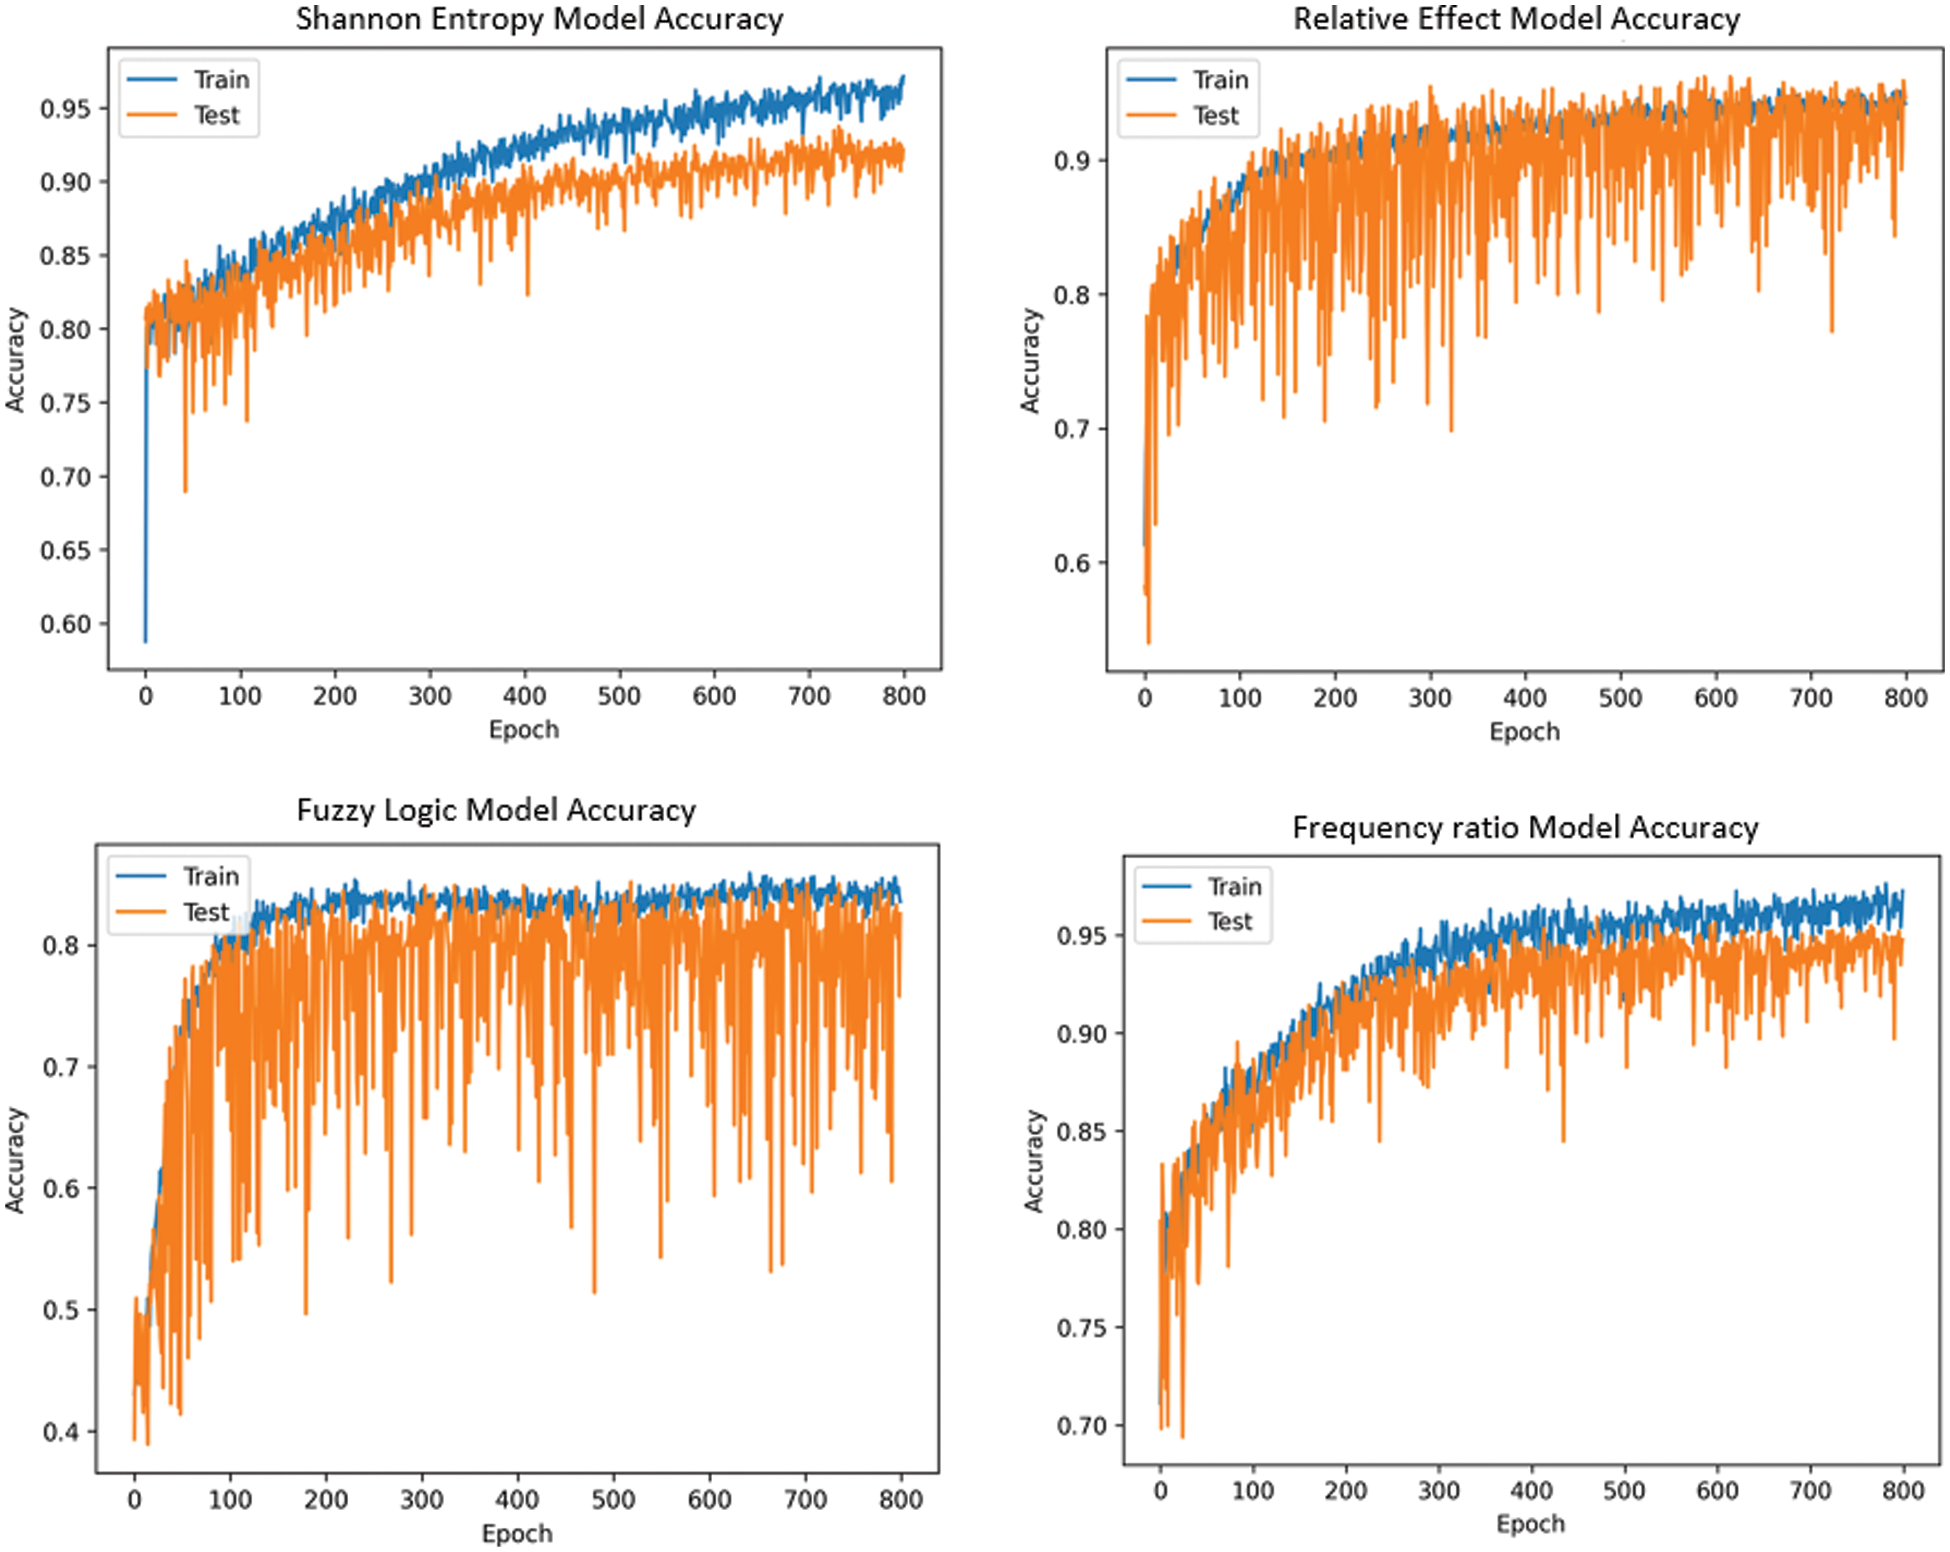
Figure 6: The accuracy curve for statistical methods
The Shannon Entropy method achieves the highest accuracy with optimal hyper parameter values of Adamax optimizer, an optimal learning rate of 0.001, batch size of 30 and 800 epochs. The Shannon Entropy Method is the most accurate with 99.16%, followed by the FR method with 97.08%, the RE model with 92.72%, and the Fuzzy logic model with 86.60%.
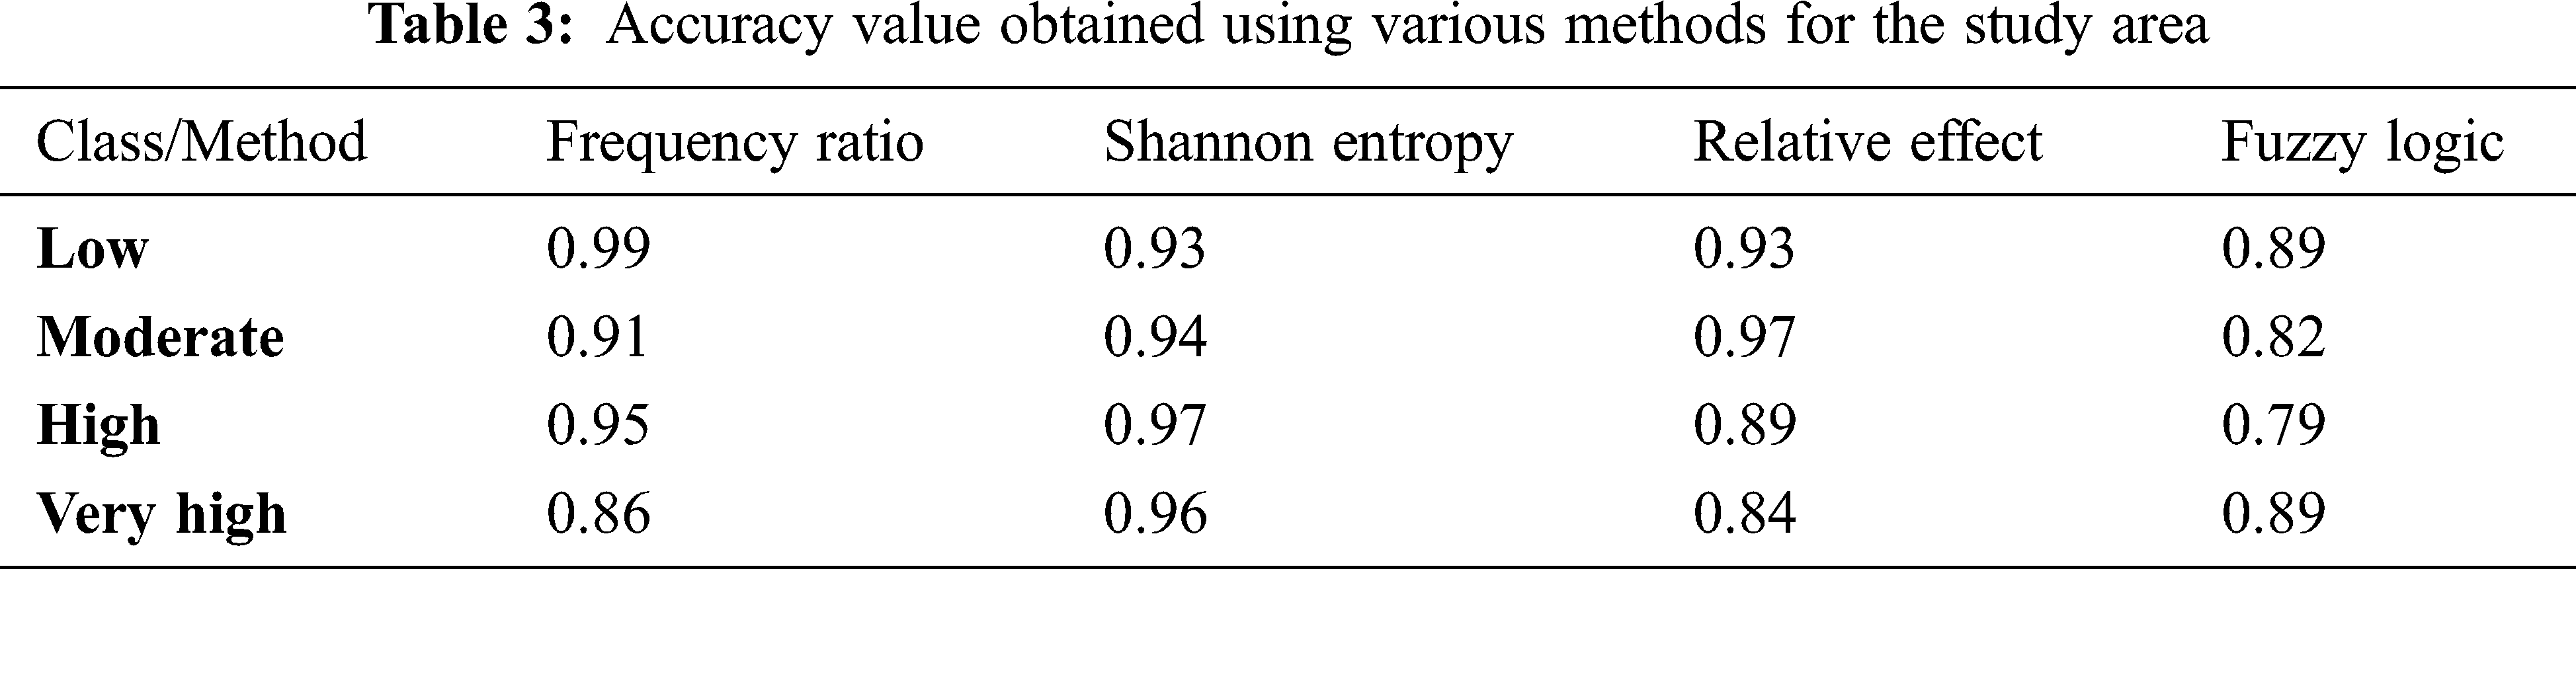
The accuracy value obtained from the four statistical methods in classifying the severity of the landslide occurrence is described in Table 3. The DNN model was trained using statistical methods, and it was able to classify low susceptible landslide areas with 99% accuracy using the frequency ratio method, moderate landslide areas with 97% accuracy using the relative effect method, and high landslide zones with 97% and very high landslide zones with 96% accuracy using the Shannon entropy method. All of the models performed superlatively in classifying the stages of landslide occurrence in the study area.
Landslides are a serious threat in Kerala and the Western Ghats. Natural disasters are rarely predictable, but they can be avoided in most cases. In a highland region, a landslide occurs when rocks and soils are displaced in mass. Due to urbanization, roadway development, and pressure from triggering factors, this hazard will become more prevalent in the future. Rainfall is clearly the primary triggering factor in the study area, as evidenced by field surveys. A spatial database is created by inferring satellite image data from field survey data, and 3363 landslide points from the study are used for experimental purposes. In this proposed work, various methods such as frequency ratio, Shannon entropy method, relative effect, and fuzzy logic method are used to generate input for DNN framework. To evaluate the methods, a DNN model is created. The Shannon entropy methods provides the highest accuracy of 99.16% with the lowest loss value compared to other methods as could it classify and predict accurately well for high and very high severity range of landslide occurrence by 97% and 96% . In landslide susceptibility mapping, the DNN framework is still being used for model evaluations. It is proposed that a DNN model be used in this field of research, with the results being especially in comparison to bivariate quantitative methods to enhance performance by taking into account more input parameters and conducting a field survey.
Funding Statement: The authors received no specific funding for this study.
Conflicts of Interest: The authors declare that they have no conflicts of interest to report regarding the present study.
References
1. J. M. Habumugisha, N. Chen, M. Rahman, M. M. Islam, H. Ahmad et al., “Landslide susceptibility mapping with deep learning algorithms,” Sustainability, vol. 14, no. 3, pp. 1734, 2022. [Google Scholar]
2. L. Hao, C. van Westen, A. Rajaneesh, K. S. Sajinkumar, T. R. Martha et al., “Evaluating the relation between land use changes and the 2018 landslide disaster in Kerala, India,” CATENA, vol. 216, pp. 106363, 2022. [Google Scholar]
3. H. G. Abdo, H. Almohamad, A. A. Al Dughairi and M. Al-Mutiry, “GIS-based frequency Ratio and analytic hierarchy process for forest fire susceptibility mapping in the western region of Syria,” Sustainability, vol. 14, no. 8, pp. 4668, 2022. [Google Scholar]
4. S. Saha, J. Roy, B. Pradhan and T. K. Hembram, “Hybrid ensemble machine learning approaches for landslide susceptibility mapping using different sampling ratios at East Sikkim Himalayan, India,” Advances in Space Research, vol. 68, no. 7, pp. 2819–2840, 2021. [Google Scholar]
5. T. R. Martha, P. Roy and K. Vinod Kumar, “Assessment of the valley-blocking ‘So Bhir’ landslide near Mantam village, North Sikkim, India, using satellite images,” Current Science, vol. 113, no. 7, pp. 1228, 2017. [Google Scholar]
6. P. Amatya, D. Kirschbaum, T. Stanley and H. Tanyas, “Landslide mapping using object-based image analysis and open source tools,” Engineering Geology, vol. 282, no. 1, pp. 106000, 2021. [Google Scholar]
7. C. Baeza and J. Corominas, “Assessment of shallow landslide susceptibility by means of multivariate statistical techniques,” Earth Surface Processes and Landforms, vol. 26, no. 12, pp. 1251–1263, 2001. [Google Scholar]
8. A. Dikshit and D. N. Satyam, “Estimation of rainfall thresholds for landslide occurrences in Kalimpong, India,” Innovative Infrastructure Solutions, vol. 3, no. 1, pp. 1–10, 2018. [Google Scholar]
9. A. Dikshit, R. Sarkar, B. Pradhan, S. Segoni and A. M. Alamri, “Rainfall induced landslide studies in Indian Himalayan region: A critical review,” Applied Science, vol. 10, no. 7, pp. 2466, 2020. [Google Scholar]
10. A. L. Achu, C. D. Aju and R. Reghunath, “Spatial modelling of shallow landslide susceptibility: A study from the southern Western Ghats region of Kerala, India,” Annals of GIS, vol. 26, no. 2, pp. 113–131, 2020. [Google Scholar]
11. V. Vakhshoori and M. Zare, “Landslide susceptibility mapping by comparing weight of evidence, fuzzy logic, and frequency ratio methods,” Geomatics Natural Hazards and Risk, vol. 7, no. 5, pp. 1731–1752, 2016. [Google Scholar]
12. M. Shadman Roodposhti, J. Aryal, H. Shahabi and T. Safarrad, “Fuzzy shannon entropy: A hybrid GIS-based landslide susceptibility mapping method,” Entropy, vol. 18, no. 10, pp. 343, 2016. [Google Scholar]
13. A. Rahaman, M. S. Venkatesan and R. Ayyamperumal, “GIS-based landslide susceptibility mapping method and Shannon entropy model: A case study on Sakaleshapur Taluk, Western Ghats, Karnataka, India,” Arabian Journal of Geosciences, vol. 14, no. 20, pp. 1–12, 2021. [Google Scholar]
14. A. Hanifinia, H. Nazarnejad, S. Najafi and A. Kornejady, “Prioritization of effective factors on landslide occurrence and mapping of its sensitivity in CherikAbad Watershed, Urmia using Shannon Entropy model,” Watershed Management Research Journal, vol. 33, no. 4, pp. 30–46, 2020. [Google Scholar]
15. V. Ramesh and S. Anbazhagan, “Landslide susceptibility mapping along Kolli hills Ghat road section (India) using frequency ratio, relative effect and fuzzy logic models,” Environmental Earth Sciences, vol. 73, no. 12, pp. 8009–8021, 2015. [Google Scholar]
16. L. Claessens, G. B. M. Heuvelink, J. M. Schoorl and A. Veldkamp, “DEM resolution effects on shallow landslide hazard and soil redistribution modelling,” Earth Surface Processes and Landforms: The Journal of the British Geomorphological Research Group, vol. 30, no. 4, pp. 461–477, 2005. [Google Scholar]
17. H. R. Pourghasemi, B. Pradhan and C. Gokceoglu, “Application of fuzzy logic and analytical hierarchy process (AHP) to landslide susceptibility mapping at Haraz watershed, Iran,” Natural Hazards, vol. 63, no. 2, pp. 965–996, 2012. [Google Scholar]
18. D. T. Bui, B. Pradhan, O. Lofman, I. Revhaug and O. B. Dick, “Spatial prediction of landslide hazards in Hoa Binh province (VietnamA comparative assessment of the efficacy of evidential belief functions and fuzzy logic models,” CATENA, vol. 96, pp. 28–40, 2012. [Google Scholar]
19. B. Pradhan, “Manifestation of an advanced fuzzy logic model coupled with Geo-information techniques to landslide susceptibility mapping and their comparison with logistic regression modelling,” Environmental and Ecological Statistics, vol. 18, no. 3, pp. 471–493, 2010. [Google Scholar]
20. S. Lee and B. Pradhan, “Landslide hazard mapping at Selangor, Malaysia using frequency ratio and logistic regression models,” Landslides, vol. 4, no. 1, pp. 33–41, 2006. [Google Scholar]
21. H. J. Oh and B. Pradhan, “Application of a neuro-fuzzy model to landslide-susceptibility mapping for shallow landslides in a tropical hilly area,” Computers & Geosciences, vol. 37, no. 9, pp. 1264–1276, 2011. [Google Scholar]
22. B. Pradhan, “Use of GIS-based fuzzy logic relations and its cross application to produce landslide susceptibility maps in three test areas in Malaysia,” Environmental Earth Sciences, vol. 63, no. 2, pp. 329–349, 2010. [Google Scholar]
23. H. Shahabi, M. Hashim and B. B. Ahmad, “Remote sensing and GIS-based landslide susceptibility mapping using frequency ratio, logistic regression, and fuzzy logic methods at the central Zab basin, Iran,” Environmental Earth Sciences, vol. 73, no. 12, pp. 8647–8668, 2015. [Google Scholar]
24. H. Salem, M. Y. Shams, O. M. Elzeki, M. Abd Elfattah, J. F. Al-Amri et al., “Fine-tuning fuzzy KNN classifier based on uncertainty membership for the medical diagnosis of Diabetes,” Applied Science, vol. 12, no. 3, pp. 950, 2022. [Google Scholar]
25. Q. B. Pham, Y. Achour, S. A. Ali, F. Parvin, M. Vojtek et al., “A comparison among fuzzy multi-criteria decision making, bivariate, multivariate and machine learning models in landslide susceptibility mapping,” Geomatics, Natural Hazards and Risk, vol. 12, no. 1, pp. 1741–1777, 2021. [Google Scholar]
26. B. Feizizadeh, M. S. Roodposhti, P. Jankowski and T. Blaschke, “A GIS-based extended fuzzy multi-criteria evaluation for landslide susceptibility mapping,” Computers & Geosciences, vol. 1, no. 73, pp. 208–221, 2014. [Google Scholar]
Cite This Article
 Copyright © 2023 The Author(s). Published by Tech Science Press.
This work is licensed under a Creative Commons Attribution 4.0 International License , which permits unrestricted use, distribution, and reproduction in any medium, provided the original work is properly cited.
 Downloads
 Citation Tools