
 Submit a Paper
 Propose a Special lssue
 Open Access
ARTICLE

ProbD: Faulty Path Detection Based on Probability in Software-Defined Networking
1 School of Computer Science and Technology, Hainan University, Haikou, 570228, China
2 School of Software, Beijing Jiaotong University, Beijing, 10004, China
3 University of British Columbia, Vancouver, V5K1K5, Canada
* Corresponding Author: Deshun Li. Email:
Intelligent Automation & Soft Computing 2023, 36(2), 1783-1796. https://doi.org/10.32604/iasc.2023.034265
Received 12 July 2022; Accepted 27 August 2022; Issue published 05 January 2023
 View Full Text
 Download PDF
Abstract
With the increasing number of switches in Software-Defined Networking (SDN), there are more and more faults rising in the data plane. However, due to the existence of link redundancy and multi-path forwarding mechanisms, these problems cannot be detected in time. The current faulty path detection mechanisms have problems such as the large scale of detection and low efficiency, which is difficult to meet the requirements of efficient faulty path detection in large-scale SDN. Concerning this issue, we propose an efficient network path fault testing model ProbD based on probability detection. This model achieves a high probability of detecting arbitrary path fault in the form of small-scale random sampling. Under a certain path fault rate, ProbD obtains the curve of sample size and probability of detecting arbitrary path fault by randomly sampling network paths several times. After a small number of experiments, the ProbD model can correctly estimate the path fault rate of the network and calculate the total number of paths that need to be detected according to the different probability of detecting arbitrary path fault and the path fault rate of the network. The final experimental results show that, compared with the full path coverage test, the ProbD model based on probability detection can achieve efficient network testing with less overhead. Besides, the larger the network scale is, the more overhead will be saved.Keywords
With the continuous development of the modern network, people put forward higher requirements for network stability and intelligence. As a new type of network architecture, the SDN network separates the control plane and data plane of network equipment. Compared with the traditional network, an SDN network can provide better service quality for existing fields such as Edge Computing and the Internet of Things [1]. In emerging fields such as the 5G network, Fog Computing [2], and Internet of Vehicles (IoV) [3], the SDN network has broader application prospects, and it can combine with Network Function Virtualization (NFV), Machine Learning [4], Load Balancing [5] and other technologies to generate greater potential value. Therefore, it has extremely high value to research the test work of SDN networks.
The data plane in the SDN network expands rapidly, the number of switches and links continues to increase, and the programmable feature of SDN brings both flexibility and certain risks to the network. However, due to the existence of link redundancy and multi-path forwarding mechanisms, it is difficult to find faults in the network in time. In software testing and network testing, specific test coverage guidelines should be followed to adequately find bugs. The full path test coverage is the best in theory among them, but its overhead is also the largest, which is the reason why it is difficult to apply to large-scale network testing.
At present, the test work for the SDN data plane can be roughly divided into two categories. One is to use formal methods to construct data plane models for verification [6,7], and the other is to generate test packets and forward them in the real data plane [8]. For the former, the modeling process needs to collect the flow table information of the entire data plane. For the latter, the test traffic should cover the network topology as much as possible, and the cost of these two methods is relatively high.
Therefore, this paper proposes ProbD, an efficient network testing model based on Probability Detection. It reduces the overhead of full path coverage testing and achieves high confidence in detection by small-scale random sampling. The ultimate goal of the ProbD model is to complete the detection of the SDN data plane while saving the test cost. The core idea is as follows:
In the full path set, a certain number of test paths are randomly selected for testing, and the test results and the communication status of the network are recorded. The above steps are repeated several times till the fluctuation of the probability curve of detecting arbitrary path fault becomes stable. Through the curve, we can judge the quality of the network communication status. Experiments show that when the total sample size of random sampling is small, the obtained curve of the probability of detecting arbitrary path fault fluctuates greatly. After multiple rounds of testing, the total sample size reaches a certain level, which reduces the occasionality of the test results, and the curve of the probability of detecting arbitrary path fault fluctuates less. Finally, we can formulate the optimal coverage testing schemes based on the estimated path fault rate and the expected probability of detecting arbitrary path fault, which will be described in detail later. Overall, the contributions of this study are mainly in three aspects:
1) The probability detection method is creatively introduced into the test coverage of the SDN data plane.
2) To evaluate the reliability of the network, we calculate and draw the curve of the probability of detecting arbitrary path fault through multiple random sampling.
3) We propose the probability detection model ProbD, which can achieve high confidence in the detection of the large-scale network by detecting a small number of samples.
The structure of this paper is as follows: Section 2 introduces the related work of SDN data plane testing, Section 3 introduces the ProbD probability detection model, which explains the design of the model and the factors that affect testing, and Section 4 presents the experimental results and analysis, and Section 5 is a conclusion.
So far, SDN data plane testing is the most intuitive and effective way to find faults in the network. The reason is that all forwarding policies made by the controller are ultimately manifested through the forwarding of data flow in the data plane. At the same time, the data flow is a kind of structured data that can be easily monitored and managed by the operator.
However, data plane fault detection also faces challenges. In the SDN network, how to achieve fast and effective detection of the forwarding equipment and transmission links of the data plane is still an issue worth studying, and we need accurately find the network faults to ensure the normal forwarding of data flow. Most of the existing detection schemes are targeted at link or transmission path failure.
In terms of faulty link detection of SDN networks, Kozat et al. proposed a solution to add an optimal number of static forwarding rules in data plane switches [9]. The link failure can be quickly located without relying on the status updates of other controllers in the case of multiple controllers, but their approach does not take into account faults due to switch priority. Bu et al. proposed a more comprehensive forwarding rule solution, namely, RuleScope [10]. It can detect the actual forwarding behavior of the switches by tracking specific data packets in real-time and searching for the faults caused by the priority at the same time. However, as the scale of the data plane grows, it is also a challenge to ensure that the tracked information is consistent with the data plane state.
Kempf et al. [11] and Guo et al. [12] proposed a solution to insert probe data packets into business traffic, which can effectively reduce the controller load brought by the traditional link monitoring method, thereby reducing the overhead of faulty link detection. Jia et al. focused on faulty link detection in a hybrid network with both SDN switches and non-SDN switches [13]. Besides, reducing computation time and detection overhead is the emphasis of their research.
At the same time, there is also a part of the work focusing more on realizing the efficient recovery of the detected faulty links [14–16], which will not be described here.
In SDN networks, except for faulty link detection, faulty path detection between switches is also an important research problem. In an ideal situation, the switch always receives the flow table issued by the controller and forwards the data packet by matching it with the header field of the flow table entry. However, the situation where the actual forwarding behavior of the data plane does not match the forwarding policy of the control plane will always occur in fact. For example, when multiple controllers update the flow table of the switch at the same time, there is a possibility of conflict, and the data flow may not be transmitted as expected. Aimed at this situation, transmission path tracing is considered a good solution.
Agarwal et al. designed the SDN Traceroute tool [17], which can query the current transmission path of any data packet in the SDN network without changing the forwarding rules, and can help the operator understand the actual transmission path of the packet to find the existing transmission path failure. Zhang et al. designed the PathletTracer program and proposed a new layer 2 paths tracking method [18], which can encode the data packets that need to be forwarded, and consider the scalability and flexibility of the program while detecting the transmission path failure. Narayana et al. monitored the traffic on the transmission path by introducing a declarative query language [19], and they were able to reconstruct the transmission trajectory of the data packet by the specific label.
Wang et al. proposed a method capable of tracing data flow in a large-scale multi-domain SDN network [20], which applied transmission path tracing to a larger and more complex network. Gao et al. proposed a Universal and RObust in-band PackEt trajectory tracing approach for SDN-enabled networks (UniROPE) [21], which shifted the focus of packet tracing from supporting a single network topology to supporting various network topologies. Xiong et al. proposed a path tracing method based on the Bloom Filter [22], which can adaptively encode the path information into the Bloom Filter so that the path tracing is independent of the bottom network topology and routing strategy.
Having studied the previous work, we found that as the scale of the network continued to increase, researchers gradually shifted the focus from searching for the link failure to the transmission path failure. Existing work about detecting transmission path failure focuses more on how to find it rather than considering the cost. Therefore, this paper proposes a probability detection model ProbD, which can achieve high-level detection of large-scale networks with less overhead.
With the expansion and complication of the SDN network, the possibility of erroneous conversion between the policy of the high-level controllers and the forwarding behavior of the low-level switches continues to increase. Therefore, it is necessary to detect path faults in the network. Full path detection has extremely high accuracy, but its detection cost is too high, which makes it impractical to apply in large-scale networks. Therefore, an alternative path detection scheme suitable for large-scale networks with high reliability is urgently needed.
Full path detection is a test that traverses all possible paths between hosts, and it has the characteristics of high coverage and sufficient testing. As shown in Fig. 1, an error occurs when the controller issues the flow table (for brevity, the interaction between the controllers and the switches is omitted), and the flow table entry running in S5 is different from the expected one. If we use edge coverage testing, it means that the test paths cover each edge in the network at least once. We will find that when the paths S7-S5-S3 and S7-S8-S5-S2 are tested, even if both edges S7-S5 and S5-S2 are covered, there is no guarantee that errors will be found, only when the test path is S7-S5-S2, the problem that the actual forwarding path is different from expectation can be found. Therefore, it is necessary to perform full path detection to increase the intensity of testing.

Figure 1: An example of transmission path failure
Although the full path detection is accurate, with the increase of switches and links in the network, the number of test paths explodes, and the cost of the test is huge. For a fully connected network with the number of switches n, the number of full paths between two switches can be calculated by the expression
When n = 100, the number of full paths of the fully connected network can reach 1.27×10158, it is unrealistic to perform such a large-scale test in a real environment. Therefore, we propose a method of multiple random sampling detection. Under the circumstance of ensuring network test coverage, it takes advantage of full path detection and completes network testing with less overhead.
In this section, for a better understanding of the ProbD probability detection model, we analyze the factors affecting the model and describe the ProbD model, then explain the model algorithm.
In our ProbD model, several key factors affect the reliability of test results. We introduce and analyze these impact factors as follows:
1) Path fault rate R: In a given network, the path fault rate R has a decisive influence on the communication state. When the path fault rate R is high, the average transmission bandwidth between nodes is narrow; when the path fault rate R is low, the average transmission bandwidth between nodes is wide. During the network test, the fault rate of the path is constant at a certain moment, so the path fault rate R remains unchanged during the test period. However, the full path detection has no concern with the path fault rate R. It needs to detect all paths, and the test overhead is high. According to the path fault rate R, we adopt multiple random sampling detection methods to reduce the test cost.
2) Single sample size k: In path detection, the number of test samples k, which is generated by random sampling, directly affects the current test cost. Assuming that the number of test samples in a single sampling is k. When k is large, the probability of each path being detected is higher, but the test cost also increases exponentially; when k is small, the test coverage of the network is relatively lower, and the test cost will be less. We adopt multiple sampling with a small sample size to achieve a balance between test overhead and test coverage.
3) Sampling rounds m: Given the number of test samples k in a single round, we can increase the difference of samples by increasing the rounds of random sampling. Meanwhile, the network test coverage rate will be improved. Assuming that the sampling round is m, the probability of each path being detected increases as m increasing. In a given scale of the network, we can adjust the values of k and m to achieve a balance between test coverage and test overhead.
In a random network with a given path fault rate R, we detect network path faults by randomly sampling m times with a single sample size k. It can reduce the test overhead caused by a large test sample size in the testing process.
An SDN network topology can be abstracted into a graph
Given:
Given a network topology
Solve:
Given the path fault rate R, randomly sampling k test samples each time, and performing random sampling m times, the probability of detecting arbitrary path fault Pd is detected.
In our ProbD model, the single sample size k is negligible compared with the total test sample size of full path detection (even after multiple rounds of sampling). Multiple rounds of sampling will increase the difference of test samples and reduce the occasionality of test results. Properly adjusting the size relationship between single sample size k and sampling rounds m can achieve high test coverage and high reliability of the test. Based on the model above, we give Theorem 1.
Theorem 1. Given path fault rate R, the probability of detecting arbitrary path fault Pd of single sample size k in random sampling rounds m is:
Proof. Given path fault rate R, performing a random sampling of k test paths, and the probability of the selected paths are all correct Pk is:
Under the independent random sampling method above, after m rounds of sampling, the probability of the selected paths are all correct Pkm is:
Therefore, after m rounds of sampling, the probability of detecting arbitrary path fault Pd is:
The proof of Theorem 1 is now complete.
Pd represents the probability of detecting arbitrary path fault in a network with real path fault rate R. It can be detected after m rounds of path testing when the single sample size is k. When the value of Pd is high, it means that the current test policy has a high probability of detecting arbitrary path faults in the network. On the contrary, when the value of Pd is low, it means that the intensity of the current test is not enough to detect path fault existing in the network.
Given path fault rate R and probability of detecting arbitrary path fault Pd, we give Theorem 2.
Theorem 2. Given path fault rate R and probability of detecting arbitrary path fault Pd, the total number of paths that need to be detected is:
Proof. It can be known from Theorem 1 that:
Shift term and simplify to:
Therefore, the total number of paths that need to be detected km is:
The proof of Theorem 2 is now complete.
km as the product of single sample size k and sampling rounds m represents the total number of paths that need to be detected. According to the expectation of probability of detecting arbitrary path fault Pd and path fault rate R, we can get the expectation of the total number of paths that needs to be detected at a certain moment, and the scale of the expected number will not change as the scale of network increasing. Besides, the larger the scale of the network, the less the ratio of test path number to full path number, and the more overhead can be saved compared with the full path detection.
As shown in Fig. 2, there are the general processes in the ProbD model:
1) Obtain the topology information of the data plane through the controller, convert it into a graph structure, and input it into the model as data.
2) In the graph structure, randomly select two hosts as the test hosts, generate the traffic required for the test, and calculate all possible paths between the two test hosts. It means traversing the graph structure and obtaining the test path set.
3) Randomly select k test paths from the test path set. The controller sends the test flow table to the switches, and the test hosts will generate the test traffic. The test traffic will be matched and forwarded by the flow table entry and complete the test coverage of the tested path finally. We can judge whether there is a fault according to the test result and record it. If the test result matches the expected result, mark the tested path as the correct path. Otherwise, mark it as a faulty path.
4) Repeat the process of randomly sampling k test paths for m times to achieve a high probability of detecting arbitrary path fault.

Figure 2: Graph of testing process of ProbD model
In the ProbD probability detection algorithm, the data plane is tested and covered by the method of randomly sampling m times with a single sample size k to find out whether there is a fault in the network and mark it.
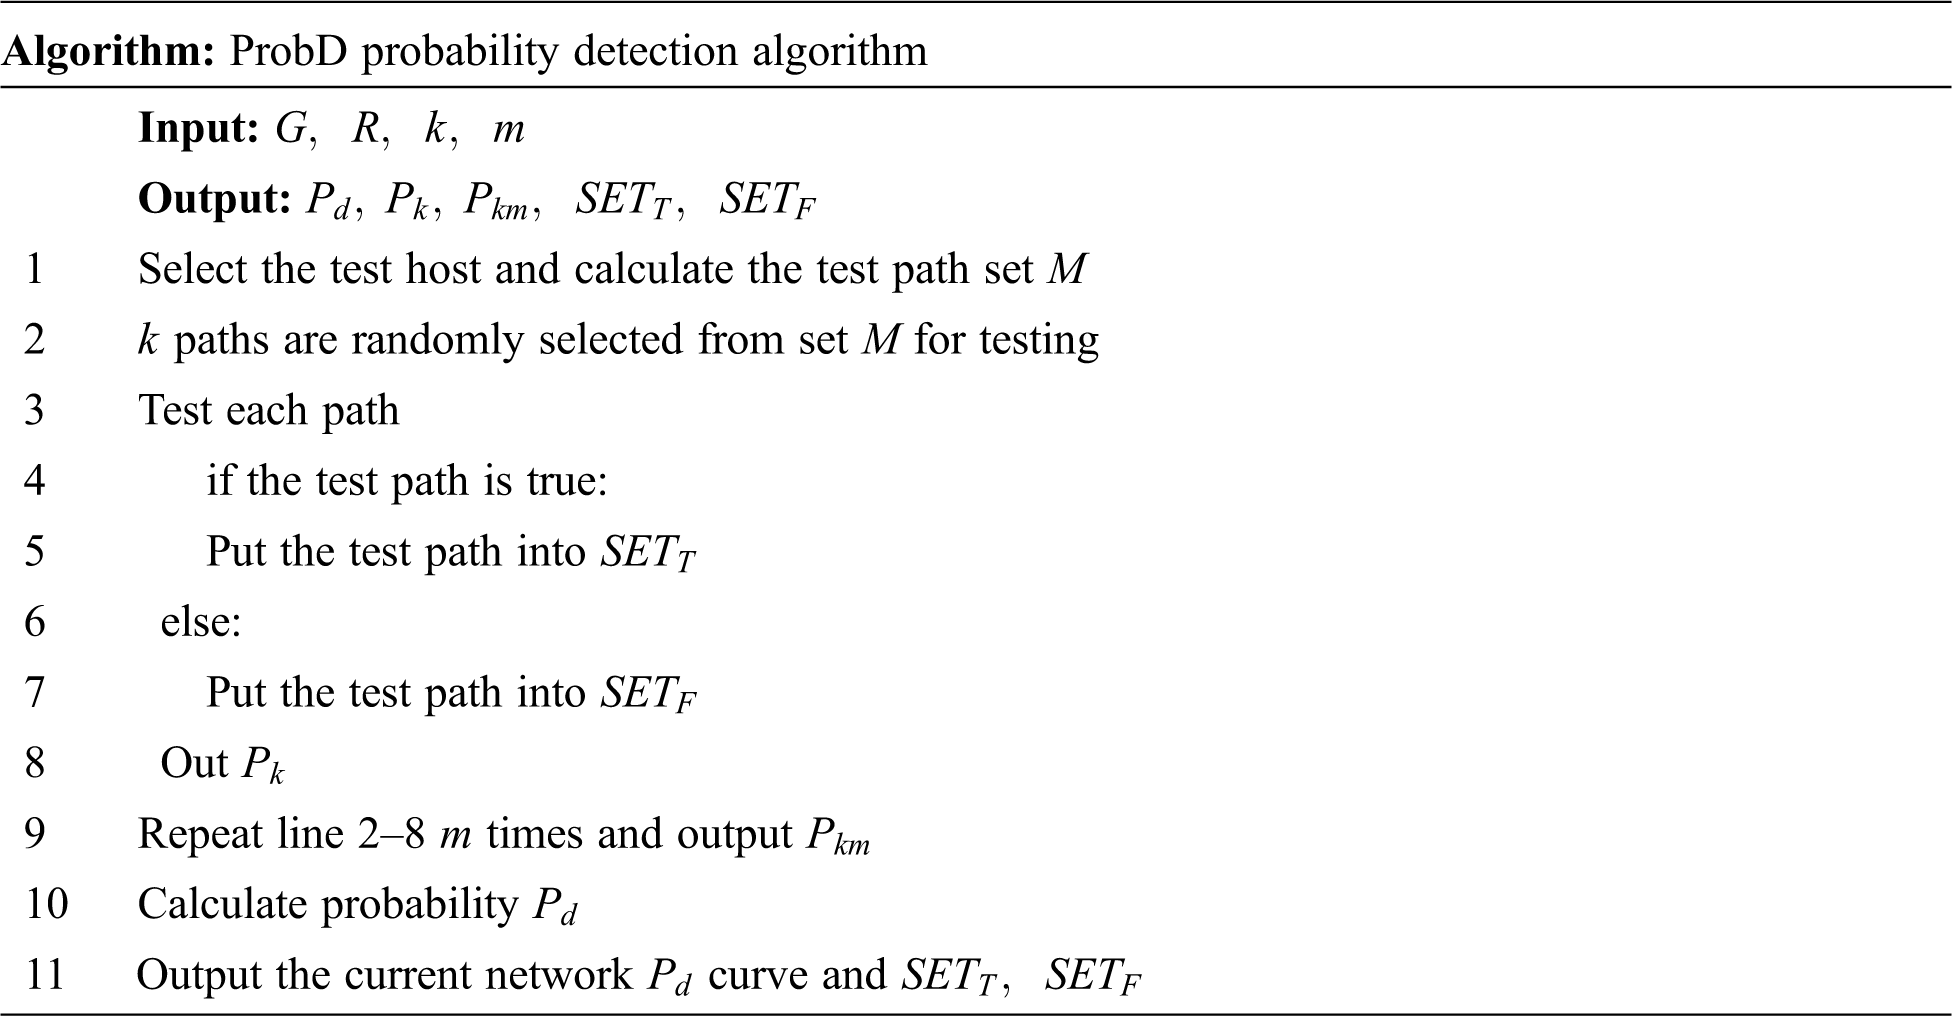
In the graph structure, the test path set M of all possible paths is calculated by iteration (line 1). Randomly select k paths from the test path set M for detection (line 2). The controller sends the test flow table to the switches, and the test hosts will generate test traffic to communicate according to the flow table entry (line 3). The test results are fed back to the application layer through bandwidth, delay, throughput, and other information to determine whether the tested path is qualified. If the test passes, mark the path as T (line 4-5). Otherwise, mark the path as F (line 6-7), and record the result of a sampling of the probability of detecting arbitrary path fault Pk (line 8). Repeat the process of randomly sampling k test paths for m times in the test path set M (line 9), and calculate the probability of detecting arbitrary path fault Pd in the network (line 10). At the end of the test, output the probability of detecting arbitrary path fault Pd, correct paths, and faulty paths (line 11).
We can know that the complexity of the algorithm is
By simulating the ProbD model, we can get the relationship between the probability of detecting arbitrary path fault Pd, sampling rounds m, and single sample size k under different path fault rates R. It is also able to obtain the relationship between the number of full paths p and the number of test paths q under different path fault rates R and the probability of detecting arbitrary path fault Pd. We use PyCharm Community Edition 2021.2.1 with Python 3.8 to simulate experiments, and use Excel to achieve auxiliary analysis.
Experiment 1. Set the number of full paths p to 10000, the path fault rate R of the network to 0.001 or 0.003, and the single sample size k to 200. Observe the degree of dispersion of the estimated probability of detecting arbitrary path fault from the ideal probability under a different number of experiments n when the sampling rounds m changes from 1 to 10.
Set the single sample size k to 200. Observe the change of the probability of detecting arbitrary path fault Pd under different path fault rate R when the sampling rounds m changes from 1 to 10.
Set the sampling rounds m to 10. Observe the change of the probability of detecting arbitrary path fault Pd under different path fault rate R when the single sample size k changes from 100 to 1000.
Experiment 2. Set the number of full paths p to 10000, the path fault rate R of the network to 0.003 or 0.005, the single sample size k to 100 or 200, and the sample rounds m to 5 or 10. Observe the degree of dispersion of the estimated path fault rate from the real path fault rate when the number of experiments n changes from 1 to 100.
Set the path fault rate R of the network to 0.003. Observe the change of the number of full paths p under the different probability of detecting arbitrary path fault Pd when the number of test paths q changes from 0%∼20%.
Set the path fault rate R of the network to 0.03. Observe the change of the number of full paths p under the different probability of detecting arbitrary path fault Pd when the number of test paths q changes from 0%∼6%.
In experiment 1, we take the number of experiments n, sampling rounds m, and single sample size k as the main independent variables. Observe the change of probability of detecting arbitrary path fault Pd.
Fig. 3 shows that when a single sample size k is constant, the more sampling rounds m is, the higher the probability of detecting arbitrary path fault Pdwill be. The larger the number of experiments n is, the better the estimated probability of detecting arbitrary path fault fits the ideal probability of detecting arbitrary path fault when the path fault rate R is 0.001 or 0.003. All test results show that the estimated probability of detecting arbitrary path fault fits the ideal probability best when the number of experiments n is 1000. The ideal probability can be calculated by the formula

Figure 3: The relationship between estimated Pd and n under different R
Fig. 4 shows that when a single sample size k is constant, the more sampling rounds m is, the higher the probability of detecting arbitrary path fault Pdwill be. The higher the path fault rate R is, the higher the probability of detecting arbitrary path fault Pd will be under the same sampling rounds m. When the path fault rate R is 0.005, the curve of the probability of detecting arbitrary path fault approaches 1 fastest.

Figure 4: The relationship between Pd and m under different R
Fig. 5 shows that, when sampling rounds m is constant, the more single sample size k is, the higher the probability of detecting arbitrary path fault Pdwill be. The higher the path fault rate R is, the higher the probability of detecting arbitrary path fault Pd will be under the same single sample size k. When the path fault rate R is 0.005, the curve of the probability of detecting arbitrary path fault approaches 1 fastest.

Figure 5: The relationship between Pd and k under different R
In experiment 2, we take the number of experiments n, path fault rate R, and probability of detecting arbitrary path fault Pd as the main independent variables and observe the specific performance of the ProbD model under different network scales.
Fig. 6 shows that when the path fault rate R is 0.003 or 0.005, in the case of any combination of single sample size k is 100 or 200 and sampling rounds m is 5 or 10, the estimated path fault rate will be constantly close to real path fault rate as the increase of the number of experiments n. Among them, given the single sample size k and sampling rounds m, the estimated path fault rate is the average of the ratio of the number of faulty paths to the number of test paths in all experiments.
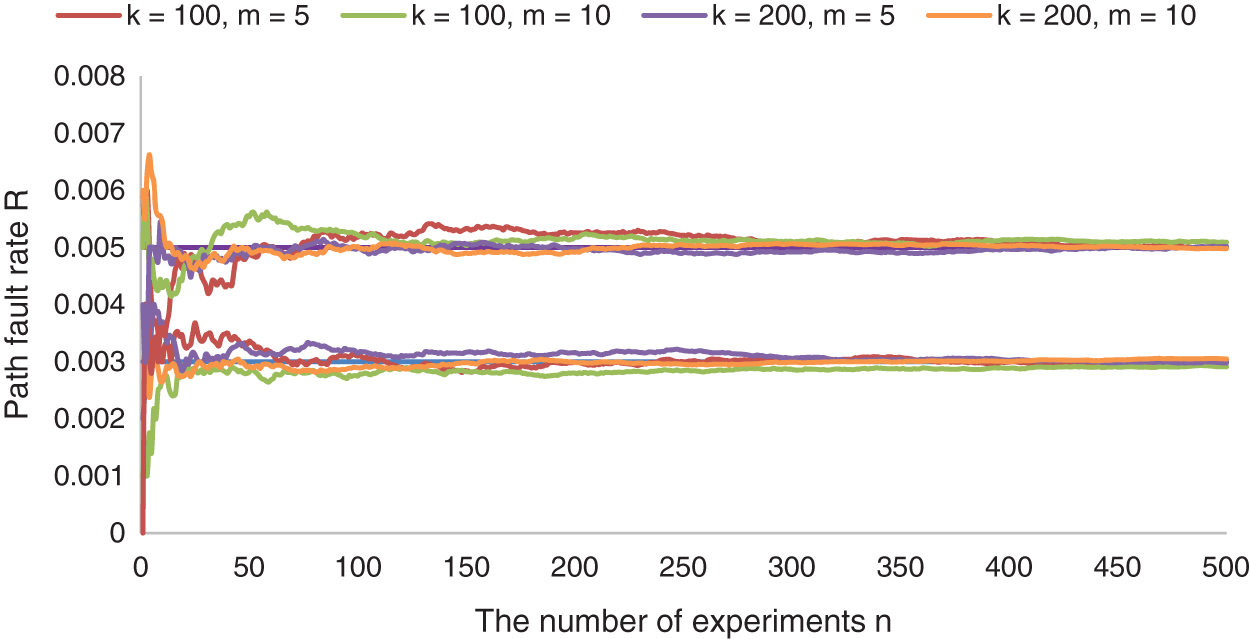
Figure 6: The relationship between the estimated R and n under different real R
Fig. 7 shows that, under the same probability of detecting arbitrary path fault Pd, the larger the scale of the network is, meaning that the network has more the number of full paths p, the lower the ratio of the number of test paths q to the number of full paths p will be. Compared to full path detection, more test overhead is saved. On the contrary, the smaller the network scale is, the higher the ratio of the number of test paths q to the number of full paths p will be. Under the same network scale, the higher the probability of detecting arbitrary path fault Pd, the higher the ratio of the number of test paths q to the number of full paths p.
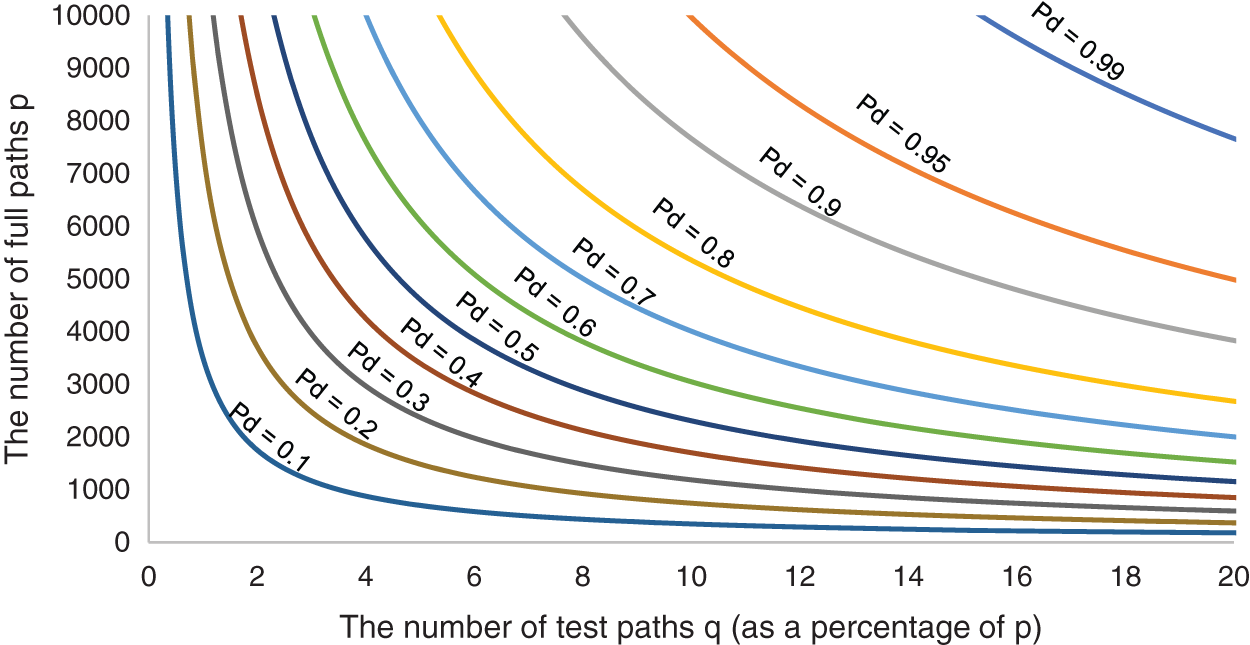
Figure 7: The relationship between p and q when R = 0.003
The experimental result of Figs. 7 and 8 has the same characteristics, so we will not reiterate them here. Comparing Fig. 8 with Fig. 7, we can find that, under the same network scale, the lower the path fault rate R is, the higher the ratio of the number of test paths q to the number of full paths p will be. For example, Set the expected probability of detecting arbitrary path fault Pd is 0.1, when the number of full paths p is 1000 and the path fault rate R is 0.03, the rate of several test paths q is 0.3%. However, when the path fault rate R is 0.003, the rate of several test paths q becomes 3.5%, and it means more test overhead.

Figure 8: The relationship when R changed from 0.003 to 0.03
In Experiment 1, we first demonstrated that, as the number of experiments n increased, the estimated probability of detecting arbitrary path fault would eventually fit the ideal probability, and it proved the correctness of the ideal probability. Secondly, we considered two cases. One was to increase the sampling rounds m under the same single sample size k; the other was to increase the single sample size k under the same sampling rounds m. In both cases, the probability of detecting arbitrary path fault Pd would eventually tend to 1 to find the path fault as the independent variable increases. Besides, the higher the path fault rate R of the network was, the less test overhead was required to find path fault.
In Experiment 2, we first demonstrated that, with a small number of experiments, we could correctly estimate the path fault rate of the network, which laid the foundation for calculating the total number of paths that needed to be detected. Secondly, we obtained the total number of paths needed to be detected according to the different probability of detecting arbitrary path fault Pd by the formula
We propose an efficient network fault testing model ProbD based on probability detection. It completes the testing of the SDN data plane with a small scale of samples by randomly sampling from the set of full paths. By simulating the ProbD model, we demonstrate the correctness and effectiveness of the ProbD model in Experiment 1, and we show the trend of the probability of detecting arbitrary path fault Pd under different test intensities. Secondly, we demonstrate the practicality of the ProbD model in Experiment 2, which means the model is capable of estimating path fault rate and designing the solutions. We also demonstrate that the ProbD model can achieve high confidence in the detection of large-scale networks. Besides, with the increase of network scale, the advantages of the probability detection method of the ProbD model become more and more obvious compared with full path detection.
Acknowledgement: We are thankful to all the collaborating partners.
Funding Statement: This work was supported by the Fundamental Research Funds for the Central Universities (2021RC239), the Postdoctoral Science Foundation of China (2021 M690338), the Hainan Provincial Natural Science Foundation of China (620RC562, 2019RC096, 620RC560), the Scientific Research Setup Fund of Hainan University (KYQD(ZR)1877), the Program of Hainan Association for Science and Technology Plans to Youth R&D Innovation (QCXM201910) and the National Natural Science Foundation of China (61802092, 62162021).
Conflicts of Interest: The authors declare that they have no conflicts of interest to report regarding the present study.
References
1. M. Beshley, N. Kryvinska, H. Beshley, M. Medvetskyi and L. Barolli, “Centralized QoS routing model for delay/loss sensitive flows at the SDN-IoT infrastructure,” Computers, Materials & Continua, vol. 69, no. 3, pp. 3727–3748, 2021. [Google Scholar]
2. G. R. Sreekanth, S. Ahmed, M. Sarac, I. Strumberger, N. Bacanin et al., “Mobile fog computing by using SDN/NFV on 5G edge nodes,” Computer Systems Science and Engineering, vol. 41, no. 2, pp. 751–765, 2022. [Google Scholar]
3. A. Tariq, I. U. Din, R. A. Rehman and B. Kim, “An intelligent forwarding strategy in SDN-enabled named-data IOV,” Computers, Materials & Continua, vol. 69, no. 3, pp. 2949–2966, 2021. [Google Scholar]
4. S. Shahzadi, F. Ahmad, A. Basharat, M. Alruwaili, S. Alanazi et al., “Machine learning empowered security management and quality of service provision in SDN-NFV environment,” Computers, Materials & Continua, vol. 66, no. 3, pp. 2723–2749, 2021. [Google Scholar]
5. R. Malavika and M. L. Valarmathi, “Adaptive server load balancing in SDN using PID neural network controller,” Computer Systems Science and Engineering, vol. 42, no. 1, pp. 229–243, 2022. [Google Scholar]
6. R. Stoenescu, M. Popovici, L. Negreanu and C. Raiciu, “Wavelength-switched passively coupled single-mode optical network,” in Proc. of the 2016 ACM SIGCOMM Conf., Florianopolis, Brazil, pp. 314–327, 2016. [Google Scholar]
7. E. Al-Shaer and S. Al-Haj, “FlowChecker: Configuration analysis and verification of federated OpenFlow infrastructures,” in Proc. of the 3rd ACM Workshop on Assurable and Usable Security Configuration, Chicago, Illinois, USA, pp. 37–44, 2010. [Google Scholar]
8. C. Rotsos, G. Antichi, M. Bruyere, P. Owezarski and A. W. Moore, “An open testing framework for next-generation OpenFlow switches,” in Proc. of the 2014 Third European Workshop on Software Defined Networks, Budapest, Hungary, pp. 127–128, 2014. [Google Scholar]
9. U. C. Kozat, G. Liang and K. Kökten, “On diagnosis of forwarding plane via static forwarding rules in software-defined networks,” in Proc. of the IEEE INFOCOM 2014-IEEE Conf. on Computer Communications, Toronto, ON, Canada, pp. 1716–1724, 2014. [Google Scholar]
10. K. Bu, X. Wen, B. Yang, Y. Chen, L. E. Li et al., “Is every flow on the right track?: Inspect SDN forwarding with rule scope,” in Proc. of the IEEE INFOCOM 2016-the 35th Annual IEEE Int. Conf. on Computer Communications, San Francisco, CA, USA, pp. 1–9, 2016. [Google Scholar]
11. J. Kempf, E. Bellagamba, A. Kern, D. Jocha, A. Takacs et al., “Scalable fault management for OpenFlow,” in Proc. of the 2012 IEEE Int. Conf. on Communications (ICC), Ottawa, ON, Canada, pp. 6606–6610, 2012. [Google Scholar]
12. C. Guo, L. Yuan, D. Xiang, Y. Dang, R. Huang et al., “Pingmesh: A large-scale system for data center network latency measurement and analysis,” in Proc. of the 2015 ACM Conf. on Special Interest Group on Data Communication, London, United Kingdom, pp. 139–152, 2015. [Google Scholar]
13. X. Jia, Y. Jiang and J. Zhu, “Link fault protection and traffic engineering in hybrid SDN networks,” in Proc. of the IEEE INFOCOM 2018-IEEE Conf. on Computer Communications Workshops (INFOCOM WKSHPS), Honolulu, HI, USA, pp. 853–858, 2018. [Google Scholar]
14. S. Sharma, D. Staessens, D. Colle, M. Pickavet and P. Demeester, “OpenFlow: Meeting carrier-grade recovery requirements,” Computer Communications, vol. 36, no. 6, pp. 656–665, 2013. [Google Scholar]
15. N. L. M. V. Adrichem, B. J. V. Asten and F. A. Kuipers, “Fast recovery in software-defined networks,” in Proc. of the 2014 Third European Workshop on Software Defined Networks, Budapest, Hungary, pp. 61–66, 2014. [Google Scholar]
16. D. Liang, Q. Liu, B. Yan, Y. Hu, B. Zhao et al., “Low interruption ratio link fault recovery scheme for data plane in software-defined networks,” Peer-to-Peer Networking and Applications, vol. 14, no. 6, pp. 3806–3819, 2021. [Google Scholar]
17. K. Agarwal, E. Rozner, C. Dixon and J. Carter, “SDN traceroute: Tracing SDN forwarding without changing network behavior,” in Proc. of the Third Workshop on Hot Topics in Software Defined Networking, Chicago, Illinois, USA, pp. 145–150, 2014. [Google Scholar]
18. H. Zhang, C. Lumezanu, J. Rhee, N. Arora, Q. Xu et al., “Enabling layer 2 pathlet tracing through context encoding in software-defined networking,” in Proc. of the Third Workshop on Hot Topics in Software Defined Networking, Chicago, Illinois, USA, pp. 169–174, 2014. [Google Scholar]
19. S. Narayana, M. T. Arashloo, J. Rexford and D. Walker, “Compiling path queries,” in Proc. of the 13th USENIX Symp. on Networked Systems Design and Implementation (NSDI 16), Santa Clara, CA, USA, pp. 207–222, 2016. [Google Scholar]
20. Y. Wang, J. Bi and K. Zhang, “A tool for tracing network data plane via SDN/OpenFlow,” Science China Information Sciences, vol. 60, no. 2, pp. 1–13, 2017. [Google Scholar]
21. Y. Gao, Y. Jing and W. Dong, “UniROPE: Universal and robust packet trajectory tracing for software-defined networks,” IEEE/ACM Transactions on Networking, vol. 26, no. 6, pp. 2515–2527, 2018. [Google Scholar]
22. S. Xiong, Q. Cao and W. Si, “Adaptive path tracing with programmable bloom filters in software-defined networks,” in Proc. of the IEEE INFOCOM 2019-IEEE Conf. on Computer Communications, Paris, France, pp. 496–504, 2019. [Google Scholar]
Cite This Article
 Copyright © 2023 The Author(s). Published by Tech Science Press.
This work is licensed under a Creative Commons Attribution 4.0 International License , which permits unrestricted use, distribution, and reproduction in any medium, provided the original work is properly cited.
 Downloads
 Citation Tools