
 Submit a Paper
 Propose a Special lssue
 Open Access
ARTICLE

The Impact of Hydrogen Energy Storage on the Electricity Harvesting
1 Department of Mechanical Engineering, Faculty of Engineering, K.C.KARE Energy Research and Innovation Centre, King Abdulaziz University, Jeddah, 21589, Saudi Arabia
2 Department of Mechanical Engineering, College of Engineering, Taif University, P. O. Box 11099, Taif, 21944, Saudi Arabia
3 Department of Electrical Engineering, University of Engineering & Technology Peshawar, Pakistan
4 University of South-Eastern Norway, Bredalsveien 14, 3511 Hønefoss, Norway
* Corresponding Author: Dag Øivind Madsen. Email:
Intelligent Automation & Soft Computing 2023, 36(2), 1963-1978. https://doi.org/10.32604/iasc.2023.033627
Received 23 June 2022; Accepted 04 August 2022; Issue published 05 January 2023
 View Full Text
 Download PDF
Abstract
The economics, infrastructure, transportation, and level of living of a country are all influenced by energy. The gap between energy usage and availability is a global issue. Currently, all countries rely on fossil fuels for energy generation, and these fossil fuels are not sustainable. The hydrogen proton exchange membrane fuel cell (PEMFC) power system is both clean and efficient. The fuel delivery system and the PEMFC make up the majority of the PEMFC power system. The lack of an efficient, safe, and cost-effective hydrogen storage system is still a major barrier to its widespread use. Solid hydrogen storage has the large capacity, safety and good reversibility. As a hydrogen source system, the hydrogen supply characteristics affect the characteristics of the PEMFC at the output. In this paper, a mathematical model of a hydrogen source reactor and PEMFC based on chemical absorption/desorption of solid hydrogen storage is established, and a simulation model of a PEMFC power system coupled with solid hydrogen storage is established using MATLAB/SIMULINK software, and the hydrogen supply of the reactor is analyzed in detail. The influence of prominent factors is evaluated. The research results show that the proposed method improved the system performance. At the same time, increasing the PEMFC temperature, increasing the area of the proton exchange membrane and the oxygen supply pressure can increase the output power of the power system.Keywords
The proton exchange membrane fuel cell (PEMFC) is an efficient and clean electric energy conversion device [1]. The PEMFC uses hydrogen as the anode fuel and oxygen as the cathode oxidant. The electrochemical reaction between hydrogen and oxygen generates electricity. Compared with the traditional thermal power generation technology, PEMFC products have no pollution to the environment, and there is no noise during operation, and the conversion efficiency is higher than that of general heat engines. It is an ideal energy utilization method [2–6]. It is precisely because of the outstanding advantages of PEMFC that it has not only been applied in professional military fields such as aviation and submarine [7,8], but also has been successfully applied in civil applications such as power stations, new energy vehicles and portable power supplies [9].
The exchange membrane fuel cell (EMFC) power system is an integrated power supply device, which is mainly composed of a hydrogen source system and a PEMFC. The hydrogen source system provides fuel for the PEMFC to generate electricity. The traditional hydrogen source system mainly uses high-pressure hydrogen storage technology or low-temperature liquid hydrogen storage technology to store hydrogen first, and when the PEMFC needs hydrogen, the hydrogen is released to supply hydrogen to the PEMFC [10]. However, traditional hydrogen energy storage technology has restrictive factors such as huge system volume, large energy loss, high cost, and low security [11–14]. Compared with traditional hydrogen storage technology, chemical adsorption hydrogen storage is an efficient new indirect hydrogen storage method. The hydrogen storage principle is that the hydrogen storage material chemically reacts with hydrogen to absorb hydrogen. When certain conditions are provided by the outside world, hydrogen storage The reaction proceeds in the reverse direction and hydrogen is released [15]. Unlike traditional hydrogen storage methods, the characteristics of the chemical adsorption hydrogen storage hydrogen source system are controlled by the hydrogen storage reactor, and the temperature and pressure of the hydrogen flow will change as the operating conditions of the hydrogen storage reactor change [16]. The hydrogen output from the hydrogen source system is used as the inlet fuel of the fuel cell, and its temperature, pressure, flow rate and other parameters have a great influence on the output characteristics of the fuel cell [17].
Reference [18] conducted experiments and found that under certain environmental conditions, the optimal operating temperature Topt increases as the output current increases. When the output current is less than 50 A, the environmental humidity RH has almost no effect on Topt. Reference [19] used the fuel cell tester of Arbin Instrument Company of the United States as the fuel cell test system to study the influence of hydrogen gas intake on fuel cell performance. The experimental results showed that in the case of increased hydrogen flow, the limit current density with a slight increase, the battery performance remains stable, so controlling the intake air volume within a certain range does not have a great impact on the fuel cell. Reference [20] established a mathematical model including the electrochemical model and temperature model of the proton exchange membrane fuel cell, analyzed in detail the influence of various parameters on the fuel cell, and controlled its output unstable voltage. As a PEMFC power system, the hydrogen storage reactor provides hydrogen to the PEMFC. The hydrogen supply characteristics of the hydrogen storage reactor will directly affect the performance of the PEMFC, and the output characteristics of the PEMFC determine the energy conversion efficiency of the entire hydrogen power system, but it is currently based on the solid-state hydrogen storage reaction The coupling characteristics of chemical adsorption hydrogen storage and PEMFC are not clear yet.
Therefore, based on the hydrogen power system of the chemical adsorption hydrogen storage reactor using LaNi5 as the hydrogen storage medium and the PEMFC using H2 as the fuel, this paper studies the operating parameters and design parameters of the hydrogen power system on the output characteristics of the fuel cell by establishing a mathematical model. At the same time, the concept of power sensitivity factor is proposed, and the influence of various parameters on the output power of the hydrogen power system is quantitatively compared, which provides an optimization idea for the efficient use of the PEMFC power system.
2 Hydrogen Storage Reactor Model
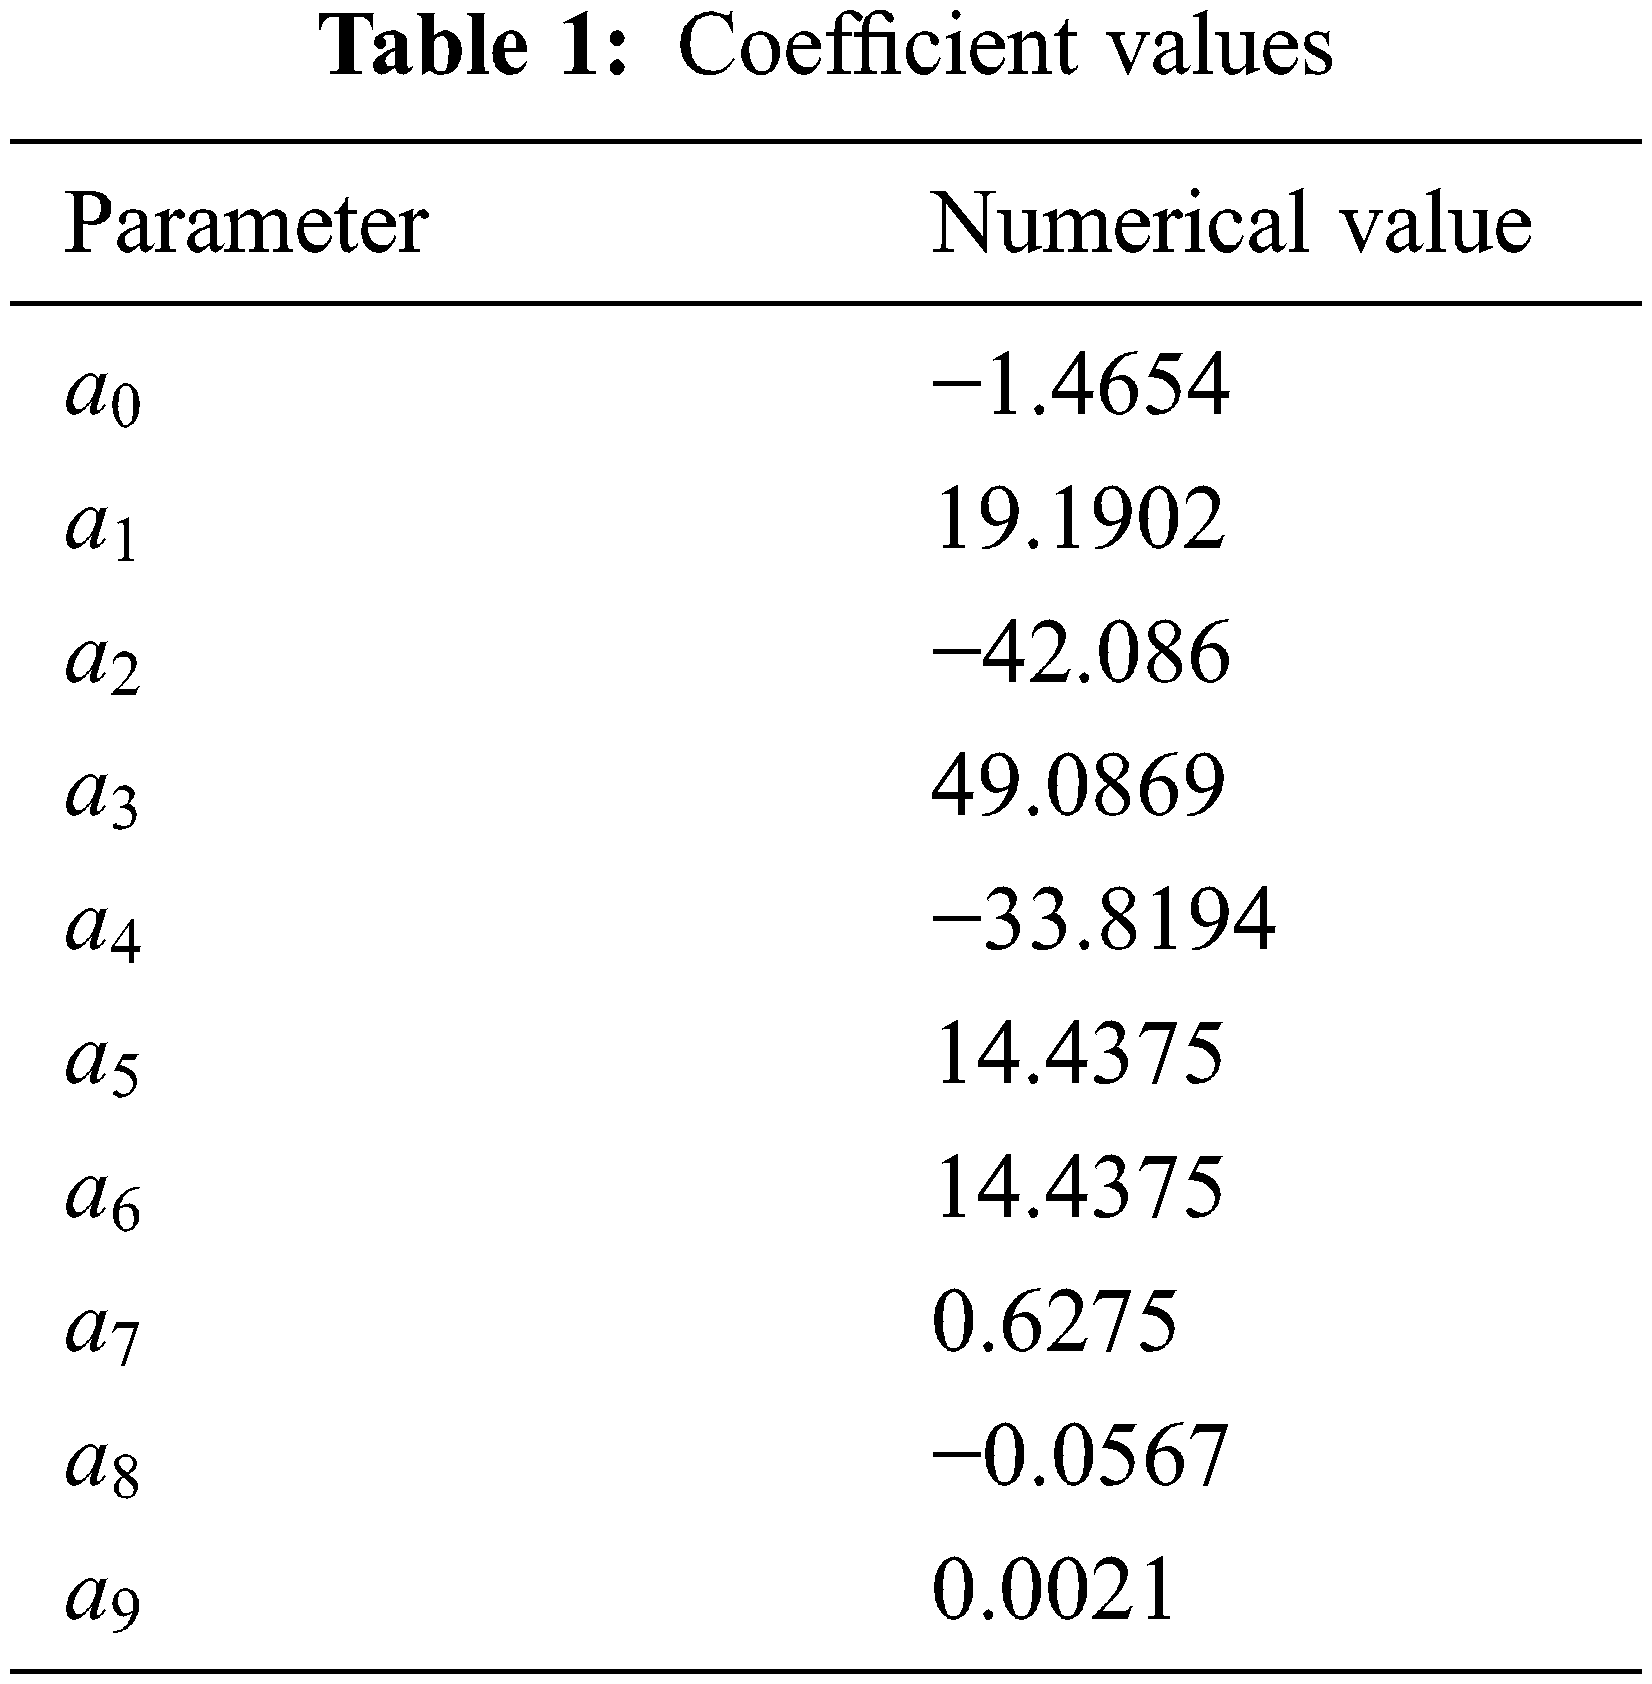
The hydrogen required by the hydrogen fuel cell to work is provided by the hydrogen storage reactor during the hydrogen release stage, so the fuel cell is more sensitive to the hydrogen release pressure of the hydrogen storage reactor. The working principle of hydrogen release in the hydrogen storage reactor is as follows. When the internal pressure of the reactor is lower than the equilibrium pressure under the same conditions, the solid hydrogen storage medium will release hydrogen at the equilibrium pressure. When the initial pressure inside the reactor is higher than the equilibrium pressure, no hydrogen will be released at this time. Since the solid hydrogen storage medium metal hydride is more sensitive to liquid/gaseous water, the solid hydrogen storage reactor supplies the proton exchange membrane fuel cell with hydrogen as dry hydrogen. The equilibrium pressure is generally affected by the reactor temperature. The higher the reactor temperature, the greater the equilibrium pressure. The relationship between equilibrium pressure and temperature can be expressed by Eq. (1):
In the formula,
The coefficients of the equilibrium pressure calculation formula are shown in Table 1.
The main working principle of PEMFC is that under the action of the anode catalyst, the hydrogen gas reacts to generate hydrogen ions and electrons. The hydrogen ions reach the anode of the fuel cell through the proton exchange membrane. Electric current is generated during the entire charge movement and ion movement, and finally the electric energy is generated. The whole process is accompanied by the generation of water and heat [21–23]. During the entire electrochemical reaction process, the voltage generated by the fuel cell can be calculated by the Nernst equation. In the actual working process, the fuel cell will produce three kinds of voltage loss with the change of current density, namely activation overvoltage, ohmic overvoltage, and concentration overvoltage, so the final output voltage of the fuel cell can be calculated by Eq. (3). As the current density increases, the output voltage of the fuel cell will also decrease due to the existence of three voltage polarizations. In the process of increasing current density, the three voltage polarization characteristics divide the whole process into three stages, namely low current density area, medium current density area and high current density area. In the low current density area, the voltage loss is dominated by activation overvoltage. In the medium current density area, the voltage loss is dominated by ohmic overvoltage. In the high current density area, the concentration overvoltage is dominant. The following is the calculation method of the output voltage of a single fuel cell based on the physical and chemical process of PEMFC and the experimental characteristics of it [24]
The Nernst voltage of PEMFC can be calculated using the standard state entropy change of the Nernst equation, and the specific calculation formula is as follows [25]
In the formula,
The activation overvoltage is caused by the transfer of electrons and the formation and breaking of the chemical bond between the cathode and the anode, so part of the available energy is lost in the process of driving the chemical reaction and transferring electrons between the electrodes. The activation overvoltage can occur at both the anode and cathode of the fuel cell, but the oxidation reaction of hydrogen at the anode is very fast, while the oxygen reaction at the cathode is slow, causing the activation overvoltage to basically occur on the cathode side. The following is used to calculate the activation empirical formula for voltage [26,27]
In the formula,
In the formula, A represents the area of the proton exchange membrane in cm2;
The anode hydrogen concentration and cathode oxygen concentration are functions of battery temperature and can be calculated by Henry’s law
The ohmic overvoltage is mainly caused by the impedance of the proton exchange membrane to the transfer of protons and the impedance of the fuel cell electrode to the transfer of electrons. According to Ohm’s law, the ohmic voltage drop is proportional to the current density, which can be calculated by the following formula [28,29]
In the formula, the impedance
The impedance of ions passing through the electrolyte
where
Concentration overvoltage is the voltage loss caused by the gradual consumption of reactants in the reaction process, resulting in a gradual decrease in concentration. Concentration polarization mainly plays a major role when the current density is high, because the high current density increases the consumption of the reactants, the concentration changes more drastically, and the concentration overvoltage increases. The theoretical formula of concentration polarization overvoltage is more complicated. Generally, empirical formula is used to calculate concentration overvoltage. The calculation formula of concentration overvoltage used in this paper is as follows
In the formula, m and n are the mass transfer coefficients of the fuel cell, and their values are mainly determined by the conductivity of the electrolyte and the porosity of the gas diffusion layer. m is also affected by the operating temperature of the fuel cell, and has the following two different expressions:
3.5 Output Power and Efficiency
The output power P of a single fuel cell can be calculated by Eq. (16) as follows
In the formula,
The output power of a single fuel cell is relatively small. Generally, multiple fuel cells are connected in series to form a stack for use. At this time, the stack output power can be expressed by Eq. (17), where N is the number of fuel cells connected in series.
The output efficiency of the fuel cell can be calculated by Eq. (18), where μf is the fuel utilization efficiency, generally within the range of 95%. 1.48 V is the maximum theoretical output voltage that the fuel cell can achieve.
In order to test the rationality of the model, based on the above equation of fuel cell output voltage, this paper uses MATLAB/SIMULINK software to establish a single fuel cell model. The specific parameters are shown in Table 2 and compare the data obtained by the simulation with the experimental data in the literature, and the comparison result is shown in Fig. 1. It can be seen from the figure that the simulation results and the experimental data are in good agreement with the partial pressures of fuel hydrogen and oxygen at a temperature of TPEM = 323 K at 1.013 × 10⁵ Pa, 2.026 × 10⁵ Pa, 3.039 × 10⁵ Pa, etc., indicating that the proposed model can be used to study the characteristics of hydrogen storage reactor coupled with fuel cell power system.
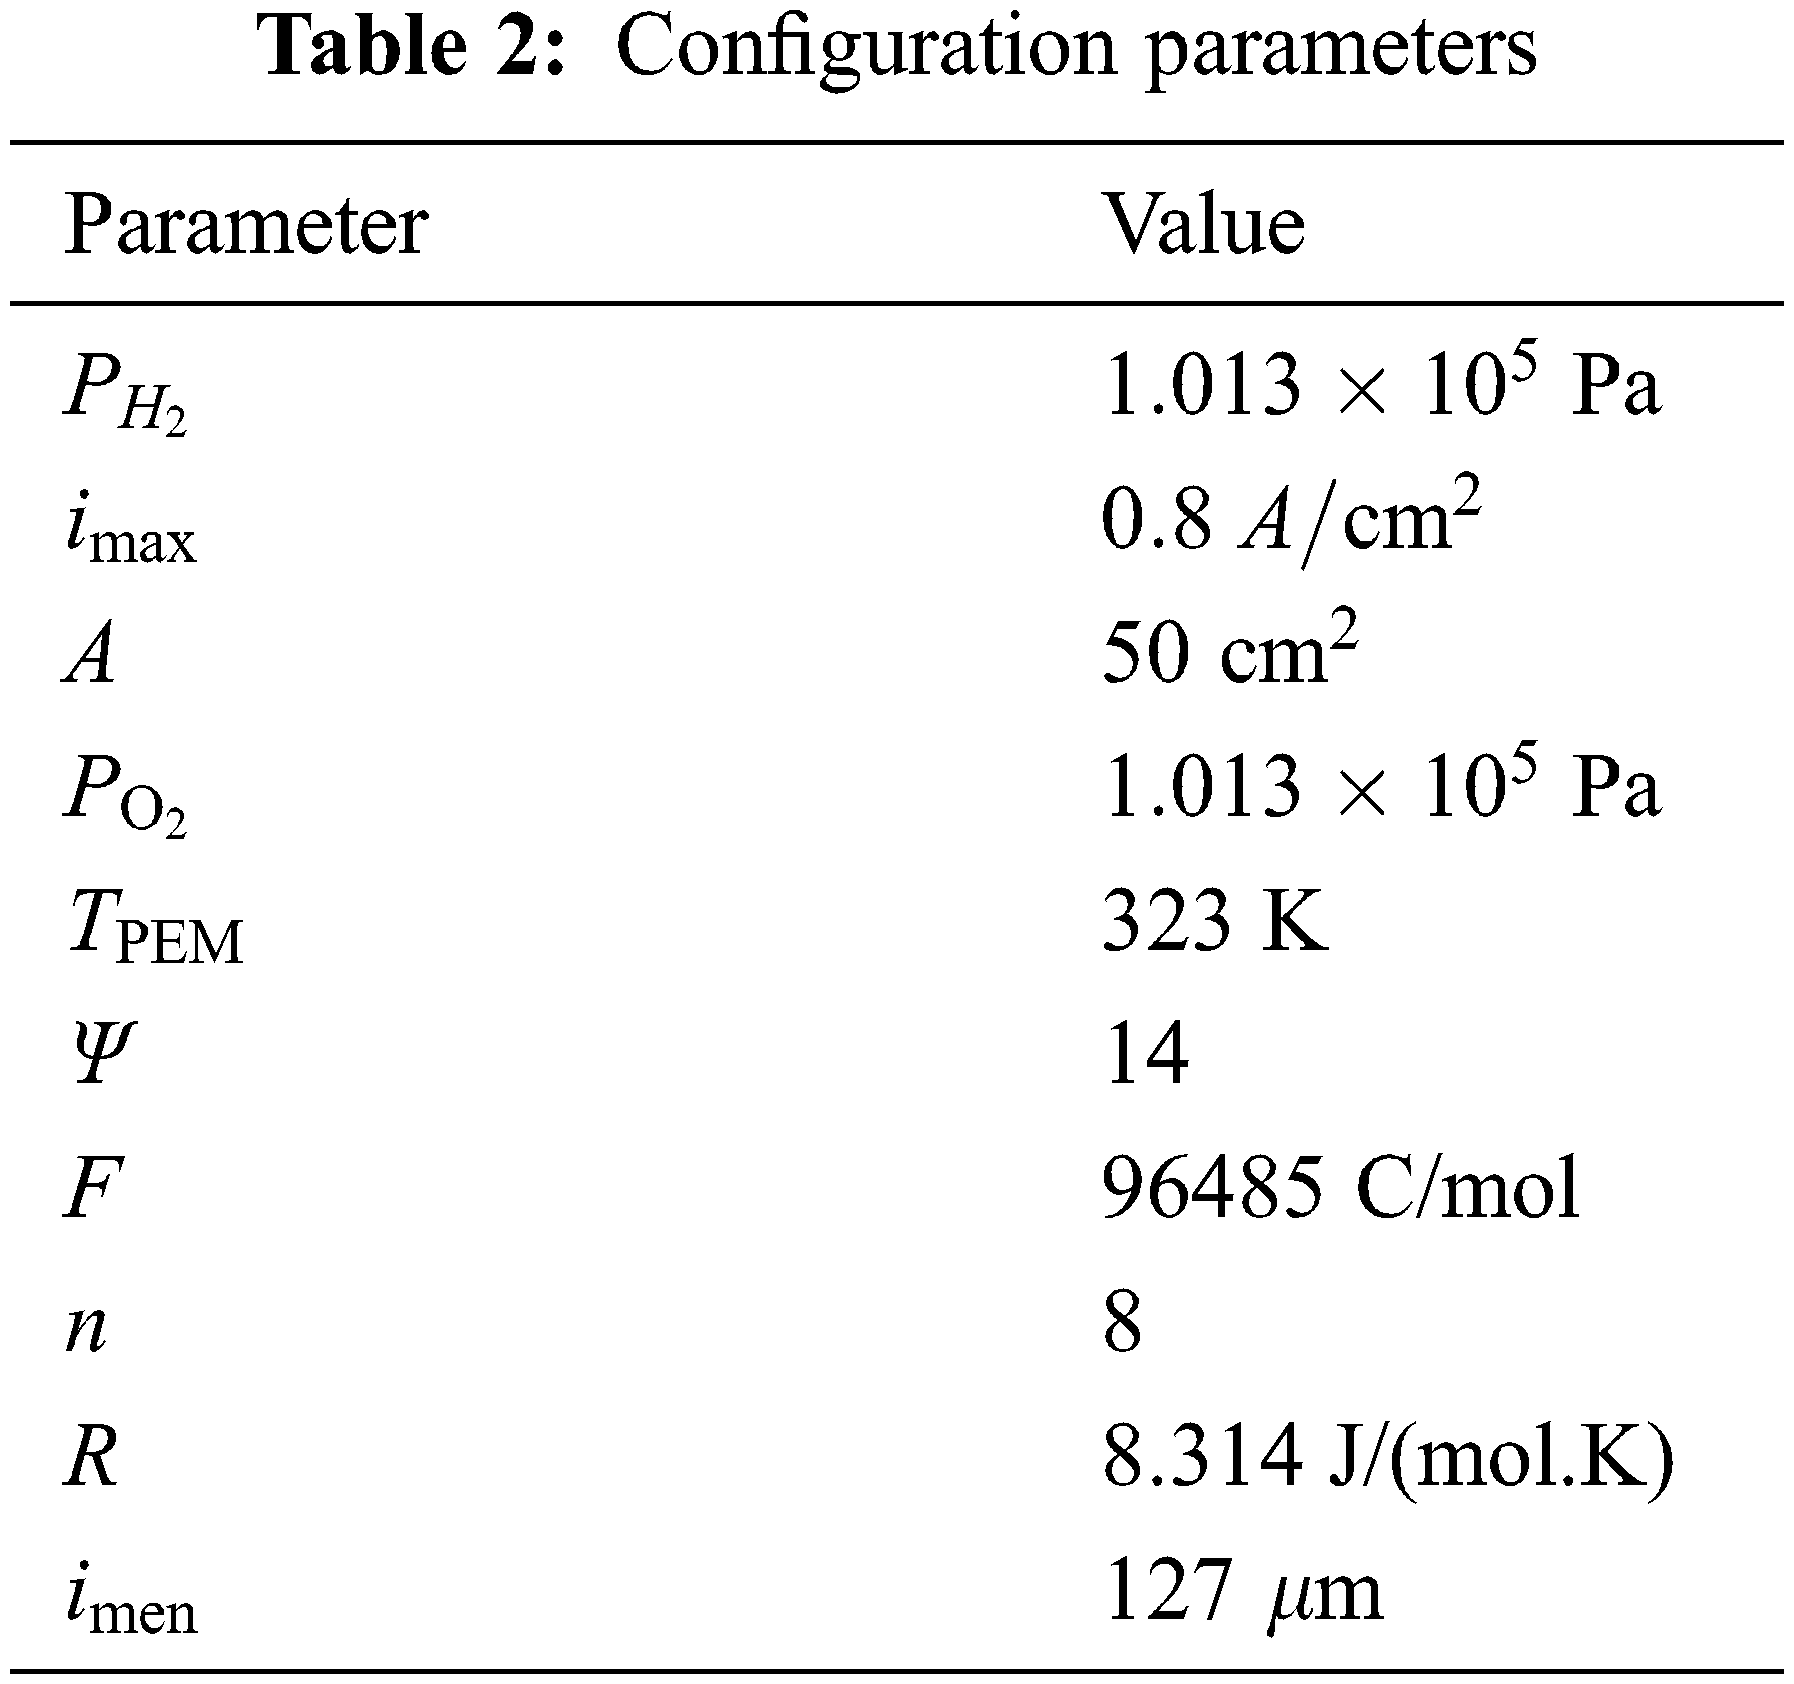
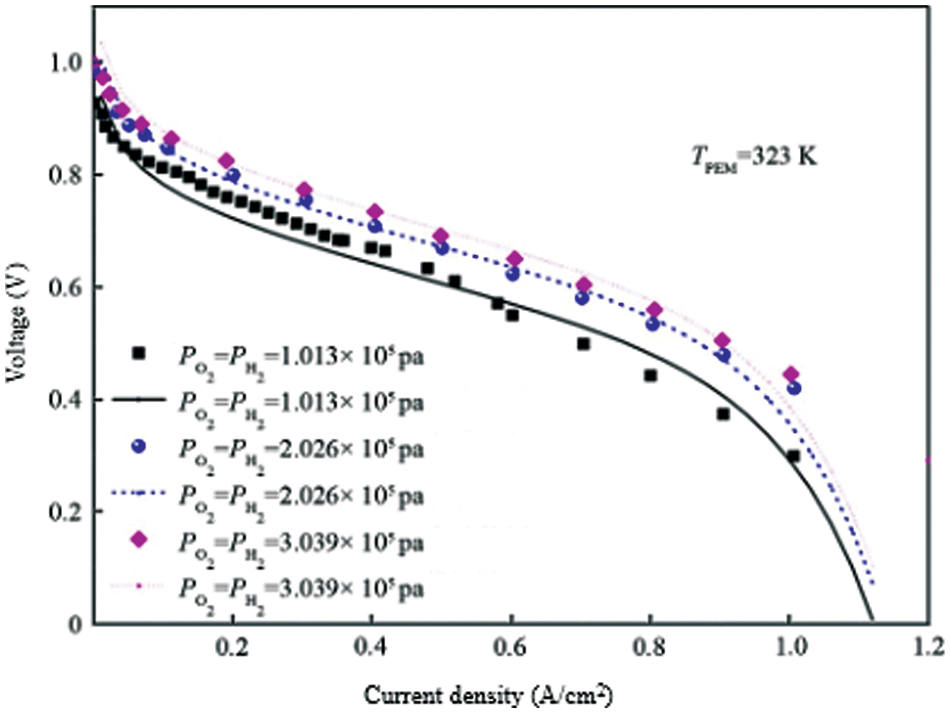
Figure 1: Comparison of the fuel cell output voltage
4.2 Influence of Temperature on Fuel Cell Characteristics
As the temperature of a fuel cell increases, the rate of electrochemical reactions inside it increases, and its output voltage changes. Therefore, the temperature of the fuel cell is an important factor affecting the hydrogen power system. Since the hydrogen power system is affected by many factors, in order to obtain the influence of a certain parameter on the output characteristics of the fuel cell, other operating parameters are kept constant during the research process in order to analyze the influence of a single parameter on it. Based on this, the hydrogen supply pressure of the hydrogen storage reactor is maintained unchanged, which is the hydrogen supply pressure at 343 K, the atomic ratio is set to 0.5, the proton exchange membrane area is set to 280 cm2, and the other parameters are consistent with those in the verification model. The fuel cell cathode oxygen supply pressure is set to 3.039 × 10⁵ Pa, and the fuel cell temperature is set to five temperature gradients of 313, 323, 333, 343, and 353 K, and the influence of temperature on its output characteristics is studied.
The voltage-current density curve of the fuel cell at different temperatures is shown in Fig. 2. When the temperature of the hydrogen storage reactor is kept constant, the output voltage of a single fuel cell gradually increases as the working temperature of the fuel cell increases. This is because the temperature of the fuel cell increases and the reaction kinetics of the fuel cell accelerates, which is conducive to accelerating the electrochemical reaction of the fuel cell. Therefore, the increase in the temperature of the fuel cell is conducive to the output of the voltage. At the same temperature, the output voltage of the fuel cell gradually decreases with the increase of the current density. This is due to the increase of the current density and the increasing irreversible loss of the three voltages inside the fuel cell, causing the total output voltage to gradually decrease. From Fig. 2, the higher the operating temperature of the fuel cell, the more favorable the output voltage of the fuel cell. As shown in the figure, when the temperature is 353 K (80°C), the output voltage is significantly higher than the output voltage at other temperatures. But in fact, the temperature of the fuel cell should not be too high. If the temperature of the fuel cell is too high, it will easily evaporate the water in the fuel cell, causing the proton exchange membrane to dehydrate or even dry up, resulting in a decrease in membrane conductivity and an increase in its resistance, which will lead to a sharp decline in fuel cell performance.
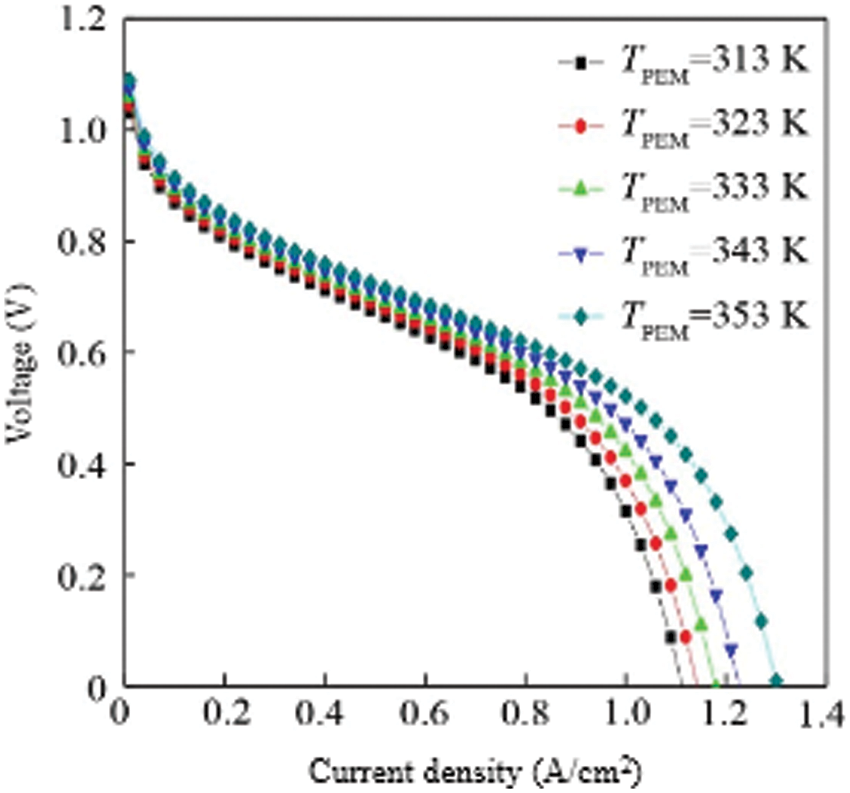
Figure 2: Density of the VI of single cell with varying temperature
Because the electric energy that a single fuel cell can provide is limited, usually multiple fuel cells are used in series, so when studying the relationship between power and temperature, a stack of 35 fuel cells in series is used as the research object.
Fig. 3 shows the power curve of the fuel cell stack at different temperatures. It can be seen from the figure that the power of a single fuel cell gradually increases with temperature under the same current density. This is because the output voltage of the fuel cell gradually increases with temperature, so the power will gradually increase with temperature. At the same temperature, the power of a single fuel cell first reaches a “peak value” as the current density increases. For example, when TPEM = 353 K, the current density reaches about 5130 W at 1.1 A/cm2, and the current density further increases. The output power is gradually reduced until it is zero. This is because in the case of low current density, although the output voltage is high, the current is low, resulting in low power. When the current density gradually increases and the voltage loss is not large, the stack will have the maximum power. It can be drawn from the power curve that, at the same temperature, the current density at which the fuel cell power peaks are the optimal operating current density of the fuel cell. Higher or lower current density will reduce the output power.
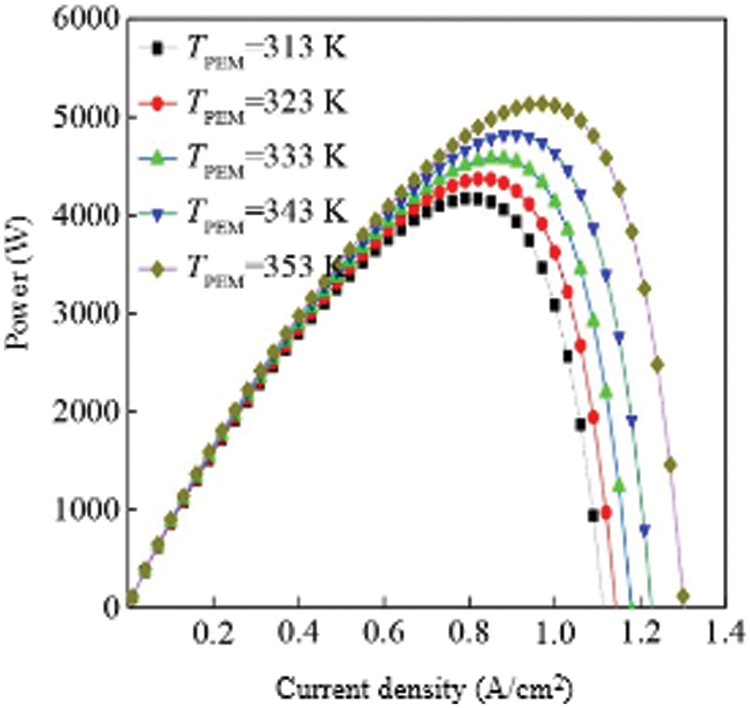
Figure 3: Density of the VI of multiple cell with varying temperature
Fig. 4 shows the efficiency curves of fuel cells at different temperatures. Since the calculation of efficiency is proportional to the calculation of the output voltage of a single fuel cell, the curve is similar to the output voltage curve of a single fuel cell. Similarly, the efficiency of a fuel cell increases with increasing temperature at the same current density. From the comparison of the efficiency curve and the power curve, we can conclude that the efficiency is not the highest at the current density corresponding to the highest power point at the same temperature. When the temperature is TPEM = 353 K, the current density corresponding to the highest power point is 1.0 A/cm2, and the efficiency at this time is about 45%, which is higher than that of a general internal combustion engine [30–32].
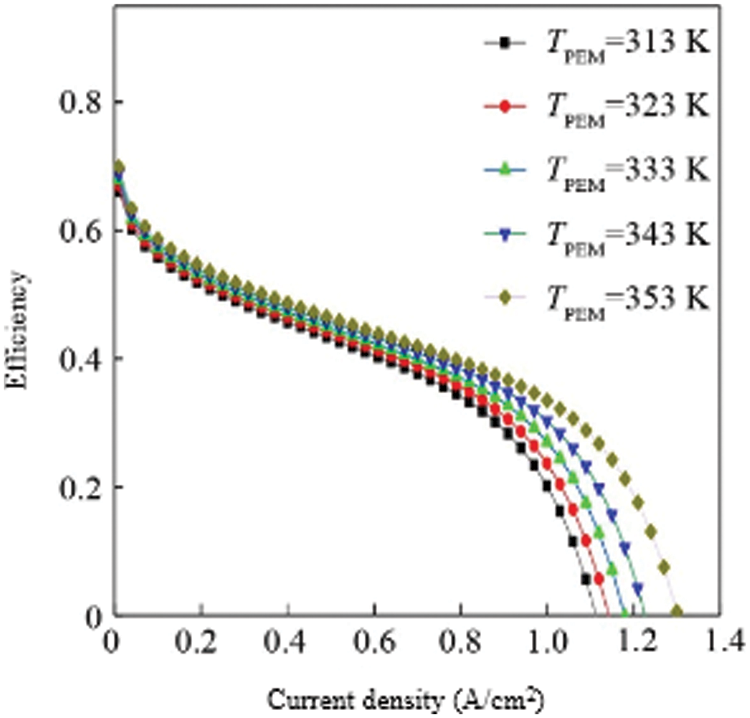
Figure 4: Single-cell efficiency analysis
4.3 Battery Characteristics Analysis
The hydrogen pressure required by the anode of the fuel cell is supplied by the hydrogen storage reactor, so changes in the parameters of the hydrogen storage reactor will also have a greater impact on the entire hydrogen fuel cell power system. The main parameter that affects the hydrogen release pressure of the hydrogen storage reactor is the reactor bed temperature. When the reactor temperature is different, the hydrogen release pressure of the reactor will be different, and the output characteristics of the fuel cell will also change accordingly, in order to study the hydrogen storage reaction influence on the output power of the fuel cell, the relationship between the reactor temperature and its output hydrogen pressure is first given, as shown in Fig. 5.
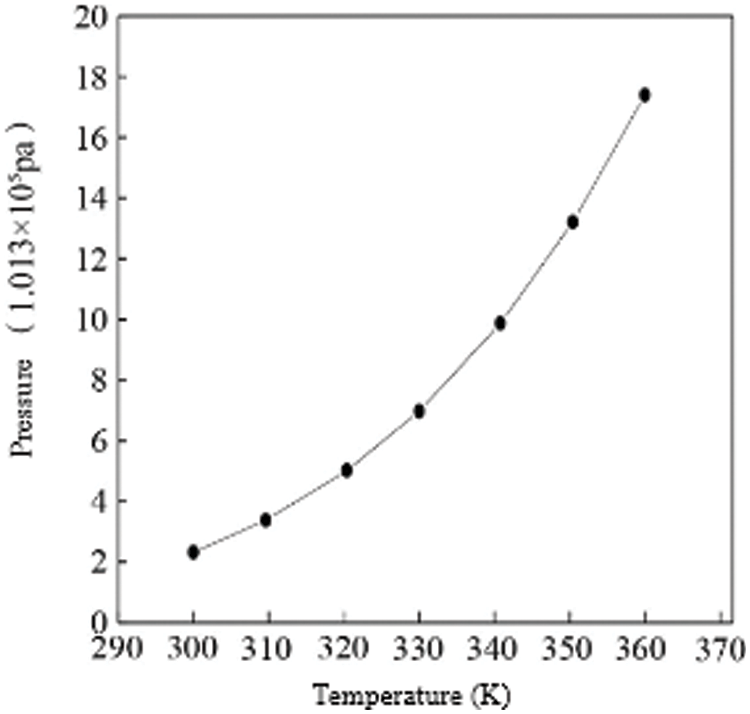
Figure 5: Analysis of pressure of hydrogen storage reactor
According to the relationship between the output hydrogen pressure and temperature, the output hydrogen pressure is set to 3.039 × 10⁵ Pa, 5.065 × 10⁵ Pa, 7.091 × 10⁵ Pa, 9.117 × 10⁵ Pa by changing the reactor temperature, and the cathode oxygen supply is set. The pressure is 3.039 × 10⁵ Pa, the fuel cell temperature is 343 K, and the output power of the stack varies with the current density under the conditions of the other parameters unchanged. Fig. 6 shows the curve of fuel cell output power vs. current density under different hydrogen pressures. Under different hydrogen supply pressures, the power of the stack changes little. For example, when the hydrogen supply pressure is 3.039 × 10⁵ Pa and 9.117 × 10⁵ Pa, the difference between the fuel cell stack’s highest power point is about 330 W. If the fuel cell stack is used in small electrical appliances, it needs less power, and the number of fuel cells in series is larger. The drop in hydrogen supply pressure has little effect on the power drop of the fuel cell stack. If the fuel cell stack is used in large-scale electrical appliances, the output power required is relatively large, the number of fuel cells in series is large, and the power loss caused by the temperature drop of the reactor is large, which is not conducive to the efficient use of energy. Therefore, the hydrogen fuel cell power system used in large electrical appliances should increase the hydrogen release temperature of the reactor as much as possible within the allowable range to increase the hydrogen supply pressure to increase the output efficiency of the fuel cell stack.
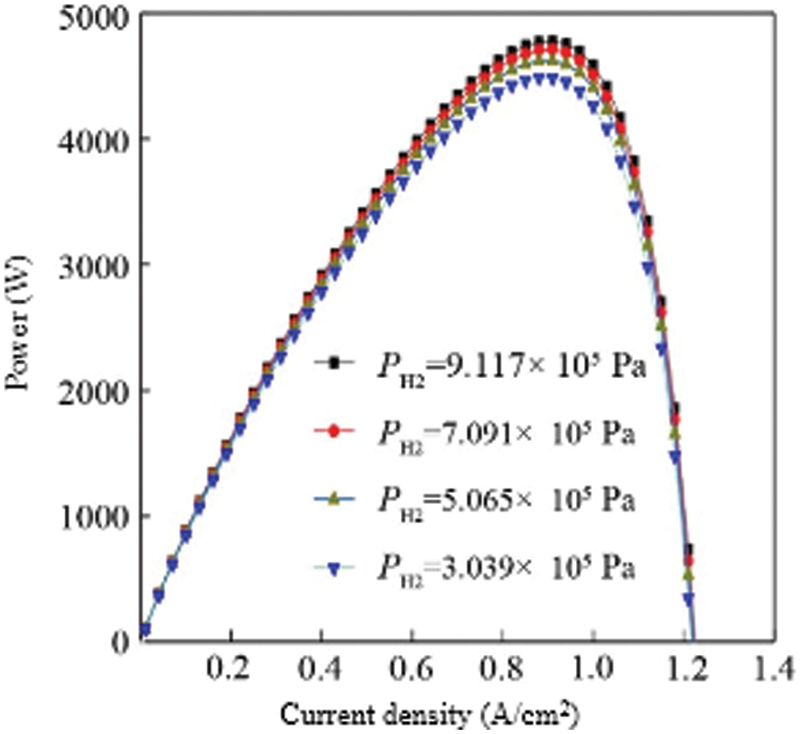
Figure 6: Comparison of the power vs. hydrogen supply pressure for multiple cells
The total reaction inside the fuel cell is the process of hydrogen and oxygen reacting to produce water, so the oxygen supply pressure at the cathode will also affect the output characteristics of the fuel cell. When the cathode oxygen supply pressure is insufficient, the electrochemical reaction is incomplete, and the maximum energy conversion efficiency cannot be reached. When the cathode oxygen supply pressure is too large, the compressor power consumption will increase significantly, which will increase the system cost and easily damage the internal structure of the fuel cell. Therefore, choosing the appropriate oxygen pressure is also important for the output characteristics of the fuel cell. In order to study the influence of cathode oxygen pressure on fuel cell output characteristics, the simulation conditions are: hydrogen pressure is maintained at 3.039 × 10⁵ Pa, fuel cell temperature is set at 343 K, proton exchange membrane area is 280 A/cm2, and oxygen pressure is 3.039 × 10⁵ Pa, 5.065 × 10⁵ Pa, 7.091 × 10⁵ Pa, 9.117 × 10⁵ Pa four pressure gradients, other parameters remain unchanged. Fig. 7 is the curve of the output power of the fuel cell with the current density under the working conditions of different cathode oxygen pressures.
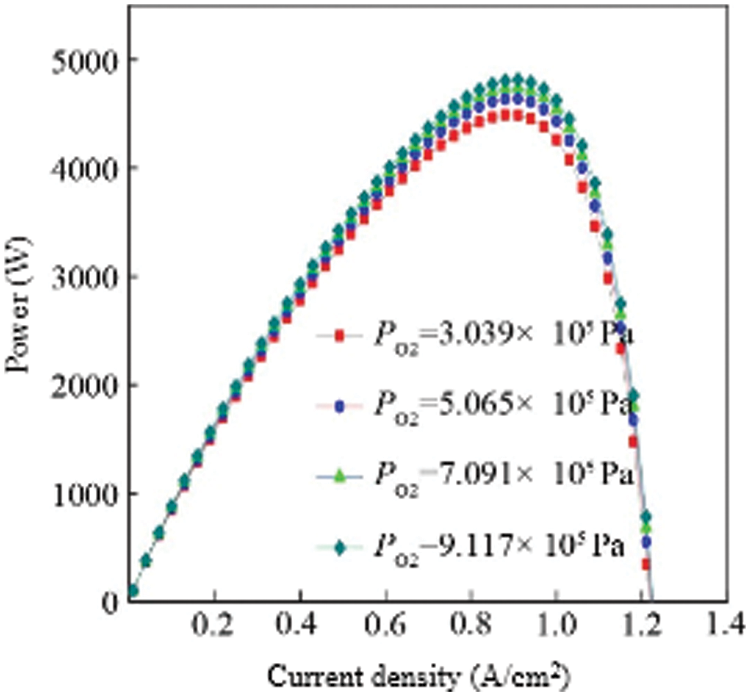
Figure 7: Comparison of the power vs. oxygen supply pressure for multiple cells
It can be seen from the figure that as the cathode oxygen pressure gradually increases, the fuel cell output power also gradually increases, and the degree of change is greatest at the fuel cell power “peak”. Like the influence of hydrogen pressure on the output power of a fuel cell, the increase in oxygen pressure has a smaller effect on the increase in output power. For example, the difference between the oxygen pressure of 3.039 × 10⁵ Pa and the oxygen pressure of 9.117 × 10⁵ Pa is 324 W at the peak power, which is roughly the same as the effect of hydrogen on the output power. Therefore, increasing the hydrogen and oxygen pressure is conducive to the increase of output power, but it is not that the higher the pressure, the better. When the pressure is too high, the power consumption of the compressor will increase significantly, increasing the system cost. At this time, the appropriate hydrogen and oxygen pressures should be selected according to the system cost and fuel cell structure.
4.4 Influence of Different Area on Fuel Cell Output Characteristics
The proton exchange membrane is an important part of the fuel cell. Its main function is to block the direct contact reaction between the fuel and the oxidant and to conduct protons. The area of the proton exchange membrane is an important parameter that affects the output characteristics of the fuel cell. By changing the area of the proton exchange membrane, the output power of the fuel cell stack under different membrane areas can be obtained, which is used to analyze the influence of the proton exchange membrane area on the fuel cell. In this study, the area of the proton exchange membrane was set to 240, 260, 280, 320 cm2, the anode hydrogen supply pressure and cathode oxygen pressure were set to 3.039 × 10⁵ Pa, and the fuel cell temperature was set to 343 K, which was calculated according to the built model Output power-current density curves under different membrane areas to obtain the influence of membrane area on fuel cell characteristics. When the area of the proton exchange membrane is 240, 260, 280, 320 cm2, the output power and voltage curves of the fuel cell stack are shown in Fig. 8.
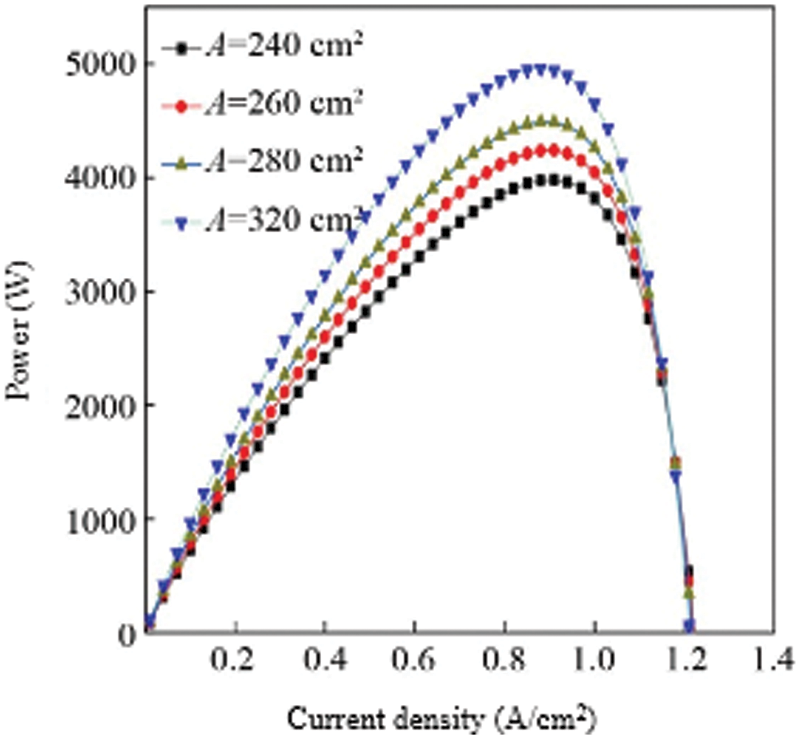
Figure 8: Comparison of power of multiple cells with different membrane areas
It can be seen from the figure that as the area of the proton exchange membrane increases, the output power gradually increases. This is because the larger the area of the proton exchange membrane, the more supported catalyst, which means that the larger the activation area of the fuel cell, the better the output performance of the fuel cell. When the area of the proton exchange membrane is 320 cm2, the maximum output power appears at a current density of 0.9 A/cm2, and the maximum output power is about 4945 W. When the area of the proton exchange membrane is 280 cm2, the maximum output power appears at a current density of 0.95 A/cm2, the maximum output power is about 4452 W, and the peak output power increases by 493 W, indicating that increasing the area of the proton exchange membrane can greatly increase the output power of the fuel cell stack. When the area of the proton exchange membrane gradually increases, the peak output power of the fuel cell stack shifts to the direction of decreasing current density. The maximum value of the rate moves in the direction of increasing current density. However, the output characteristics of the cell under the unit membrane area have not changed much. Fig. 9 shows the influence of different proton exchange membrane areas on the output characteristics of the fuel cell under the unit membrane area. It can be seen from the figure that the output power per unit membrane area does not increase significantly as the area of the proton exchange membrane increases.
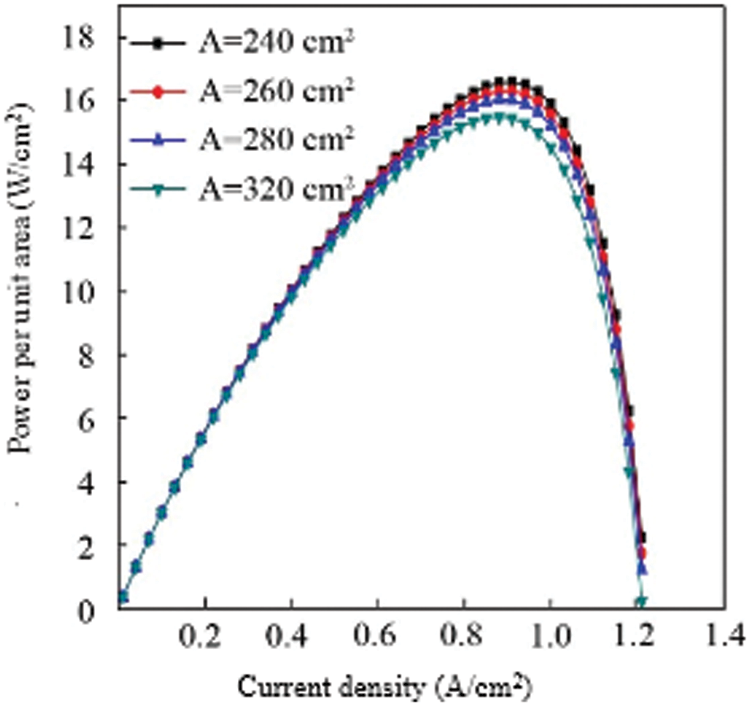
Figure 9: Comparison of power per unit area
In order to compare and analyze the influence of the four parameters of temperature, hydrogen pressure, oxygen pressure and membrane area on the output power of the stack, this paper defines the power sensitivity coefficient ΔW/ΔX, and calculates the power sensitivity factor at the maximum power value. The fuel cell output characteristics are quantified and compared, and the specific definition is shown in Eq. (19). According to Eq. (19), the power sensitivity coefficient when the temperature of the fuel cell changes, the power sensitivity coefficient when the hydrogen supply pressure of the hydrogen storage reactor changes, the cathode oxygen pressure, the power sensitivity coefficient when the proton exchange membrane area changes, and then the different parameters can be compared. The degree of influence on the output power of the fuel cell.
According to the above definition, the power influence factors of the 4 parameters can be calculated separately, as shown in Eqs. (19)∼(22) in Fig. 10. From the calculation results, the fuel cell temperature has the greatest influence on the output power, and the power sensitivity factor is 1.81. The second is the influence of the proton exchange membrane, the power sensitivity factor is 0.73. Finally, changes in hydrogen supply pressure and oxygen pressure have basically the same effect on the output power of the fuel cell, and the power sensitivity factor is about 0.036. However, the difficulty of changing the four parameters and the operating range are different. The temperature of the fuel cell can only be changed within a relatively small range. The general operating temperature cannot exceed 363 K (90°C). Changing the fuel cell temperature at the operating temperature is already The operability is not very strong when it is higher. The hydrogen supply pressure is affected to a certain extent by the amount of hydrogen that the hydrogen storage reactor can store. When the hydrogen supply pressure of the hydrogen storage reactor is low due to the temperature limitation, if the hydrogen storage temperature is increased at this time, the fuel cell can be greatly improved. The output power of the reactor, and the method is easy to operate, only needs to strengthen the heat exchange process of the hydrogen storage reactor. Although the output power of the fuel cell can also be increased by increasing the oxygen supply pressure of the cathode, increasing the oxygen supply pressure of the cathode will also increase the power consumption of oxygen boosting. It is necessary to increase the output efficiency of the fuel cell by increasing the oxygen supply pressure. Comprehensive consideration of oxygen boosting power consumption and fuel cell increased power, in order to achieve the most suitable optimization method. Compared with other methods, increasing the area of the proton exchange membrane to increase the output power has a larger power sensitivity factor, and the adjustable range of the fuel cell membrane area is relatively large, so it is feasible to increase the output power by increasing the area of the proton exchange membrane.
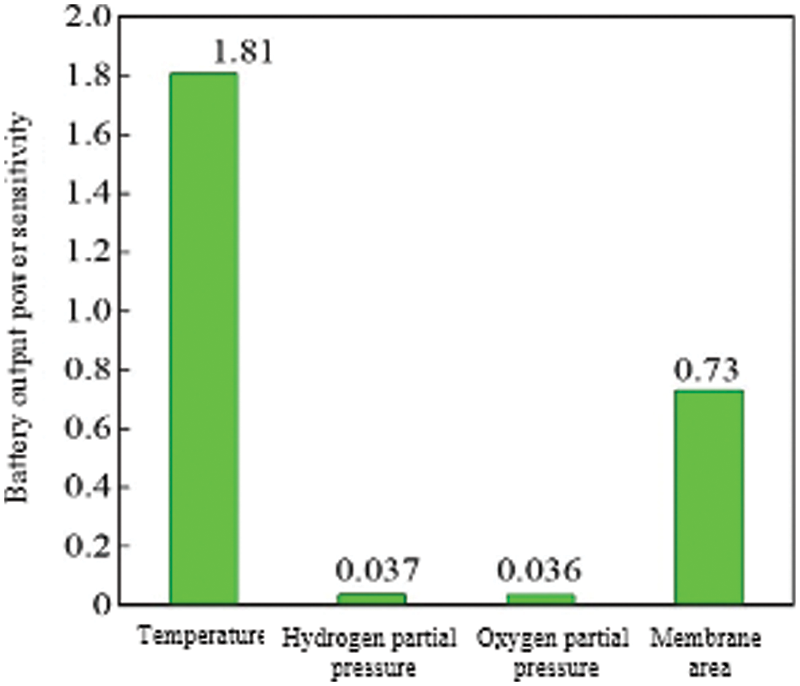
Figure 10: Comparison of power with various parameters
In order to improve the output characteristics of the PEMFC power system coupled with chemical absorption/desorption of solid hydrogen storage and realize the efficient work of the PEMFC power system, this paper uses MATLAB/SIMULINK combined with the empirical formula of the relevant PEMFC power system to establish its simulation model and study Hydrogen fuel cell temperature, the hydrogen supply pressure of hydrogen storage reactor, cathode oxygen supply pressure, proton exchange membrane area and other parameters affect the law of PEMFC power system.
The main conclusions are as follows:
1) When the temperature of the hydrogen storage reactor increases from 305 to 337 K, the pressure of hydrogen released to PEMFC increases from 3.039 × 10⁵ Pa to 9.117 × 10⁵ Pa, which increases the output power of PEMFC by 327 W;
2) The internal working temperature of the fuel cell has a great influence on its output voltage, output power and output efficiency. When the hydrogen supply pressure of the hydrogen storage reactor is constant and the area of the proton exchange membrane is constant, the output power, output voltage, and output efficiency of the fuel cell gradually increase with the increase in temperature, reaching the highest at 353 K. Combined with the actual working conditions of PEMFC, it is better to set the fuel cell working temperature at 343 K;
3) The sensitivity factors of temperature, hydrogen supply pressure, oxygen supply pressure, and membrane area to PEMFC output power are 1.81, 0.037, 0.036, and 0.73, respectively. Based on this, the parameters can be optimized according to the actual operating conditions of PEMFC to obtain a better PEMFC power system running result.
Acknowledgement: The authors would like to thanks King Abdulaziz University for supporting this research work.
Funding Statement: This project was funded by King Abdulaziz University, Jedda Saudi Arabia and King Abdulah City for Atomic and Renewable Energy, Riyadh, Saudi Arabia Grant No. (KCR-KFL-13-20) therefore, the authors gratefully acknowledge their technical and financial support.
Conflicts of Interest: The authors declare that they have no conflicts of interest to report regarding the present study.
References
1. P. Dange, N. Savia, S. Pandit, R. Bobba, S. Jung et al., “A comprehensive review on oxygen reduction in microbial fuel cells,” Journal of Renewable Materials, vol. 10, no. 3, pp. 665–697, 2021. [Google Scholar]
2. N. Savia, R. Anand, S. Pandit and K. Prasad, “Utilization of nanomaterials as anode modifiers for improving microbial fuel cells performance,” Journal of Renewable Materials, vol. 8, no. 12, pp. 1581–1605, 2020. [Google Scholar]
3. C. Guisasola, O. Castell, R. Juanes and A. Greus, “Influence of the molecular weight on PVA/GO composite membranes for fuel cell applications,” Journal of Renewable Materials, vol. 8, no. 9, pp. 1171–1180, 2018. [Google Scholar]
4. O. Castell, R. Cervero, R. Juanes, J. Badia and A. Greus, “Functionalized poly(vinyl alchohol)graphene oxide as polymer composite electrolyte membranes,” Journal of Renewable Materials, vol. 7, no. 7, pp. 655–665, 2019. [Google Scholar]
5. X. Chen, W. Cao, Q. Zhang, S. Hu and J. Zhang, “Artificial intelligence-aided model predictive control for a grid-tied wind-hydrogen-fuel system,” IEEE Access, vol. 8, pp. 92418–92430, 2020. [Google Scholar]
6. M. Zhang, D. Guan, P. Ye, K. Song, X. Pan et al., “Optimal design and operation of regional multi-energy systems with high renewable penetration considering reliability constraints,” IEEE Access, vol. 8, pp. 205307–205315, 2020. [Google Scholar]
7. S. Manish, P. Nijhawan and A. Oberoi, “Hydrogen fuel and fuel cell technology for cleaner future: A review,” Environmental Science and Pollution Research, vol. 28, pp. 15607–15626, 2021. [Google Scholar]
8. J. Gupta, P. Nijhawa and S. Ganguli, “Optimal parameter estimation of PEM fuel cell using slime mould algorithm,” International Journal of Energy Research, vol. 45, no. 10, pp. 14732–14744, 2021. [Google Scholar]
9. L. Fan, Z. Tu and S. Chan, “Recent development of hydrogen and fuel cell technologies: A review,” Energy Reports, vol. 7, pp. 8421–8446, 2021. [Google Scholar]
10. R. Alink, R. Singh, P. Schneider, K. Christmann, J. Schall et al., “Full parameter study of the influence of lonomer content, catalyst loading and catalyst type on oxygen and lon transport in PEM fuel cell catalyst layers,” Molecules, vol. 25, no. 7, pp. 1–27, 2020. [Google Scholar]
11. A. Amanou, S. Kelouwani, L. Bouton and K. Agbossou, “A comprehensive review of solutions and strategies for cold start of automotive proton exchange membrane fuel cells,” IEEE Access, vol. 4, pp. 4989–5002, 2016. [Google Scholar]
12. A. Sorrentino, K. Sundamacher and T. Koch, “Polymer electrolyte fuel cell degradation mechanisms and their diagnosis by frequency response analysis methods: A review,” Energies, vol. 13, no. 21, pp. 1–19, 2020. [Google Scholar]
13. C. Castalo, L. Leyva, J. Alpala, J. Fuelagain, D. Ordonez et al., “Dynamic modeling of a proton-exchange membrane fuel cell using a Gaussian approach,” Membranes Journal, vol. 11, no. 12, pp. 1–24, 2021. [Google Scholar]
14. O. Pugh, A. Dhir and R. Wilckens, “The development of current collection in microtubular solid oxide fuel cells–a review,” Applied Sciences, vol. 11, no. 3, pp. 1–13, 2021. [Google Scholar]
15. K. Hooshyari, B. Horri, H. Abdoli, M. Vostakola, P. Kakavand et al., “A review of recent developments and advanced applications of high-temperature polymer electrolyte membranes for pem fuel cells,” Energies, vol. 14, no. 17, pp. 1–35, 2021. [Google Scholar]
16. Y. Qiu, H. Yang, L. Tong and L. Wang, “Research progress of cryogenic materials for storage and transportation of liquid hydrogen,” Metals Journal, vol. 11, no. 7, pp. 1–18, 2021. [Google Scholar]
17. E. Boateng and A. Chen, “Recent advances in nanomaterial-based solid-state hydrogen storage,” Materials Today Advances, vol. 6, pp. 8732–8745, 2020. [Google Scholar]
18. A. Fly and R. Thring, “Temperature regulation in an evaporatively cooled proton exchange membrane fuel cell stack,” International Journal of Hydrogen Energy, vol. 40, no. 35, pp. 11976–11982, 2015. [Google Scholar]
19. T. Yang, B. Sheo, M. Ghalambaz and W. Yan, “Effects of operating parameters and load mode on dynamic cell performance of proton exchange membrane fuel cell,” International Journal of Energy Research, vol. 45, no. 2, pp. 2474–2487, 2020. [Google Scholar]
20. S. Ansari, M. Khalid, K. Kamal, T. Ratlamwala, G. Hussain et al., “Modeling and simulation of a proton exchange membrane fuel cell alongside a waste heat recovery system based on the organic rankine cycle in matlab/Simulink environment,” Sustainability, vol. 13, no. 3, pp. 1–24, 2021. [Google Scholar]
21. S. Nyamsi, L. Tolj and M. Lototskyy, “Metal hydride beds-phase change materials: Dual mode thermal energy storage for medium-high temperature industrial waste heat recovery,” Energies, vol. 12, no. 20, pp. 1–18, 2019. [Google Scholar]
22. S. Kyoung, S. Ferekh and G. Gwak, “Three-dimensional modeling and simulation of hydrogen desorption in metal hydride hydrogen storage vessels,” International Journal of Hydrogen Energy, vol. 40, no. 41, pp. 14322–14330, 2015. [Google Scholar]
23. A. Szalek, I. Pielecha and W. Cieslik, “Fuel cell electric vehicle (FCEV) energy flow analysis in real driving conditions (RDC),” Energies, vol. 14, no. 16, pp. 1–19, 2021. [Google Scholar]
24. S. Arvind and A. Nagar, “A mathematical model for performance of proton exchange membrane fuel cell as a nonlinear voltage processes,” International Journal of Advanced Research in Computer Science, vol. 8, no. 1, pp. 27–33, 2017. [Google Scholar]
25. F. Musio, F. Tacchi and F. Omati, “PEMFC system simulation in matlab-simulink environment,” International Journal of Hydrogen Energy, vol. 36, no. 13, pp. 8045–8052, 2011. [Google Scholar]
26. M. Jefferson, N. Lucian and G. Marcelo, “An overview on electrochemical-based fuel-cell model suitable for electrical engineering automation approach,” IEEE Transactions on Industrial Electronics, vol. 51, no. 5, pp. 1103–1112, 2004. [Google Scholar]
27. M. Khan and M. Iqbal, “Modeling and analysis of electro-chemical, thermal, and reactant flow dynamics for a pem fuel cell system,” Fuel Cell Journal, vol. 5, no. 4, pp. 463–475, 2010. [Google Scholar]
28. J. Wishart, Z. Dong and M. Scanall, “Optimization of a pem fuel cell system based on empirical data and a generalized electrochemical semi-empirical model,” Journal of Power Sources, vol. 161, no. 2, pp. 1041–1055, 2006. [Google Scholar]
29. K. Junbom, L. Seong and S. Supramanian, “Modeling of proton exchange membrane fuel cell performance with an empirical equation,” Journal of the Electrochemical Society, vol. 142, no. 8, pp. 2670–2674, 1995. [Google Scholar]
30. F. Belhaj, H. Fadil, Z. Idrissi, A. Intidam, M. Koundi et al., “New equivalent electrical model of a fuel cell and comparative study of several existing models with experimental data from the pemfc nexa 1200 w,” Micromachines Journal, vol. 12, no. 9, pp. 1–18, 2021. [Google Scholar]
31. A. Abdullah, H. Rezk, A. Hadad, M. Hassan and A. Mohamed, “Optimal parameter estimation of proton exchange membrane fuel cells,” Intelligent Automation & Soft Computing, vol. 29, no. 2, pp. 619–631, 2021. [Google Scholar]
32. H. Liu, J. Ma, L. Tong, G. Ma, Z. Zheng et al., “Investigation on the potential of high efficiency for internal combustion engines,” Energies, vol. 11, no. 3, pp. 1–26, 2018. [Google Scholar]
Cite This Article
 Copyright © 2023 The Author(s). Published by Tech Science Press.
This work is licensed under a Creative Commons Attribution 4.0 International License , which permits unrestricted use, distribution, and reproduction in any medium, provided the original work is properly cited.
 Downloads
 Citation Tools