
 Submit a Paper
 Propose a Special lssue
 Open Access
ARTICLE

Fault Recognition of Multilevel Inverter Using Artificial Neural Network Approach
1 Research Scholar, Faculty of Electrical Engineering, Anna University, Chennai, 600025, India
2 Associate Professor, Department of EEE, Sona College of Technology, Salem, 636005, India
* Corresponding Author: Aravind Athimoolam. Email:
Intelligent Automation & Soft Computing 2023, 36(2), 1331-1347. https://doi.org/10.32604/iasc.2023.033465
Received 17 June 2022; Accepted 02 August 2022; Issue published 05 January 2023
 View Full Text
 Download PDF
Abstract
This paper focuses on the development of a diagnostic tool for detecting insulated gate bipolar transistor power electronic switch flaws caused by both open and short circuit faults in multi-level inverter time-frequency output voltage specifications. High-resolution laboratory virtual instrument engineering workbench software testing tool with a sample rate data collection system, as well as specialized signal processing and soft computing technologies, are used in this proposed method. On a single-phase cascaded H-bridge multilevel inverter, simulation and experimental investigations of both open and short issues of the insulated gate bipolar transistor components are performed out. In all conceivable switch issues, the output voltage signals are evaluated for different modulation index values. Fast fourier transform and discrete wavelet transform methods are used to investigate the frequency domain properties of output voltage signals. In the artificial neural network, the back propagation training technique was employed, and the generated neural parameter values were used in the Laboratory Virtual Instrumentation Engineering Workbench real-time fault diagnosis model.Keywords
Multilevel inverters (MLIs) are the most successful design in the field of high-power implementations, and they are utilized in a wide range of industrial applications that require lower operating costs and higher quality output, such as drive systems, electric cars, voltage profile compensators, voltage regulators, sustainable energy applications, and so on. The multilevel inverter is among the most common and reliable categories of MLI, wherein the stair cased pulse-width synthesized inverter voltage output is generated by a number of cells connected in series H-bridge voltage cells. The operation of insulated gate bipolar transistor (IGBT) power modules in cascaded h-bridge multilevel inverters (CHMIs) leads in substantial switching losses and severe overheating when switching frequency modulation is significant with high voltage and current. Thermal gradients and constant operation of switches can lead to serious issues including parameter drift and ageing, which can lead to semi-conductor system failure [1–4].
Short circuit (SC) and open circuit (OC) faults are the two types of failures which can occur in power switching devices in MLIs. Short circuit problems have the ability to damage the system right away. As a result, hardware approaches for short circuit protection, including as high potency fuses, de saturation methods, and di/dt feedback techniques, are frequently employed. Open-circuit faults in power electronic switches do not always result in the device shutting down, and they can go undetected for a long time. This could cause secondary defects in the inverter or other drive components, culminating in the entire system being shut down and expensive repairs. Short-circuit faults in power electronic switches, on the other hand, are extremely damaging and necessitate special precautions to automatically shut down the entire drive. These types of failures must be identified and repaired in a microsecond in order to safeguard analogous semiconductor devices from damage in the converter leg. On the other perspective, extended open circuit fault behavior of the power converters might cause the entire system to collapse. Expertise in fault behaviors, fault prediction, and fault diagnostics will be necessary to keep the multilevel inverter system functioning smoothly. The following are the two aspects of power electronic device fault diagnosis: one is fault information acquisition, which entails gathering data whenever a failure occurs using a specific fault detection approach; the other is fault identification and characterization, which rely upon that specific of failure modes to recognize the category and position of faults using only a specific fault detection method [5–8].
In this circumstance, faults should be recognized as soon as possible after they occur. If an inverter device is used continuously under abnormal settings, further issues will arise, resulting in severe consequences. Furthermore, since the multilevel inverter is made up of a lot of switching devices, the system is complicated and has a lot of nonlinear influences [9–12]. As a result, multilevel inverters need some novel diagnostic strategies which could not deal with nonlinear detection issues but also diagnose and locate faults easily [13–16]. In the case of the multilevel inverter, the device voltage and current can vary depending on the form and position of the faults. Some researches concentrated on the device output current or voltage to assess fault form and position more simply and efficiently, and then extend a sequence of fault diagnosis procedures from the sample [17–20].
Numerous model-based techniques for transistor OC defect identification have been suggested for the system. To detect the voltages aberrations for diagnostics, an adaptable system is established [21]. For the purpose of identifying faults, a dynamic model using heterogeneous logic is created to predict the discrepancies in between motors currents that are measured and those that are predicted [22]. Both [23,24] describe fault diagnostic techniques based on alternating current (AC) dynamic analysis and current processing with an adaptable neuro-fuzzy inference process, respectively. These techniques have issues with diagnostic speed and precision.
The fundamental objectives of the proposed research effort are to develop a high-performance fault detection methodology for evaluating open and short circuit faults in MLI using enhanced signal processing and soft computing techniques. The fast fourier transform (FFT) and discrete wavelet transform (DWT) techniques in Laboratory Virtual Instrumentation Engineering Workbench (LabVIEW) software tool are used to evaluate the spectrum properties of output voltage wave forms produced using both modeling and experimental investigations at various fault situations. By using FFT technique and LabVIEW software, extract salient features such as total harmonic distortion (THD) and harmonic contents of output voltage signal at different fault cases. Extract important characteristics from the DWT multi resolution analysis using LabVIEW capabilities, such as energy content at various layers of decomposition of the output voltage signal for various fault occurrences. Designing an automated fault detection system based on artificial neural networks (ANNs) for detecting individual faulty switches, develop a LabVIEW based real-time defect detection system to leverage an off-line trained artificial neural network model. The performance characteristics of the FFT-ANN-LabVIEW model and the DWT-ANN-LabVIEW model-based fault detection approach for multilevel inverters can be compared to develop an effective fault diagnostic system.
2.1 Configuration of Fault Recognition System
Fig. 1 illustrates literally the entire fault detection system set up for identifying defective power semiconductor switches in multilevel inverters, which includes both hardware and software components. A direct current (DC) voltage source, cascaded MLI, single phase induction motor (IM), and data acquisition system (DAQ) help compensate the hardware system. A multilevel inverter’s terminal voltage signals are recorded using the national instruments-universal serial bus (NI-USB) 6251, and the voltage waveforms are decoded using the Agilent digital storage oscilloscope (DSO). The ANN trained pattern is used to identify the faulty switch using the LabVIEW graphical user interface (GUI) and DFT and FFT extraction process.
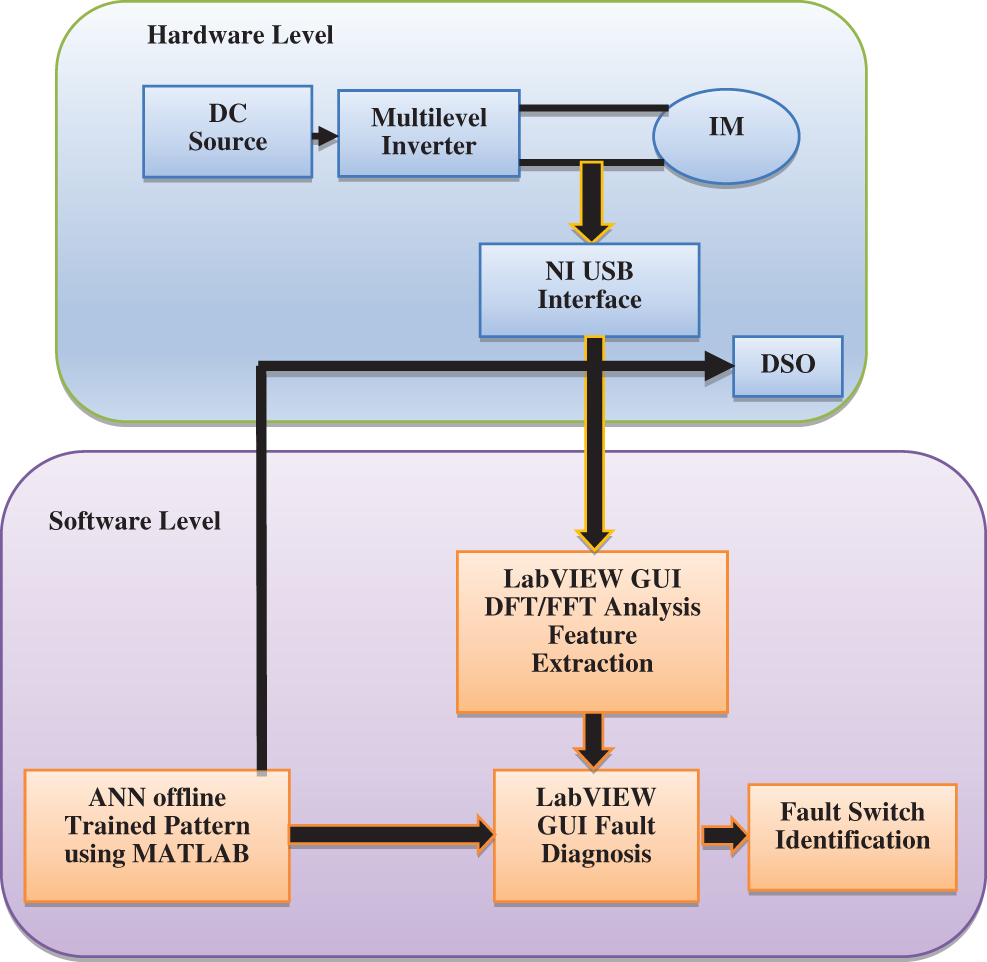
Figure 1: Schematic representation of fault diagnosis system
2.2 Multilevel Inverter-Fault Signal Analysis
The single stage five level cascaded H-bridged multilevel converter configuration included in this analysis, which includes two H-Bridges and eight IGBT switches, is depicted in Fig. 2. Despite the fact that three-phase multilevel inverter systems are useful in modern drives, single-phase multilevel inverter systems are used in this research since the prediction model approach can be expanded to three-phase systems.
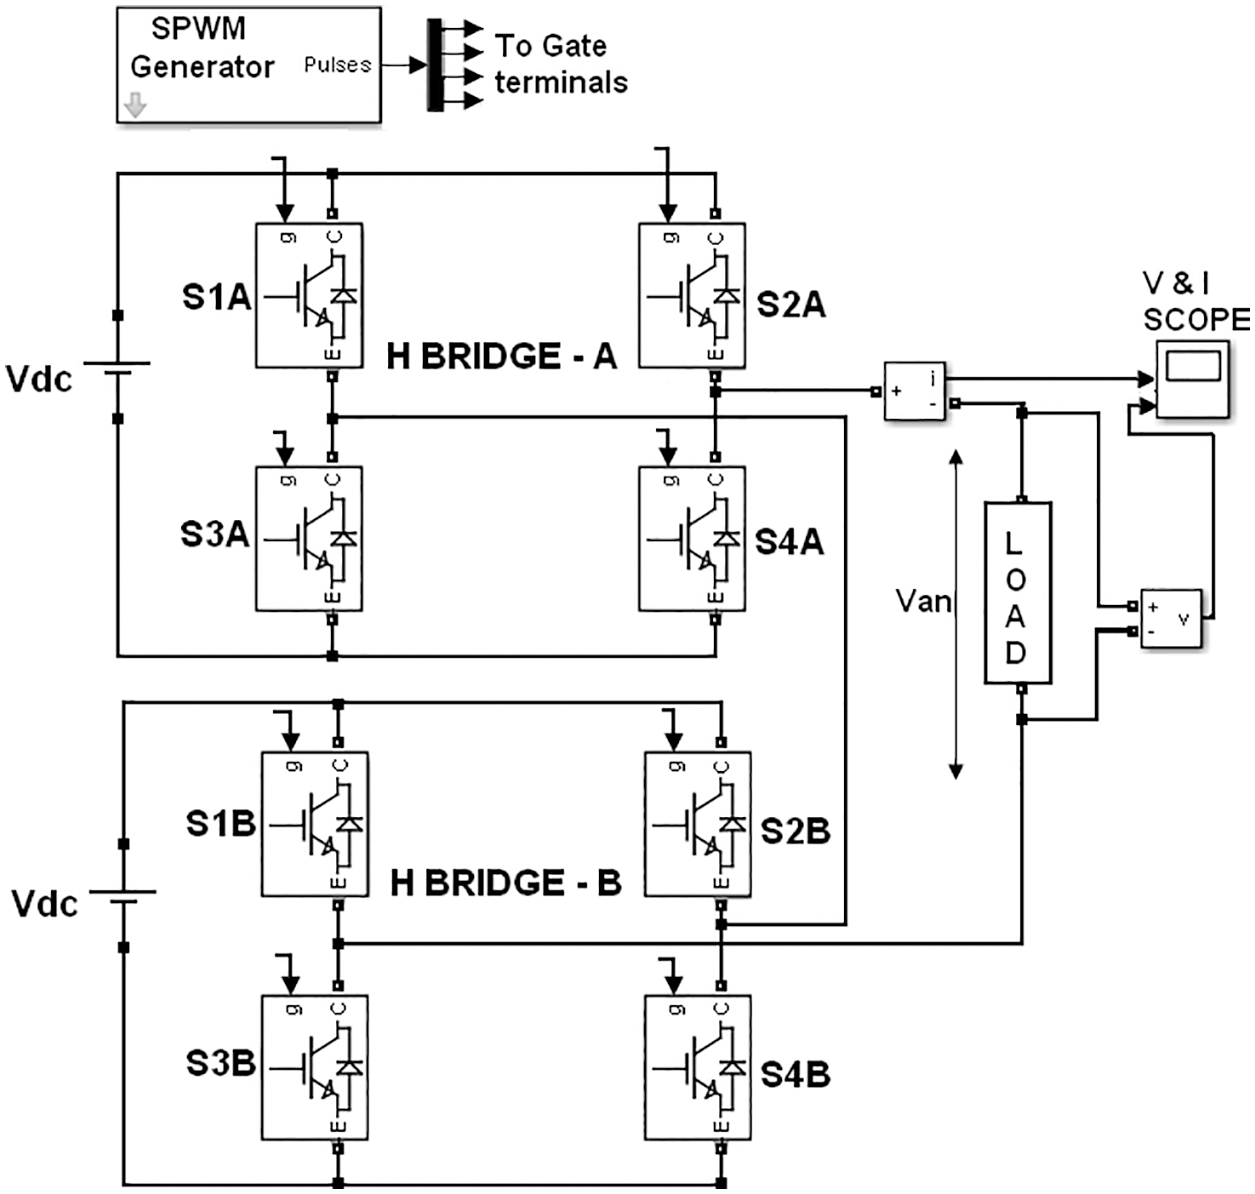
Figure 2: Representation of cascaded H-Bridged MLI
The voltage and current characteristics of a single cascaded H-Bridged multilevel inverter is shown in Fig. 3. As shown in Fig. 3, the S1A switch creates an open circuit fault after one second, magnifying the voltage and current pattern created by the prior failure. When there is an open circuit fault, S1A experiences positive voltage clipping. After one second, the failure causes the positive and negative amplitudes of the current to switch. The voltage and current signals are gathered at a rate of 20 kHz.
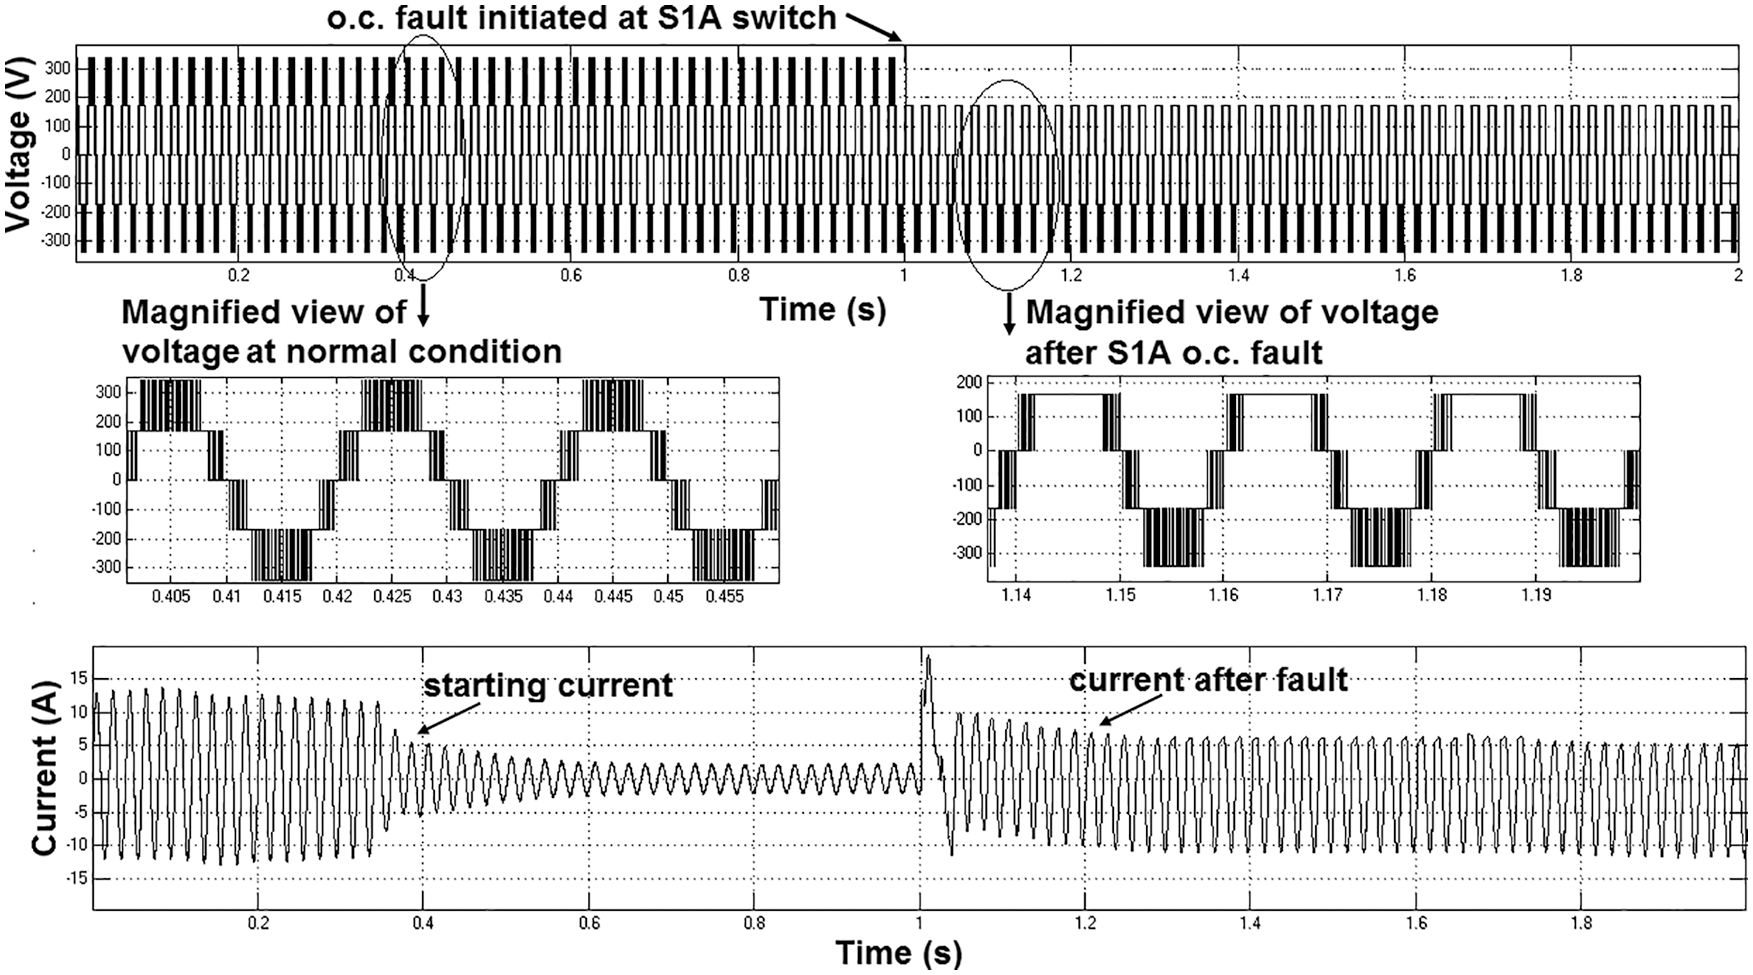
Figure 3: Voltage and current waveform during open circuit fault condition
Fig. 4 exhibits the voltage and current characteristics of a cascaded single-phase H-Bridged multilevel inverter. When the S1A switch creates a short circuit defect after one second, the voltage and current pattern created by the previous failure is magnified in Fig. 4. The voltage and current signals are obtained at a switching rate of 20 kHz.
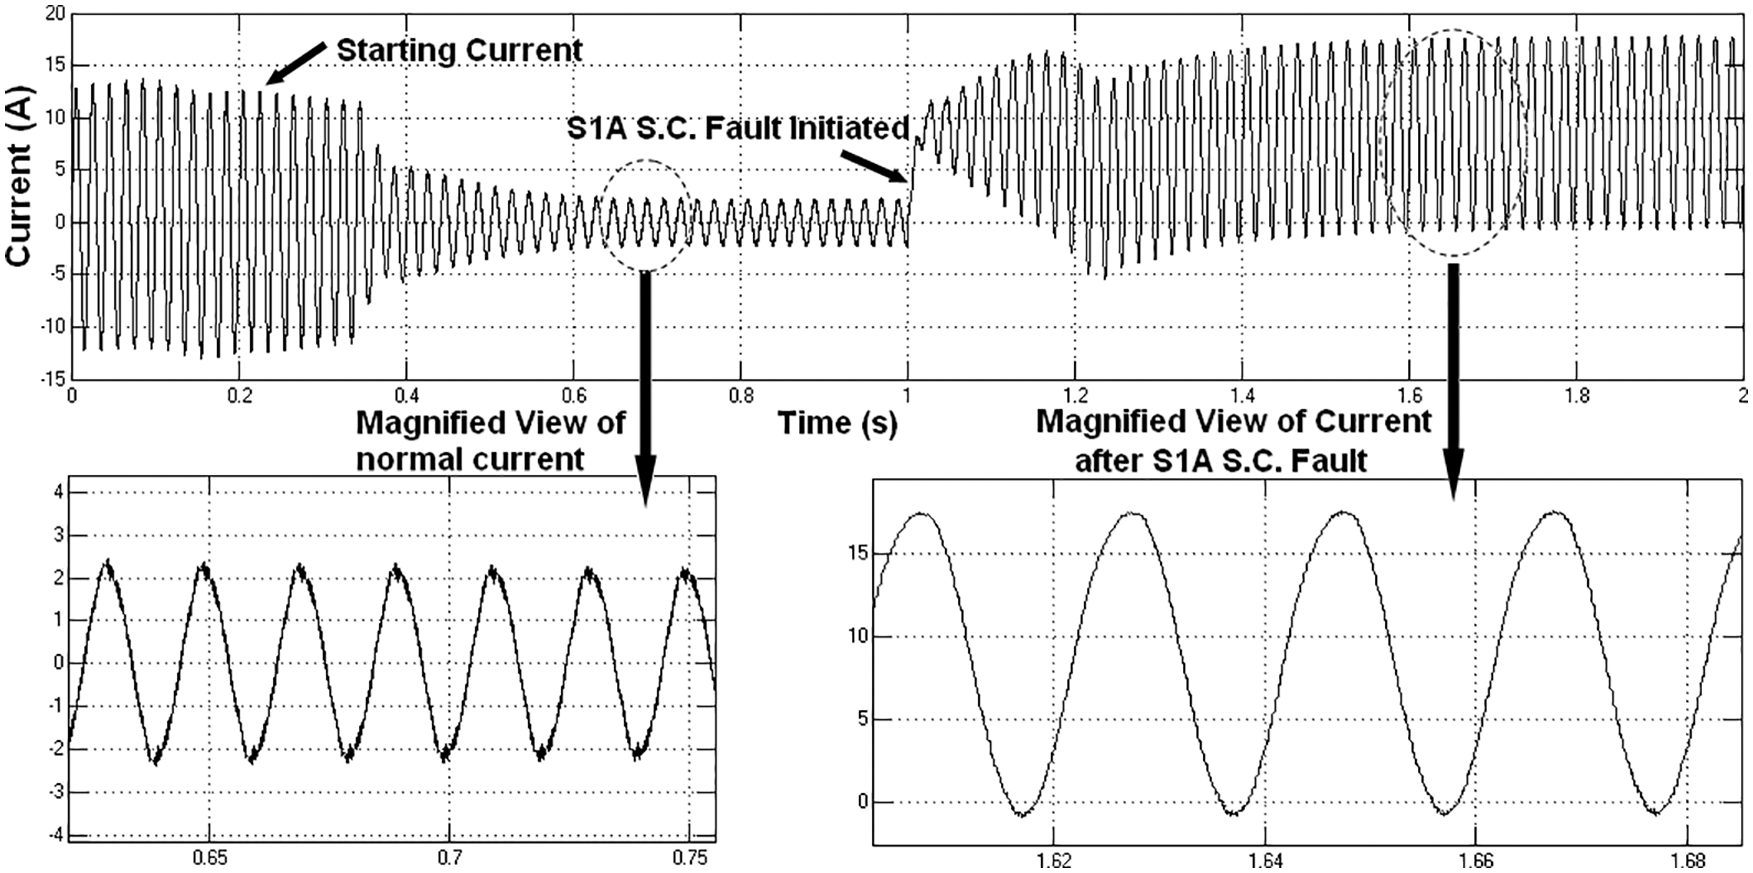
Figure 4: Voltage and current waveform during short circuit fault condition
3 Signal Processing Based on FFT and DWT
3.1 Feature Extraction Using the FFT Method
The FFT method was used to extract the properties of output voltage patterns. In order to create an effective fault analysis tool, frequency domain assessments of the output voltage waveforms are necessary. The output voltage signal was subjected to the FFT technique to extract different properties. As a result, the signal processing approach is critical. Even though a competent characteristic extractor should offer enough crucial information about the neural network in the position taken, it was the maximum level of accuracy obtained inside the artificial neural convention. Fig. 5 gives the extraction of output voltage signal in different parameters of harmonics and root mean square (RMS) output voltage.
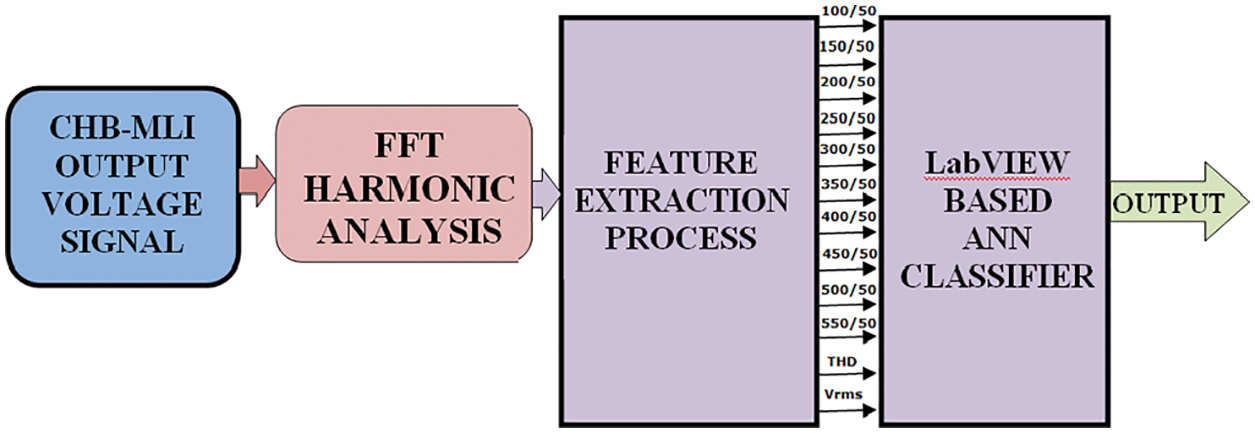
Figure 5: FFT based feature extraction process of output voltage signal
The FFT is widely utilized in signal processing applications, including power systems, power electronics, communications, broadcasting, and entertainment. The frequency response description of any periodic or non-periodic signal is provided by the FFT. The Fourier Transform of a signal or function g(t) is described as following Eq. (1) and inverse Fourier transform represented in Eq. (2)
THD is evaluated for a voltage signal using the below Eq. (3),
where Vn is the nth harmonic’s RMS voltage and n = 1 is the fundamental frequency. It identifies the extent to which a voltage or current signal has been distorted.
Fig. 6 illustrates the improvements in Harmonics, THD, and Vrms during the extraction phase using the FFT the output voltage waveform for different configuration situations and modulation index values. By studying fluctuations in the voltage pattern following the implementation of open and short circuit faults, the RMS value of voltage is also regarded an essential time domain feature in this investigation. Each function generated from the FFT analysis has different features under normal and faulty situations, according to the results. Additional changes in the extracted functionality are conceivable.
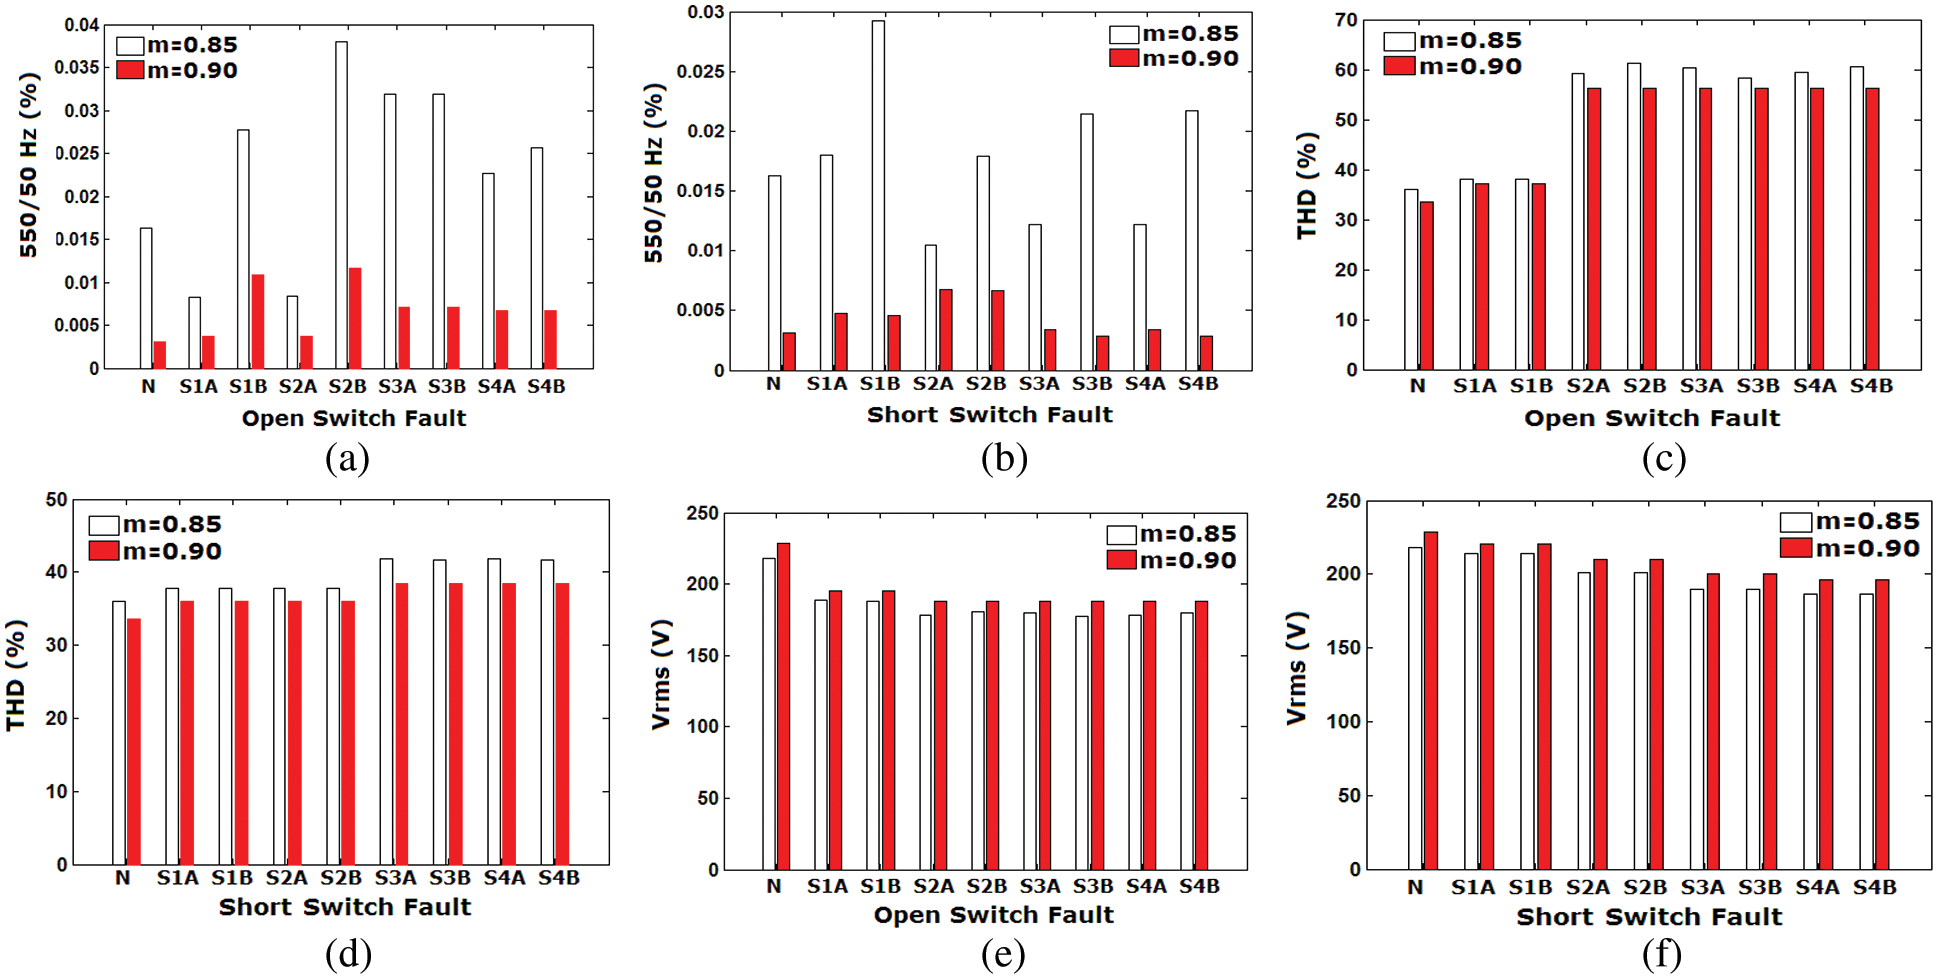
Figure 6: Illustration of FFT analysis (a) Open circuit fault for 11th harmonic (b) Short circuit fault for 11th harmonic (c) Open circuit fault with THD (d) Short circuit fault with THD (e) Open circuit fault with Vrms (f) Short circuit fault with Vrms
3.2 Feature Extraction Using the DWT Method
The new fault diagnosis algorithms work by identifying important characteristics in output voltage data, which are then aggressively removed from the basic data to create diagnostic data. Simultaneous temporal and frequency analysis of voltage signals is required to build an effective fault diagnosis system. Fig. 7 illustrates DWT based feature extraction process of output voltage signal; in that DWT-based multi resolution signal statistical analysis is to offer a time-scale description of a differential equation output a(n) at various levels of decomposition. During convergence with i and j quadrature mirror filters, the original signal sequence is designated as b0[n], and at scale 1, it is divided into an estimation element b1[n] and an informational element b1[n]. The estimated vector b1[n] has been further divided at the next scale into b2[n] and c2[n], and so on. This type of nested decomposition can be quantified in following Eqs. (4) and (5),
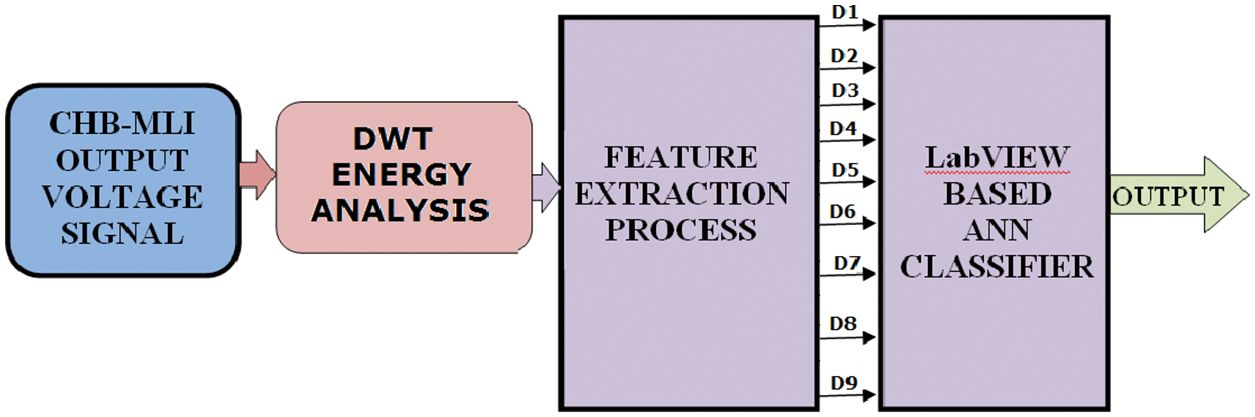
Figure 7: DWT based feature extraction process of output voltage signal
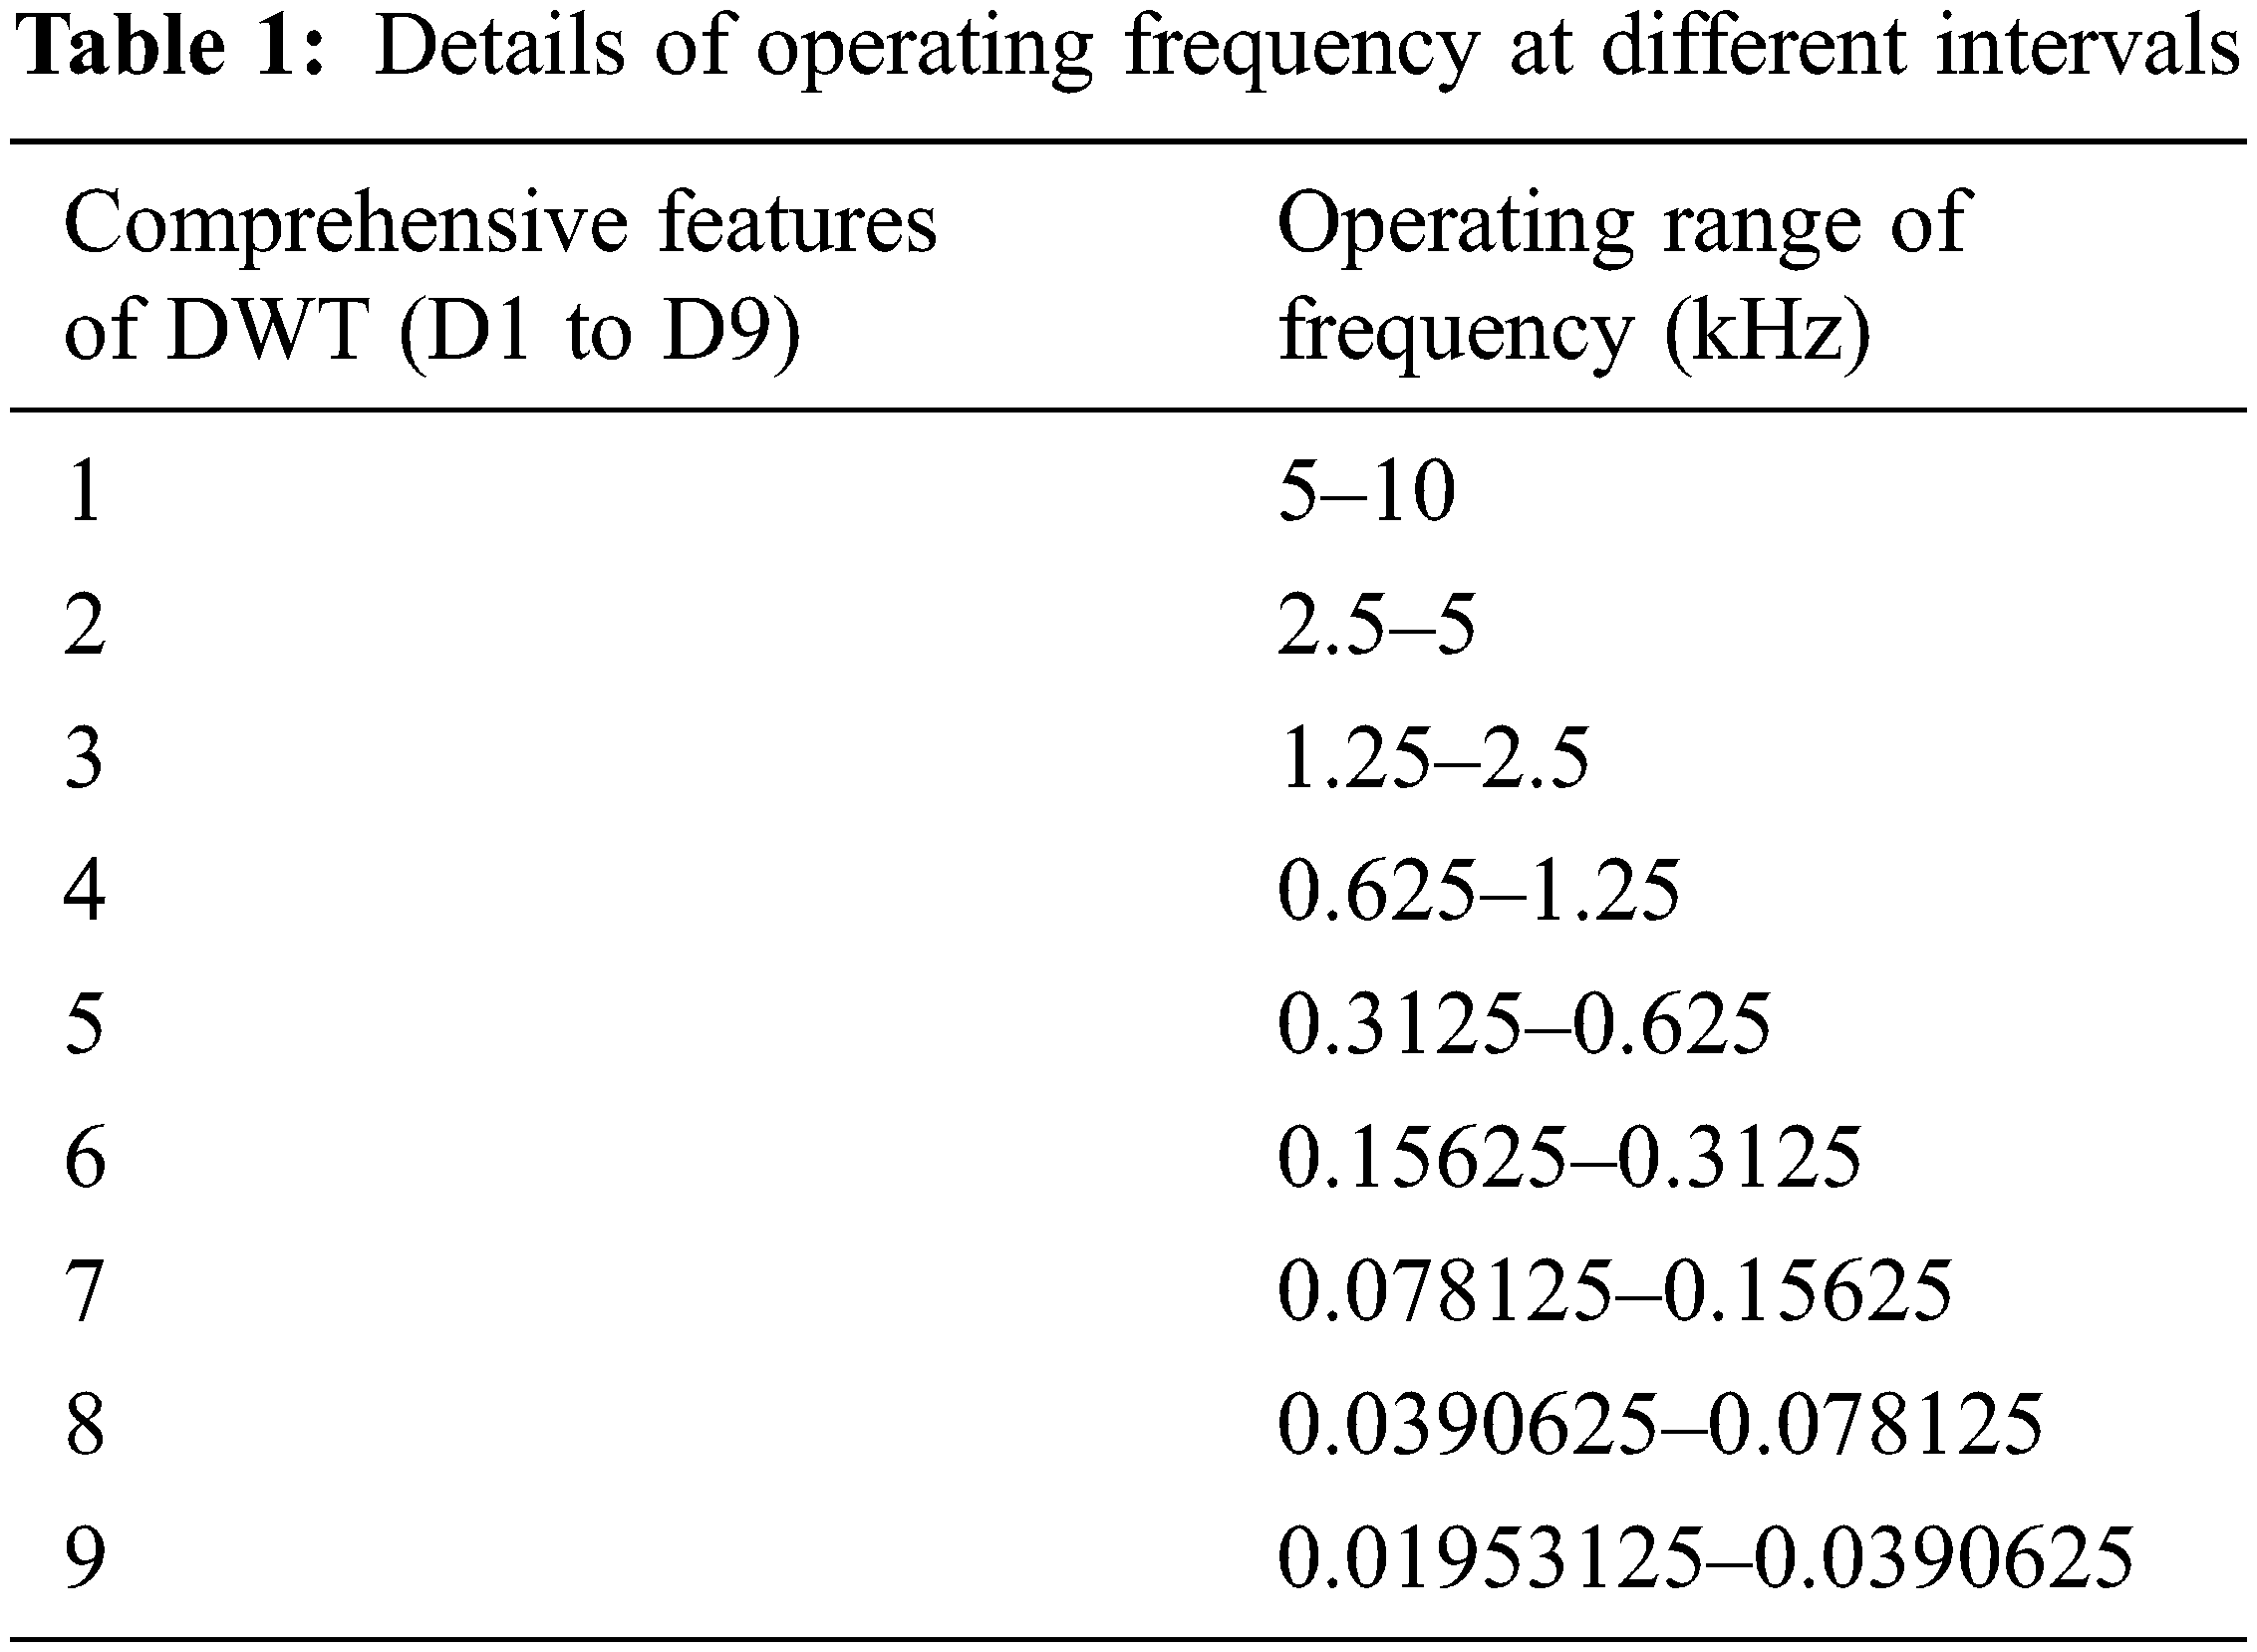
The decomposition scale is p, the number of sampling points is denoted as q, and the translation coefficient is n. The purpose of multi resolution analysis is to accomplish two essential qualities, the first of which is the temporal mapping ability, which is useful for identifying changes in features. At the time of the disruption, this will appear as high coefficients. The signal energy is partitioned into different frequency bands in the second step. This gives an indication of the distorted signal’s frequency quality. The Daubechies 4 wavelet is well-known for its capacity to identify signal power transitions, but it has previously been employed as an origin wavelet. As a result, the Daubechies 4 wavelet was employed to analyze the data. The frequency spectrum of comprehensive elements for output voltage signals was divided into 9 levels, as indicated in Tab. 1. The standard deviation is a measurement of the energy contained in a waveform with a normal distribution. As a result, standard deviation estimates for detailed components are computed at various degrees of decomposition (D1 to D9) to represent the signal’s transitory energy. The following formula is used to determine the standard deviation (STD) of an nth degree informative signal in Eq. (6),
where Rn represents the average value of the vector hn and Sn denotes the time-span of the vector hn. The energy level of the signal acquired using the DWT multi resolution analysis (MRA) approach is a significant component in multilevel inverter failure detection.
3.2.1 DWT-Multi Resolution Analysis of Voltage Signal
During normal conditions, Fig. 8 represents the MRA analysis of significant components of the voltage signal. The amplitude of the MRA analysis of the informative signals is represented on the y plane, while time is represented on the x plane (in samples). The extensive portion of DWT (D1–D9), which comprises up to nine levels of de-composition, is depicted in Fig. 8.
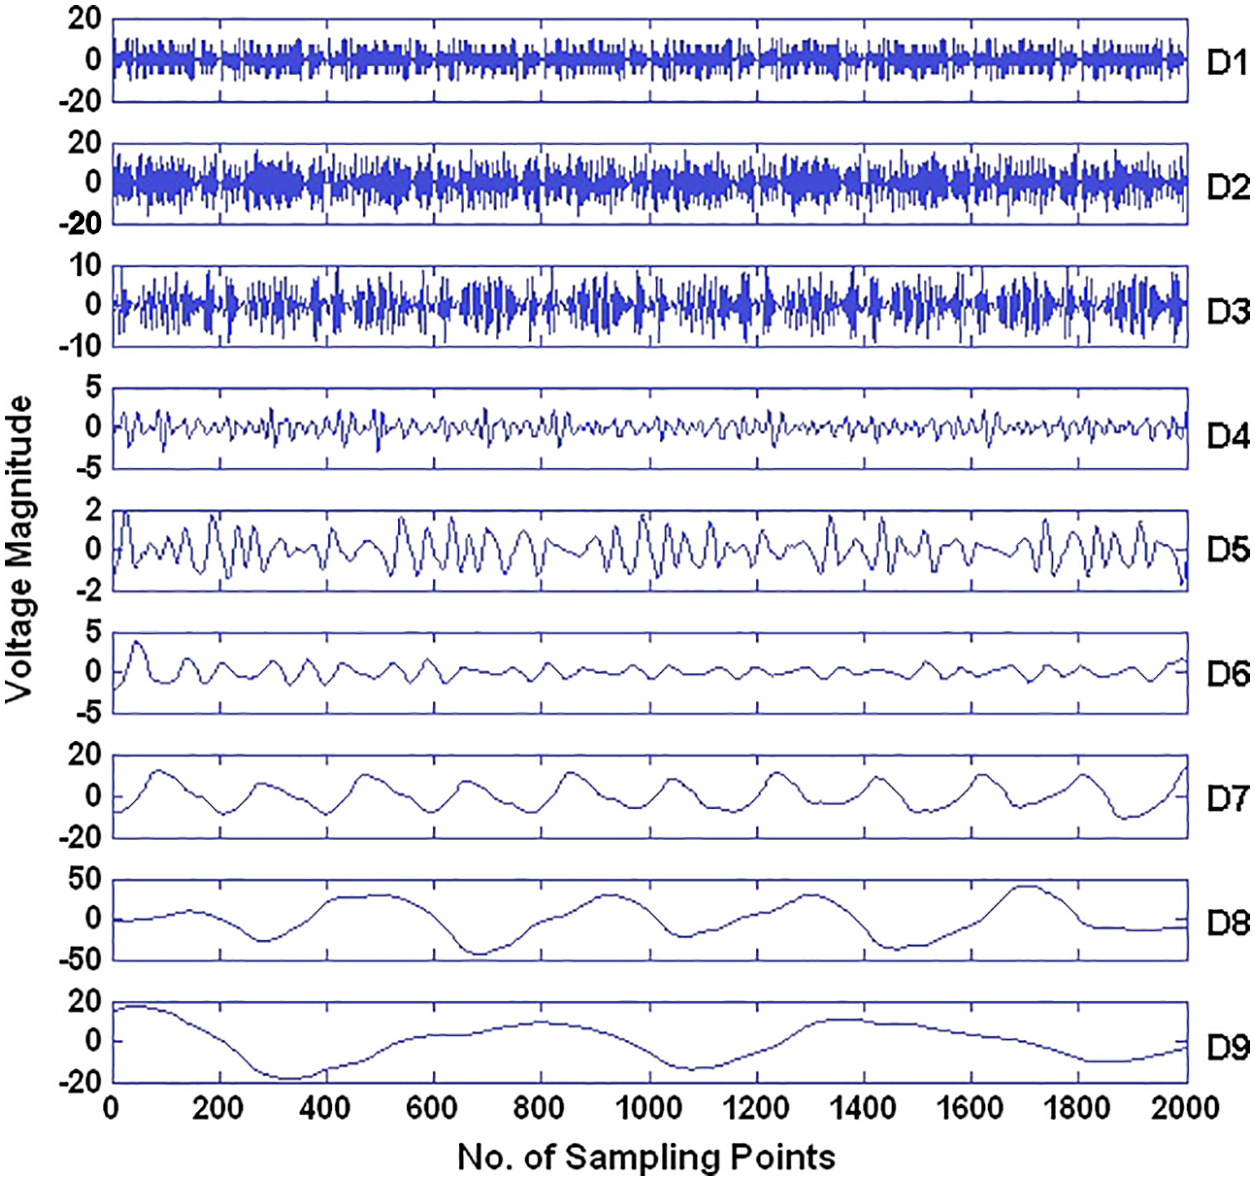
Figure 8: Comprehensive components of output voltage waveform based on discrete wavelet transform MRA up to nine stages of decomposition
3.2.2 DWT-Open and Short Circuit Voltage Signal Analysis
The DWT MRA different band levels of the voltage amplitude are shown in Fig. 9 at various modulation indexes. The 50 Hz fundamental part has a peak at the 8th stage of decomposition (Refer Tab. 1). At the 7th, 8th, and 9th stages, there is a significant rise in the signal’s DWT MRA energy content as the modulation index value increases. In Fig. 8, the differences in the energy level of various frequency ranges are depicted in the same way. Fig. 10 represents the proposed DWT MRA analysis of voltage waveforms during short circuit fault occurring at different modulation correlation coefficients. In comparison to other fault situations, the band level intervals of the signal at stages 6, 7, 8, and 9 are noticeably different.
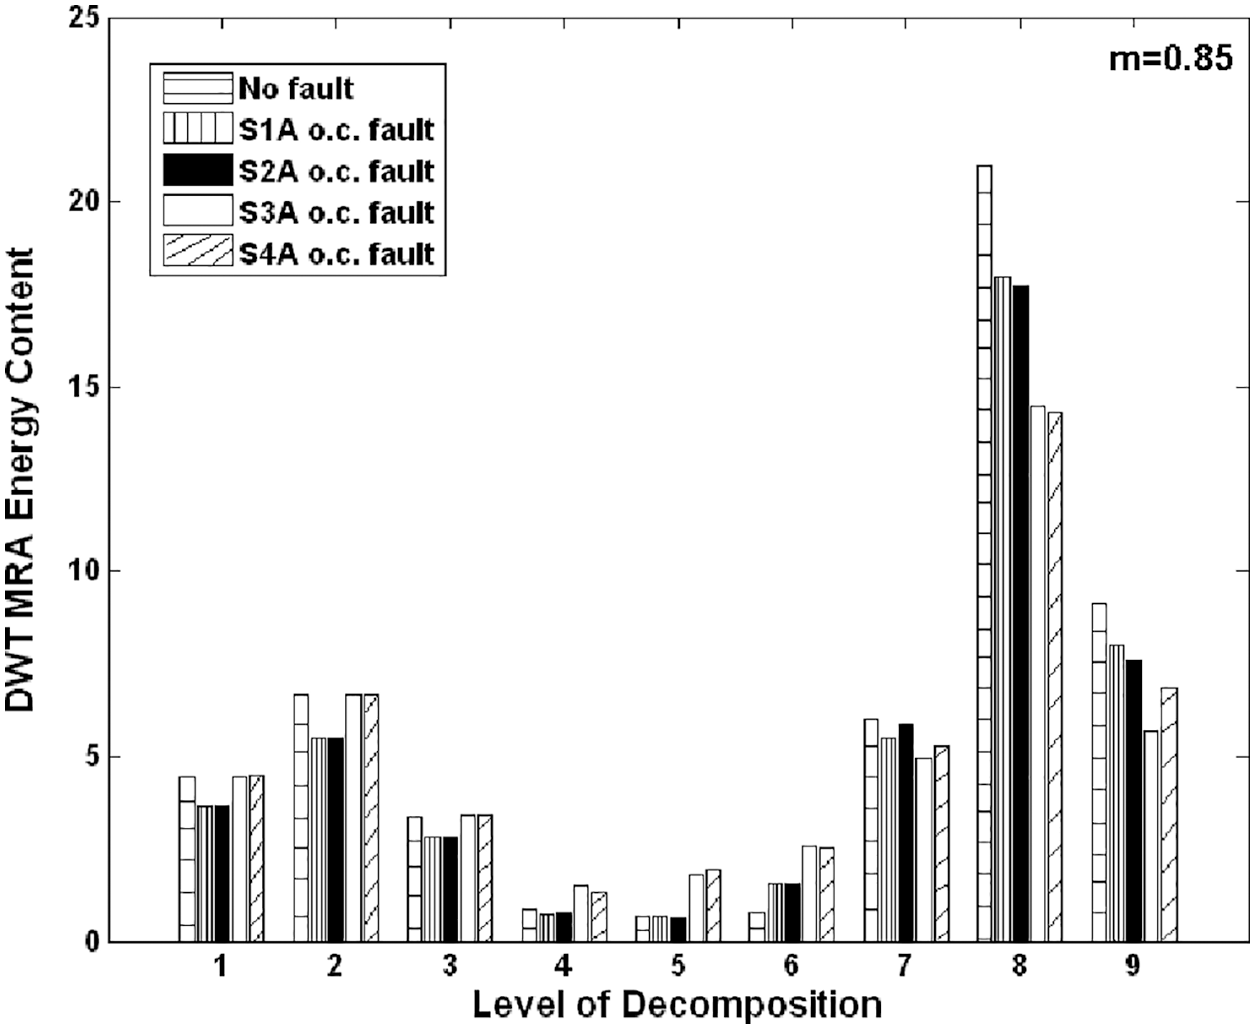
Figure 9: Cascaded H-Bridged an OC faults with different energy levels of output voltage
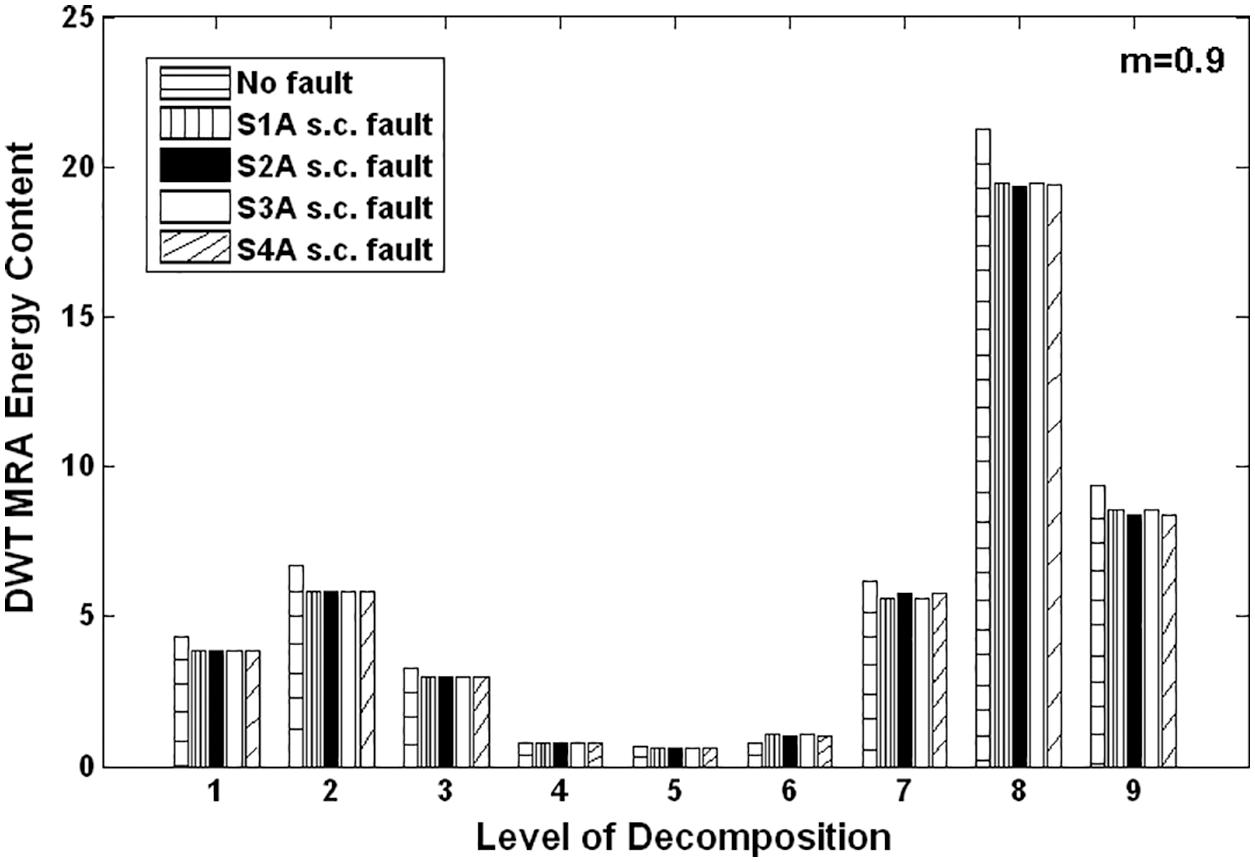
Figure 10: Cascaded H-Bridge an SC faults with different energy levels of output voltage
For practical real-time applications, laboratory tests must be used to validate the results of simulation studies. A photo of a laboratory experimental setup for obtaining multilevel inverter output voltage signals during various switch operation condition is shown in Fig. 11 hardware and software components help compensate the fault diagnostic system. A DC voltage source, multilevel inverter, single phase asynchronous motor, and data acquisition system create the hardware system. The five-level output voltage is created by cascading two H-bridge single-phase pulse width modulation (PWM) inverter components. As switching units, IGBTs with a range of 600 V and a current of 25 A are deployed.
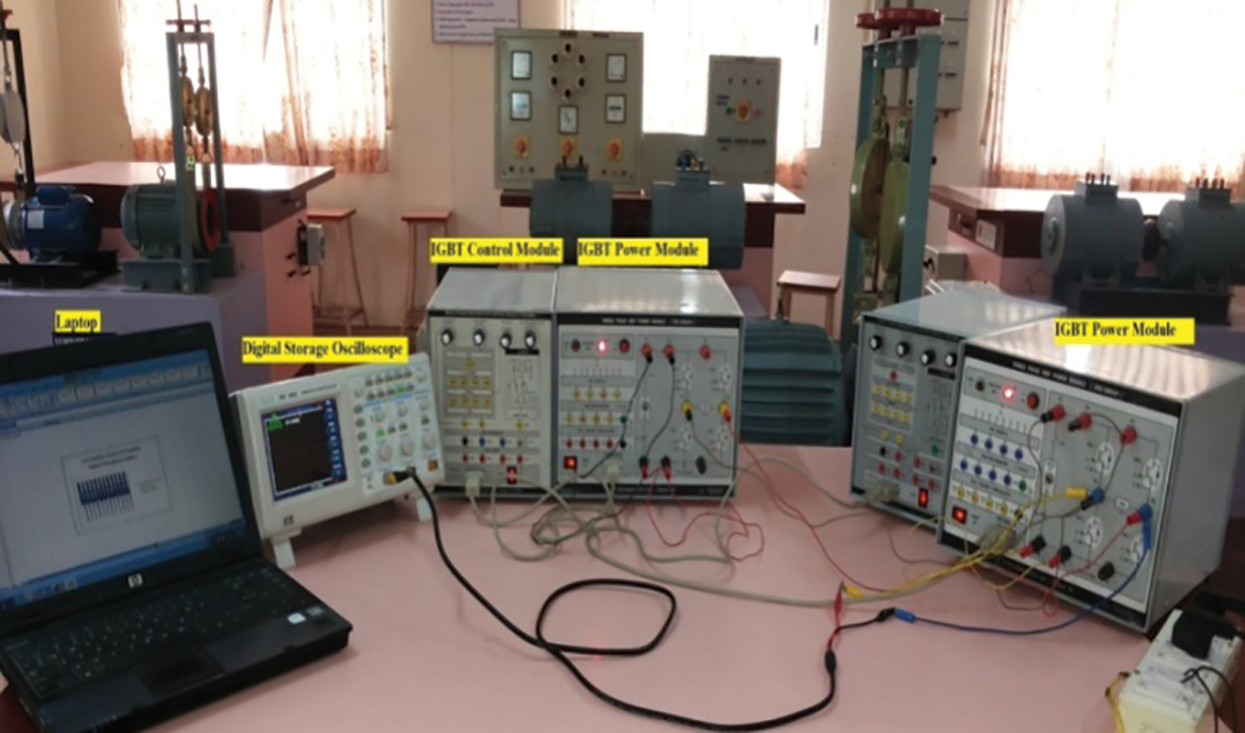
Figure 11: Experimental arrangement of single phase MLI with load
Fig. 11 illustrates a real-time DAQ system connected to a personal computer (PC) through LabVIEW software, as well as NI USB-6251 (16 Analog Input, 1.25 MS/s) M series hardware used as an analysis of data collected and connected to a PC for signal collection and processing. For a total of 16 bits of information, this system will compute 16 analog input signals. The user interface on the front panel allows users to enter and extract data. The users can access and extract information through the front panel’s user interface. The system interface light will glow green until the NI Network interface is correctly communicated with this LabVIEW front panel. The magnitude scale, sample rate, time scale, and number of variables for each output voltage signal are all controlled by the front panel. The acquisition settings allowed users to choose the number of signals to be gathered at any given moment. An Agilent digital storage oscilloscope (1 Giga Samples/sec) was used to analyze the output voltage waveforms.
Open and short circuit faults are generated on each switch, and the output voltage waveform is analyzed. A voltage sensor mounted to the USB senses the output voltage and captures the data of output signals. The corresponding FFT and DWT characteristics generated from output voltage waveforms confirmed with experimental investigations under various fault situations and at numerous opposing modulation index values of 0.85 and 0.9 are displayed in Fig. 12.
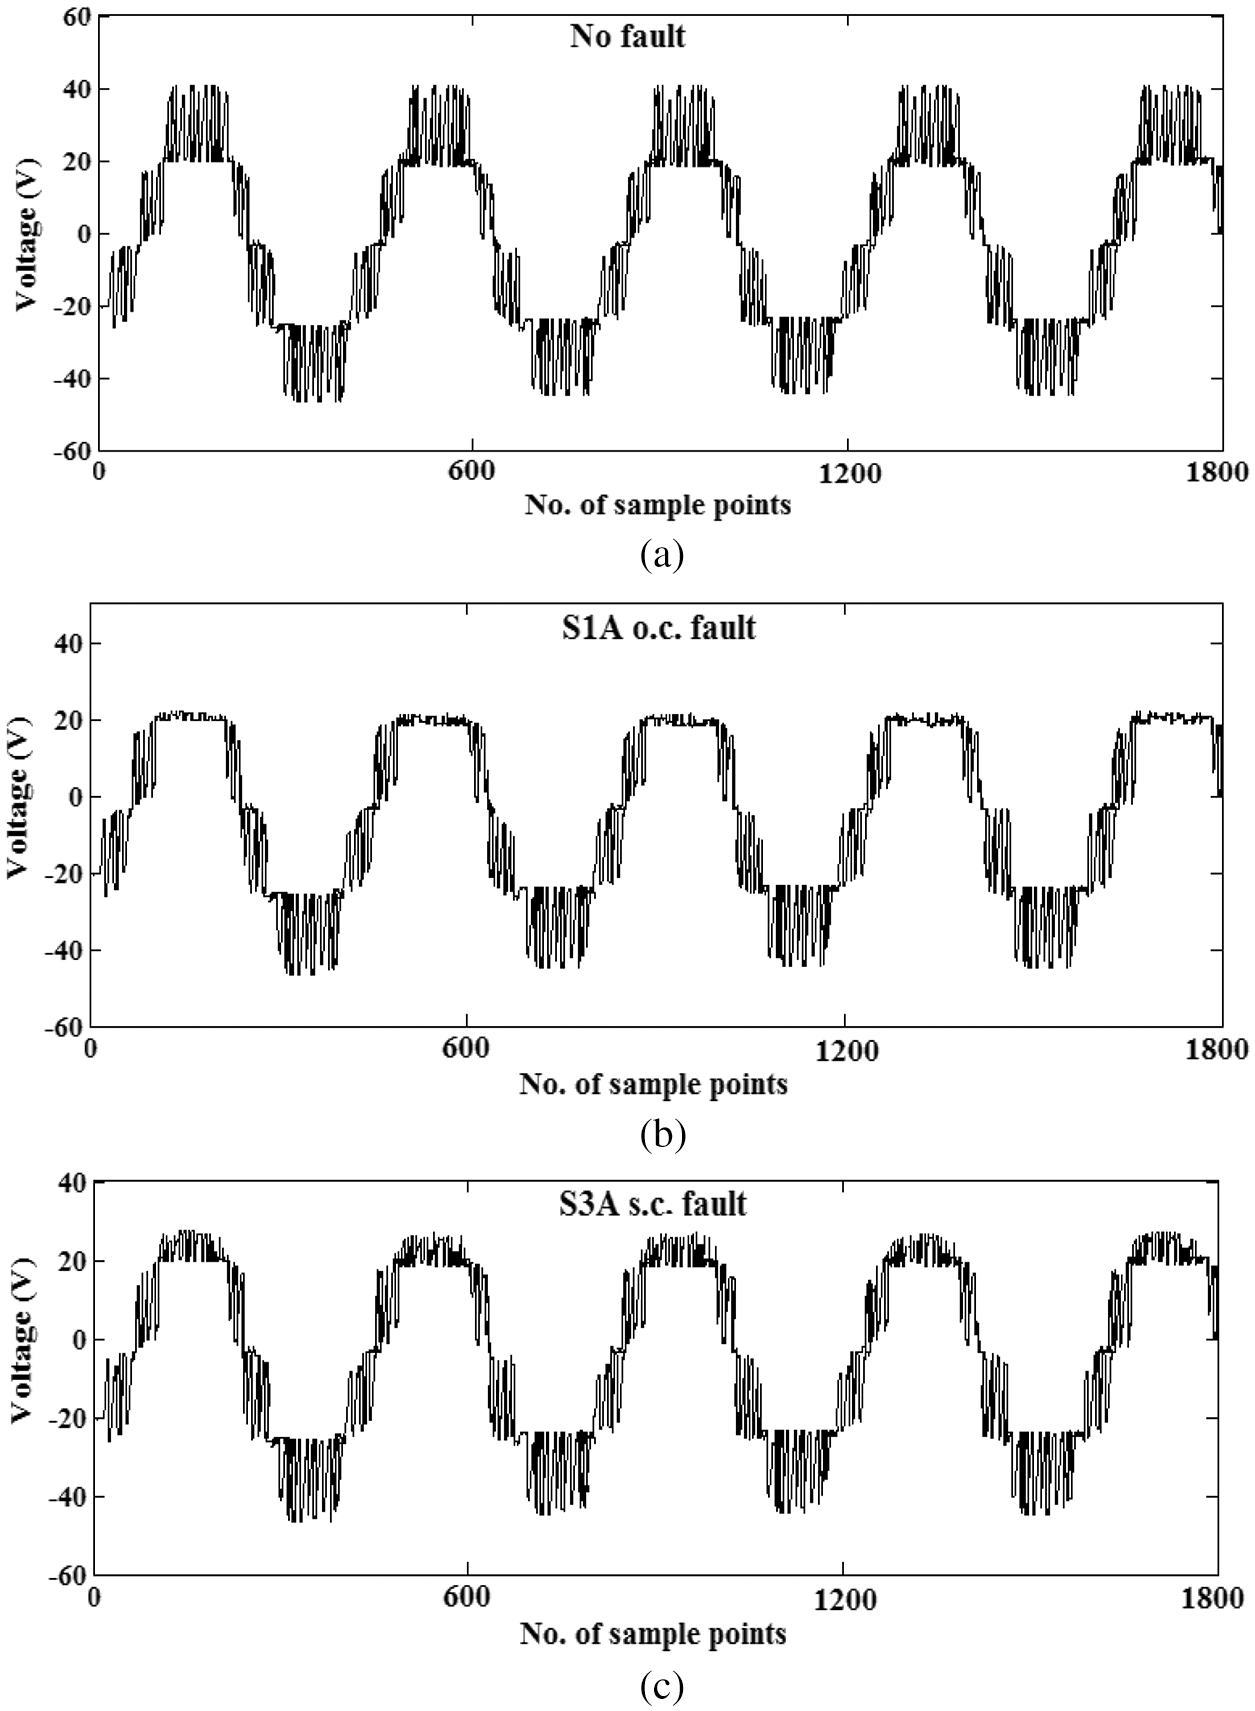
Figure 12: Real time experimental results at (a) No fault, (b) OC fault (c) SC fault
5.1 LabVIEW Front Panel for FFT Analysis
The LabVIEW front panel for spectrum analysis of output voltage impulses using the FFT approach is shown in Fig. 13. You may use this module to keep track of which signals are used for FFT analysis. The ability to monitor the individual FFT plot of a voltage signal is also provided in this module. Harmonic ratios with respect to fundamental frequencies are calculated using peak values of harmonic frequencies. This research work established the FFT frequency domain harmonic analysis for the front panel, as shown in Fig. 14. Its objective is to display the various harmonic/fundamental ratios as well as the THD measurement of the inverter’s output voltage signal. Users may also follow the harmonic plot of individual output voltage signals in this window. This software module has been designed to evaluate up to the 11th harmonic ratio. This front panel allows for trend analysis of THD values and harmonic ratios.
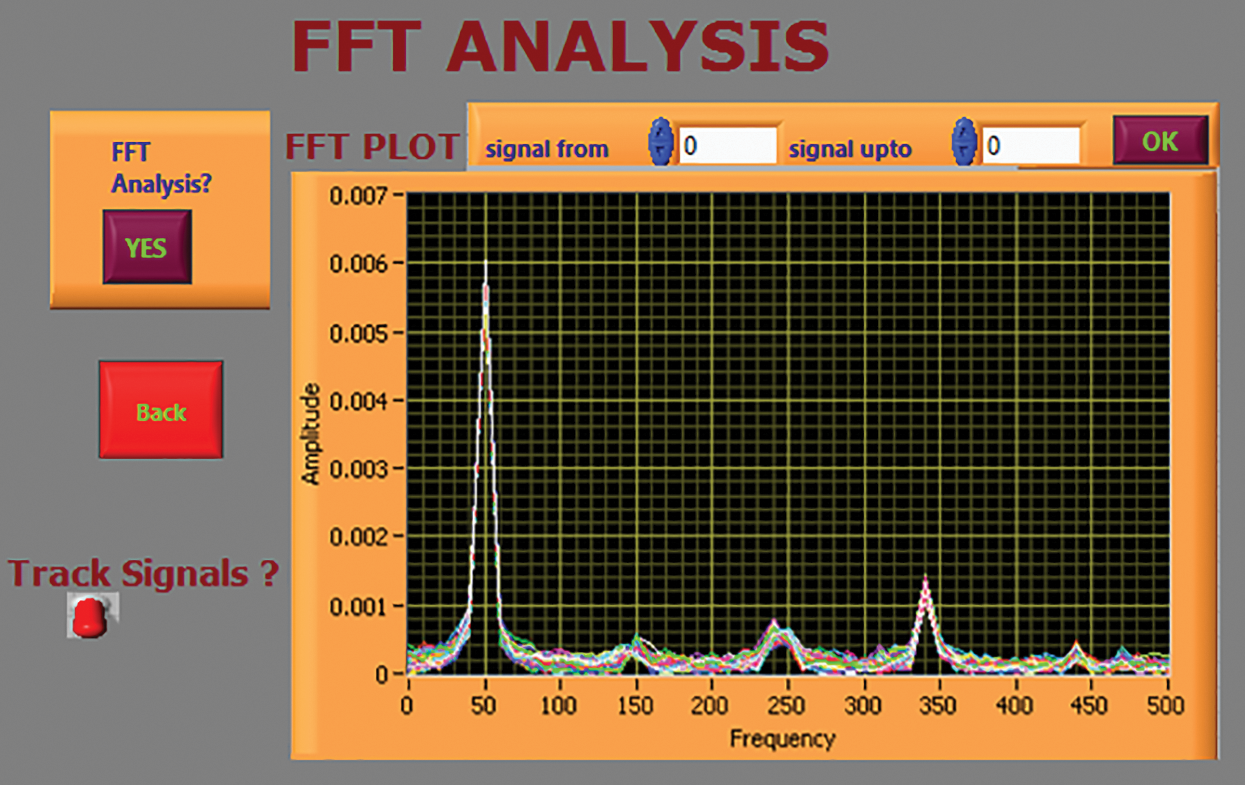
Figure 13: Representation of FFT labVIEW–front panel
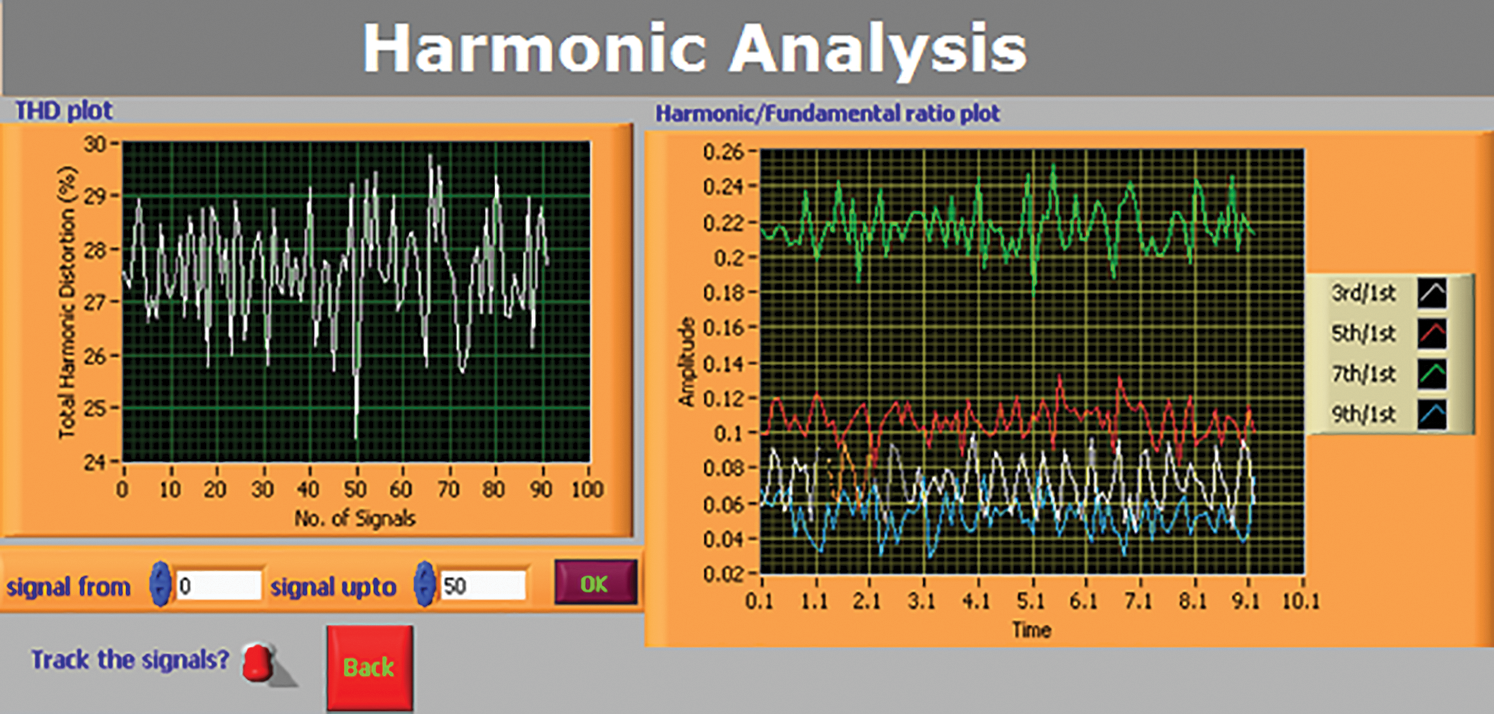
Figure 14: Representation of FFT labVIEW based THD analysis
5.2 LabVIEW Front Panel for DWT Analysis
Fig. 15 illustrates the front panel for wavelet transform analysis proposed in this research. Users can select the wavelet filter pattern and the number of levels of output voltage signal decomposition in this window. It also displays the standard deviation plot of the output voltage signal’s wavelet decomposition. The processed data is sent to the MLI faulty switch analysis system, which provides a report on the existence of the faulty switch.
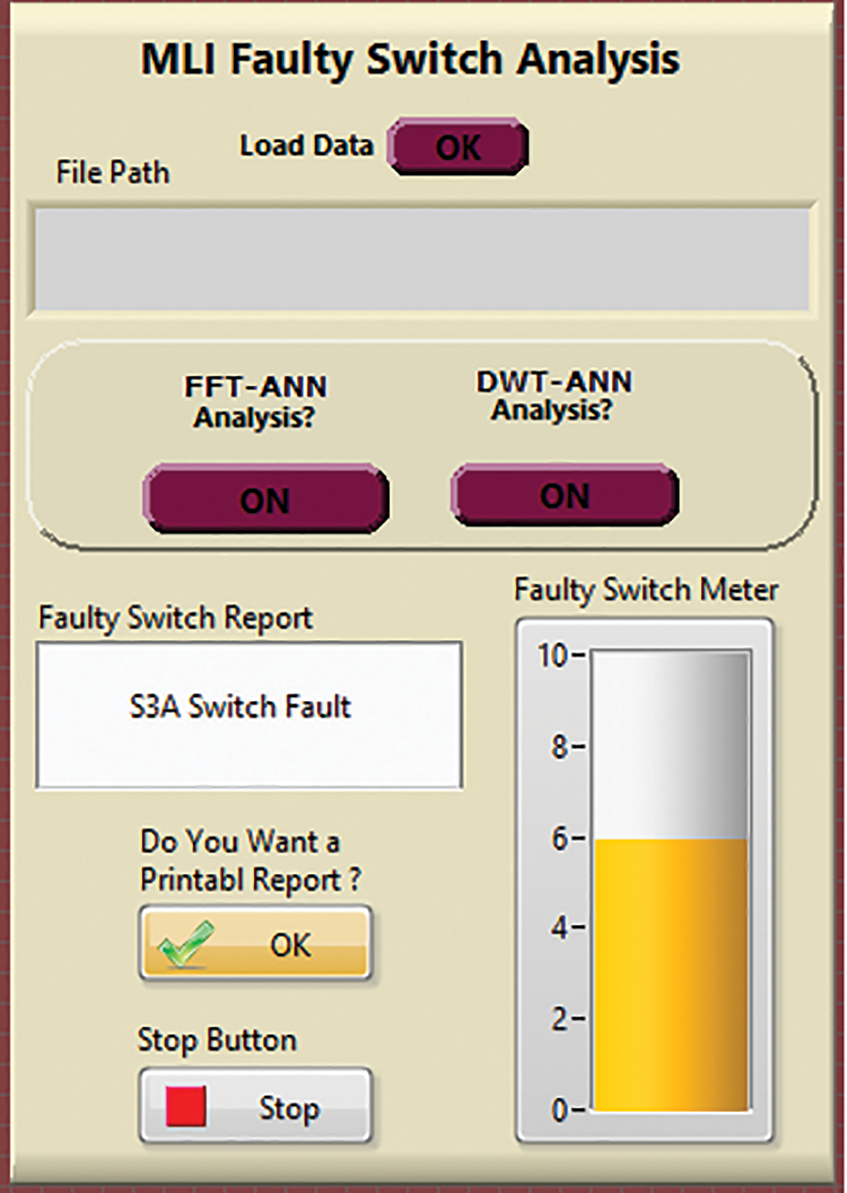
Figure 15: Representation of MLI faulty switch analysis
The cascaded H-bridged multilevel inverter faulty switch analysis module shown in Fig. 15 has a front panel that displays the faulty switch report. This module allows the user to load previously saved data into the PC framework and choose between FFT and DWT analysis for feature extraction. This module identifies the defective switch by comparing real-time voltage signal features to an offline qualified pattern.
5.3 Fault Classification Using ANN Techniques
The failure detection of multilevel inverters was automated using an ANN in these investigations. The ANN was used to solve the difficulty of detecting the faulty switch in a cascaded multilevel inverter. The multi-layer feed forward network with back propagation learning technique has been considered as one of the many ANN designs available in the literature due to its easy approach and high predictive capability.
Fig. 16 represents the mean square error (MSE) values generated from a large number of buried layer neurons. When the number of hidden layer neurons is fewer than 10, the neural network fails to fulfill the convergence conditions. When the number of iterations approaches 3800, process may take longer. The MSE estimated assessment with 24 hidden layer neurons is the lowest, according to the preceding explanation. As the number of hidden layer neurons grows, the neural network takes longer to train and meet the convergence criterion. The network’s mean square error was determined by keeping the learning rate at 0.1 with 24 hidden layer neurons toreach an optimum value of the number of epochs.
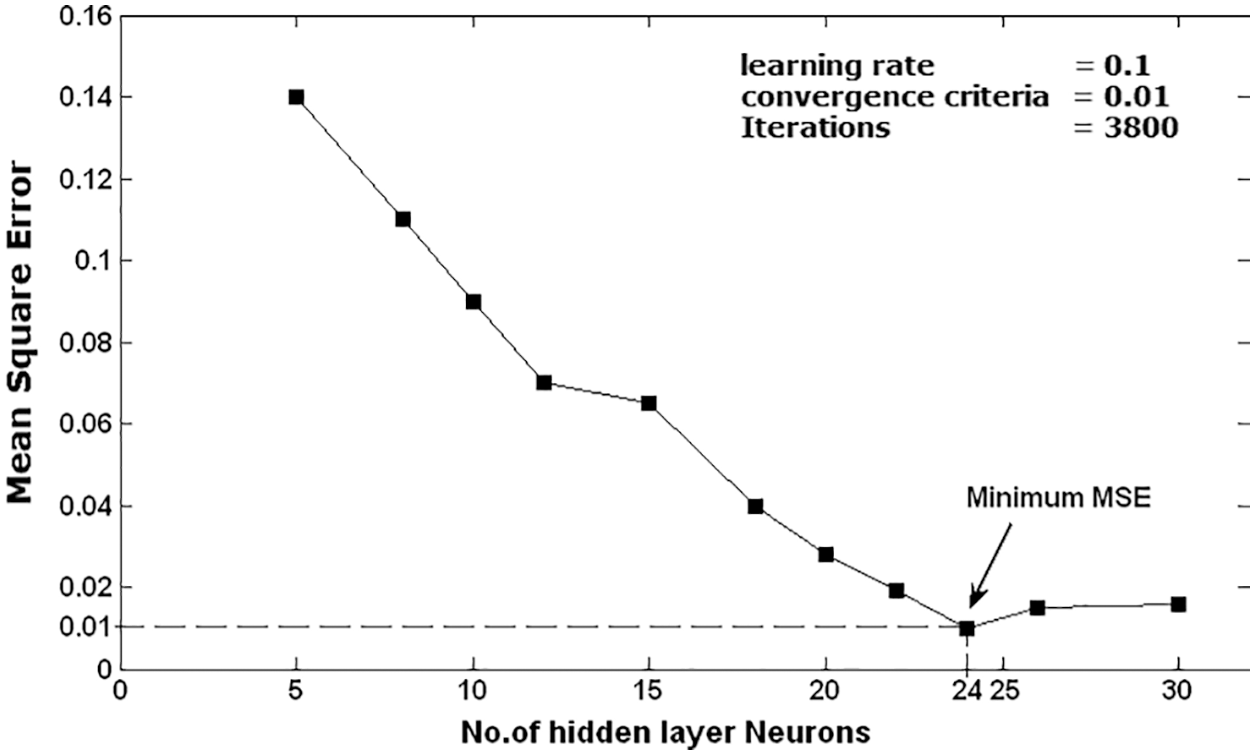
Figure 16: Investigation of the ANN-MSE at various statistics of hidden layer neurons for 24
The neural network requires longer learning and following the convergence criteria as the number of hidden layer neurons increases beyond 18. In order to reach an ideal value for the number of epochs, the network’s mean square error was computed by retaining the step size at 0.1 with 18 hidden layer neurons. The mean square error values derived from different amounts of hidden layer neurons are shown in Figs. 17 and 18 depicts the proposed fault diagnostic system’s detection rates for various numbers of hidden layer neurons. As compared to other instances, the device performs better with 18 secret layer neurons. In this context, the overall detection performance for all fault conditions is 100%, and the device can correctly find the fault in nearly any situation.
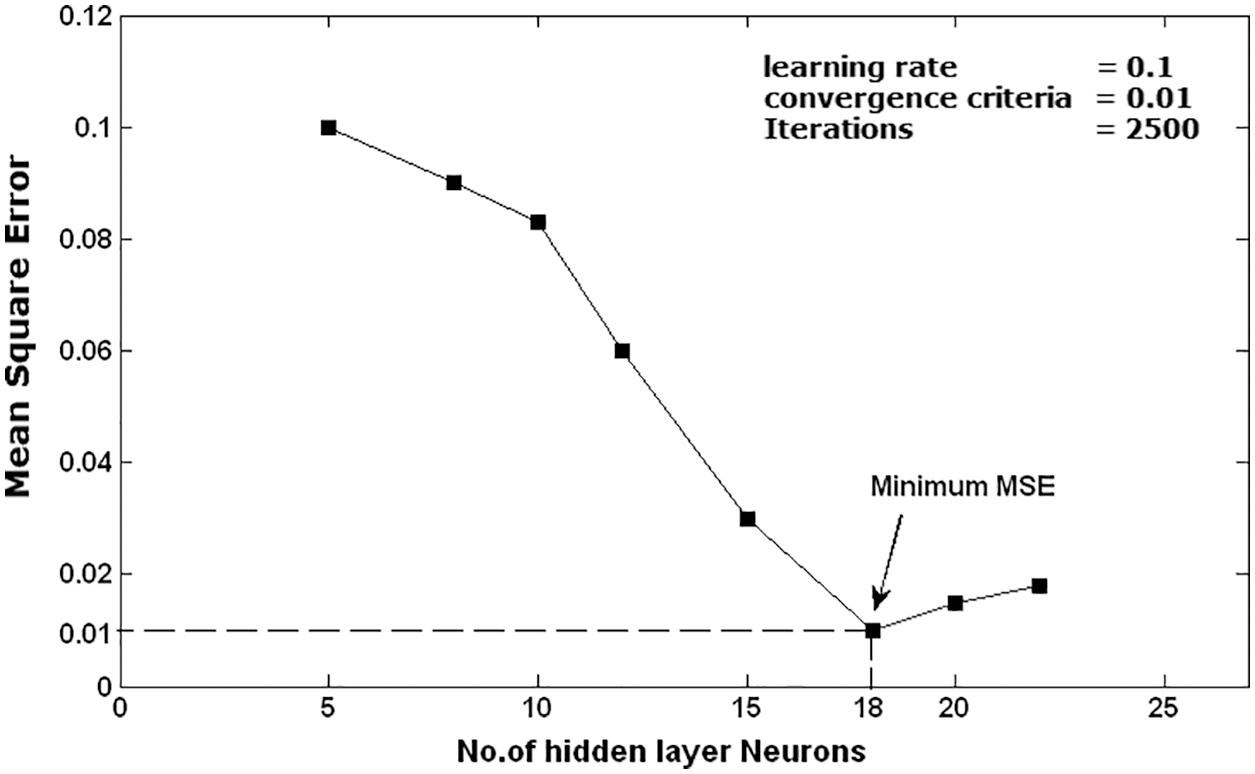
Figure 17: Investigation of the ANN-MSE at various statistics of hidden layer neurons for 18
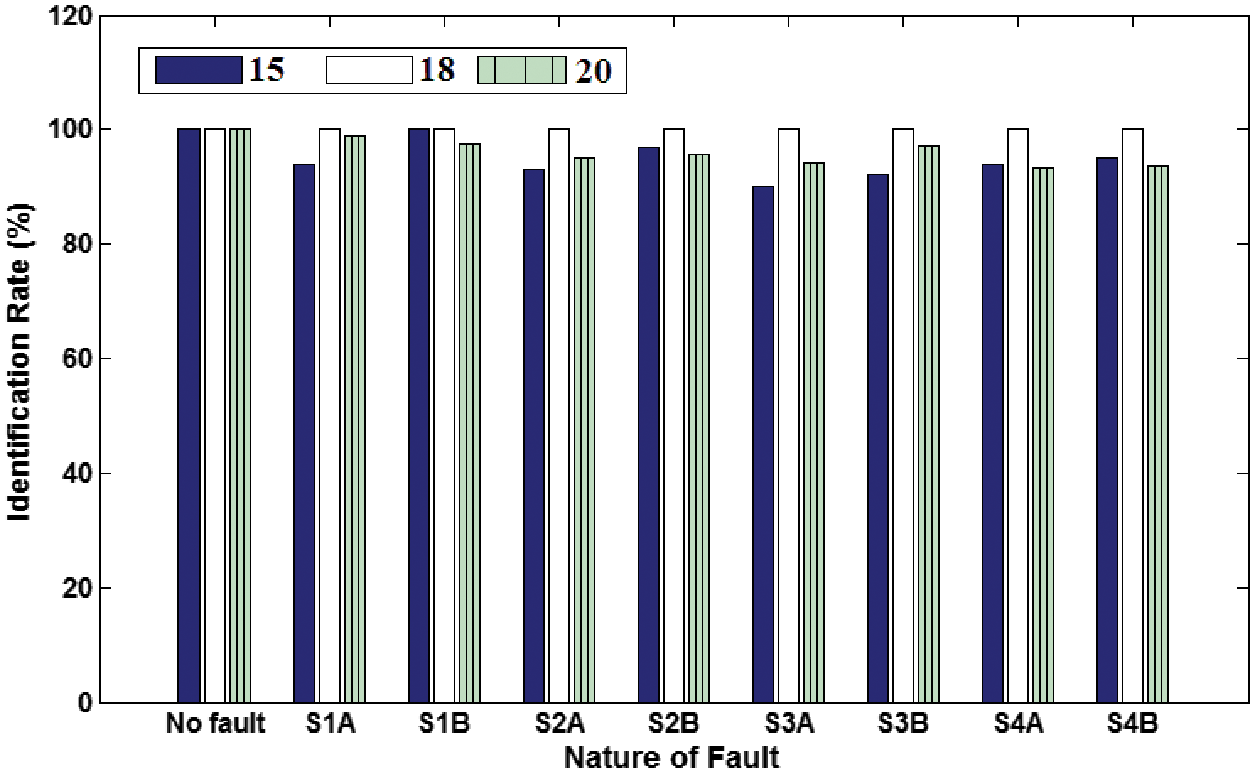
Figure 18: Selection of hidden layer for selecting suitable fault diagnostic system
The fault diagnostic framework is then implemented in the LabVIEW graphical user interface module using the extracted features as an input to ANN. The FFT-ANN-LabVIEW approach and the DWT-ANN-LabVIEW approach are two separate fault diagnostic methodologies proposed in this work. Fig. 19 compares the overall detection rates of two methods under various switch failure circumstances, depending on their overall efficiency. As stated earlier, the DWT-ANN-LabVIEW technique outperforms the FFT-ANN-LabVIEW approach in terms of total performance.
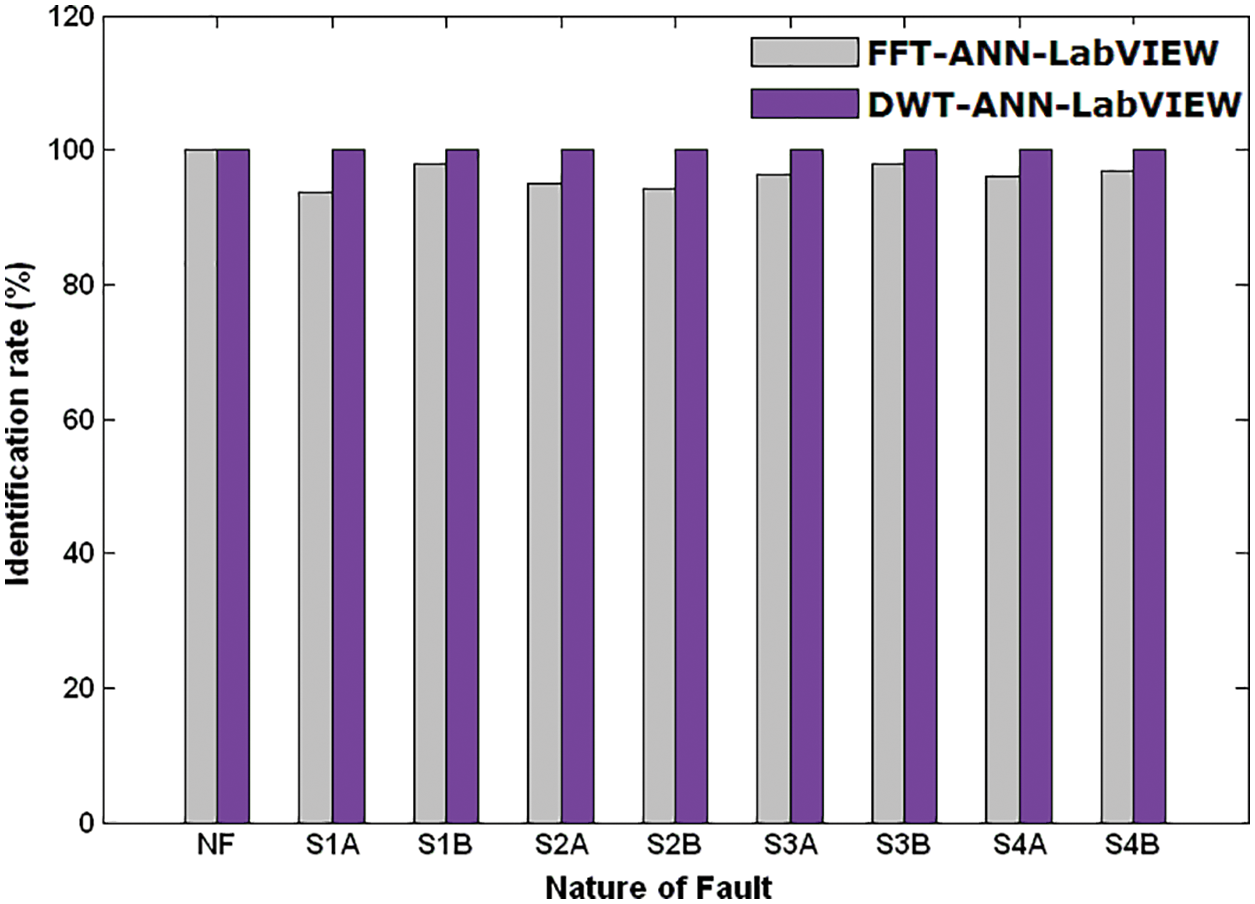
Figure 19: Comparative analysis on identification rate to faulty switch of multilevel inverter
The THD, Vrms, and Harmonic/Fundamental ratios up to 11th order harmonics are displayed using the FFT approach, which provides critical information regarding the defective switch in the multilevel inverter. For each failure condition, the energy content of the output voltage shows various patterns at different degrees of decomposition of the DWT MRA technique. Front panels based on LabVIEW are being developed for real-time applications, and they are extremely useful and user-friendly for the processing of industrial applications. The fault diagnostic efficiency of the DWT-ANN-LabVIEW technique is significantly better than the FFT-ANN-LabVIEW approach for all fault situations, from standard to multiple open and short-circuit switch fault states. Unlike the FFT-ANN method, the DWT-ANN method solely uses DWT characteristics to train and assess.
The DWT-ANN technique outperforms the FFT-ANN approach without any external inputs such as rms voltage values. The DWT-ANN-LabVIEW technique provides a nearly 100% identification rate. Unlike the FFT-ANN technique, the DWT-ANN approach solely trains and evaluates using DWT features. This method does not require any intermediate calculations, such as rms voltage values. As opposed to the FFT-ANN approach, the DWT-ANN approach performs better without any external inputs such as rms voltage values. For high-power applications, the number of levels in multilevel inverters is expanding by the day; the recommended device may be evaluated for 7 and 9 level inverter systems. For 7 level and 9 level inverters, the transients in current signal recorded during open or short circuit faults may be examined, and a diagnostic process based on this information can be devised.
Acknowledgement: The authors would like to thank Sona College of Technology, Salem, TN, India and also, we like to thank Anonymous reviewers for their so-called insights.
Funding Statement: The authors received no specific funding for this study.
Conflicts of Interest: The authors declare that they have no conflicts of interest to report regarding the present study.
References
1. M. T. Fard, W. A. Khan, J. He, N. Weise and M. Abarzadeh, “Fast online diagnosis of open-circuit switching faults in flying capacitor multilevel inverters,” Chinese Journal of Electrical Engineering, vol. 6, no. 4, pp. 53–62, 2020. [Google Scholar]
2. T. Wang, H. Xu, J. Han, E. Elbouchikhi and M. E. H. Benbouzid, “Cascaded H-bridge multilevel inverter system fault diagnosis using a PCA and multiclass relevance vector machine approach,” IEEE Transactions on Power Electronics, vol. 30, no. 12, pp. 7006–7018, 2015. [Google Scholar]
3. S. S. Lee, “Single-stage switched-capacitor module (S3CM) topology for cascaded multilevel inverter,” IEEE Transactions on Power Electronics, vol. 33, no. 10, pp. 8204–8207, 2018. [Google Scholar]
4. E. Bikdeli, J. Adabi, M. Rezanejad and S. A. Gholamian, “Investigation on fault tolerant capability of a single source switched capacitor multilevel inverter,” IEEE Transactions on Industrial Electronics, vol. 68, no. 9, pp. 7921–7930, 2021. [Google Scholar]
5. S. Amamra, K. Meghriche, A. Cherifi and B. Francois, “Multilevel inverter topology for renewable energy grid integration,” IEEE Transactions on Industrial Electronics, vol. 64, no. 11, pp. 8855–8866, Nov. 2017. [Google Scholar]
6. A. Chappa, S. Gupta, L. K. Sahu and K. K. Gupta, “A fault-tolerant multilevel inverter topology with preserved output power and voltage levels under pre-and postfault operation,” IEEE Transactions on Industrial Electronics, vol. 68, no. 7, pp. 5756–5764, 2021. [Google Scholar]
7. M. Kumar, “Open circuit fault detection and switch identification for LS-PWM H-bridge inverter,” IEEE Transactions on Circuits and Systems II: Express Briefs, vol. 68, no. 4, pp. 1363–1367, 2021. [Google Scholar]
8. H. Mhiesan, Y. Wei, Y. P. Siwakoti and H. A. Mantooth, “A fault-tolerant hybrid cascaded H-bridge multilevel inverter,” IEEE Transactions on Power Electronics, vol. 35, no. 12, pp. 12702–12715, 2020. [Google Scholar]
9. S. Khomfoi and L. M. Tolbert, “Fault diagnostic system for a multilevel inverter using a neural network,” IEEE Transactions on Power Electronics, vol. 22, no. 3, pp. 1062–1069, 2007. [Google Scholar]
10. M. Aleenejad, H. Mahmoudi and R. Ahmadi, “Multi fault tolerance strategy for three-phase multilevel converters based on a half-wave symmetrical selective harmonic elimination technique,” IEEE Transactions on Power Electronics, vol. 32, no. 10, pp. 7980–7989, 2017. [Google Scholar]
11. M. di Benedetto, A. Lidozzi, L. Solero, F. Crescimbini and P. J. Grbović, “Reliability and real-time failure protection of the three-phase five-level e-type converter,” IEEE Transactions on Industry Applications, vol. 56, no. 6, pp. 6630–6641, 2020. [Google Scholar]
12. V. S. Prasadarao, K. S. Peddapati and S. Naresh, “A new fault-tolerant MLI-investigating its skipped level performance,” IEEE Transactions on Industrial Electronics, vol. 69, no. 2, pp. 1432–1442, 2022. [Google Scholar]
13. S. Ahmadi, P. Poure, S. Saadate and D. Arab Khaburi, “Open-switch and open-clamping diode fault diagnosis for single-phase five-level neutral-point-clamped inverters,” IEEE Journal of Emerging and Selected Topics in Power Electronics, vol. 9, no. 4, pp. 4676–4686, 2021. [Google Scholar]
14. M. Aleenejad, H. Mahmoudi, P. Moamaei and R. Ahmadi, “A new fault-tolerant strategy based on a modified selective harmonic technique for three-phase multilevel converters with a single faulty cell,” IEEE Transactions on Power Electronics, vol. 31, no. 4, pp. 3141–3150, 2016. [Google Scholar]
15. V. F. Pires, T. G. Amaral, D. Foito and A. J. Pires, “Cascaded H-bridge multilevel inverter with a fault detection scheme based on the statistic moments indexes,” in Proc. Int. Conf. on Compatibility, Power Electronics and Power Engineering (CPE-POWERENG), Cadiz, Spain, pp. 193–198, 2017. [Google Scholar]
16. W. Jiang, C. Wang, Y. Li and M. Wang, “Fault detection and remedy of multilevel inverter based on BP neural network,” in Proc. Int. Asia-Pacific Power and Energy Engineering Conf., Shanghai, China, pp. 1–4, 2012. [Google Scholar]
17. Z. Ni, A. Abuelnaga, S. Yuan, S. Badawi, M. Narimani et al., “A new approach to input filter design for regenerative cascaded H-bridge drives,” IEEE Transactions on Industrial Electronics, vol. 69, no. 4, pp. 3266–3277, 2022. [Google Scholar]
18. P. Lezana, J. Pou, T. A. Meynard, J. Rodriguez, S. Ceballos et al., “Survey on fault operation on multilevel inverters,” IEEE Transactions on Industrial Electronics, vol. 57, no. 7, pp. 2207–2218, 2010. [Google Scholar]
19. B. Wang, Z. Li, Z. Bai, P. T. Krein and H. Ma, “A redundant unit to form t-type three-level inverters tolerant of IGBT open-circuit faults in multiple legs,” IEEE Transactions on Power Electronics, vol. 35, no. 1, pp. 924–939, 2020. [Google Scholar]
20. F. Wu, F. Feng, J. Duan and B. Sun, “Zero-crossing disturbance elimination and spectrum analysis of single-carrier seven-level SPWM,” IEEE Transactions on Industrial Electronics, vol. 62, no. 2, pp. 982–990, 2015. [Google Scholar]
21. T. Kamel, Y. Biletskiy and L. Chang, “Fault diagnoses for industrial grid-connected converters in the power distribution systems,” IEEE Transactions on Industrial Electronics, vol. 62, no. 10, pp. 6496–6507, 2015. [Google Scholar]
22. X. Ge, J. Pu and Y. Liu, “Online open-switch fault diagnosis method in single-phase PWM rectifiers,” Electronics Letters, vol. 51, pp. 1920–1922, 2015. [Google Scholar]
23. F. Wu and J. Zhao, “A real-time multiple open-circuit fault diagnosis method in voltage-source-inverter fed vector-controlled drives,” IEEE Transactions on Power Electronics, vol. 31, no. 2, pp. 1425–1437, 2016. [Google Scholar]
24. A. B. de Mello Oliveira, R. L. Moreno and E. R. Ribeiro, “Short-circuit fault diagnosis based on rough sets theory for a single-phase inverter,” IEEE Transactions on Power Electronics, vol. 34, no. 5, pp. 4747–4764, 2019. [Google Scholar]
Cite This Article
 Copyright © 2023 The Author(s). Published by Tech Science Press.
This work is licensed under a Creative Commons Attribution 4.0 International License , which permits unrestricted use, distribution, and reproduction in any medium, provided the original work is properly cited.
 Downloads
 Citation Tools