 Open Access
ARTICLE
Artificial Intelligence Enabled Decision Support System on E-Healthcare Environment
1 Department of Information Technology, Panimalar Engineering College, Chennai, 600123, India
2 Department of Information Technology, Dr. MGR Educational and Research Institute, Chennai, 600095, India
3 College of Technical Engineering, The Islamic University, Najaf, Iraq
4 Department of Computer Technical Engineering, Al-Hadba University College, Mosul, Iraq
* Corresponding Author: B. Karthikeyan. Email:
Intelligent Automation & Soft Computing 2023, 36(2), 2299-2313. https://doi.org/10.32604/iasc.2023.032585
Received 23 May 2022; Accepted 29 September 2022; Issue published 05 January 2023
Abstract
In today’s digital era, e-healthcare systems exploit digital technologies and telecommunication devices such as mobile devices, computers and the internet to provide high-quality healthcare services. E-healthcare decision support systems have been developed to optimize the healthcare services and enhance a patient’s health. These systems enable rapid access to the specialized healthcare services via reliable information, retrieved from the cases or the patient histories. This phenomenon reduces the time taken by the patients to physically visit the healthcare institutions. In the current research work, a new Shuffled Frog Leap Optimizer with Deep Learning-based Decision Support System (SFLODL-DSS) is designed for the diagnosis of the Cardiovascular Diseases (CVD). The aim of the proposed model is to identify and classify the cardiovascular diseases. The proposed SFLODL-DSS technique primarily incorporates the SFLO-based Feature Selection (SFLO-FS) approach for feature subset election. For the purpose of classification, the Autoencoder with Gated Recurrent Unit (AEGRU) model is exploited. Finally, the Bacterial Foraging Optimization (BFO) algorithm is employed to fine-tune the hyperparameters involved in the AEGRU method. To demonstrate the enhanced performance of the proposed SFLODL-DSS technique, a series of simulations was conducted. The simulation outcomes established the superiority of the proposed SFLODL-DSS technique as it achieved the highest accuracy of 98.36%. Thus, the proposed SFLODL-DSS technique can be exploited as a proficient tool in the future for the detection and classification of CVD.Keywords
The prevalence of non-communicable chronic diseases has drastically increased across the globe since the lifestyles of people have changed dramatically in the past few years due to technological advancements [1]. According to the World Health Organization (WHO), chronic obstructive lung illness, Ischemic Heart Disease (IHD), lower respiratory infection, and stroke are the top most diseases that contribute to a high mortality rate over the past few decades in both developed as well as the developing countries [2]. In recent times, Artificial Intelligence (AI) techniques have been widely applied in the healthcare industry, especially in the following domains such as prevention, diagnosis, medical payment systems, treatment and so on [3]. Mobile internet networks, big data and other innovative information technologies are also leveraged in healthcare-based AI applications. Thus, the AI-related Medical (M)-healthcare and electronic (E)-healthcare solutions have gained much attention to obtain information, develop processes and offer a clear output for different types of audiences such as the caregiver, physician and patients. AI-related M-healthcare and E-healthcare solutions are also helpful in achieving the objectives and the needs of medical treatments in an efficient manner [4]. Being a data-driven technology, the AI technique brought a paradigm shift from information domain to application domain in intelligent drug research and development, intelligent health management and diagnosis-related applications, intelligent treatment and diagnosis, intelligent payment, etc. [5]. In the domain of Information and Communication Technology (ICT), several authors have investigated the applications of AI in healthcare industry.
Cardiovascular Disease (CVD) is one of the critical health problems with a high mortality rate in both developing as well as developed countries [6]. Some typical symptoms of CVD include body weakness, swollen feet and shortness of breath. In literature, various researchers attempted to develop an effective method that can diagnose cardiac disease at its early stages. This is because the existing diagnostic methods for heart diseases are either inaccurate or not fast enough to predict the onset of the disease or its progression [7]. Both prognosis as well as the treatment of cardiac diseases are highly challenging to accomplish, especially in the absence of modern technology and highly-experienced medical specialists. Some common reasons behind the occurrence of CVD include the intake of high-calorie diet, sugars, saturated fats and physical inactivity. Further, these causes are linked with atherosclerosis development and other metabolic disturbances, too, like hypertension, metabolic syndrome and Diabetes Mellitus (DM). CVD patients mostly suffer from the above-mentioned conditions over the course of their life [8]. Machine Learning (ML) prediction methods require proper data for both trainings as well as testing purposes. The performance of ML methods can be improved only if a balanced data set is used for training and testing purposes. Moreover, the prediction abilities of a model can be enhanced further with the help of the appropriate features relevant to the data [9,10]. Hence, Feature Selection (FS) and the data balancing processes are crucial phases that enhance the performance of a model.
In the current study, a new Shuffled Frog Leap Optimizer with a Deep Learning-based Decision Support System (SFLODL-DSS) is designed to diagnose Cardiovascular Disease (CVD). The proposed SFLODL-DSS technique primarily incorporates SFLO-based Feature Selection (SFLO-FS) approach for feature subset election. For the purpose of classification, the Autoencoder with Gated Recurrent Unit (AEGRU) model is exploited. Finally, the Bacterial Foraging Optimization (BFO) algorithm is employed to fine-tune the hyperparameters involved in the AEGRU technique. To demonstrate the enhanced performance of the proposed SFLODL-DSS technique, a series of simulations was conducted.
In the study conducted earlier [11], five selection strategies were implemented for multi-label active learning. These strategies were utilized to mitigate the labelling costs via an iterative selection of the most appropriate data and by querying the labels. The hyperparameters of the feature selection techniques, with ranks for each label, were maximized with the help of the grid search. This was accomplished to execute the prediction models for every scenario in the heart disease dataset. In literature [12], an intelligent healthcare structure was devised to predict the occurrence of heart diseases based on the Swarm-Artificial Neural Network (Swarm-ANN) approach. The presented Swarm-ANN approach arbitrarily produced a set of pre-defined Neural Network (NN) numbers to evaluate and train the structures related to the solution’s consistency. At last, the weight of the neuron got altered by sharing the global optimum weight with the rest of the neurons. Then, the accuracy of the heart disease prediction was estimated.
In literature [13], the researchers compared the performance of the conventional mechanisms against the presented system that predicts cardiac disease with the help of traditional ML classifier. The mechanism modelled in this study was helpful in fine-tuning the hyperparameters for the five classification methods considered in this study, with the help of grid search method. The authors in literature [14] introduced an ML-related prediction method for the prediction of multiple-and binary-classification heart disease datasets concurrently. Initially, the researchers devised a Fuzzy-GBDT approach by integrating Gradient Boosting Decision Tree (GBDT) and Fuzzy Logic (FL) techniques to reduce the complexities in the data and increase the generalization of the binary classifier’s prediction. Then, the Fuzzy-GBDT was compiled with bagging to avoid the issue of overfitting.
A web-related decision support structure was presented in the study conducted earlier [15]. This structure was able to generate a pre-guidance report based on the decisions taken from the Bayesian network analysis results on disease dataset. Further, the report was produced in adherence to the mined disease paradigms over medical and non-medical factors of the patients. The mined disease paradigms were retrieved from the patient’s past medical reports. The outcomes of the report inferred the likelihood of getting affected by a disease for the provided health metrics. In the study conducted earlier [16], a comparison was made among various computational intelligence methods in terms of heart disease identification. In this study, two computational intelligence approaches such as the k-Nearest Neighbour (KNN) and Decision Tree (DT), were compared and contrasted. Further, the Autoencoder (AE) feature extraction method was used in this study to reduce the number of attributes required to describe the heart disease dataset.
An intelligent SFLODL-DSS technique is designed in this study to diagnose the CVD. The proposed SFLODL-DSS technique primarily incorporates the SFLO approach for feature subset election. For the purpose of classification, the AEGRU model is exploited. Finally, the BFO algorithm is employed to fine-tune the hyperparameters involved in the AEGRU technique. The overall processes involved in the proposed model are shown in Fig. 1.
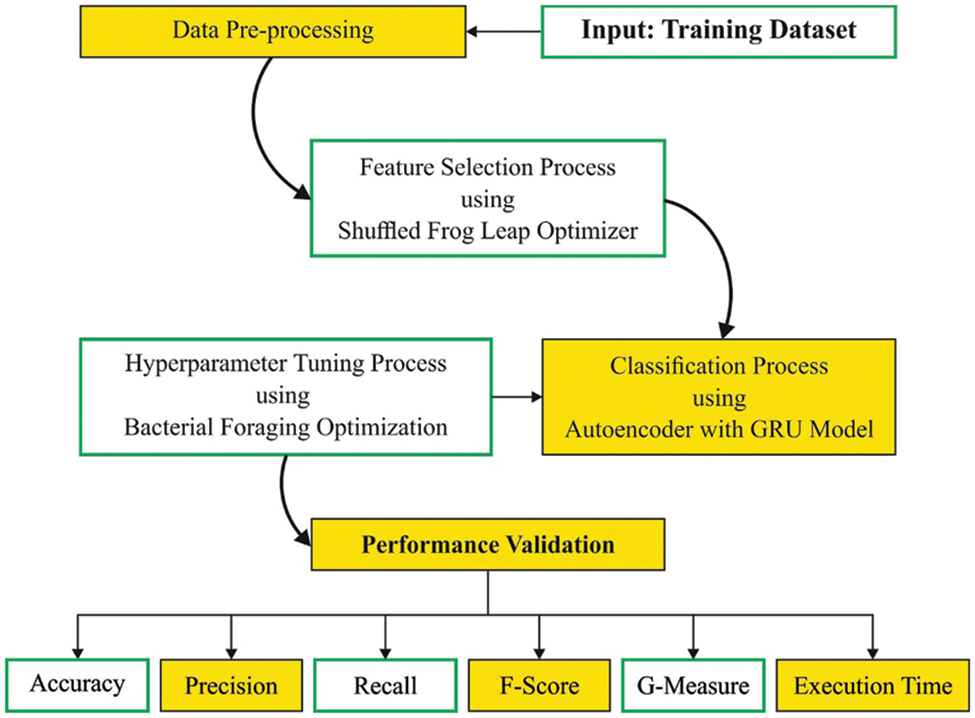
Figure 1: Working process of the SFLODL-DSS method
In this study, the Min-Max scaler is exploited to scale the dataset in the range of [0,1]. This range guarantees fast convergence for gradient learning techniques and is formulated using the following equation.
Here,
3.2 Processes Involved in Feature Selection Technique
In this stage, the SFLODL-DSS technique primarily incorporates the SFLO approach for feature subset election [17]. SFLO, a memetic metaheuristic technique, is generally applied to find a global solution by executing an informed heuristic search via a heuristic function. The SFLO technique is a population-based algorithm inspired from frogs of similar characteristics. In this technique, all the frogs are regarded as the solutions. The overall population of the frogs is categorized under several subclasses called ‘memeplex’. Further, different subcategories are appreciated as disparate frog memes. The whole set of the memeplexes is held accountable in case of a constrained exploration. In every memeplex, the frogs tend to affect the activities of the other frogs, whereas the memeplex progresses via memetic growth procedure. After achieving several memetic growth phases, the memeplexes are forced to combine. This phenomenon results in the generation of novel memeplexes due to the shuffling technique. The shuffling procedure promotes unbiased traditional progress in the direction of a certain interest. The end condition is met when the shuffling procedure and the local search alternate are chosen.
(1) This process contains a population ‘p’ that corresponds to a possible number of solutions and is constrained by a collection of virtual frogs (n).
(2) The population is divided into subsections known as ‘memeplexes’ (m). Here, a memeplex is regarded as a group of the corresponding frog cultures that try to accomplish certain objectives.
(3) Frog i is demonstrated as
(4) Within every memeplex, the frog culture searches for a space in dissimilar directions and independently exchanges ideas. The frog with the worst fitness value is represented by
(5) The frog with the global optimum fitness is recognized as
(6) The frog with the worst fitness value is determined as follows.
Now, the rand function produces an arbitrary value in the range of
In FS problem, all the solutions are constrained to binary numbers such as 0 and 1. In the SFLO application algorithm, the SFLO-FS approach is developed by originating a binary form that was determined earlier. In the SFLO-FS technique, a solution is described through 1D vector, whereas the length of the vector depends on the count of the features in the new dataset. All the cells in a vector have separate values, i.e., either 1 or 0. The value ‘1’ signifies that the resultant features are carefully chosen; otherwise, the value is defined by 0.
Here, Zmn represents a dissimilar form of the solution vector X, whereas Xmn specifies the continuous position of the searching agent m at dimension n.
The FS process is modelled as a multi-objective optimization problem, in which two conflicting objectives are fulfilled, such as high classification performance and low FS quantity. Here, the classification performance is applied as a Fitness Function (FF) value to assess the efficacy of the entire searching agent. To create a balance between classification performance and the number of FS for every solution, the FF value is applied in both SFLO algorithm as well as the whole approach to determine the searching agents.
In Eq. (5), Err (D) signifies the classification error rate,
3.3 Classification Using Optimal AEGRU Model
In current study, the AEGRU model is exploited for the purpose of classification. The GRU model is a specific case of Long Short Term Memory (LSTM) model and is established to reduce the extended training time taken by LSTM [18]. In comparison with LSTM, the GRU model is too simple since it encompasses only two gates as update gate and the reset gate that control the flow of the data inside the unit. The modification function amongst the GRU neurons is given herewith.
Now
The structure of the GRU model is shown in Fig. 2. The suggested AEGRU technique is similar to AE with LSTM (AELSTM) method. Here, the AE technique is leveraged to shrink the medical data by describing the architecture of the information and attaching the encoder information for GRU network. The encoders of the medical data and its past data are given to GRU model for the purpose of training and to make the neuron fit into the model. This phenomenon results in the prediction of the desired output. Particularly, the AEGRU methodology is trained using a collection of past encoder medical datasets. In this final stage, the BFO algorithm is employed for optimal fine-tuning of the hyperparameters involved in the AEGRU approach. The conventional BFO method is initialized as two major phases that are briefed herewith.
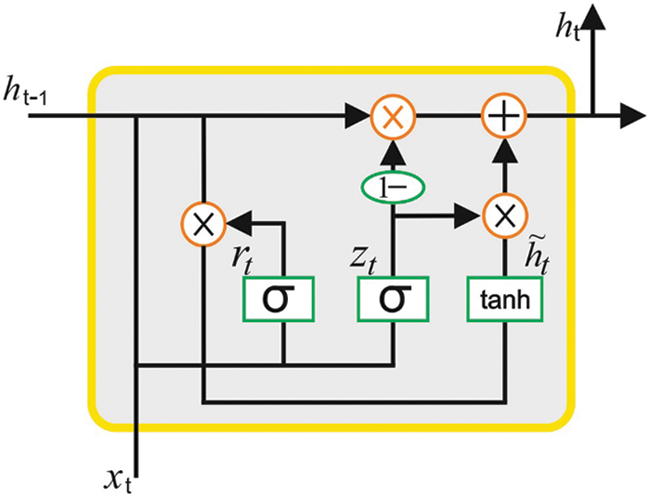
Figure 2: GRU model
1) Initiation of the solution space: The spatial dimension
2) Initiation of the bacteria: The bacterial count is designated as
Therefore, the fitness of the
Now, if the function has a low value, it denotes high fitness. i represents the
Chemotaxis
The Chemotaxis process comprises a massive number of flipping and swimming motions [19]. In
The swimming step length of the
Swarming
The bacteria are classified into attractive and repulsive bacteria, for which the numerical relationship is established as follows.
In Eq. (3),
Reproduction
The bacteria tend to replicate once it accomplishes an optimal environment; otherwise, it dies. Consequently, after swarming and chemotaxis techniques, the fitness of the whole bacteria is calculated and sorted as defined below.
Here, one half of the bacteria reaches the optimal state
Elimination and Dispersal
After reproduction, each bacterium is disseminated through the possibility of
Now, the removal process is followed when
In this section, the performance of the proposed SFLODL-DSS method was experimentally validated using a dataset sourced from UCI repository. The dataset holds 303 samples, and the proposed model selected seven features, as shown in Table 1.

Fig. 3 shows the confusion matrices generated by the proposed SFLODL-DSS method using distinct Training (TR) and Testing (TS) datasets. With 80% of TR data, the proposed SFLODL-DSS method classified 123 and 105 samples under absence and presence classes, respectively. Moreover, with 20% of TS data, the SFLODL-DSS method segregated 32 and 28 samples under absence and presence, respectively. In parallel, with 70% of TR data, the proposed SFLODL-DSS method categorized 116 and 82 samples under absence and presence classes correspondingly. Similarly, with 30% of TS data, the SFLODL-DSS method recognized 48 and 41 samples as absence and presence classes, correspondingly.
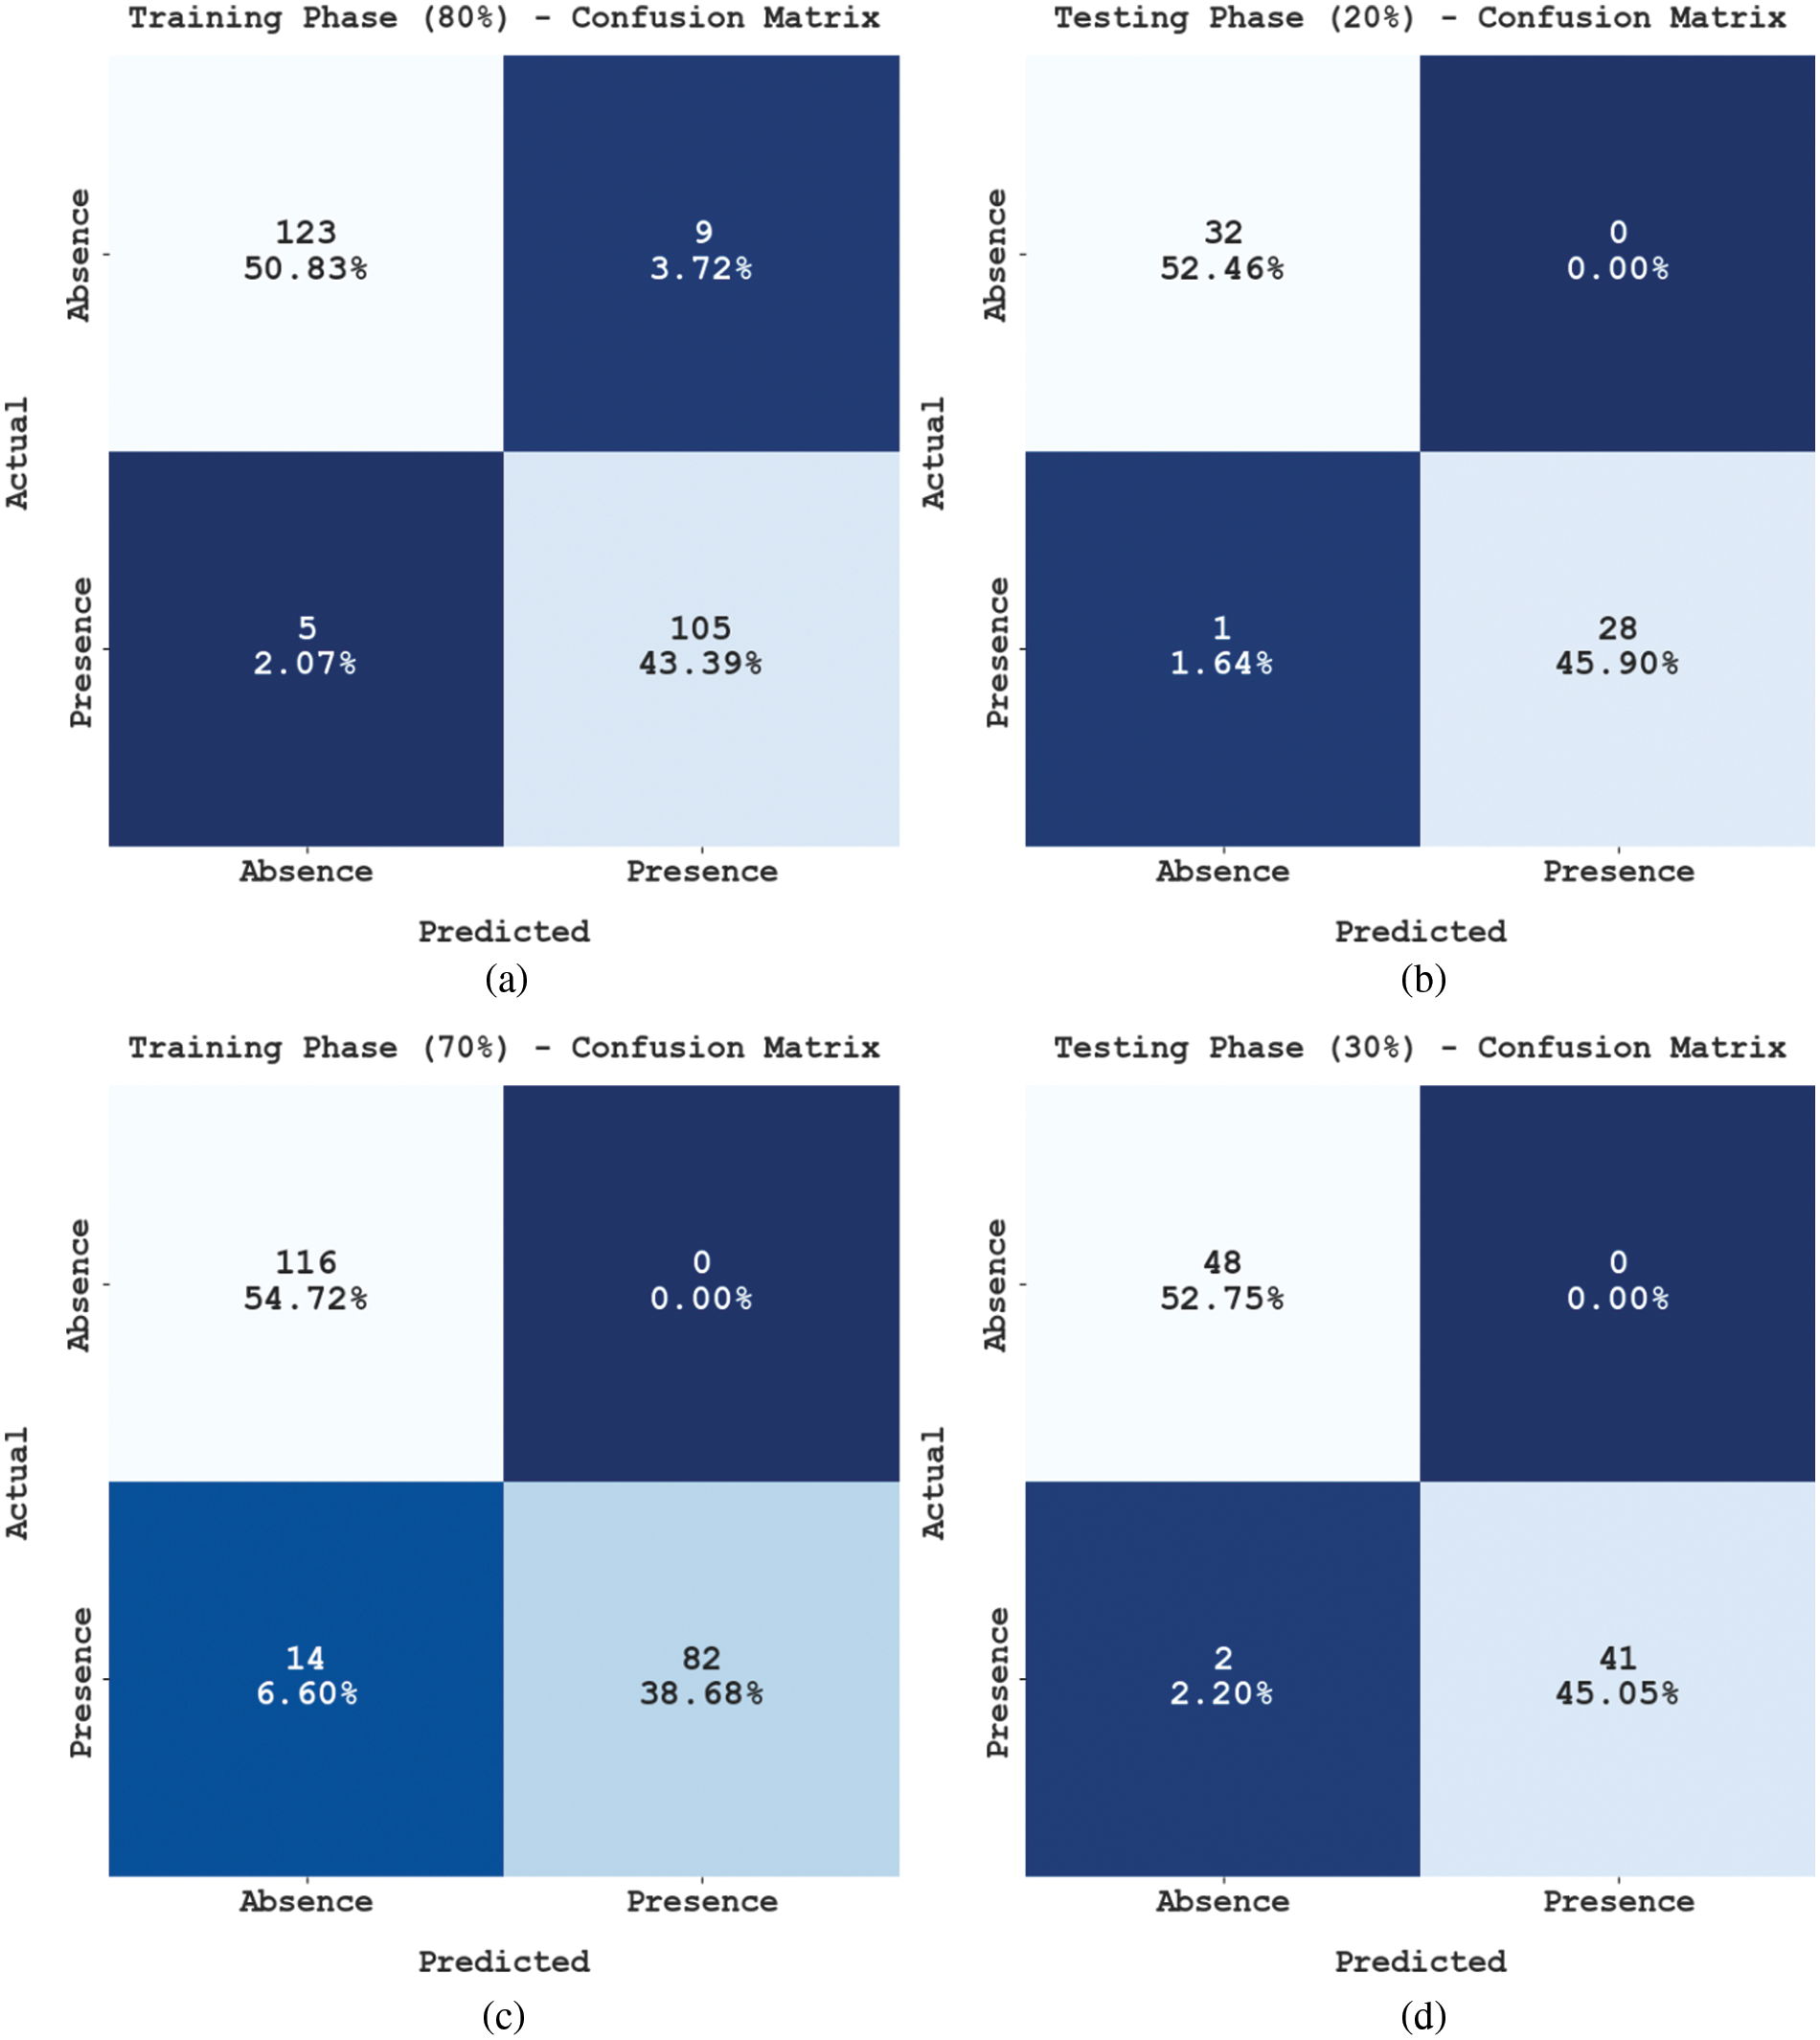
Figure 3: Confusion matrix of SFLODL-DSS method
Table 2 and Fig. 4 provide the overall classification results accomplished by the proposed SFLODL-DSS method on the applied dataset. With 80% of TR data, the proposed SFLODL-DSS method achieved average

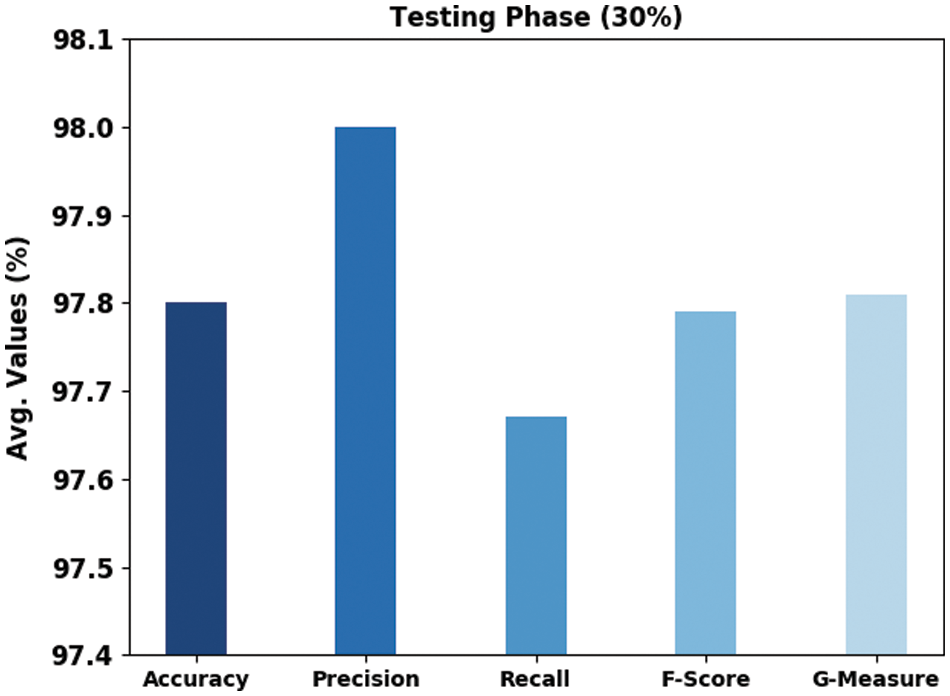
Figure 4: Average classification results of the SFLODL-DSS method
Both Training Accuracy (TA) and Validation Accuracy (VA) values, obtained by the proposed SFLODL-DSS method on test dataset, are demonstrated in Fig. 5. The experimental outcomes imply that the proposed SFLODL-DSS approach attained the maximal TA and VA values whereas the VA values were higher than the TA values.
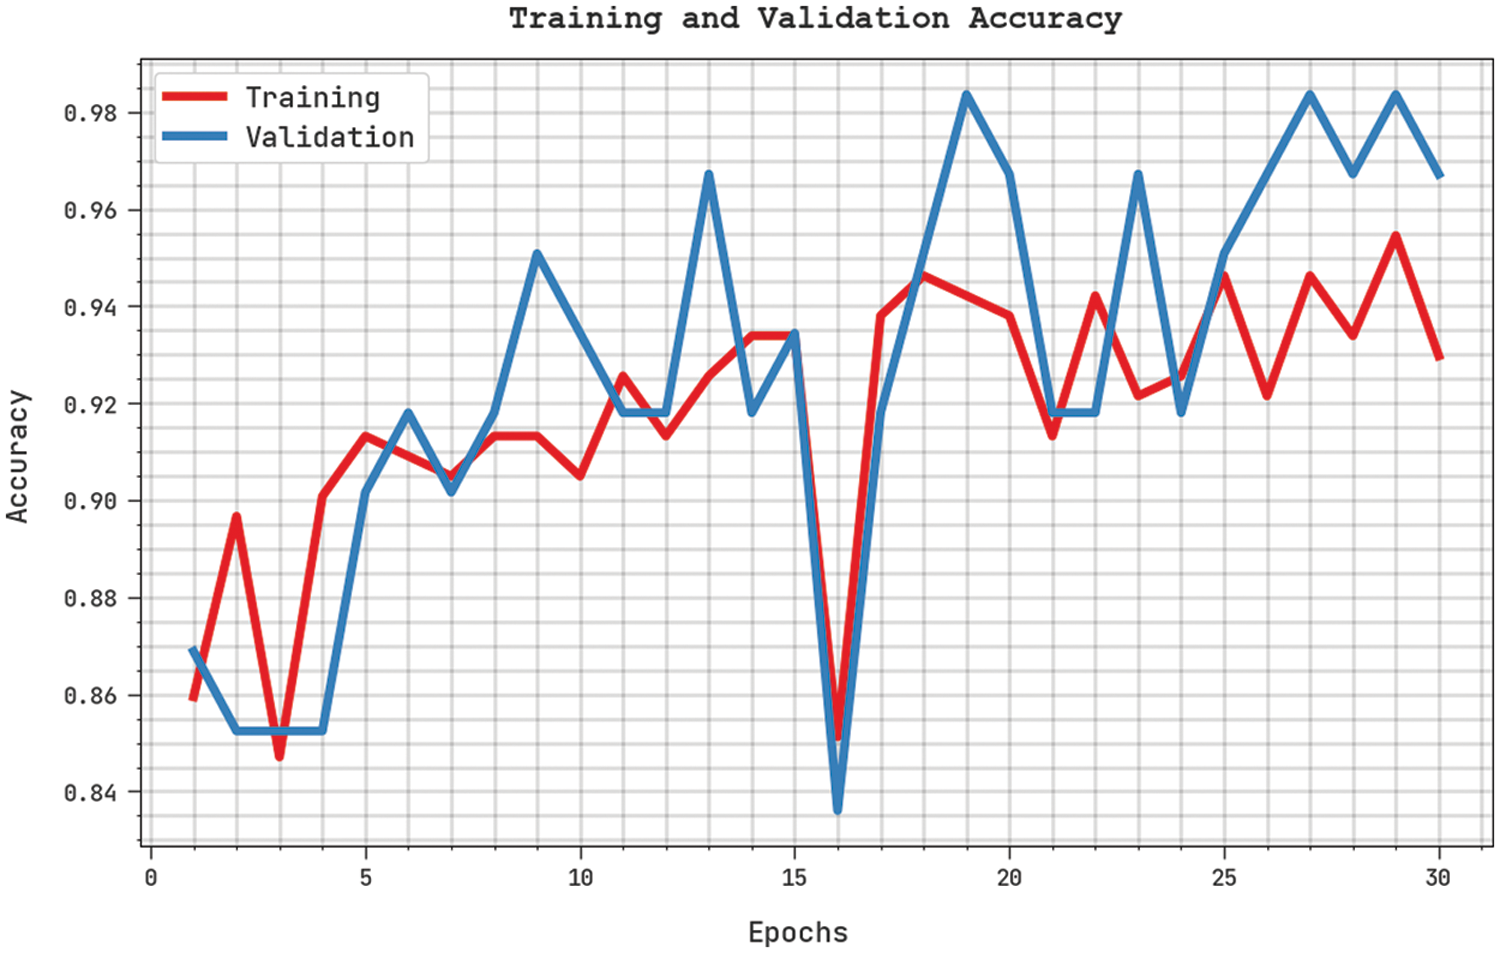
Figure 5: TA and VA analyses results of the SFLODL-DSS method
Both Training Loss (TL) and Validation Loss (VL) values, gained by the proposed SFLODL-DSS method on test dataset, are shown in Fig. 6. The experimental outcomes implicitly explain that the proposed SFLODL-DSS algorithm exhibited the minimal TL and VL values whereas the VL values were lower than the TL values.
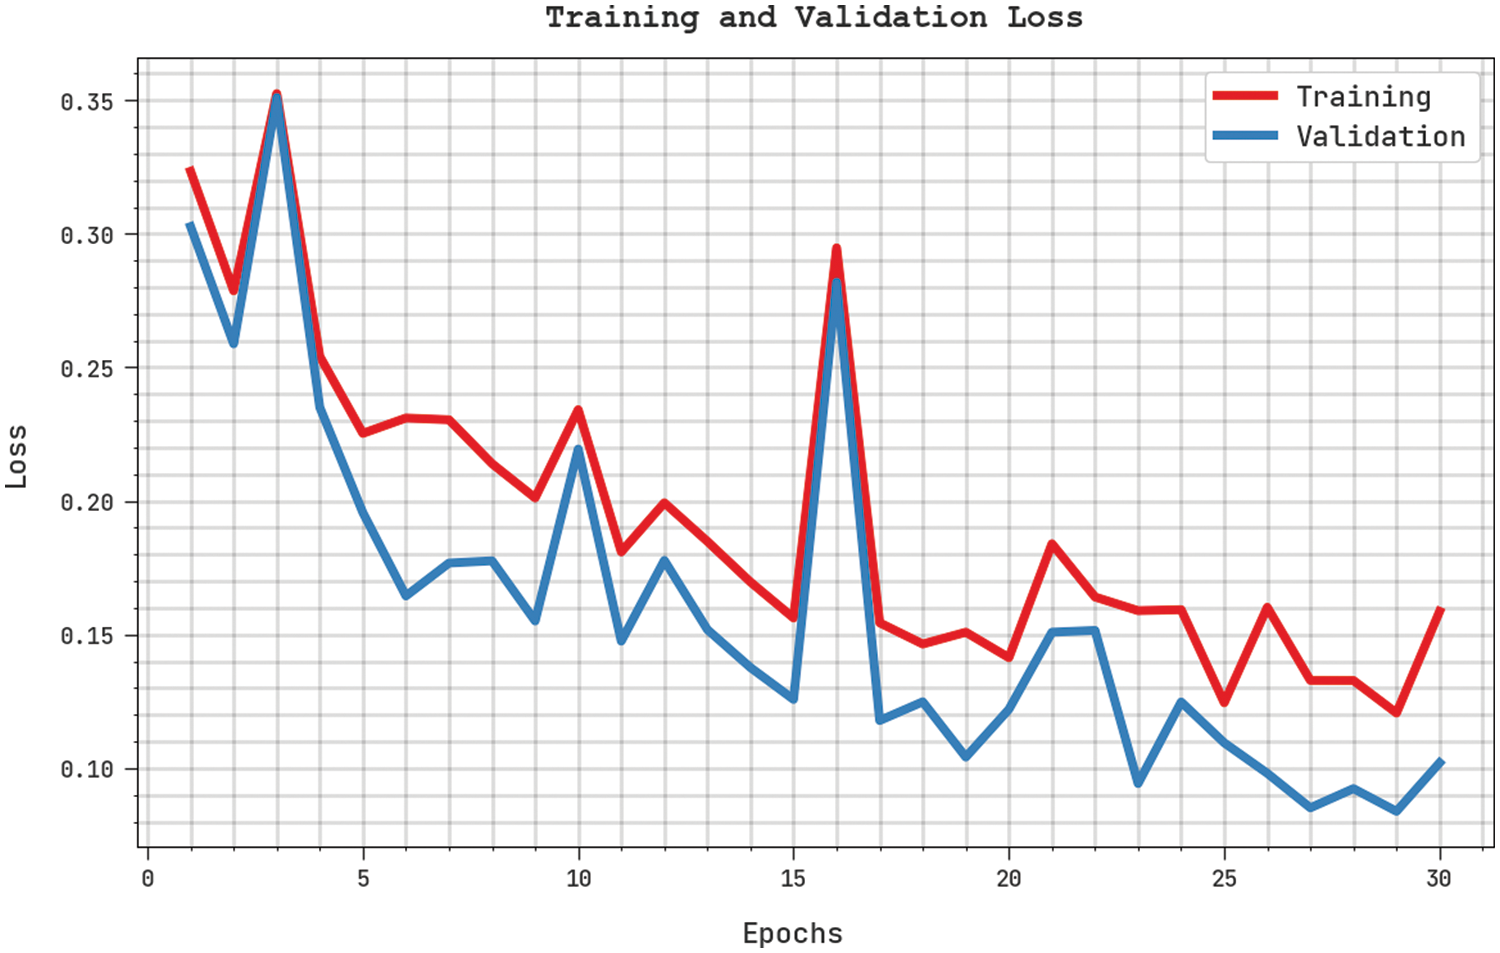
Figure 6: TL and VL analyses results of the SFLODL-DSS method
A clear precision-recall study was conducted upon the proposed SFLODL-DSS method using the test dataset and the results are shown in Fig. 7. The figure signifies that the proposed SFLODL-DSS method produced enhanced precision-recall values under all the classes. Fig. 8 shows the detailed ROC analysis results achieved by the presented SFLODL-DSS algorithm on test dataset. The results infer that the proposed SFLODL-DSS method exhibited its supreme capability in terms of categorizing the test dataset under distinct classes.
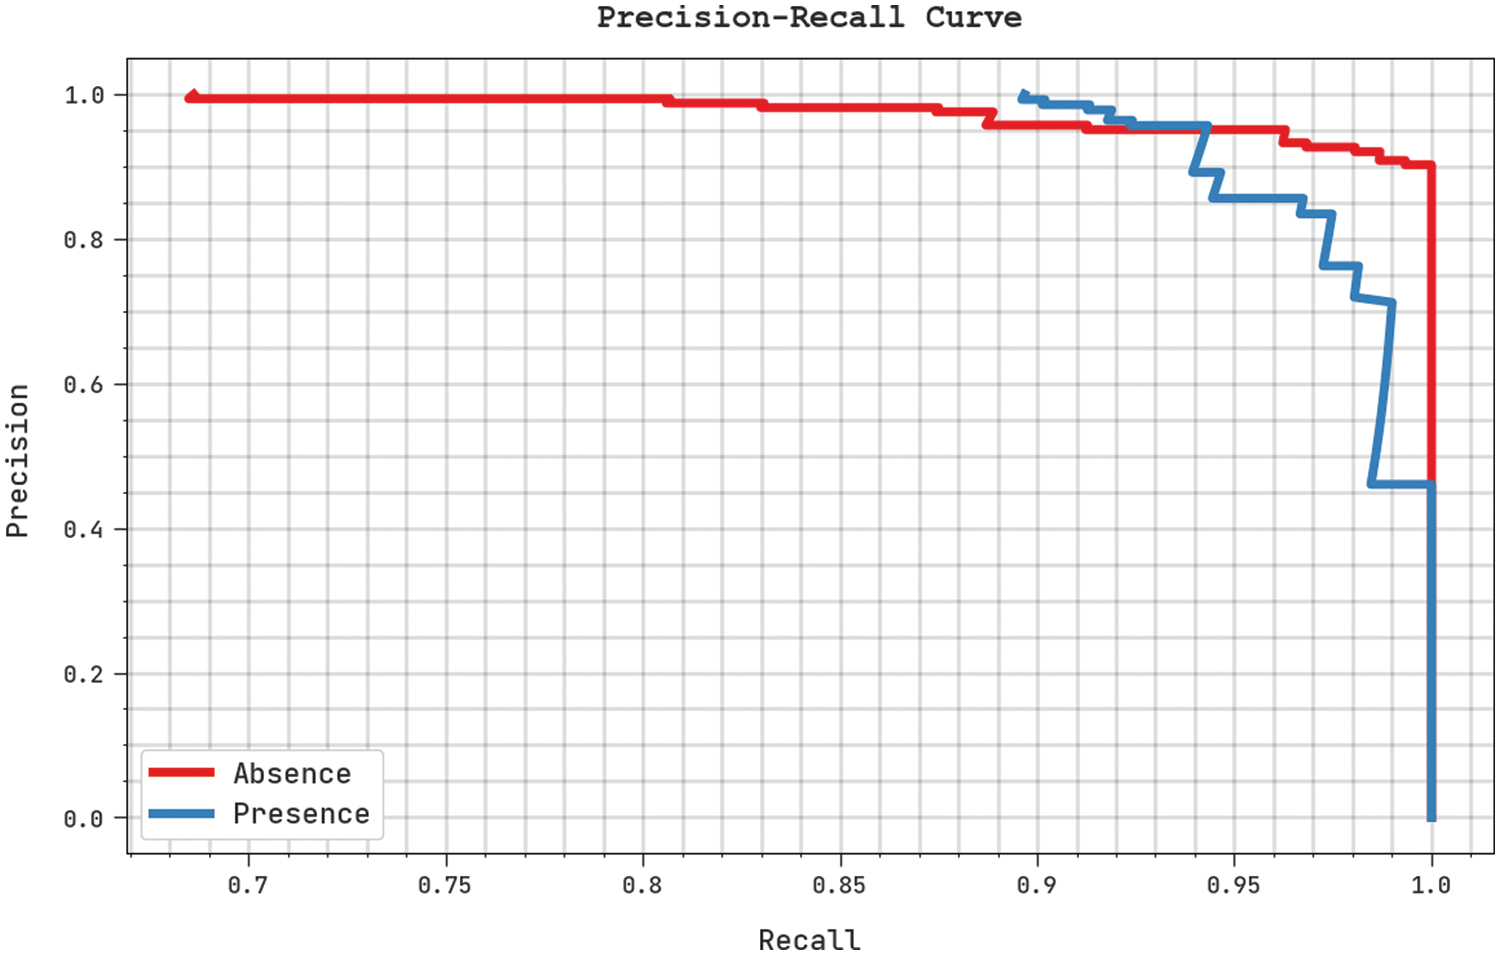
Figure 7: Precision-recall analyses results of the SFLODL-DSS method
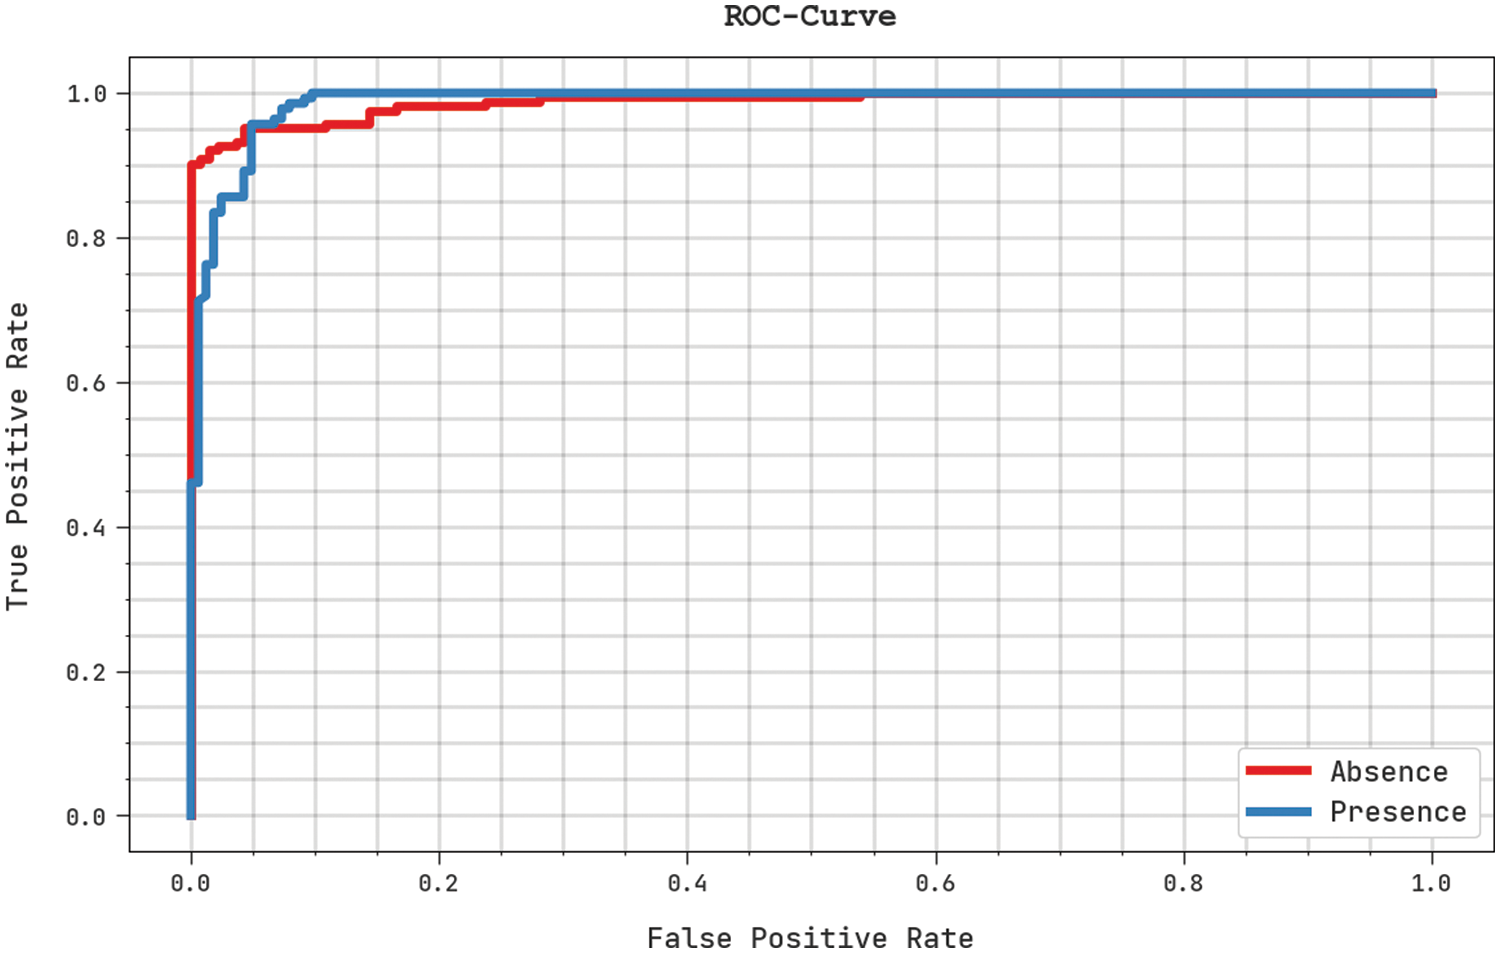
Figure 8: ROC analysis results of the SFLODL-DSS method
Table 3 and Fig. 9 show the comprehensive comparison analysis outcomes accomplished by the proposed SFLODL-DSS model and other recent models such as Random Forest (RF), Bidirectional Long Short Term Memory (BiLSTM), Inception v3, Extreme Gradient Boosting (XGBoost), Deep Belief Network (DBN), Support Vector Classification (SVC) and Iterative Dichotomiser 3 (ID3). The experimentation outcomes showcase the overall improvements achieved by the proposed SFLODL-DSS model. With respect to

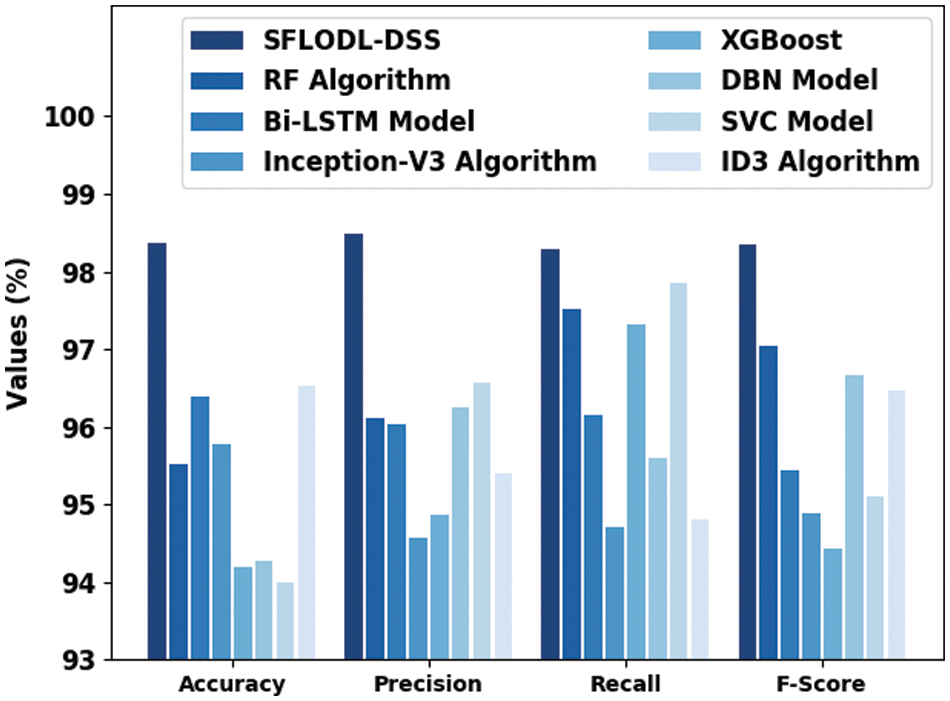
Figure 9: Comparative classification results of the proposed SFLODL-DSS method
Finally, the SFLODL-DSS model was compared with existing models in terms of Execution Time (EXET) and the results are shown in Table 4 and Fig. 10. The experimental values imply that the rest of the models such as RF, XGBoost and DBN demanded high EXET such as 2.230 , 2.040 and 2.100 s respectively.

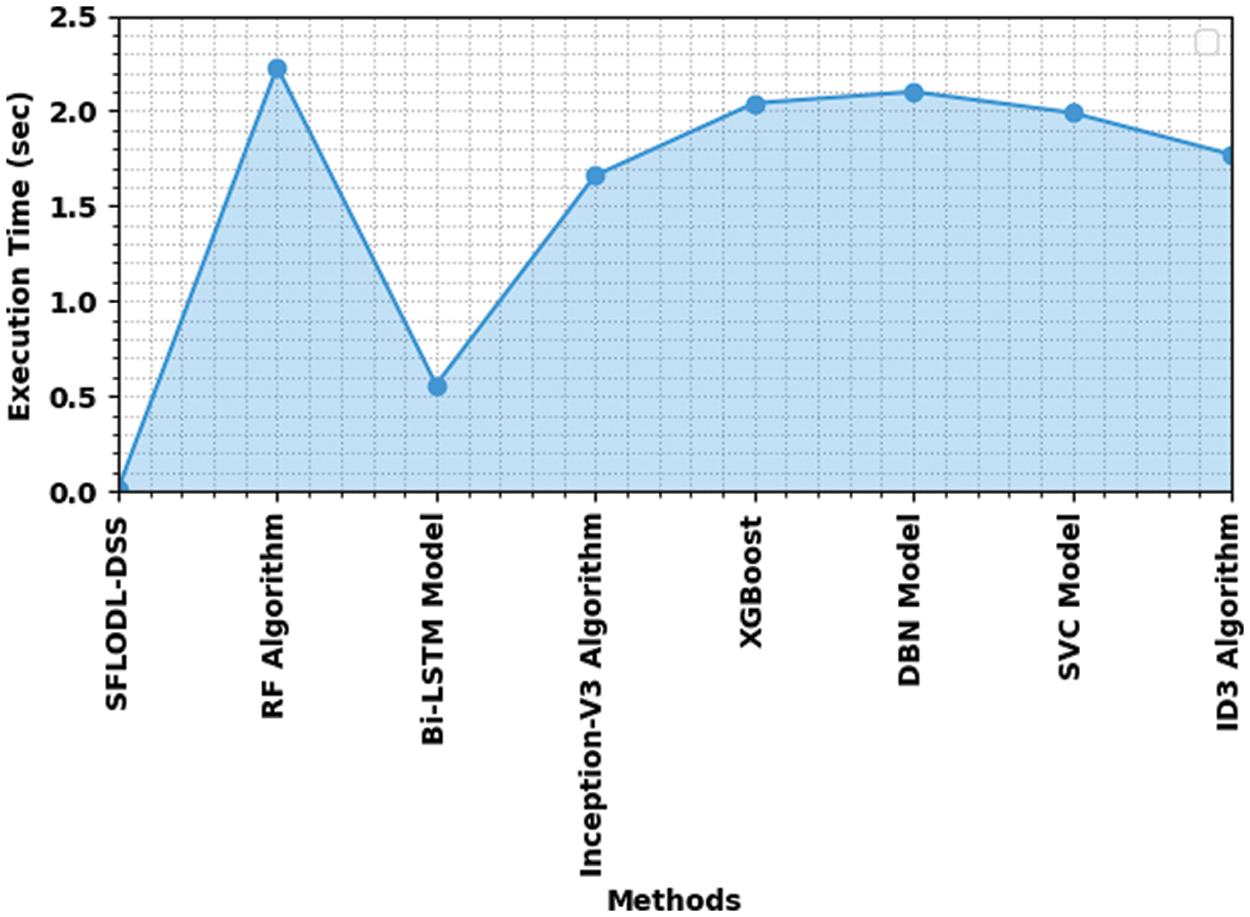
Figure 10: Comparative EXET results of SFLODL-DSS method
However, the Inception v3 and SVC models required slightly lesser EXET values such as 1.660 and 1.990 s respectively. Though the BiLSTM model demanded a reasonable EXET of 0.560 s, the proposed SFLODL-DSS model achieved a superior outcome with the least EXET of 0.012 s. Based on the analytical results and discussions made above, it is evident that the proposed SFLODL-DSS model is an excellent performer than the existing models.
In this article, an intelligent SFLODL-DSS has been designed for the diagnosis of Cardiovascular Diseases. The proposed SFLODL-DSS technique primarily incorporates the SFLO approach for feature subset election. For the purpose of classification, the AEGRU model is exploited. At the final stage, the BFO algorithm is employed for optimal fine-tuning of the hyperparameters related to the AEGRU approach. To demonstrate the enhanced performance of the proposed SFLODL-DSS technique, a series of simulations was conducted and the results established the superiority of the proposed SFLODL-DSS technique over other techniques. Thus, the SFLODL-DSS technique can be exploited as a proficient tool in the future for detection and the classification of CVD. Further, the performance of the SFLODL-DSS technique can be improved in the future using outlier detection models.
Funding Statement: The authors received no specific funding for this study.
Conflicts of Interest: The authors declare that they have no conflicts of interest to report regarding the present study.
References
1. J. P. Li, A. U. Haq, S. U. Din, J. Khan, A. Khan et al., “Heart disease identification method using machine learning classification in e-healthcare,” IEEE Access, vol. 8, pp. 107562–107, 2020. [Google Scholar]
2. N. Metawa, I. V. Pustokhina, D. A. Pustokhin, K. Shankar and M. Elhoseny, “Computational intelligence-based financial crisis prediction model using feature subset selection with optimal deep belief network,” Big Data, vol. 9, no. 2, pp. 100–115, 2021. [Google Scholar]
3. X. Yuan, X. Wang, J. Han, J. Liu, H. Chen et al., “A high accuracy integrated bagging-fuzzy-gbdt prediction algorithm for heart disease diagnosis,” in IEEE/CIC Int. Conf. on Communications in China (ICCC), Changchun, China, pp. 467–471, 2019. [Google Scholar]
4. R. P. Cherian, N. Thomas and S. Venkitachalam, “Weight optimized neural network for heart disease prediction using hybrid lion plus particle swarm algorithm,” Journal of Biomedical Informatics, vol. 110, pp. 103543, 2020. [Google Scholar]
5. A. U. Haq, J. P. Li, J. Khan, M. H. Memon, S. Nazir et al., “Intelligent machine learning approach for effective recognition of diabetes in e-healthcare using clinical data,” Sensors, vol. 20, no. 9, pp. 2649, 2020. [Google Scholar]
6. S. S. Kute, A. V. S. Madhav, S. Kumari and S. U. Aswathy, “Machine learning-based disease diagnosis and prediction for e-healthcare system,” Advanced Analytics and Deep Learning Models, pp. 127–147, 2022. https://doi.org/10.1002/9781119792437.ch6. [Google Scholar]
7. A. Saboor, M. Usman, S. Ali, A. Samad, M. Abrar et al., “A method for improving prediction of human heart disease using machine learning algorithms,” Mobile Information Systems, vol. 2022, pp. 1–9, 2022. [Google Scholar]
8. M. D. Boomija and S. V. K. Raja, “Secure predictive analysis on heart diseases using partially homomorphic machine learning model,” in Proc. of Int. Joint Conf. on Advances in Computational Intelligence, Algorithms for Intelligent Systems book series, Singapore: Springer, pp. 565–581, 2022. [Google Scholar]
9. R. Beri, M. K. Dubey, A. Gehlot, R. Singh, M. Abd-Elnaby et al., “A novel fog-computing-assisted architecture of E-healthcare system for pregnant women,” The Journal of Supercomputing, vol. 78, no. 6, pp. 7591–7615, 2022. [Google Scholar]
10. P. Kaur, R. Kumar and M. Kumar, “A healthcare monitoring system using random forest and internet of things (IoT),” Multimedia Tools and Applications, vol. 78, no. 14, pp. 19905–19916, 2019. [Google Scholar]
11. I. M. El-Hasnony, O. M. Elzeki, A. Alshehri and H. Salem, “Multi-label active learning-based machine learning model for heart disease prediction,” Sensors, vol. 22, no. 3, pp. 1184, 2022. [Google Scholar]
12. S. Nandy, M. Adhikari, V. Balasubramanian, V. G. Menon, X. Li et al., “An intelligent heart disease prediction system based on swarm-artificial neural network,” Neural Computing and Applications, 2021. https://doi.org/10.1007/s00521-021-06124-1. [Google Scholar]
13. E. K. Hashi and M. S. U. Zaman, “Developing a hyperparameter tuning based machine learning approach of heart disease prediction,” Journal of Applied Science & Process Engineering, vol. 7, no. 2, pp. 631–647, 2020. [Google Scholar]
14. X. Yuan, J. Chen, K. Zhang, Y. Wu and T. Yang, “A stable ai-based binary and multiple class heart disease prediction model for ioMT,” IEEE Transactions on Industrial Informatics, vol. 18, no. 3, pp. 2032–2040, 2022. [Google Scholar]
15. S. Sivakumar and S. Padmavathi, “An e-health decision support framework to predict the heart disorders,” International Journal of Business Information Systems, vol. 34, no. 4, pp. 594–614, 2020. [Google Scholar]
16. R. O. Ogundokun, S. Misra, P. O. Sadiku, H. Gupta, R. Damasevicius et al., “Computational intelligence approaches for heart disease detection,” in Recent Innovations in Computing, Lecture Notes in Electrical Engineering book series, Singapore: Springer, vol. 855, pp. 385–395, 2022. [Google Scholar]
17. B. Mohammadi, N. T. T. Linh, Q. B. Pham, A. N. Ahmed, J. Vojteková et al., “Adaptive neuro-fuzzy inference system coupled with shuffled frog leaping algorithm for predicting river streamflow time series,” Hydrological Sciences Journal, vol. 65, no. 10, pp. 1738–1751, 2020. [Google Scholar]
18. J. Cowton, I. Kyriazakis, T. Plötz and J. Bacardit, “A combined deep learning gru-autoencoder for the early detection of respiratory disease in pigs using multiple environmental sensors,” Sensors, vol. 18, no. 8, pp. 2521, 2018. [Google Scholar]
19. A. Vital-Soto, A. Azab and M. F. Baki, “Mathematical modeling and a hybridized bacterial foraging optimization algorithm for the flexible job-shop scheduling problem with sequencing flexibility,” Journal of Manufacturing Systems, vol. 54, pp. 74–93, 2020. [Google Scholar]
Cite This Article
 Copyright © 2023 The Author(s). Published by Tech Science Press.
This work is licensed under a Creative Commons Attribution 4.0 International License , which permits unrestricted use, distribution, and reproduction in any medium, provided the original work is properly cited.


 Submit a Paper
 Propose a Special lssue
 View Full Text
 Download PDF
 Downloads
 Citation Tools