
 Submit a Paper
 Propose a Special lssue
 Open Access
ARTICLE

EliteVec: Feature Fusion for Depression Diagnosis Using Optimized Long Short-Term Memory Network
Mepco Schlenk Engineering College (Autonomous), Sivakasi, 626005, Tamilnadu, India
* Corresponding Author: S. Kavi Priya. Email:
Intelligent Automation & Soft Computing 2023, 36(2), 1745-1766. https://doi.org/10.32604/iasc.2023.032160
Received 09 May 2022; Accepted 17 August 2022; Issue published 05 January 2023
 View Full Text
 Download PDF
Abstract
Globally, depression is perceived as the most recurrent and risky disorder among young people and adults under the age of 60. Depression has a strong influence on the usage of words which can be observed in the form of written texts or stories posted on social media. With the help of Natural Language Processing(NLP) and Machine Learning (ML) techniques, the depressive signs expressed by people can be identified at the earliest stage from their Social Media posts. The proposed work aims to introduce an efficacious depression detection model unifying an exemplary feature extraction scheme and a hybrid Long Short-Term Memory network (LSTM) model. The feature extraction process combines a novel feature selection method called Elite Term Score (ETS) and Word2Vec to extract the syntactic and semantic information respectively. First, the ETS method leverages the document level, class level, and corpus level probabilities for computing the weightage/score of the terms. Then, the ideal and pertinent set of features with a high ETS score is selected, and the Word2vec model is trained to generate the intense feature vector representation for the set of selected terms. Finally, the resultant word vector obtained is called EliteVec, which is fed to the hybrid LSTM model based on Honey Badger optimizer with population reduction technique (PHB) which predicts whether the input textual content is depressive or not. The PHB algorithm is integrated to explore and exploit the optimal hyperparameters for strengthening the performance of the LSTM network. The comprehensive experiments are carried out with two different Twitter depression corpus based on accuracy and Root Mean Square Error (RMSE) metrics. The results demonstrated that the proposed EliteVec+LSTM+PHB model outperforms the state-of-art models with 98.1% accuracy and 0.0559 RMSE.Keywords
Mental health is as vital as physical health since it can affect the individual’s performance on a daily fbasis. The mental disorder has an influence on people in all age groups at every phase of life, especially from childhood to adolescence. Also, the pandemic has caused mental distress [1] in many possible ways. Besides, the social stigma connected to mental health prevents the depressed individual from undergoing clinical therapies or medications. Suicide has emerged as a leading cause of mortality among young people, with a suicide rate of 10.5 per million individuals, or approximately eight million instances per year in absolute terms. Detecting and healing depression at the early stage [2] reduces the crucial life-threatening factors associated with it. The conventional clinical methods for depression detection involve questionnaires and interviews which will not be effective without the active participation of depressed individuals.
The modern digital era opens up new opportunities for identifying depression through medical imaging [3], social media forums, etc. Social Media enables the people to express their thoughts of depression in public or only to their interested circle. Even healthcare tracking systems can leverage social media data to determine users’ mental states based on their posts and comments for the diagnosis of depression and anxiety. However, data about mental-health-related problems uploaded on social networking sites contain unstructured and unpredictable raw forms of data. Consequently, an intelligent and smart system is required, which is capable of obtaining the most pertinent data aspects with a lower dimensionality that increases the accuracy of mental health diagnosis systems. The advent of Natural Language Processing (NLP) techniques and machine learning models motivates researchers to develop automatic and efficient depression detection systems using text content posted in social media forums. Detecting depression using social media posts in text format inflicts three intricate challenges. First, a large number of instances with high dimensional sparse features. Second, feature selection with high dimensionality is highly complex and requires more computational time and space. Third, tuning the parameters of the machine learning models developed for depression prediction.
To address these challenges, the present work aims to design a unified depression diagnosis system based on the Long Short-Term Memory network (LSTM) network with the Population reduced Honey Badger optimizer (PHB) to identify depression related tweets efficiently and accurately. The system blends the feature scores estimated using a novel Elite Term Score (ETS) and feature vectors extracted employing Word2Vec to form a rich feature vector representation. The findings show that the proposed system properly manages unstructured data and improves the depression prediction ability. The prime contributions of the proposed work are listed as follows:
1. Introduced a novel feature selection method based on the Elite Term Score (ETS), a mixture of tweet level, class level, and corpus level probabilities to reduce the dimensionality and select the prominent set of word features from the Twitter corpus.
2. Performed feature fusion to enrich the feature representation by combining the ETS score of words and semantic word vectors produced by the Word2Vec model called EliteVec.
3. Incorporated population reduction strategy into Honey Badger optimization algorithm to reduce the computational complexity by minimizing the population size in progressive iterations thereby enhancing the exploration and exploitation ability of the algorithm.
4. Developed an optimized LSTM model with PHB algorithm for tuning the hyperparameters of the network.
5. Carried out extensive experimentation on the proposed system and the results are compared with the other state-of-art approaches related to depression analysis. The exploratory results reveal that the combined feature vectors (EliteVec) and optimized LSTM tend to improve the overall performance of the network with an accuracy of 98.1% and a Root Mean Square Error of 0.0559.
The remaining content of the paper is organized as follows: Section 2 discusses the recent research works carried out for depression diagnosis based on the content from social media. Section 3 provides the architecture and a detailed description of the components included in the proposed system. The experimental results and analysis are furnished in Section 4. Finally, Section 5 concludes the present research by stating the findings and future direction of the proposed system.
This section presents the systematic survey of depression detection utilizing text corpus collected from social media including a brief review on dimensionality reduction.
Feature Selection (FS) is an inevitable and significant task in dimensionality reduction, which contributes greatly to improving the performance of the model. The primary purpose of feature selection is to remove the noisy, redundant, and irrelevant features and selecting the optimal and relevant features from the high-dimensional sparse features of social media posts. The filter-based feature selection approach arranges the features in the order of preference or importance based on the score values computed using a specific formula or rule. Then, the features placed in the top positions are used for model training. For instance, Chi-squared (CHI2) [4] and Discriminating Power Measure (DPM) [5] are well-known FS approaches in the literature. In [4], the authors introduced Distinguishing Feature Selector (DFS) method for FS. The DFS method gives higher scores to distinctive features whereas the lower scores are given to insignificant features based on some criteria set in advance. The authors of [6] proposed an efficient FS method called Normalized Difference Measure (NDM) which assigns scores to features based on relative document frequency. The authors also proposed a distinct FS technique called Min Max Ratio (MMR) [7] which can find mini feature subsets with more useful information even in the highly skewed corpus. In [8], the authors presented the EFS method, which utilizes both class and corpus level probabilities to compute the feature score. However, the proposed ETS method differs from the aforementioned approaches by combining the document/instance level, class level, and dataset level probabilities to compute the significance of the features.
2.2 Depression Diagnosis Using Social Media Content
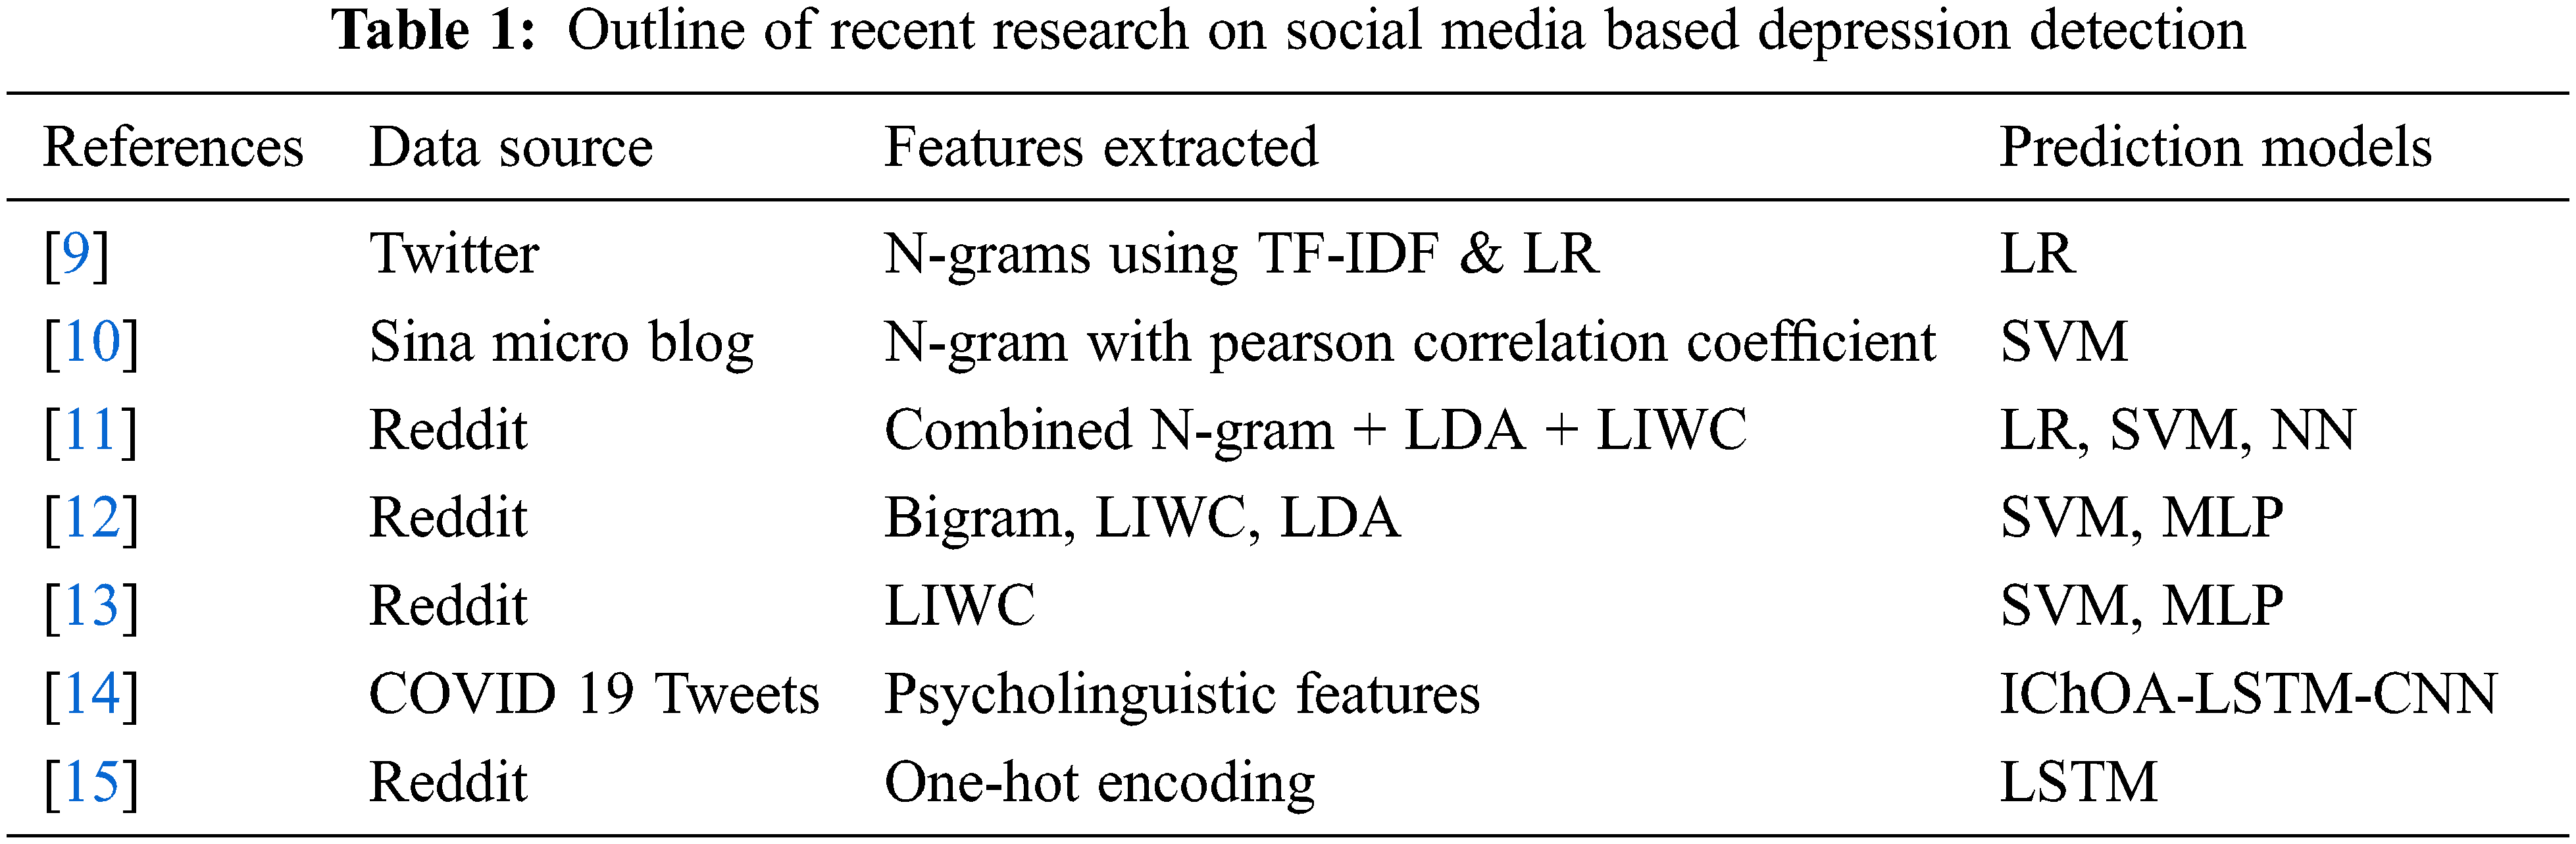
Social media mining facilitates the development of automated sentiment analysis applications and depression recognition systems. A depression detection system using Twitter data is introduced in [9], where the text format for the emoticons is used to enrich the text data. For extracting the features n-gram combined with TF-IDF factor is applied and sentiment analysis mechanism is employed with Logistic Regression (LR) classifier. Support Vector Machine (SVM) based machine learning model for depression diagnosis using Sina Micro-blog data is presented in [10]. The authors of [11] studied the problem of anxiety disorder using personal stories posted on the Reddit platform. The purpose of the study is to discriminate the anxiety related content based on the features extracted using N-gram modeling, Latent Dirichlet Allocation (LDA) topic modeling, embedding model, and Linguistic Inquiry and Word Count (LIWC) features. The feature vectors generated from Reddit texts contributed higher performance in comparison with Twitter data. This is due to the fact that the size of Twitter data is shorter than Reddit text data. This model has a high impact on the size of the data. In [12], the authors proposed a depression detection technique using NLP and machine learning techniques by merging LIWC, LDA, and bigram features. The model utilized SVM and multilayer perceptron (MLP) algorithms for classification. A hierarchical model for postpartum depression prediction, making use of textual posts shared on the Reddit forum is proposed in [13]. The model extracted the features utilizing the LIWC dictionary and the Least Absolute Shrinkage and Selection Operator (LASSO) technique. Then, the extracted features are used to classify the posts using supervised learning algorithms. A hybrid Convolutional Neural Network (CNN)-LSTM mode to identify depression from COVID 19 tweets using Chimp Optimization Algorithm was proposed by [14]. In [15], the authors proposed a deep learning model to identify the depression related symptoms from the Reddit corpus. The system employed the one-hot encoding technique to extract features and an LSTM model is constructed to predict depression.
Table 1 provides a summary of the literature works focused on mental health diagnosis using the textual content available in social media forums. According to the literature, the researchers devised various combinations of machine learning and deep learning models with a different mixture of feature extraction and word embedding techniques to attain superior results. But still, a reliable approach is required to effectively extract robust features with reduced dimensionality from a vast text corpus gathered from social media sites while maintaining improved accuracy. The proposed work intends to fill the literature gap with three important aspects. Firstly, it uses a novel probabilistic filter-based approach named ETS to reduce the dimensionality based on the feature scores. Secondly, it extracts the semantic feature embeddings and combined them with the feature scores obtained using the ETS method to form a rich and deep representation of feature vectors for prediction. Finally, it constructs an optimized LSTM network with the help of the PHB optimizer to improve the prediction accuracy.
This section presents the architecture designed to identify depressive content shared on social media forums like Twitter based on LSTM based deep learning approach. Fig. 1 depicts the conceptual framework of the proposed LSTM-PHB based depression detection model using a fusion of Elite Term Score and Word2Vec feature vectors. The working flow of the model comprises Tweet preprocessing, data splitting, feature extraction, feature fusion, LSTM model training with PHB optimizer, and depression prediction. The explanation of these processes is elucidated in the subsections.
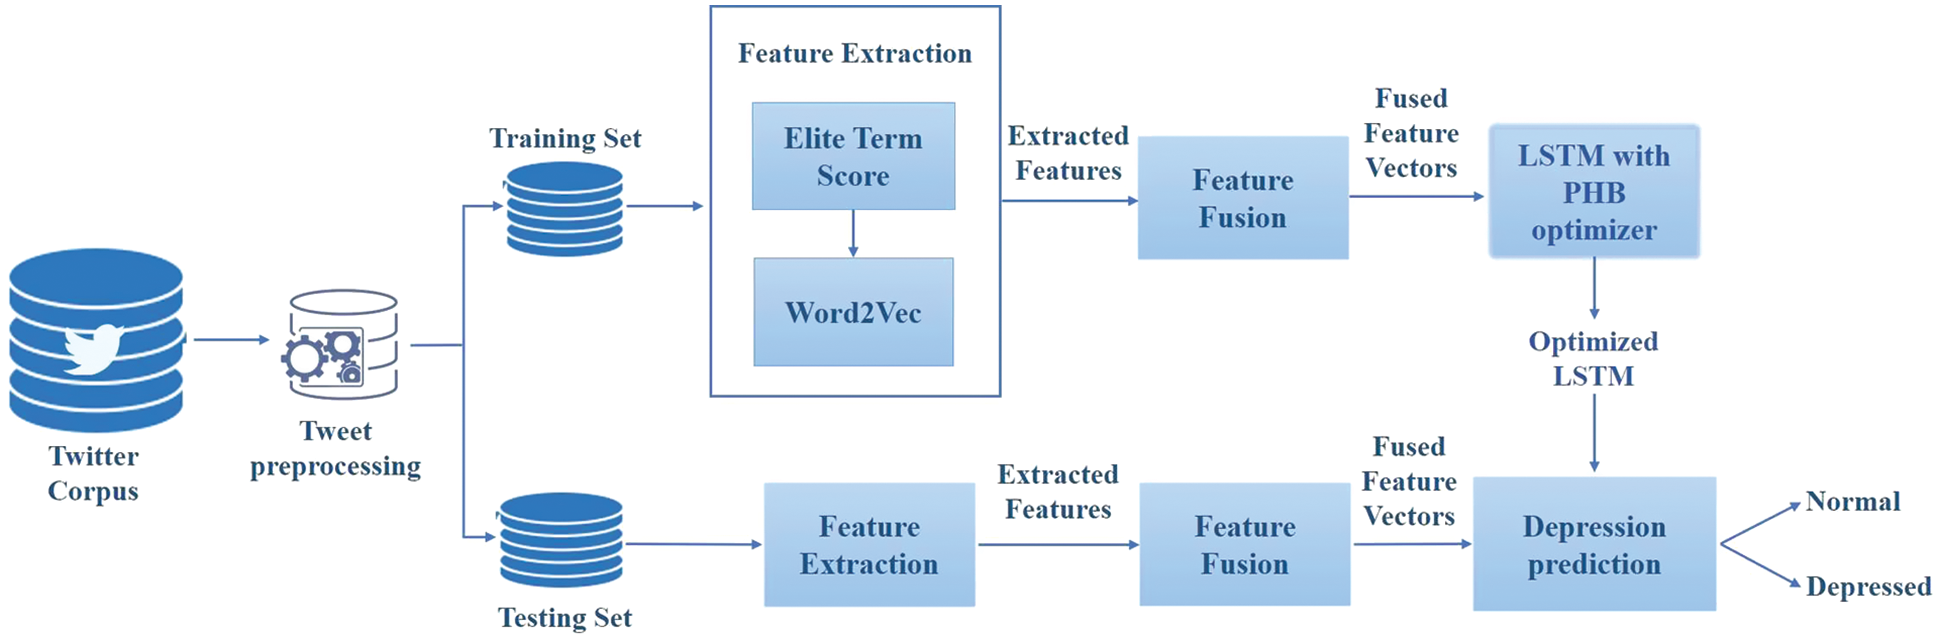
Figure 1: The schematic diagram of the proposed intelligent depression detection framework
The proposed depression detection model is trained on two different Twitter corpora: Sentiment 140 corpus and Twitter Depression corpus. Sentiment 140 corpus is a collection of 1.6 million tweets extracted using the Twitter API with equal distribution of 0.8 million depressive and non-depressive tweets. The tweets are tagged as 0 and 4 to indicate the non-depressive and depressive content. Twitter Depression corpus contains 7,769 tweets collected from the users who are depressed and not depressed. It contains 3,082 depressive tweets and 4,687 non-depressive tweets. Both the datasets are open access twitter corpus available in the Kaggle repository. Figs. 2 and 3 exhibits the word clouds of the most frequently occurring words in the depressive and non-depressive tweets of the Sentiment 140 and Twitter depression corpus respectively.
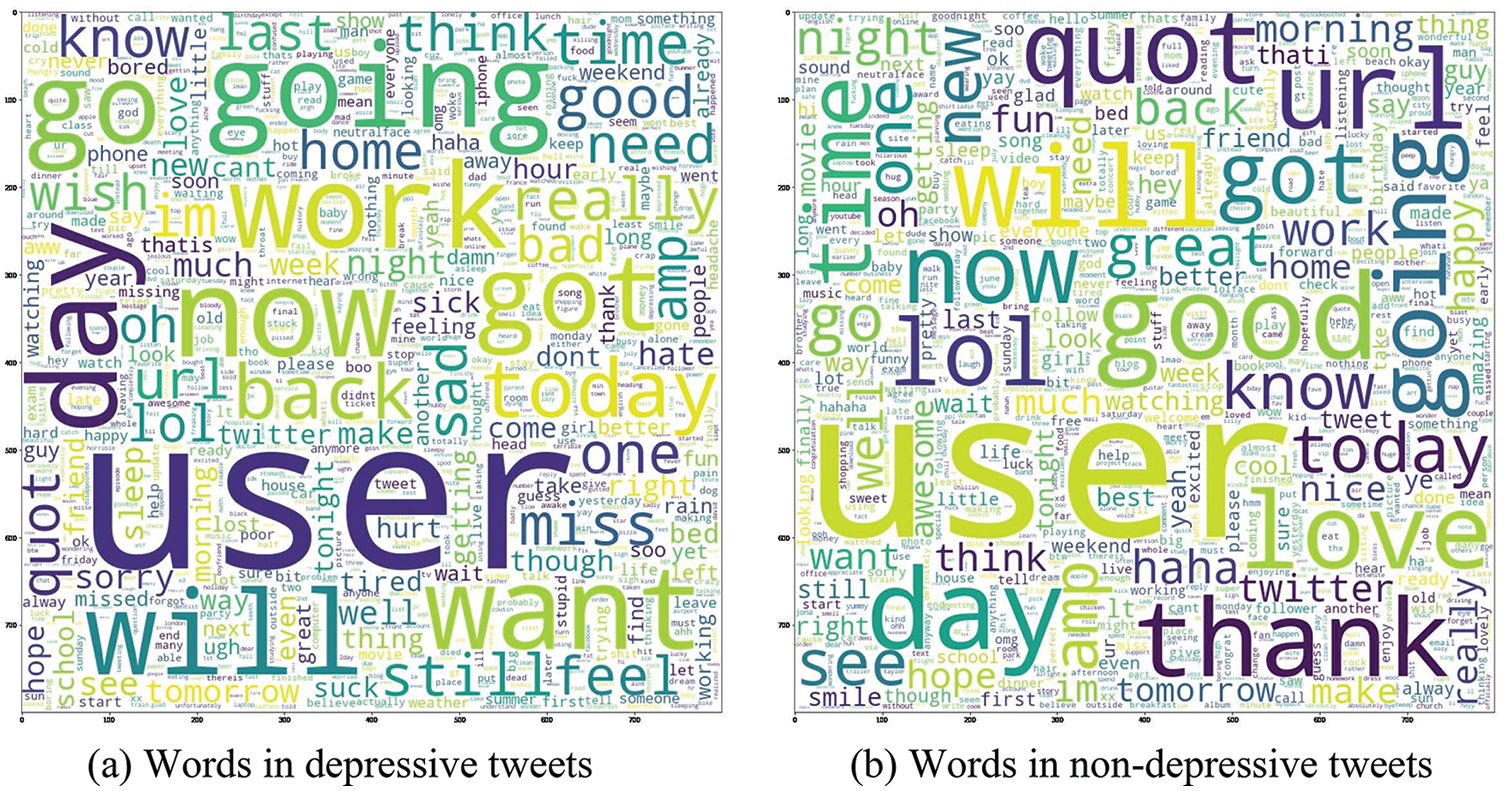
Figure 2: Wordclouds of sentiment 140 corpus
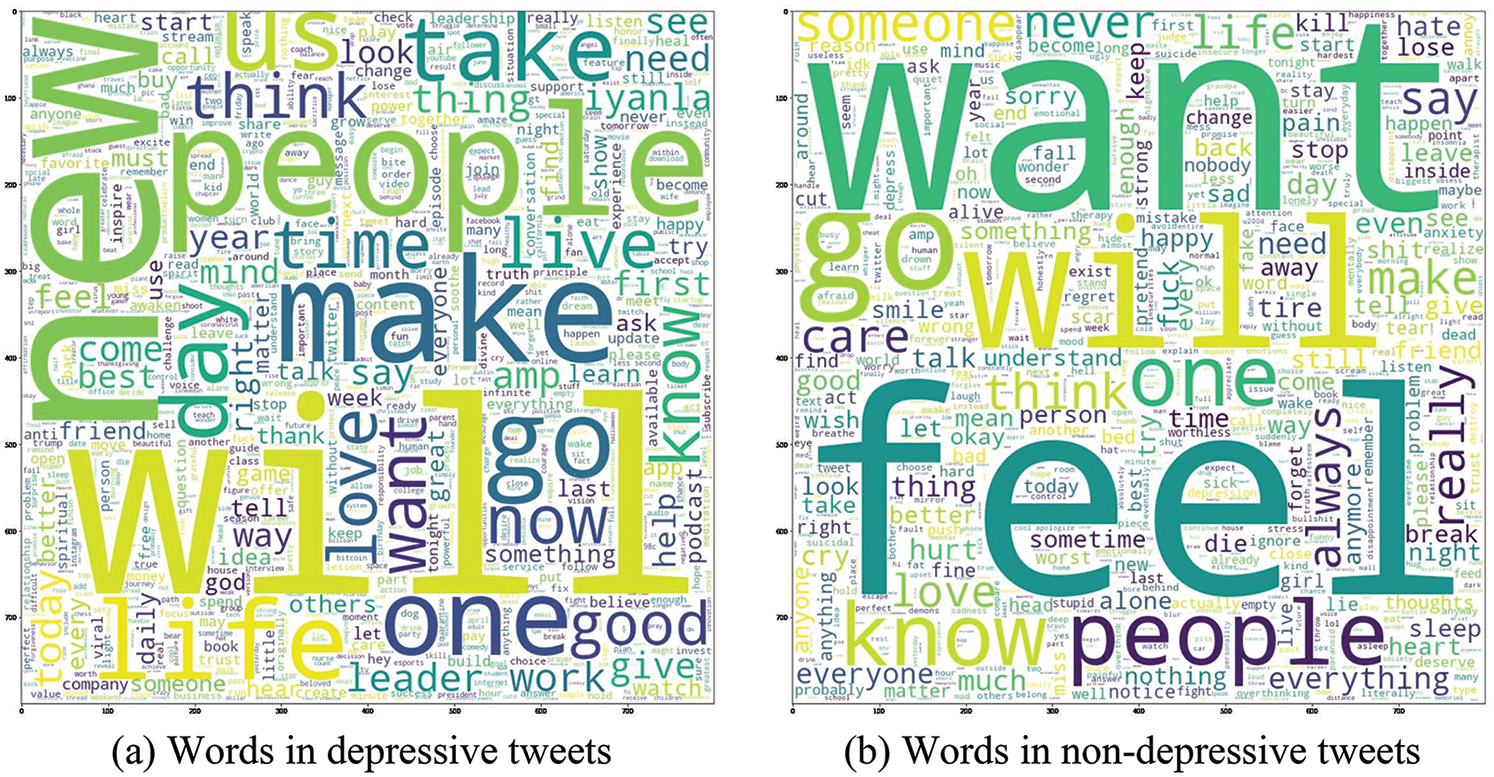
Figure 3: Wordclouds of twitter depression corpus
The raw tweets collected from Twitter are exceptionally unstructured and contain more sparse, redundant, and disposable features such as URLs, hashtags, mentions, symbols, emojis, etc. The Natural Language Processing (NLP) models cannot directly replace or transform those raw data. So, tweet preprocessing is an obligatory task in NLP applications which cleans up the tweets to preserve the necessary information for training the model. And, it transforms the tweets into a machine-understandable format to boost the performance of the deep learning model. In the proposed depression detection model, the preprocessing steps are performed as per the following sequential order:
1. Lowercase conversion: Each tweet is converted into lowercase to maintain the case consistency.
2. Hashtags, URL, and Username removal: The hashtags start with the symbol ‘#’, website links beginning with ‘http’, ‘https’ or ‘www’, and the usernames beginning with the ‘@’ symbol (e.g: @Twinbird) are discarded from the tweet.
3. Consecutive character substitution: The words with three or more consecutive characters are replaced by two characters (e.g: ‘guddd’ to ‘gudd’).
4. Emojis conversion: The actual emojis and emoticons are replaced by their corresponding English word using the emoji package and emoticon dictionary respectively.
5. Contractions replacement: The contractions are replaced with their elaborated form (e.g: don’t to do not).
6. Removal of numbers, punctuations, and special characters: The characters other than alphabets are removed and replaced by a space.
Once the tweets are pre-processed, the feature extraction process is applied to convert the raw input tweets into a comprehensible set of words/features. In this paper, two dis-tinct features are extracted focusing on the probabilistic information and semantic information respectively. The first feature emphasizes dimensionality reduction using a novel probabilistic model (Elite Term Score) to prioritize and selects the pre-eminent set of word features. Whereas the semantic word embedding for the chosen features is generated using the Word2Vec model trained on the Twitter corpus. Then, the ETS score and the semantic vectors are merged to enrich the prediction quality.
As the curse of dimensionality is obligatory in NLP applications, a new feature selection method called Elite Term Score (ETS) is introduced to reduce the feature dimensionality and increase the depression prediction accuracy. The proposed ETS computation covers the tweet level, categorical level, and corpus level probabilities to estimate the importance of unique terms/words in the Twitter corpus (T). Based on the three probabilistic values, a word w is considered highly significant if it satisfies the following conditions.
1. Tweet level significance: If all the tweets containing the word w belong to a particular category
2. Class level significance: If all the tweets labeled under a particular category (
3. Corpus level significance: If the category
To satisfy the above-specified conditions, the ETS is formulated as given in Eq. (1) where L represents the total number of class labels in the corpus. The description of the notations used in the equation is given in Table 1.
Table 2 provides the interpretations of the notations used in Eq. (1). The first part of Eq. (1) computes the word score based on categorical and tweet level probabilities. The word w is given a high score if it is present in the tweets relevant to a particular category (
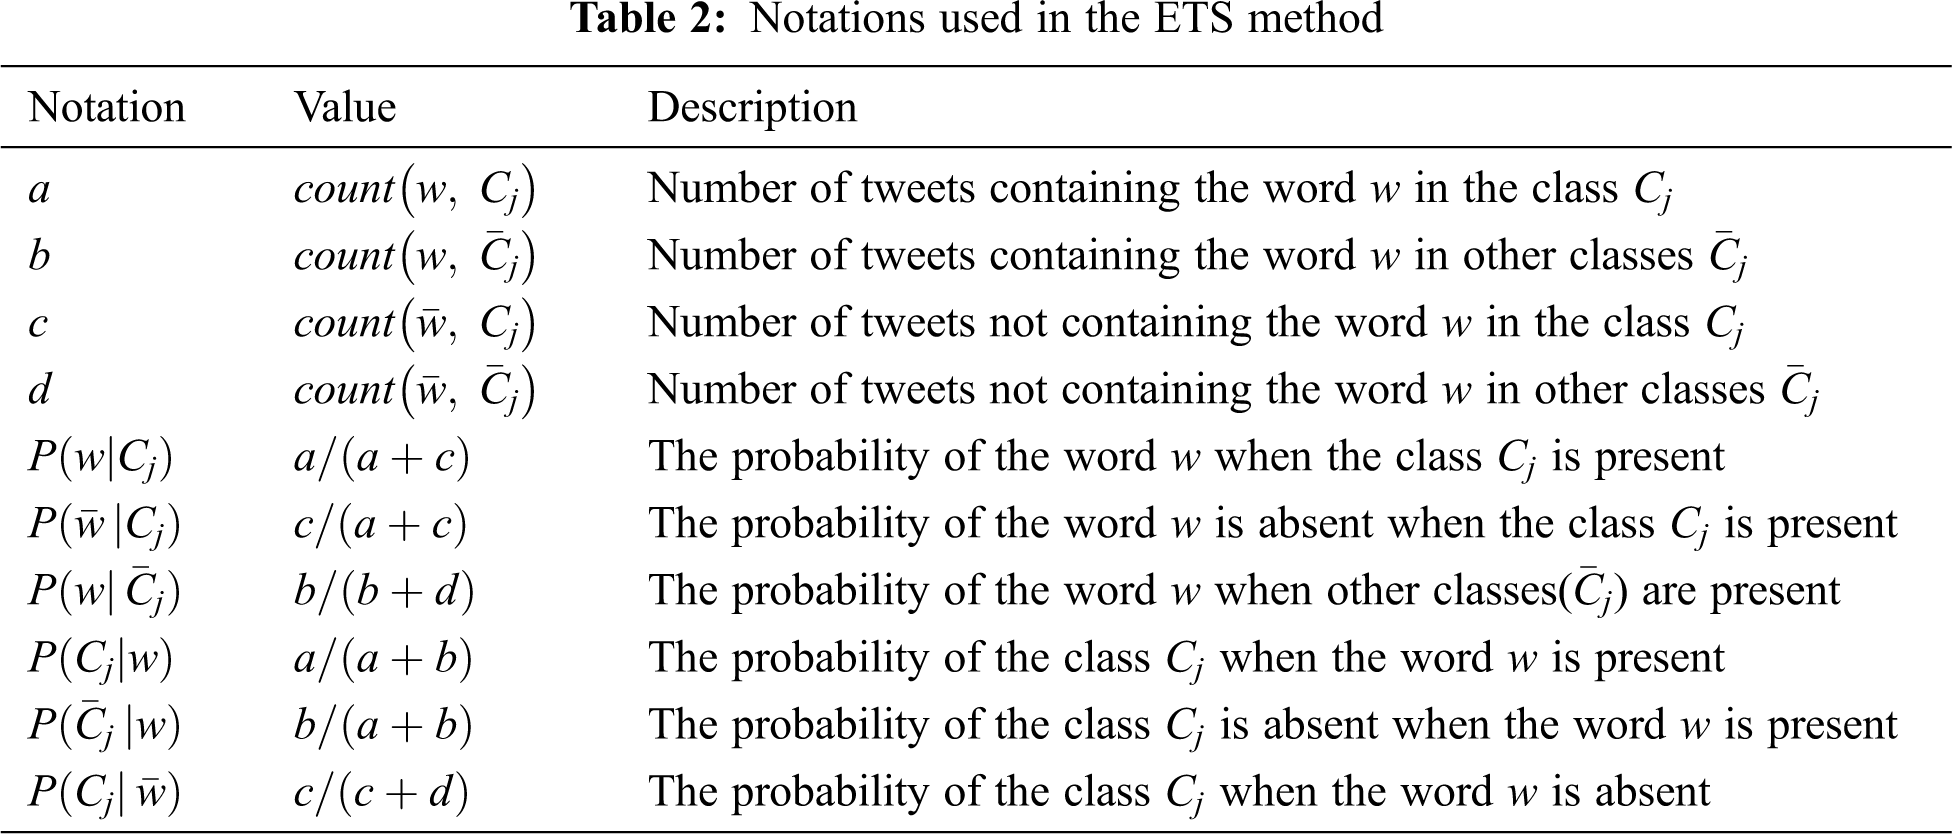
The corpus level score for w is computed using the second part of the formula (1). A high score is given to w if the probability of
The score computed from both parts of the formula ranges from 0 to 1. So, the final score range is also
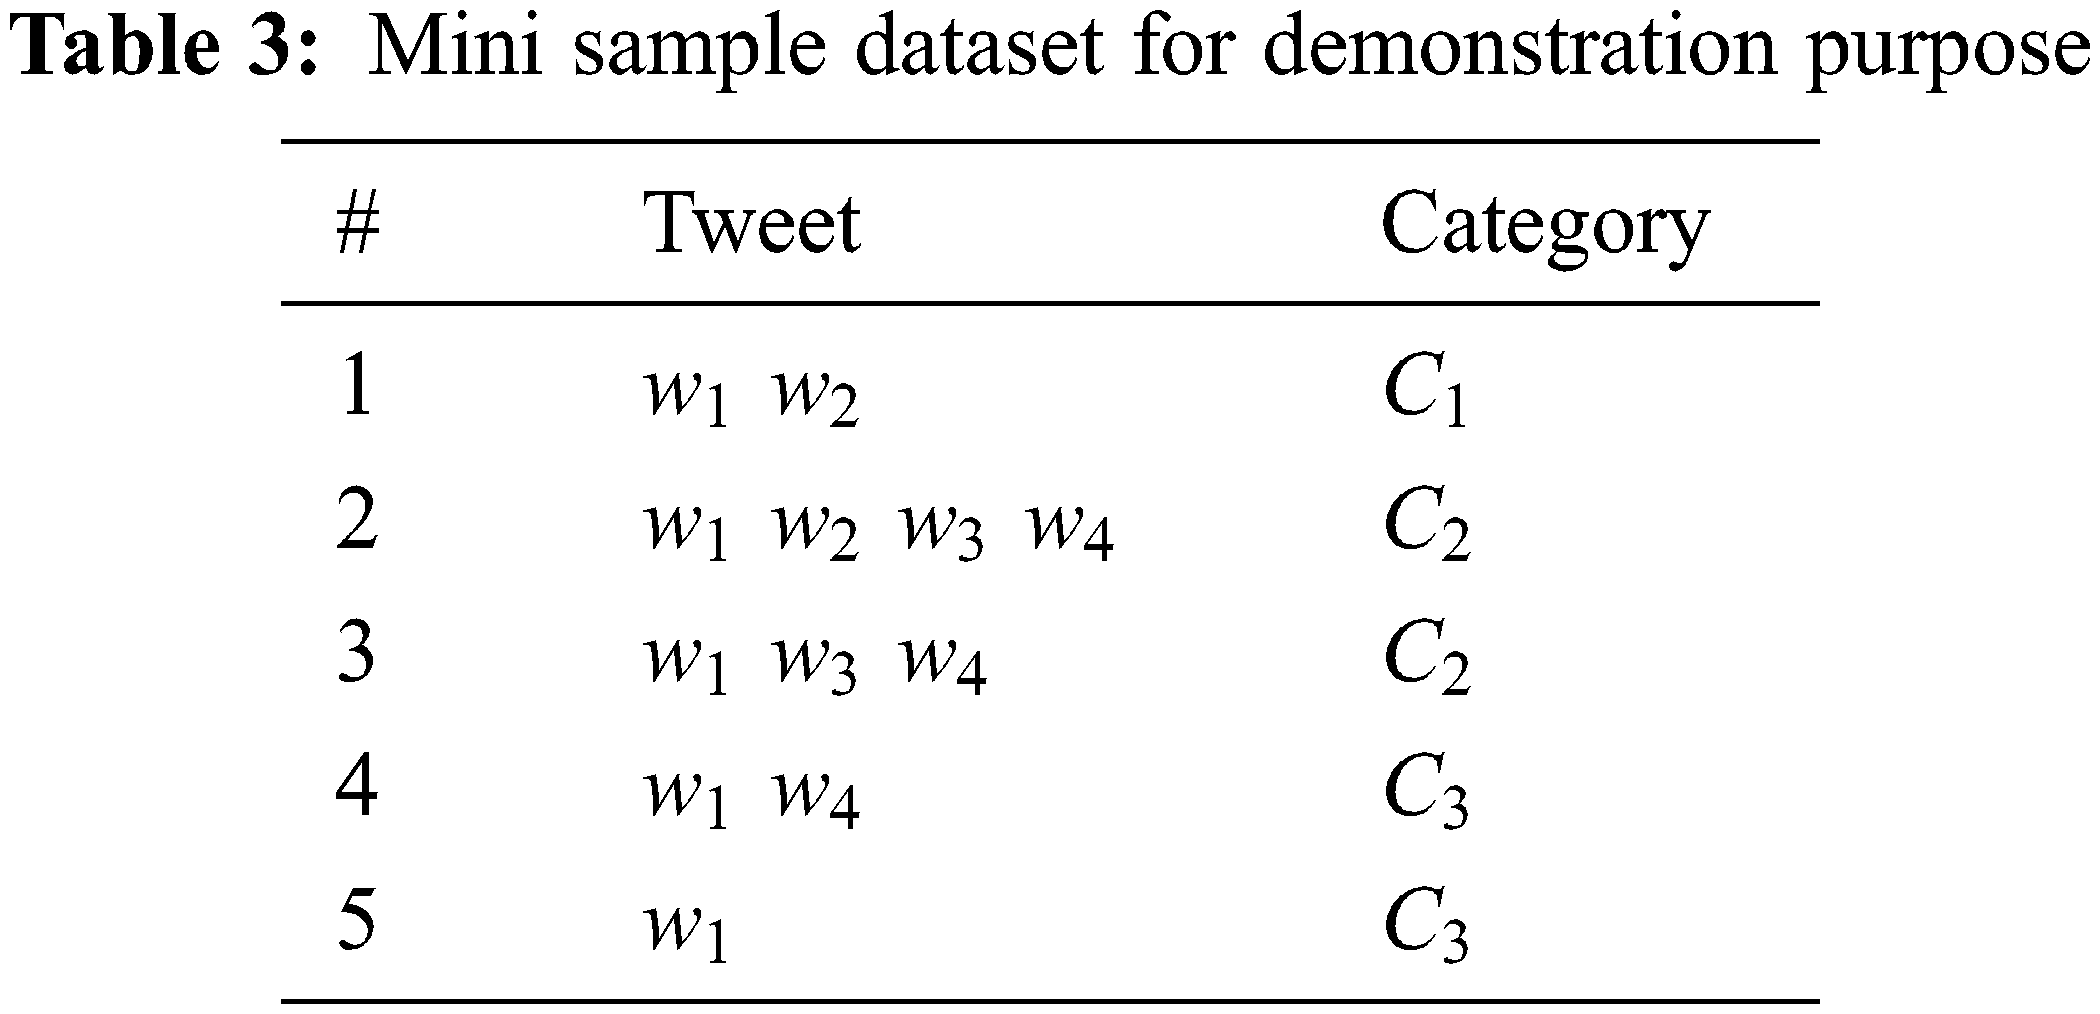
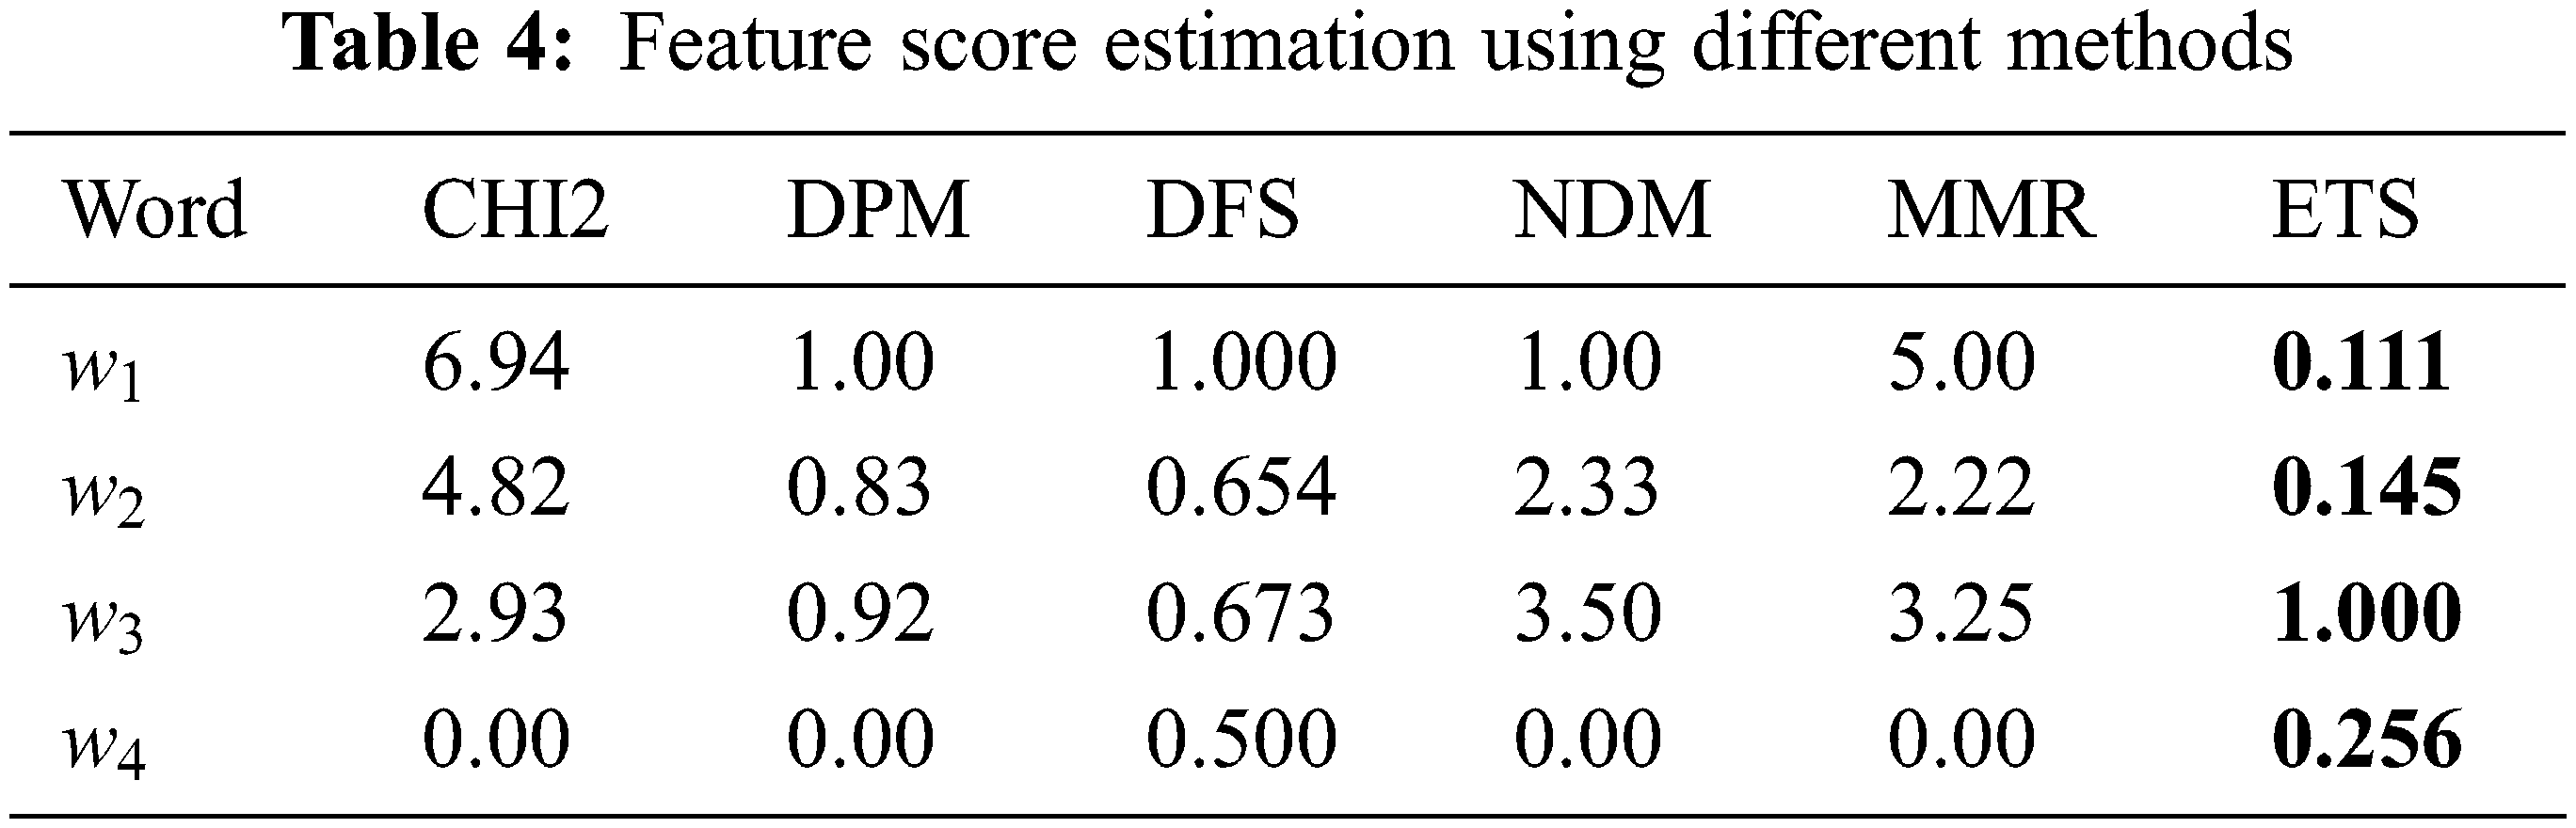
Similarly, the scores for other words
3.3.2 Fusion of ETS and Word2Vec
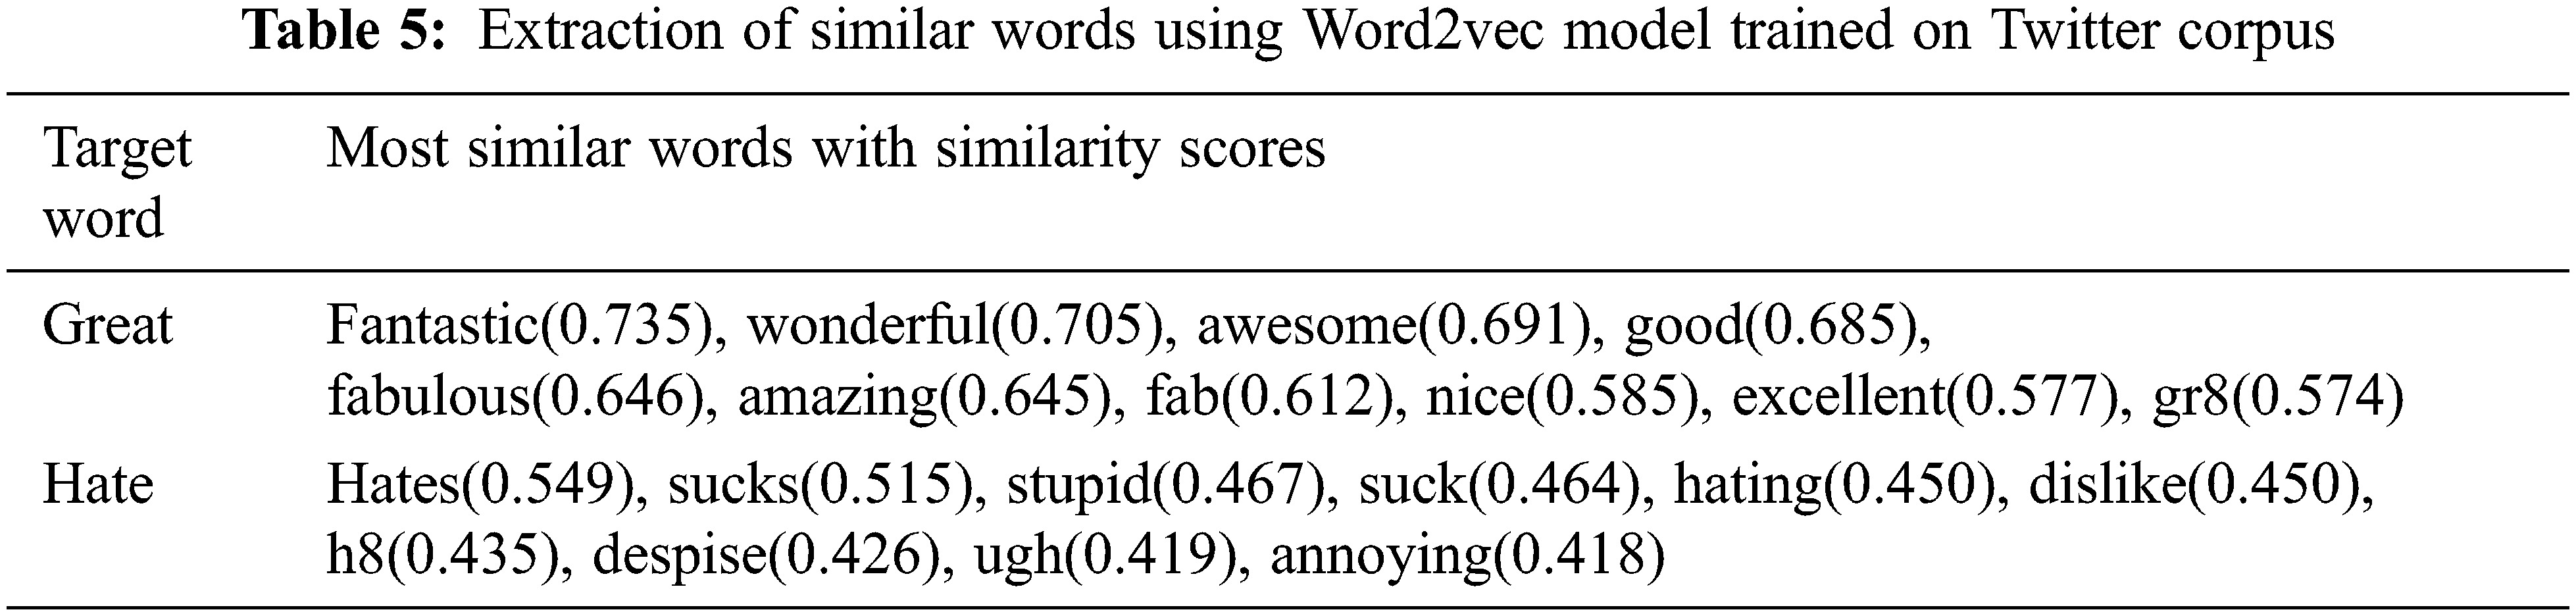
To retain context-level semantic information of the tweets, Word2Vec is combined with the proposed probabilistic method to generate more meaningful word feature vectors. In this work, the Gensim Word2vec model is applied to extract the syntactic and semantic relationships of words and encode them into a deep vector representation. The word features extracted by the ETS method are inputted to the Word2vec model to obtain the equivalent semantic word vectors. The exponential values generated by the model are hard to interpret, but it produces analogous vectors for words with similar meaning. The words conveying similar meaning to the target word can be extracted using the trained Word2vec model and is exemplified in Table 5. The strength of the word embedding model resides in generating pertinent word vectors with low dimensionality. Once the semantic word vectors are extracted for the words selected by the ETS method, the next step is to combine the ETS score and Word2Vec feature vectors to create the high-quality word vectors for training the proposed depression detection model. The features are fused by multiplying the ETS score of a word with the corresponding word vector generated by the Word2Vec model to create the final fused feature vector as given in the equation, where
3.4 Prediction Using Optimized LSTM Network
In the proposed work, an enhanced version of the Honey Badger (HB) optimization algorithm with a population reduction strategy called PHB optimizer is introduced to optimize the training parameters of the LSTM network dynamically based on the global convergence. The LSTM network driven by the PHB optimizer is then used for the prediction of depressive tweets. The succeeding subsections neatly present the comprehensive description of the PHB algorithm and the optimized LSTM network.
3.4.1 HB Algorithm with Population Reduction Strategy (PHB)
The Honey Badger algorithm [16] mimics the foraging nature of the honey badger. The honey badger searches for the food in either of the two modes. The first mode is called digging mode, in which it uses its sniffing power to approach the location of the prey. Once it reached the target location, it moves around in the Cardioid motion to find the exact location for digging and capturing the prey. The other mode is called honey mode, in which it follows the Honeyguide bird to reach the beehive directly. Conceptually, the peculiar hunting strategy of honey badger is formulated as a meta-heuristic approach with the exploration phase (digging phase) and exploitation phase (honey phase) for solving global optimization problems. The robustness of meta-heuristic approaches relies on population size, convergence factor, exploration and exploitation ability, etc.
Population size is one of the most crucial parameters of any optimization algorithm and it cannot be predetermined. The population size should be large to explore the search space intensely. At the same time, the population size should be reduced to improve the model performance and to exploit rich and strong solutions for the problem under consideration. The authors of [17] introduced a non-linear approach for population reduction to minimize the population count gradually with respect to the number of function evaluations. Based on the approach, the equation mentioned in (3) is used for population reduction.
In the above equation,
• In the early stages of optimization, it drops out the unviable solutions to a great extent without influencing the exploration ability.
• During the later stages, it boosts the exploitation ability of the algorithm by the slight rejection of unviable solutions.
• The actual computational complexity of the HB algorithm is
The mathematical procedure of the HB algorithm includes determining the population count (number of honey badgers) and initializing the population solutions (positions of honey badgers), estimating and updating the key parameters as given in the following steps.
Step 1: Population Initialization
Determine the minimum and the maximum number of honey badgers
where
Step 2: Intensity Computation
Intensity is associated with the enticing smell of the prey which is defined by the distance between the
where S denotes the strength of the smell which leads to the target prey location and
Step 3: Density Factor Calculation
The smooth transition from exploration to exploitation is controlled by the density factor (
where t is the current iteration number and
Step 4: Evading local optimum
The HB algorithm adjusts the search direction using a flag variable ‘
Step 5: Updating candidates’ positions
The positions of each honey badger are updated based on the two different stages: the digging stage and the honey stage. The position update using the ‘digging phase’ or ‘honey phase’ is determined randomly as specified in the following Eq. (8).
Step 5.1: Digging (Exploration) stage
In the stage of digging, the honey badgers move in Cardioid motion as given in Eq. (9).
where
Step 5.2: Honey (Exploitation) Stage
In this stage, the honey badger reaches the beehive with the help of the honeyguide bird as imitated in Eq. (10).
where
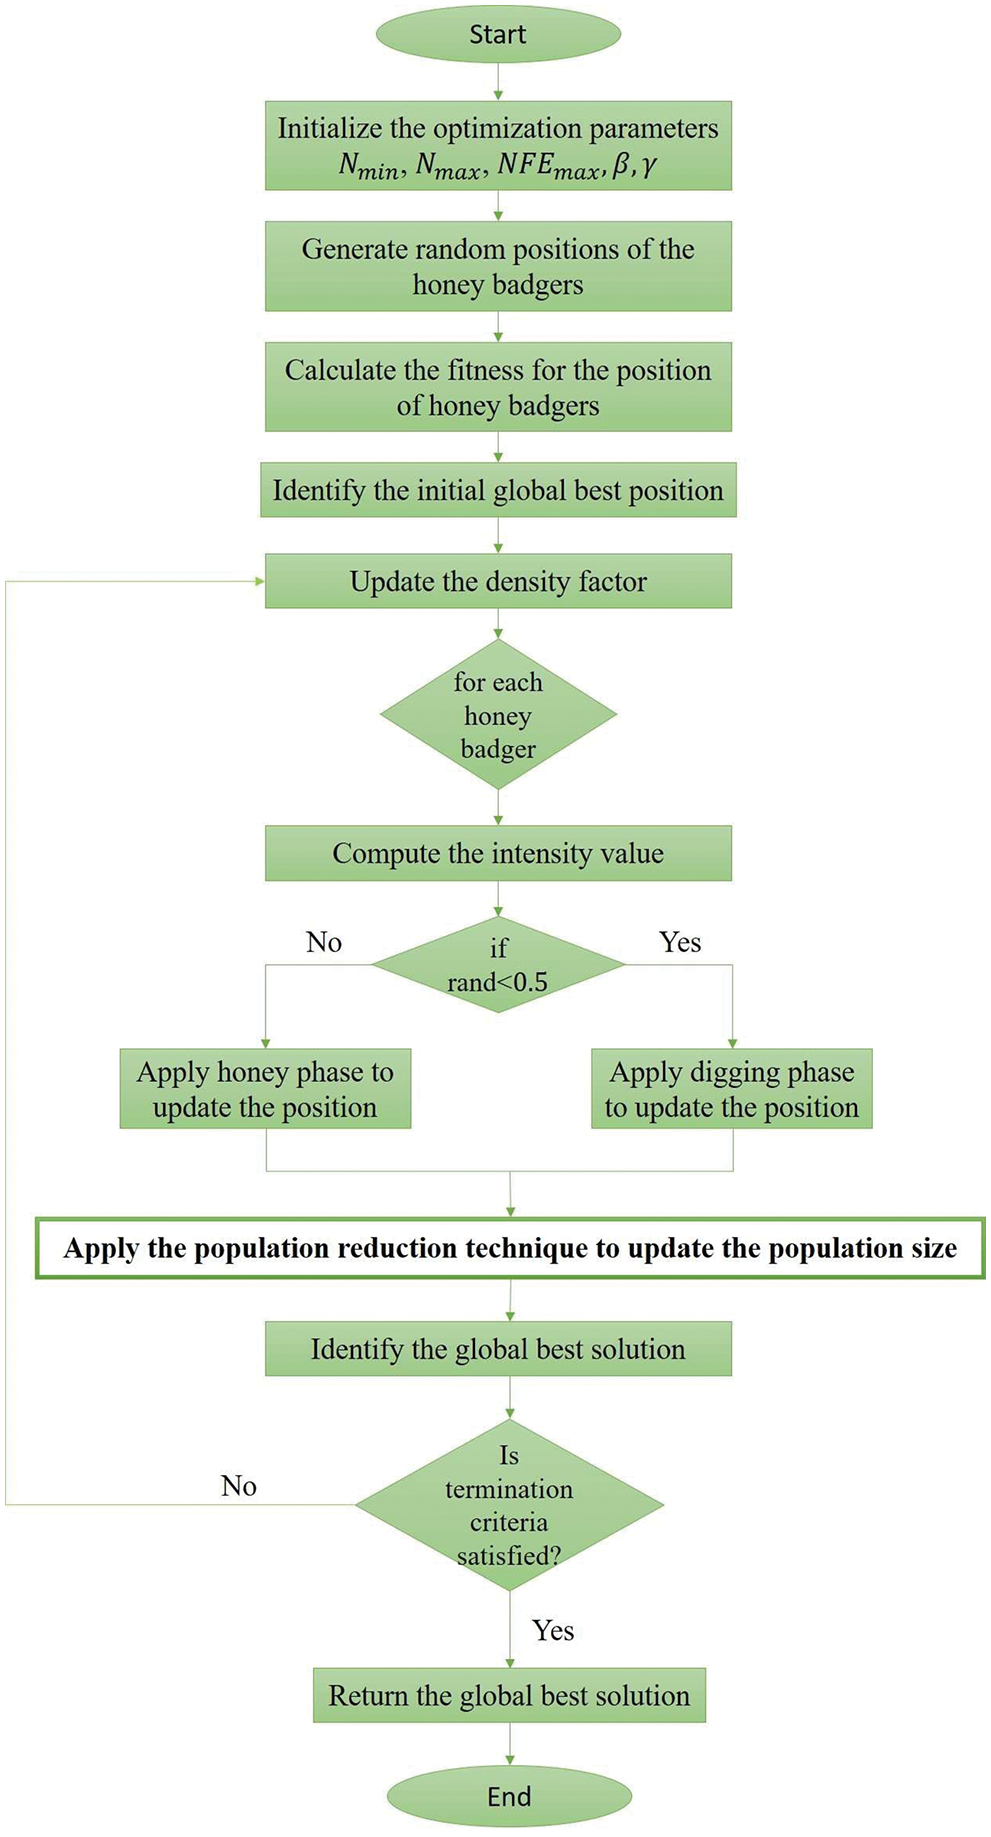
Figure 4: The flowchart of the honey badger optimization with population reduction strategy
Recurrent Neural Network (RNN) is a genre of Artificial Neural Network (ANN) explicitly designed for processing time series or sequential data. RNNs are capable of capturing and retaining information from the input sequence patterns of arbitrary size. It enables the network to control the current input and output based on the information gained from prior inputs. But RNNs faced the vanishing gradient problem, that inhibits the learning of dependencies from lengthy data sequences. To tackle this problem, the LSTM network, a notable variant of RNN was introduced to learn long-term sequential relationships more accurately than the conventional RNN models. A standard LSTM network comprises multiple memory units (cells) connected sequentially. The simplified version of LSTM network is illustrated in Fig. 5 with the ‘
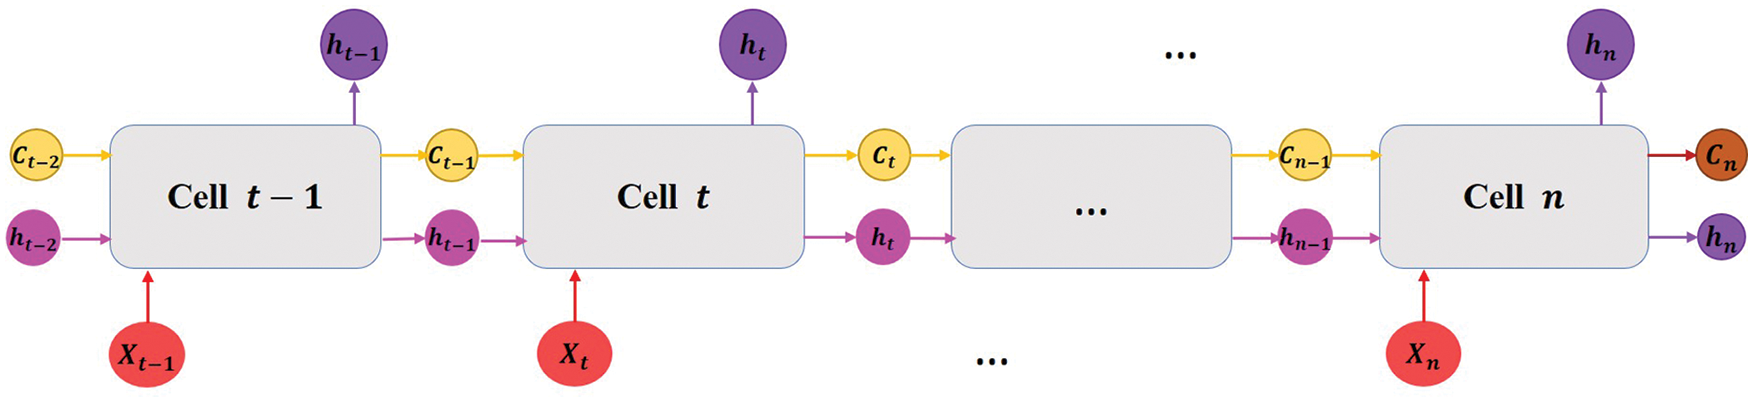
Figure 5: An illustrative diagram of a standard LSTM network
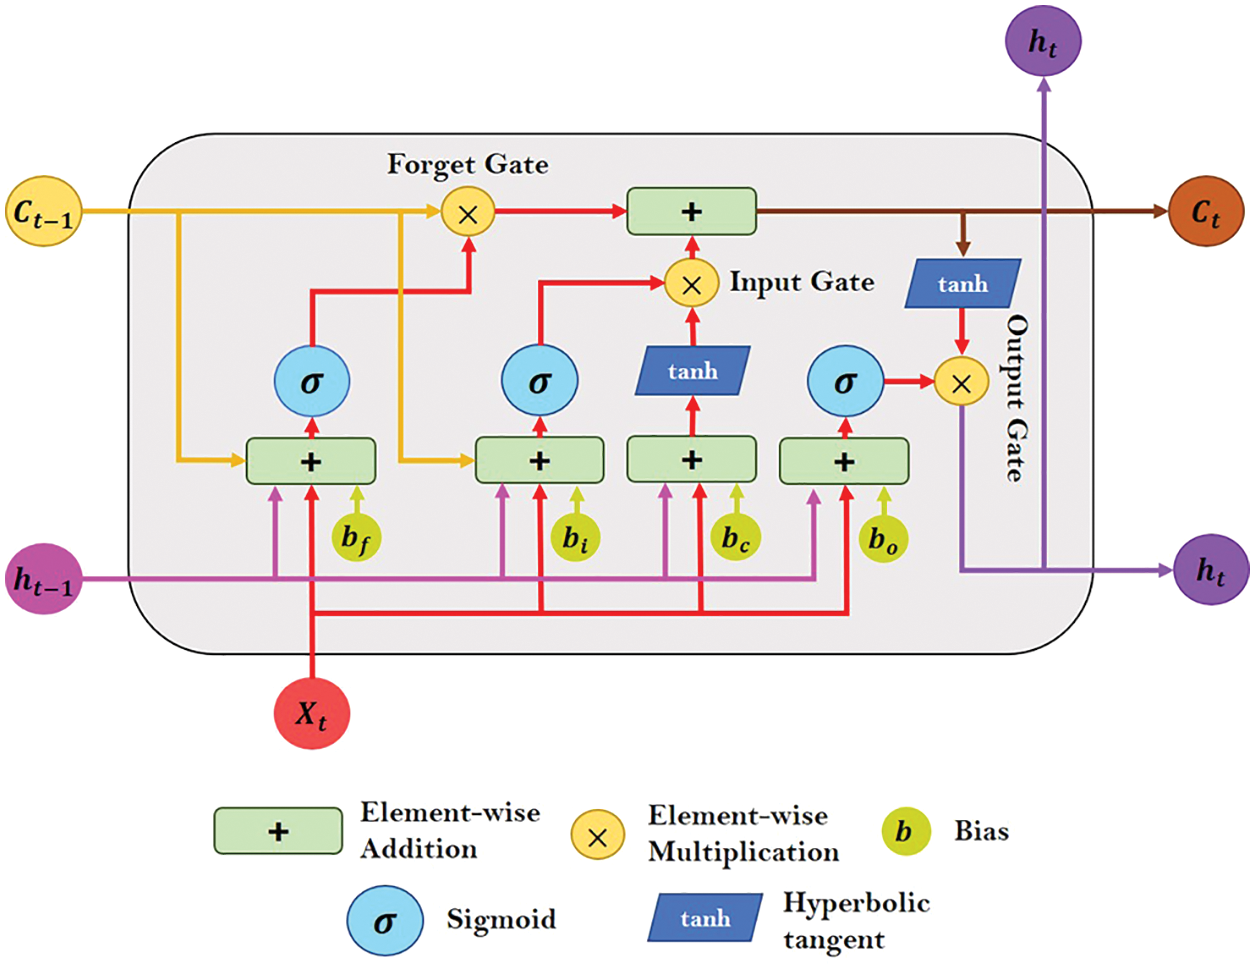
Figure 6: The internal layout of an LSTM cell/unit
To identify depressive tweets using the PHB-LSTM network, the fused feature vector (
The forget gate determines which information is important and to be remembered and which may be disregarded based on Eq. (11). The sigmoid function is used to process data from the current input
where
To update the cell state, the input gate carries out two processes. Firstly, the second sigmoid function receives the current input word feature vector
The input gate and forget gate have provided the network with sufficient information to decide on and save the information from the new state in the current cell state. The forget vector
where
The output gate holds the information about the prior inputs and decides the value of the next hidden state. The last sigmoid function of the cell receives the values of the current and the prior hidden state vectors. The
The hidden state and the newly created cell state are then passed over to the subsequent time step. The forget gate then selects the pertinent information from the earlier stages, the input gate decides determines the related information from the current state, while the output gates confirm the next hidden state. The hidden state vector in the final cell is used to predict whether the textual input indicates depression or not.
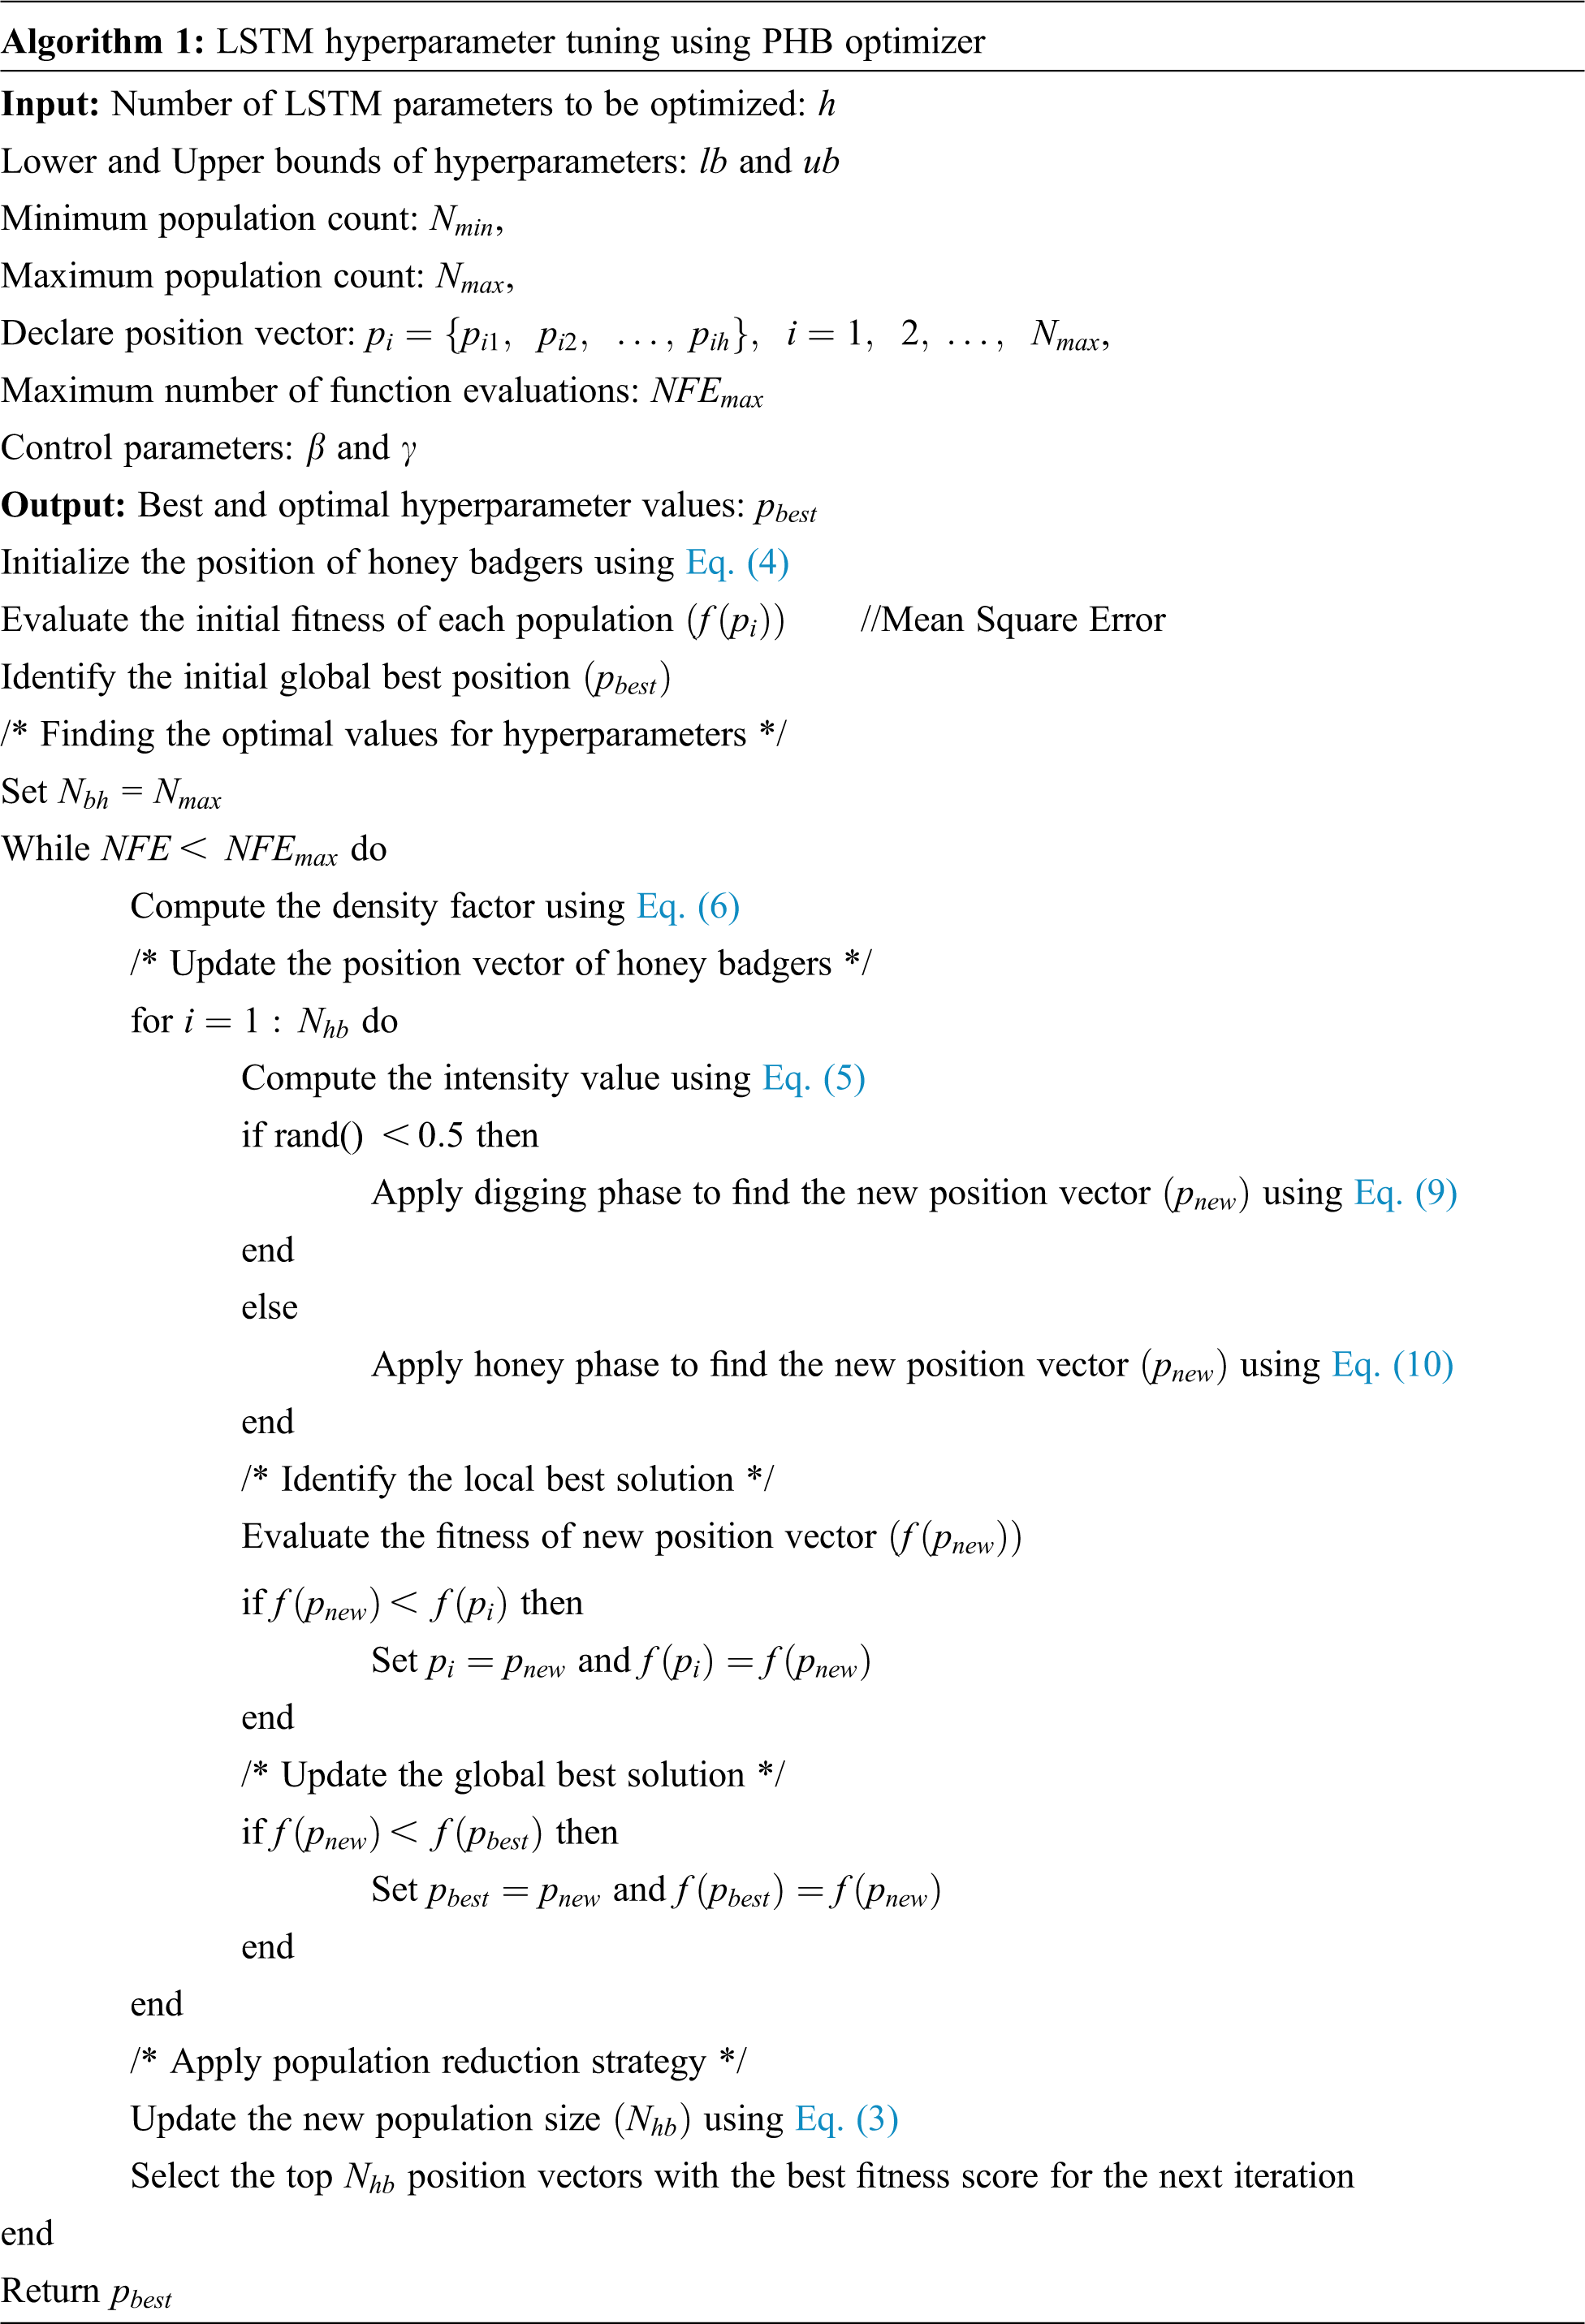
The learning process of the LSTM network is controlled by the hyperparameters such as learning rate, momentum rate, dropout rate, number of epochs, number of nodes, number of hidden layers, etc. The robustness and efficacy of the network depend on the values assigned to these hyperparameters. Therefore, tuning of hyperparameters plays a vital role and is a more complex and challenging process. The proposed framework makes use of the proposed PHB optimizer to fine-tune the momentum rate, learning rate, and dropout rate of each LSTM hidden layer. The parameter values selected by the PHB optimizer are tested every time with the objective/fitness function (mean squared error) to obtain the global best optimal values. For each hidden layer
Algorithm 1 emphasizes the pseudocode of the PHB algorithm for LSTM hyperparamater optimization. The number of LSTM hyperparameters along with their lower and upper bound values are given as input to the PHB algorithm in addition to other optimization parameters such as
One of the most critical aspects of developing an effective ML model is evaluating the performance of the model. The performance measures help to analyze how well the model performed with the provided data. By changing the hyper-parameters, the model’s performance can be improved. The experiments are conducted in Google Colaboratory with a specification of K80 GPU and 12 GB of RAM. For experimentation purposes, the corpus is split into 80% for training and 20% for testing. This section demonstrates the evaluation results, analysis, and comparisons of the proposed depression prediction model with state-of-art techniques.
Two different metrics are used to evaluate the quality or performance of the proposed approach: Accuracy and Root Mean Square Error (RMSE). These measures aid to determine the degree of effectiveness of the proposed algorithm in identifying the depressive text.
Accuracy is a statistic that describes how the model performs in general across all classes. In other words, accuracy measures the proximity of a predicted value to a standard or actual value. It is helpful when all classes are equally important. It is determined by dividing the number of correct predictions by the total number of predictions.
where
The Root Mean Square Error (RMSE) is a commonly used metric for determining how much a value predicted by a model differs from the actual values that were observed. The square root of the discrepancies between actual and predicted outcomes is known as RMSE. The formula to calculate RMSE is given in Eq. (17).
where
4.2 Accuracy Analysis of Elite Term Score
The FS techniques choose a feature subset according to its procedure or formula. The features are given a score based on their distinguishing strength. The classification performance of the feature subset chosen by FS algorithms may be examined with the help of soft computing techniques. If high scores are assigned to informative features by the FS approach, the classification performance produced by those features will be improved. Similarly, if low scores are assigned to uninformative features, the classification accuracy of the feature subset that does not include those features would most likely be greater. On the other hand, if any FS algorithm assigns high scores to uninformative features, the performance of classification gained by such features would reduce. Therefore, to analyze the accuracy of the proposed ETS feature selection methodology, two widely known machine learning algorithms are used such as Naive Bayes (NB) and Support Vector Machine (SVM). The total number of unique features extracted from Sentiment 140 and the Twitter dataset are 172834 and 18439 respectively. Since Sentiment 140 is a large corpus, the obtained number of features is higher when compared to the Twitter depression corpus. The feature subsets of different sizes (100, 500, 1000, 1500, 2000) selected by various FS techniques such as CHI2, DPM, DFS, NDM, MMR, and EFS are fed into NB and SVM models to compare the performance of the proposed ETS measure. The accuracy measures of Sentiment 140 and Twitter depression datasets obtained using NB and SVM classifiers are displayed in Figs. 7 and 8 respectively. From the figures, it is observed that the new ETS method performs well for both datasets with appreciable accuracy score values. For the Sentiment 140 dataset, the maximum accuracy of 0.923 and 0.926 is obtained using NB and SVM classifiers respectively. Similarly, for the Twitter depression dataset, the maximum accuracy obtained is 0.857 and 0.863 using NB and SVM classifiers respectively. Also, it should be stated that multiple FS approaches worked better for different feature sizes, including CDM, DPM, DFS, DFSS, MMR, and EFS. Furthermore, the SVM classifier is more efficient than the NB classifier because, in high-dimensional spaces, such as texts, SVM generalizes effectively.
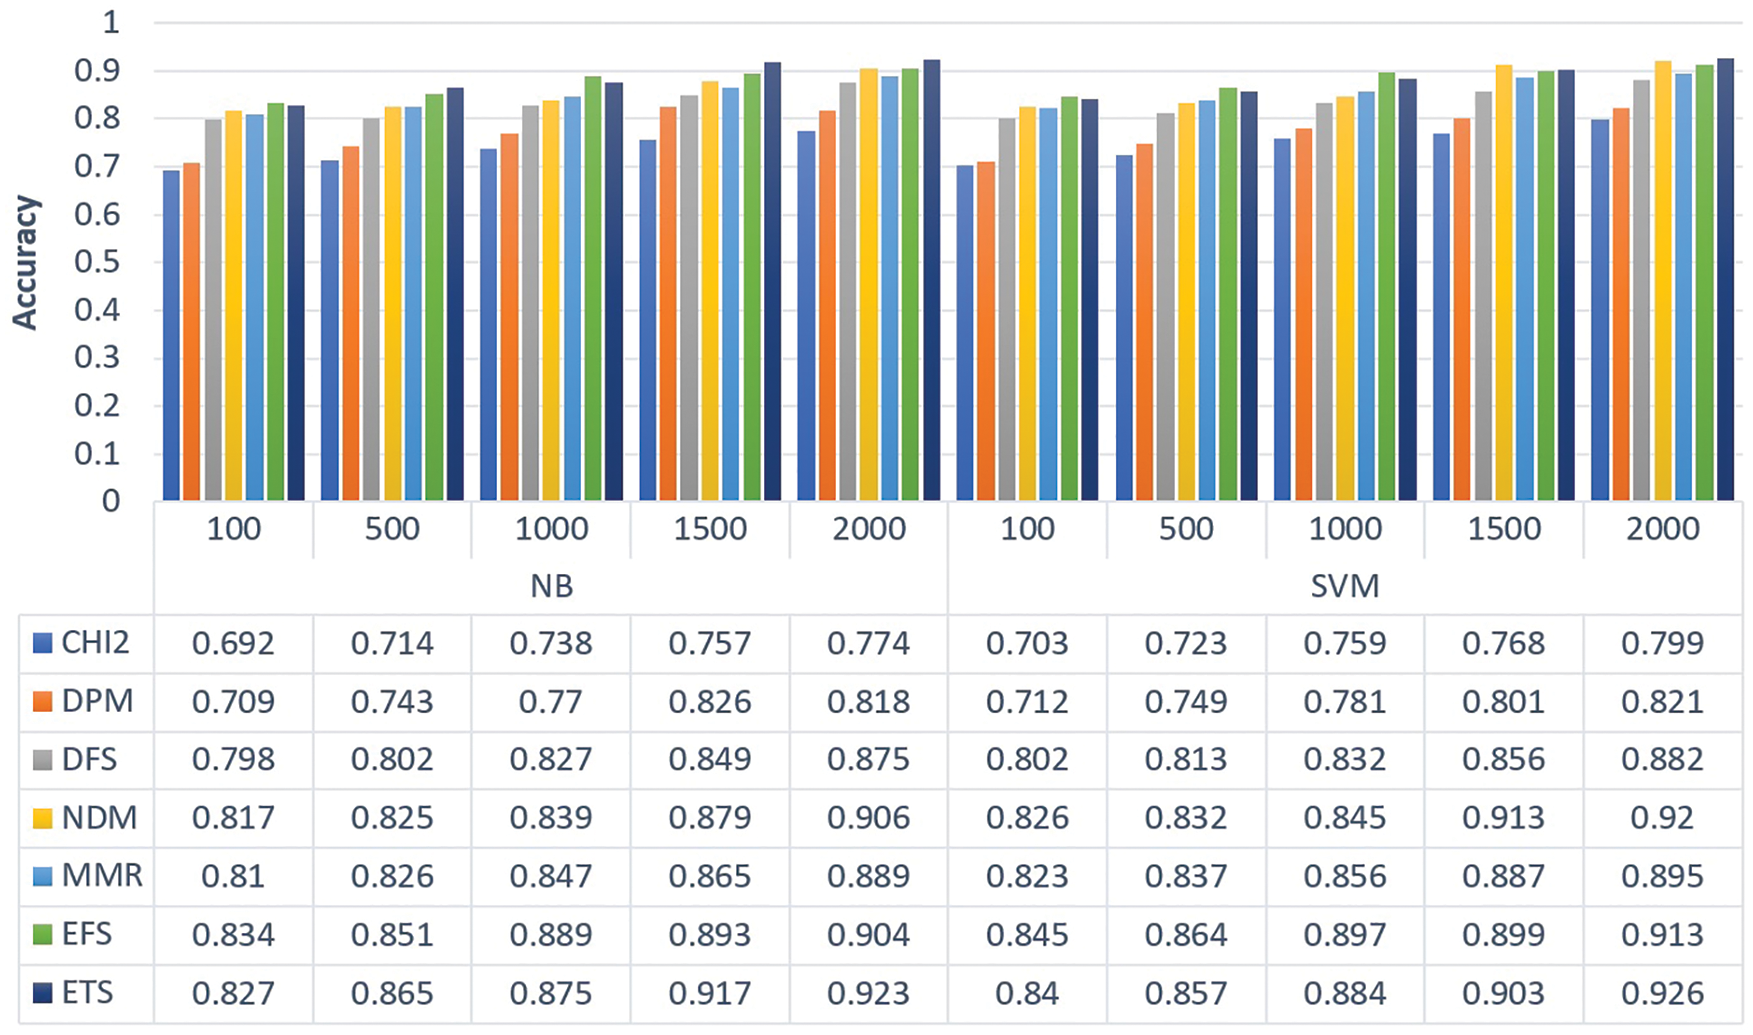
Figure 7: Accuracy comparison of different FS methods for sentiment 140 dataset
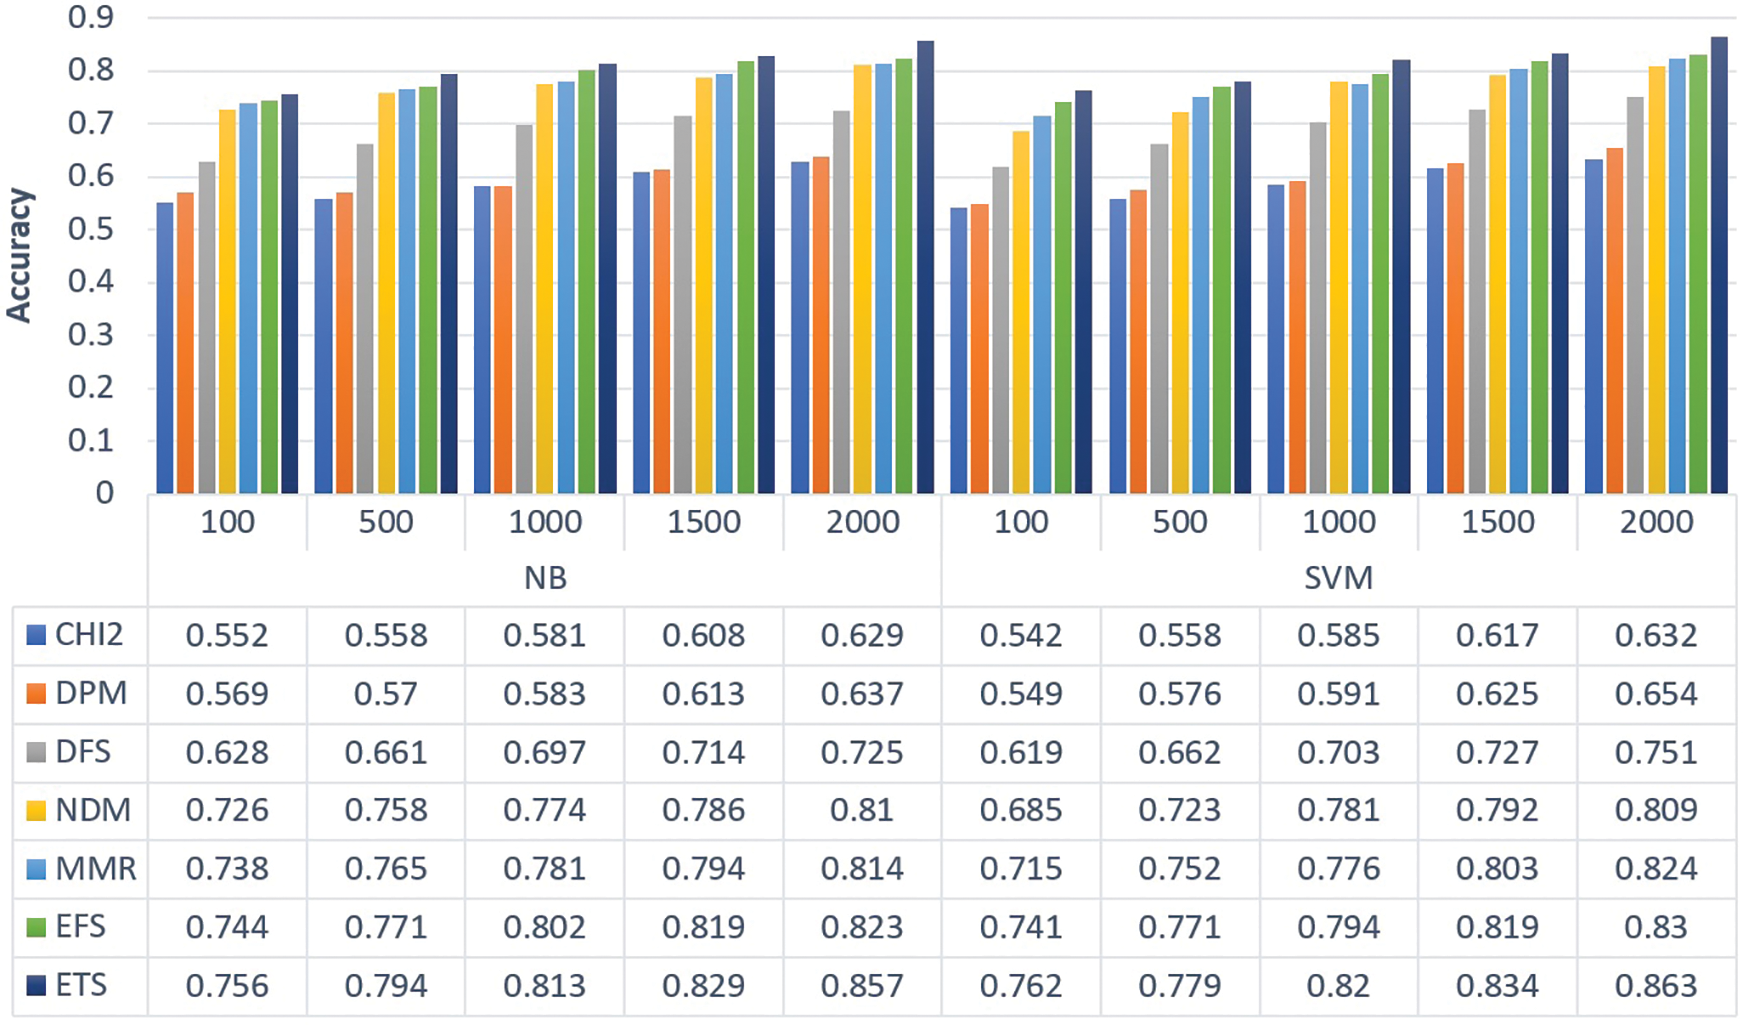
Figure 8: Accuracy comparison of different FS methods for Twitter depression dataset
To analyze the efficacy of the PHB optimization algorithm, the convergence behavior of the LSTM model with the PHB optimizer (LSTM-PHB) is compared with other metaheuristic algorithms in terms of accuracy and RMSE metrics. The various metaheuristic approaches used for the comparison purpose are Particle Swarm Optimization (PSO) [18], Black Widow Optimization (BWO) [19], Gaining Sharing Knowledge (GSK) optimization [20], and Honey Badger Optimization without population reduction (HB) [16]. The hyperparameter values used for the simulation of the aforementioned algorithms are given in Table 6. Apart from those parameters, for PSO, BWO, GSK, and HBO, the total population count, maximum iterations, and the number of epochs are fixed as 100. The convergence graphs of all algorithms for Sentiment 140 and the Twitter depression dataset based on RMSE and accuracy metrics are shown in Figs. 9 and 10 respectively. From the graphs, it is interpreted that the PHB converges to the best performance (RMSE and accuracy) of the LSTM network as compared to the other optimization techniques. In terms of RMSE, the LSTM-PHB converges at the minimum error rate of 0.0799 and 0.0559 for Sentiment 140 and Twitter depression dataset respectively. Simultaneously, the accuracy values converge at the maximum of 0.98 and 0.95 respectively for Sentiment 140 and Twitter depression dataset. Even though some of the algorithms converge quicker than PHB, they either stall or converge too soon in the early stages of the optimization process. As a result, it can be inferred that PHB is capable of balancing the two conflicting facets of exploration capacity and exploitation propensity.
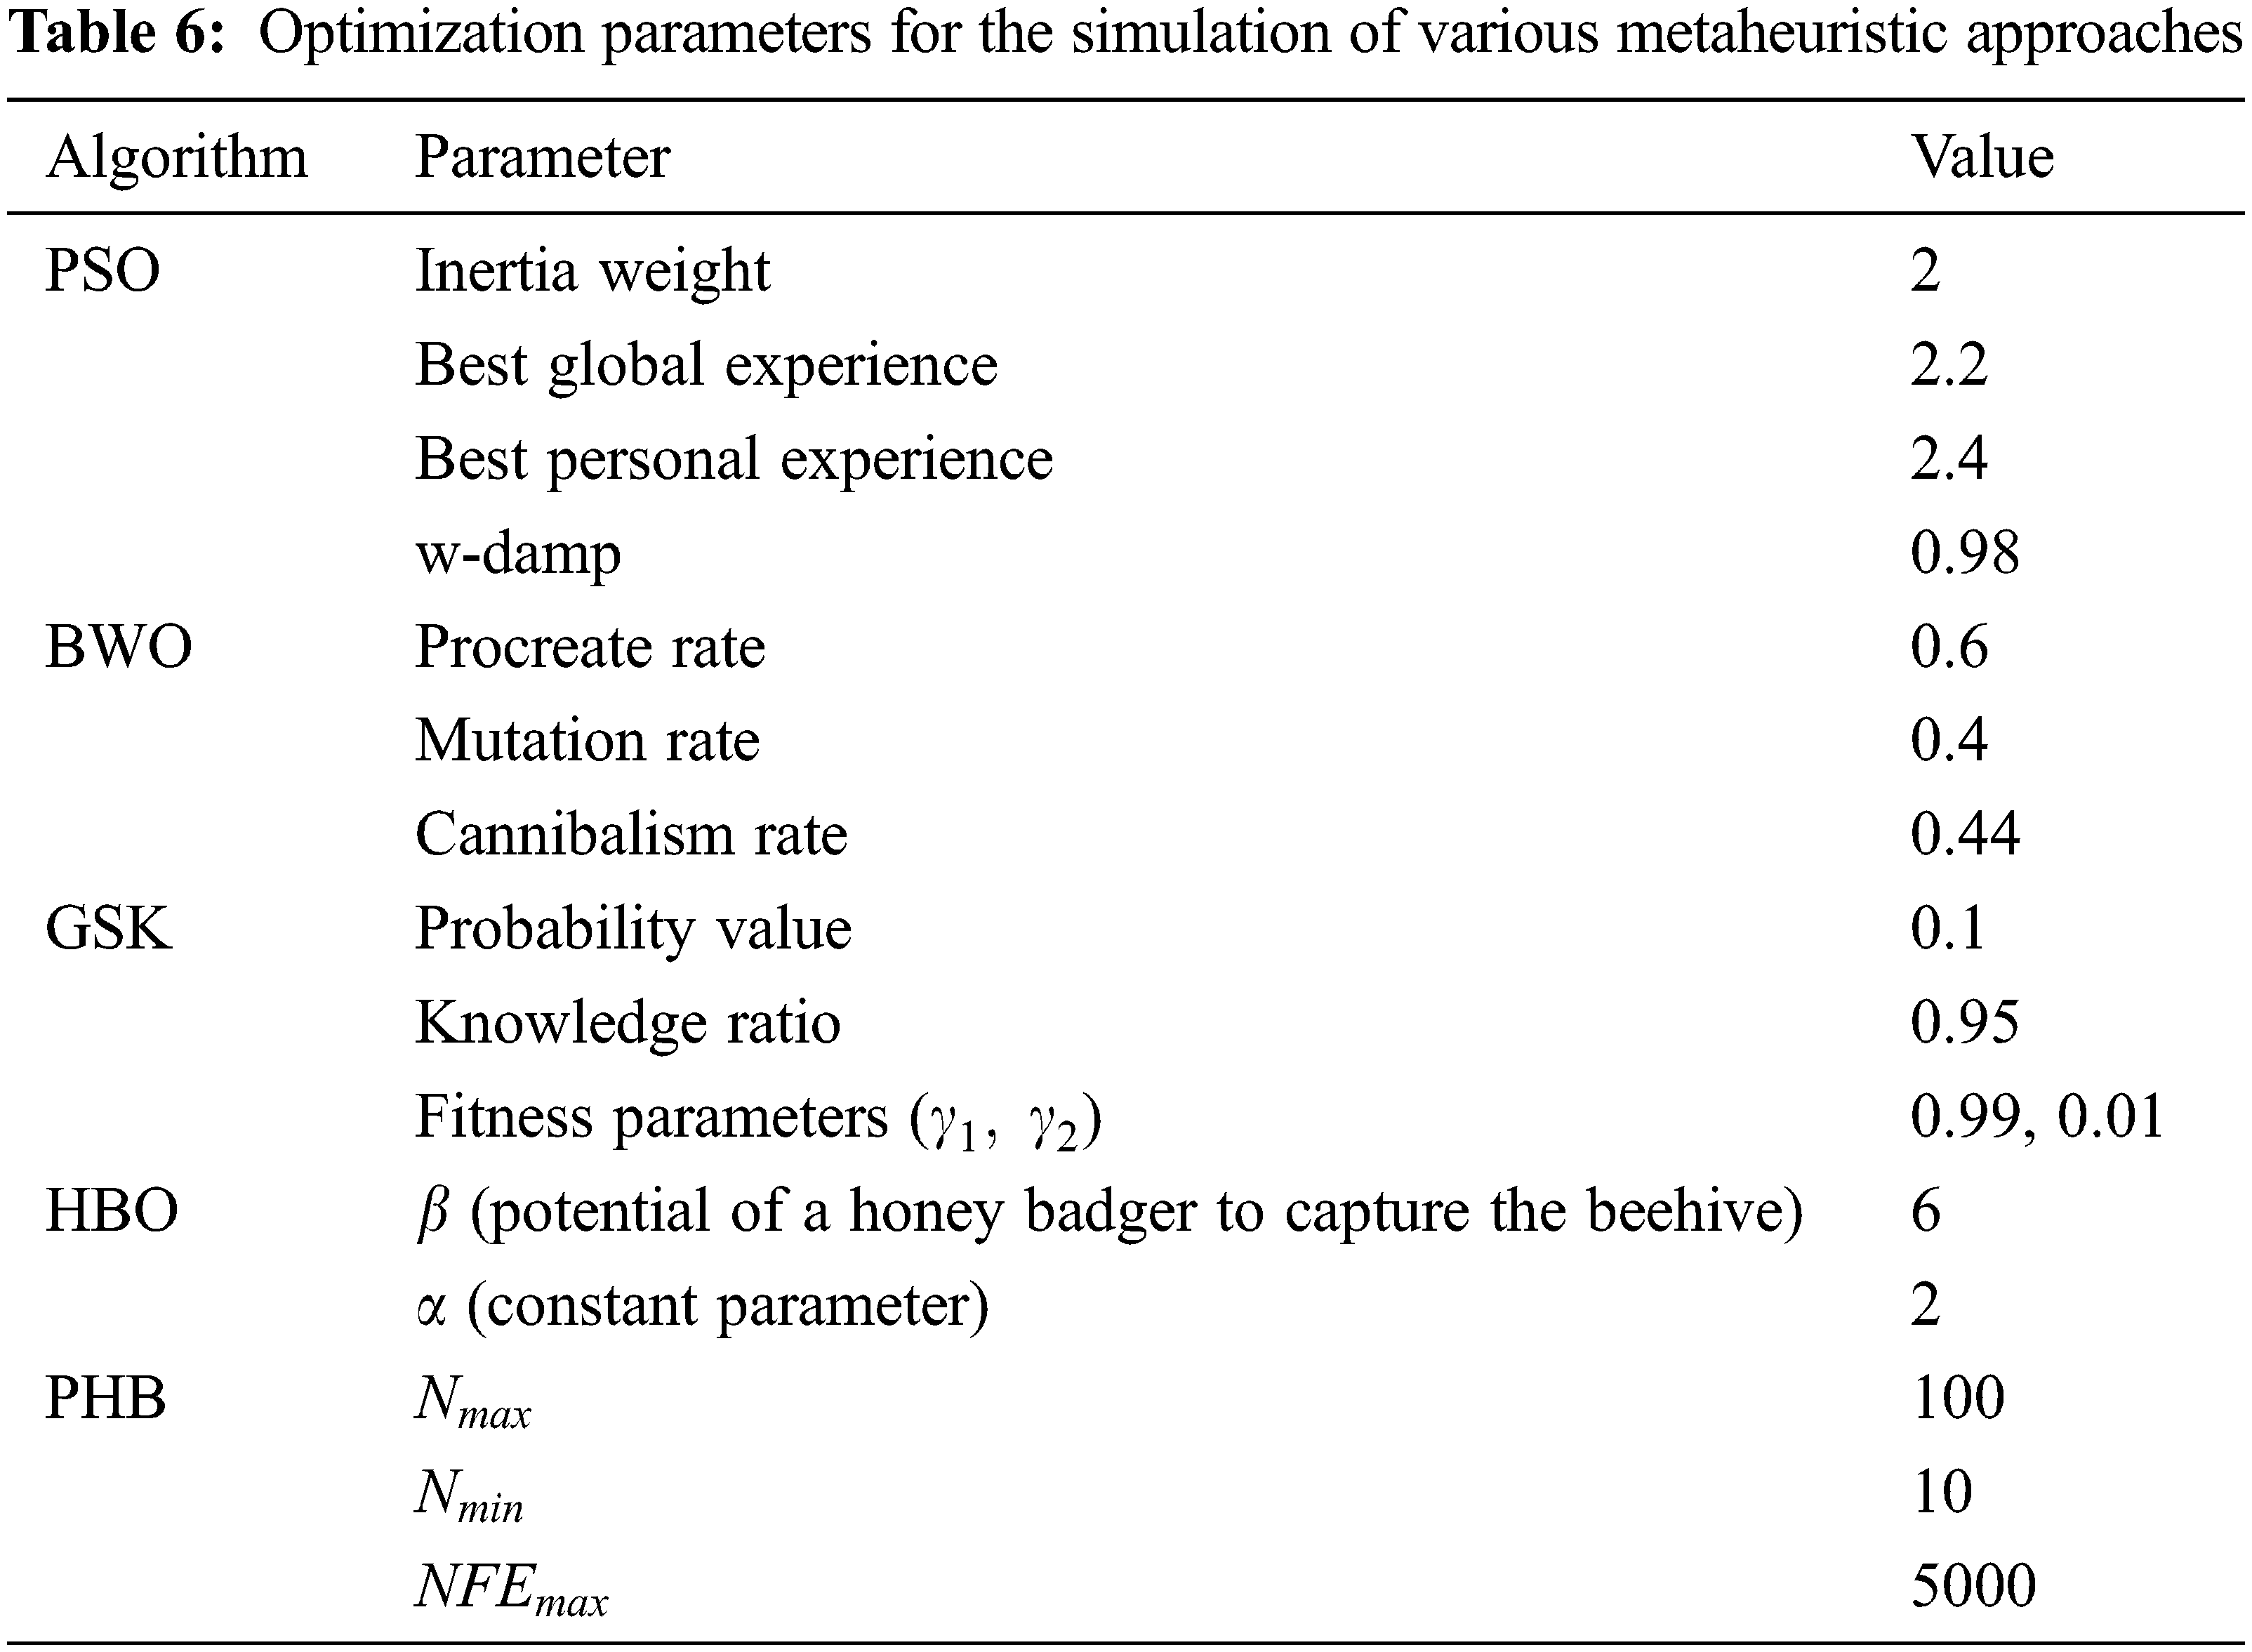
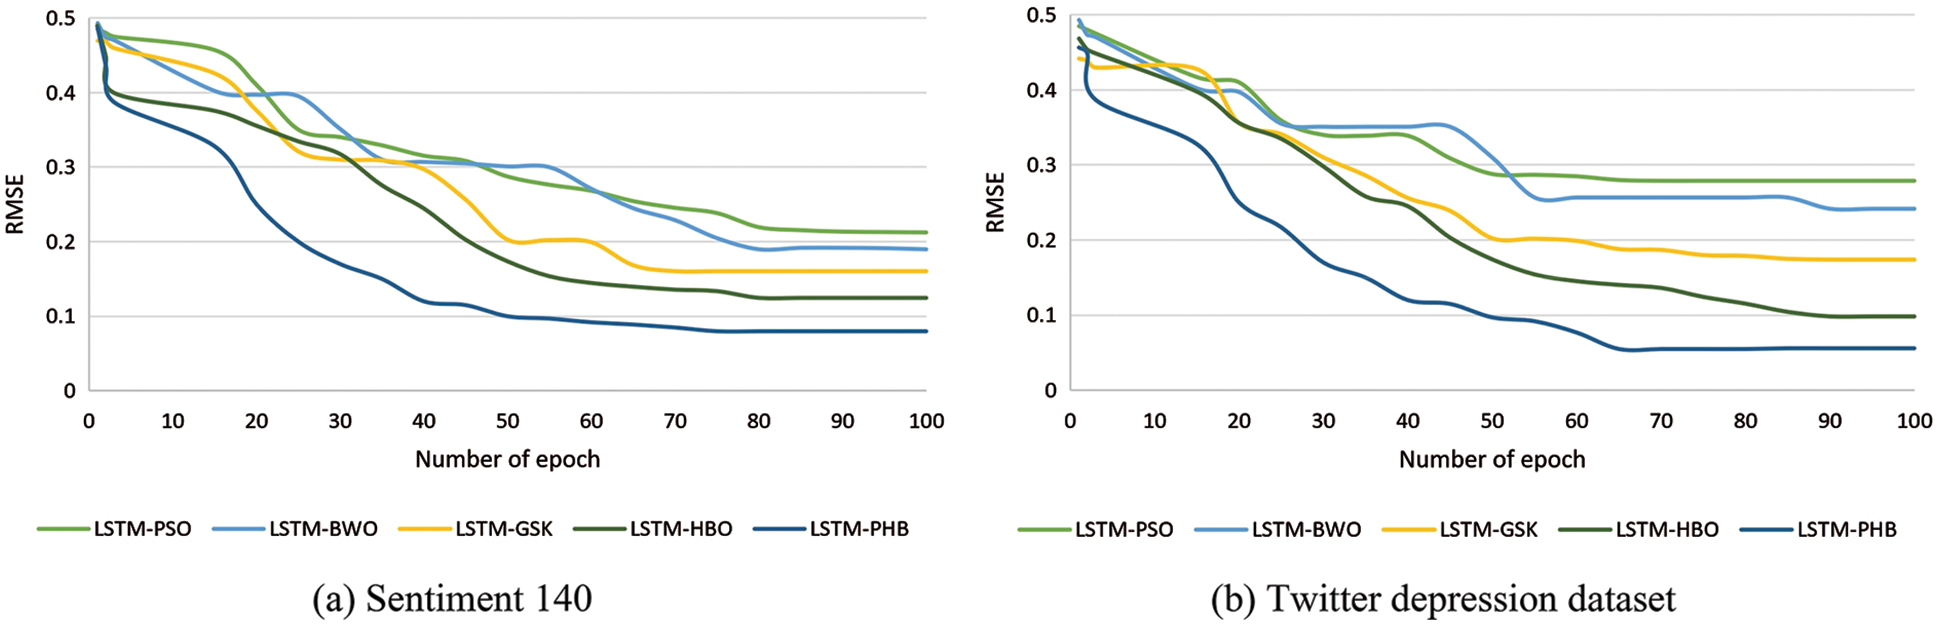
Figure 9: Convergence curves of LSTM with different metaheuristic approaches based on RMSE metric
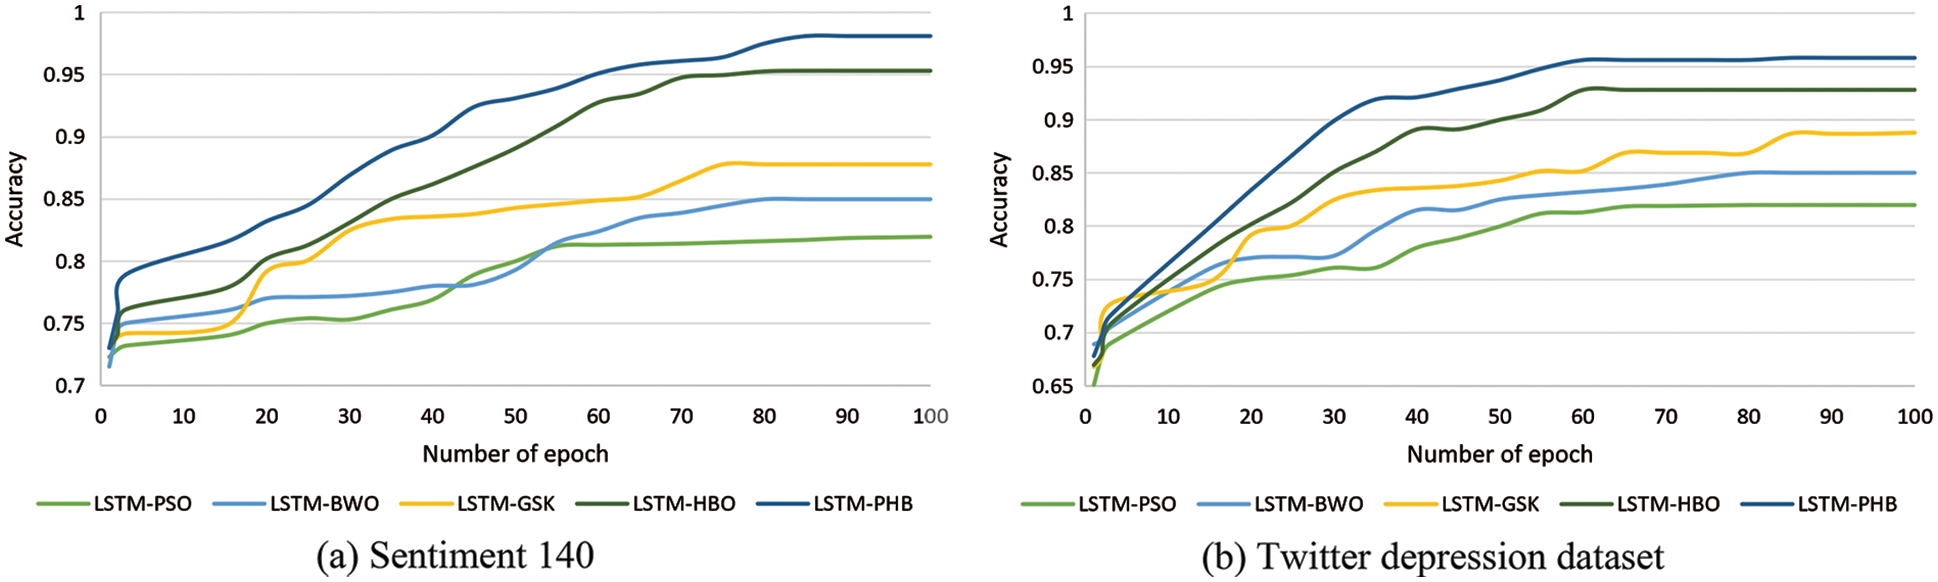
Figure 10: Convergence curves of LSTM with different metaheuristic approaches based on accuracy
4.4 Analysis of the Performance of LSTM with PHB Optimizer
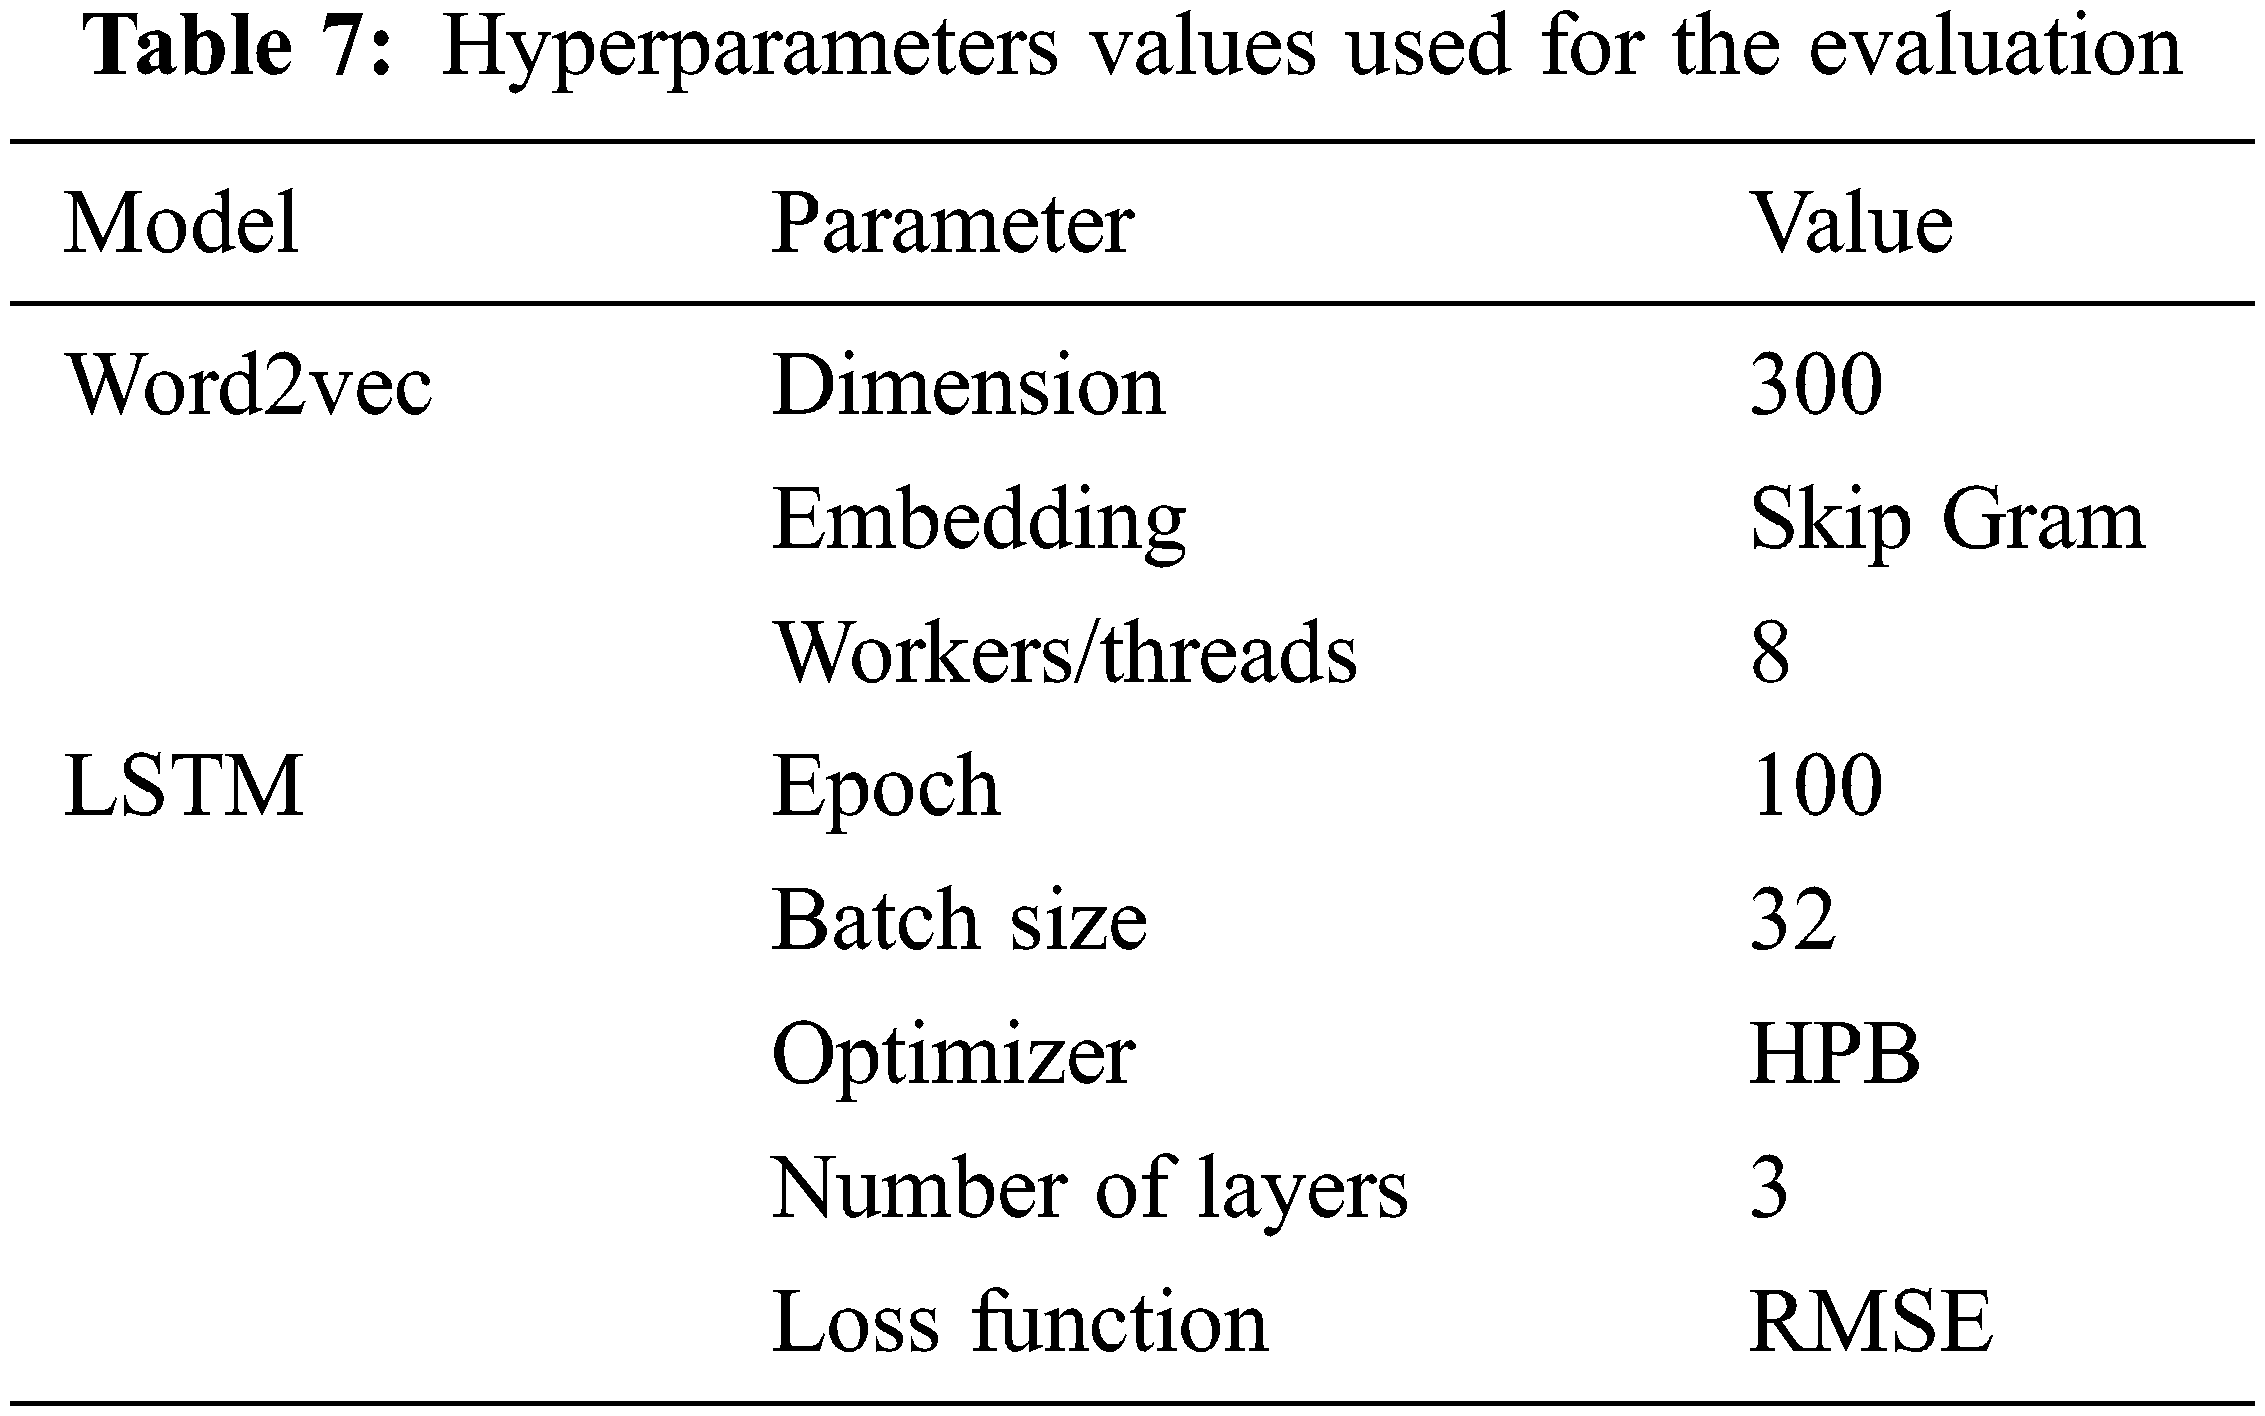
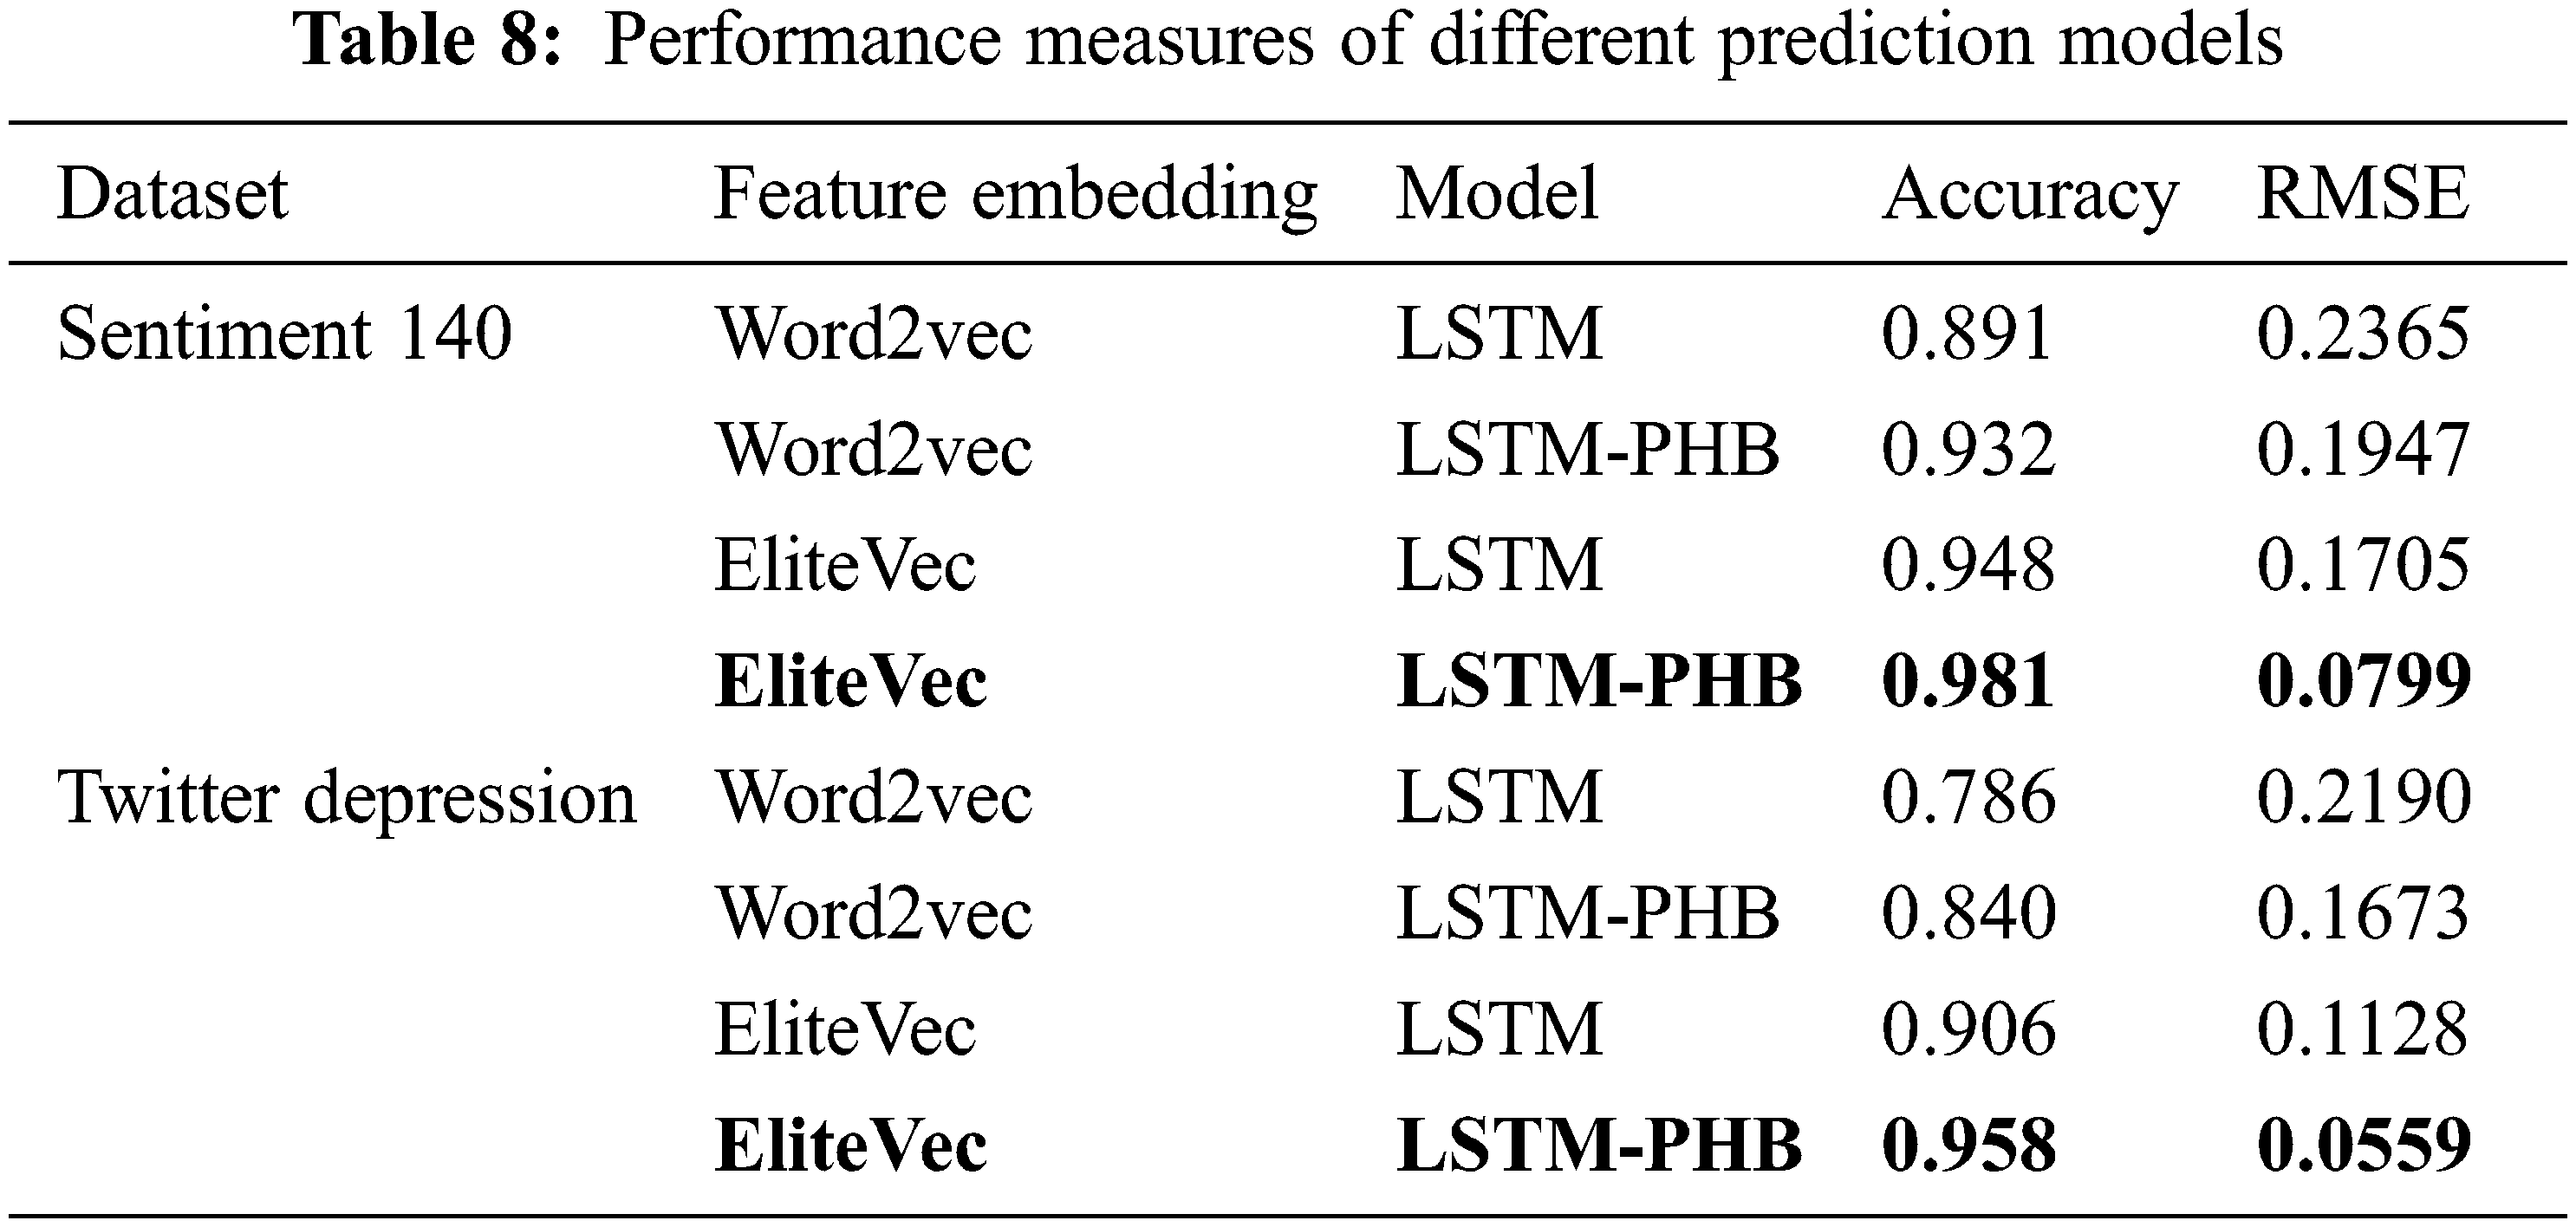
To elucidate the efficacy of the proposed LSTM-PHB based depression diagnosis methodology, it is compared with different combinations of word embedding and LSTM models using both the Sentiment 140 and Twitter depression dataset. The hyperparameter values used for the model training, validation, and testing are mentioned in Table 7. Due to its ability to store information for a long period, LSTM outperforms the traditional machine learning algorithms for predicting depressive sequences. The gradient dissipation and explosion issues are resolved with LSTM. PHB aids LSTM in determining the ideal values for the hyperparameters with reduced computational complexity. In contrast to classical LSTM, LSTM-PHB is better at choosing the ideal weights for neural networks and making wise hyperparameter selections, which results in increased accuracy and reduced RMSE error rate. The comparative assessment is shown in Table 8. From the assessment values, it can be noticed that the proposed technique acquires the maximum accuracy of 0.981 and 0.958 for the Sentiment 140 and Twitter depression datasets respectively. On the other hand, the minimum RMSE is also achieved as 0.0799 and 0.0559 for the Sentiment 140 and Twitter depression dataset respectively. The highlighted values in the table represent the best overall results attained by the proposed depression diagnosis model. From the analysis, it is also proven that the EliteVec feature representation tends to increase the performance of the model with respect to both accuracy and RMSE measures when compared to the standard Word2Vec embedding strategy. Also, the skip-gram embedding and PHB optimizer obtained good results for both datasets.
4.5 Comparison with State-of-Art Approaches
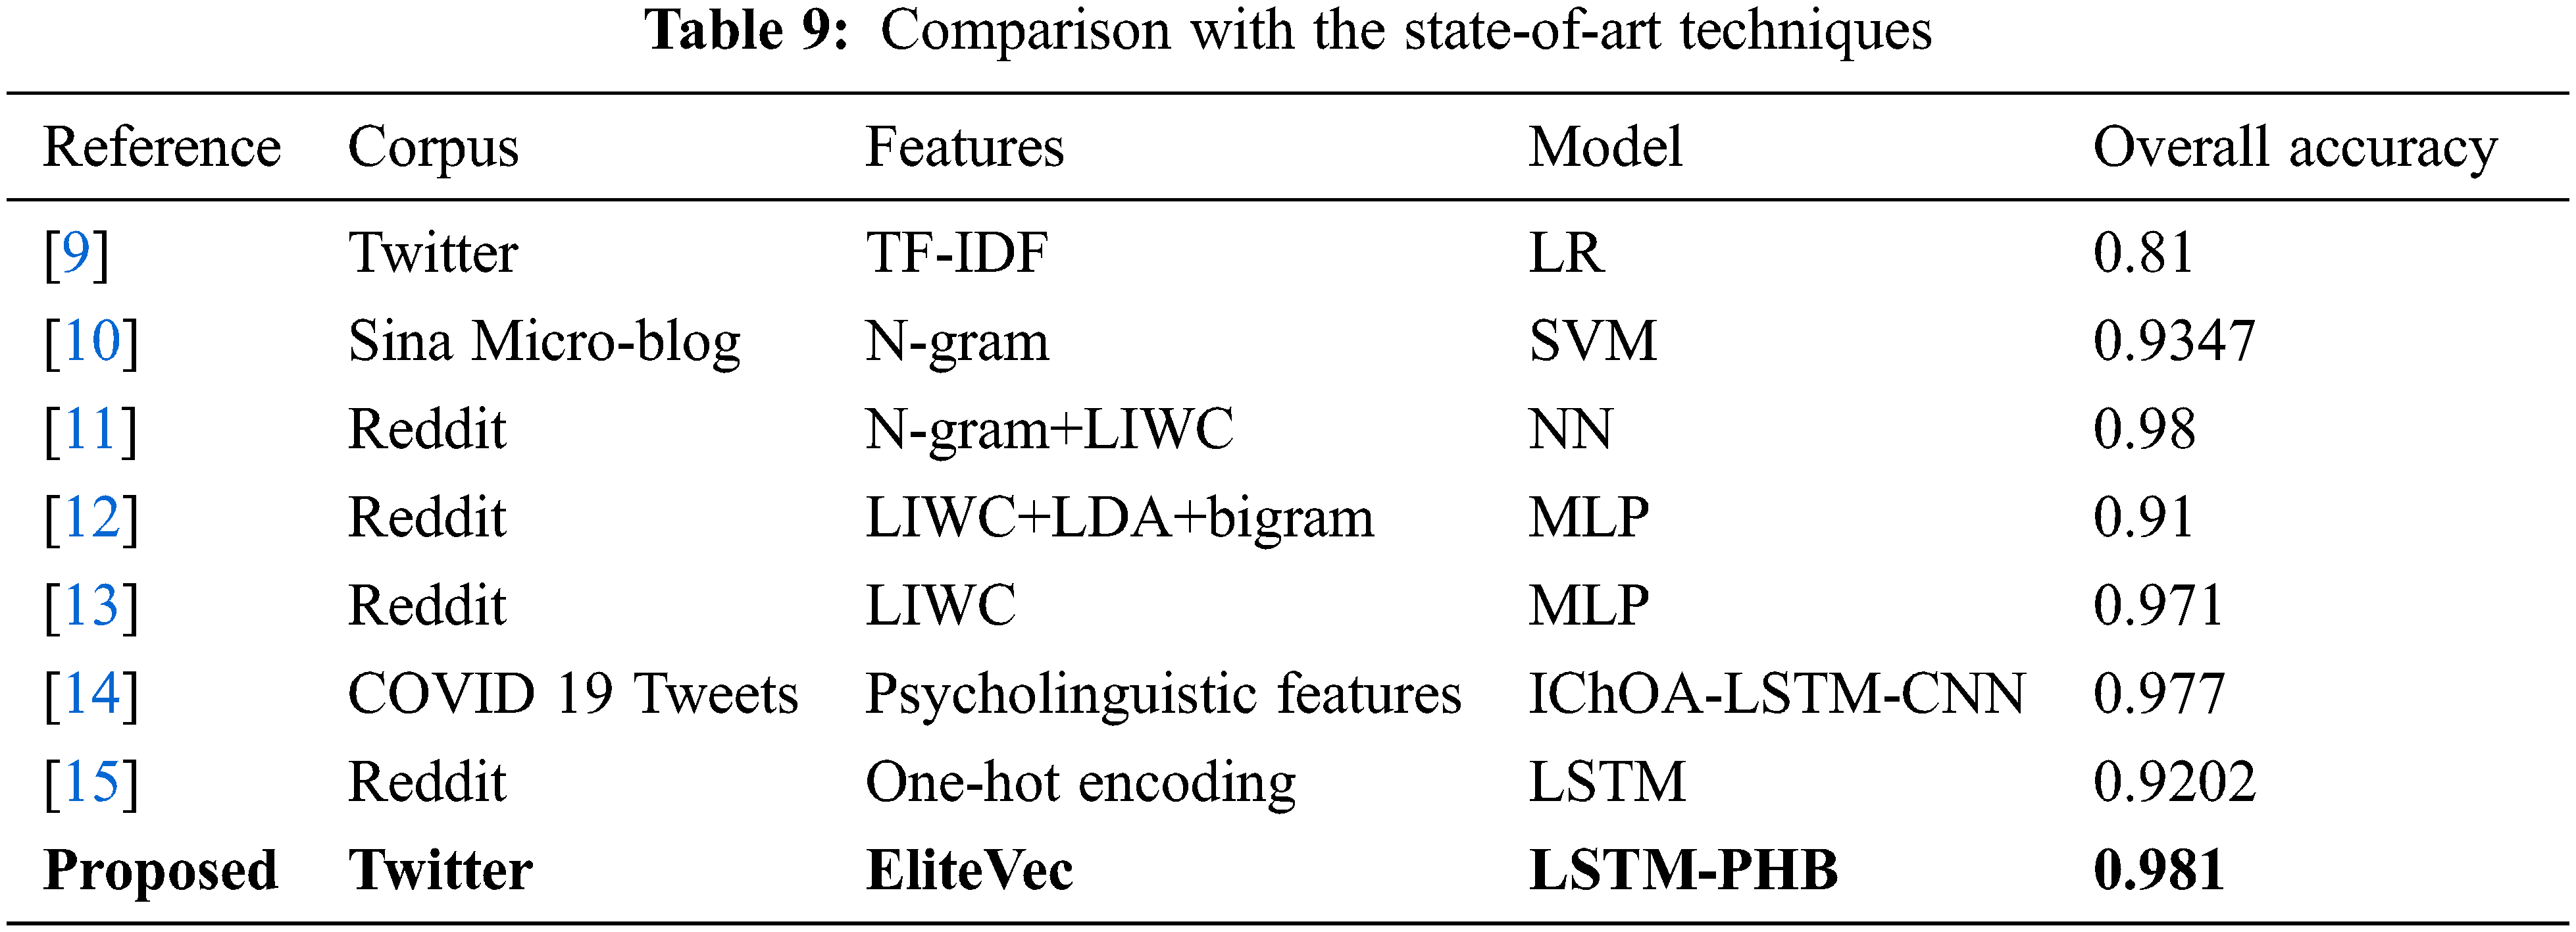
To justify the novelty and success of the proposed approach, it is compared with the overall accuracy obtained by the other existing state-of-art methods related to depression analysis. Table 9 summarizes the results gained by various literature works. From the tabulated values, it can be inferred that the Neural Network (NN) trained with combines with N-gram and LIWC features [11] obtained an equivalently great accuracy of 0.98. Similarly, LIWC features alone can produce a good accuracy score of 0.971 with the MLP model. The accuracy score acquired by the proposed framework is emphasized in the table and is superior to all the other models. The findings indicate that the suggested methodologies might aid in the development of intelligent and effective systems for diagnosing depression, anxiety, and other health-related problems in user-provided social media textual content.
This paper proposes an efficient depression analysis framework. The three-level probabilistic feature selection approach named Elite Term Score (ETS) is introduced to compute the significance of the feature and to reduce the feature dimensionality. The ETS score is fused with skip-gram model based Word2Vec semantic embedding to extract a strong word vector representation called EliteVec. The EliteVec yields consistent improvement in the performance of the LSTM model. Due to its excellent generalization capabilities, LSTM produces great results even without optimization. To boost the performance of the LSTM even more, PHB optimizer is used to tune the hyperparameters. The support of PHB in the LSTM network hyperparameter selection improves accuracy and reduces RMSE and computational complexity. Two different Twitter corpus has been employed in the experimental study, including the Sentiment 140 dataset and the Twitter depression dataset. The accuracy and RMSE metrics have all been used in the performance evaluation of the proposed technique. For the two datasets, the maximum accuracy of 98.1% and 95.8% and the minimum RMSE of 0.0799 and 0.0559 are achieved respectively. The empirical findings reveal the enhanced performance of the proposed depression identification approach.
Acknowledgement: The authors are grateful to the anonymous reviewers for their constructive comments and suggestions, which helped us to improve the quality of the manuscript. The authors would like to extend their gratitude to the Management and Principal of Mepco Schlenk Engineering College(Autonomous), Sivakasi for providing ample facilities and support to carry out this research work.
Funding Statement: The authors received no specific funding for this study.
Conflicts of Interest: The authors declare that they have no conflicts of interest to report regarding the present study.
References
1. B. Pfefferbaum and C. North, “Mental health and the COVID-19 pandemic,” New England Journal of Medicine, vol. 383, no. 6, pp. 510–512, 2020. [Google Scholar]
2. A. Halfin, “Depression: The benefits of early and appropriate treatment,” The American Journal of Managed Care, vol. 13, pp. S92–S97, 2007. [Google Scholar]
3. J. R. F. Raj, K. Vijayalakshmi and S. Kavi Priya, “Medical image denoising using multi-resolution transforms,” Measurement, vol. 145, pp. 769–778, 2019. [Google Scholar]
4. A. K. Uysal and S. Gunal, “A novel probabilistic feature selection method for text classification,” Knowledge Based Systems, vol. 36, pp. 226–235, 2012. [Google Scholar]
5. C. M. Cheng, H. M. Lee and Y. J. Chang, “Two novel feature selection approaches for web page classification,” Expert Systems with Applications, vol. 36, no. 1, pp. 260–272, 2009. [Google Scholar]
6. A. Rehman, K. Javed and H. A. Babri, “Feature selection based on a normalized difference measure for text classification,” Information Processing & Management, vol. 53, no. 2, pp. 473–489, 2017. [Google Scholar]
7. A. Rehman, K. Javed, H. A. Babri and N. Asim, “Selection of the most relevant terms based on a max-min ratio metric for text classification,” Expert Systems with Applications, vol. 114, pp. 78–96, 2018. [Google Scholar]
8. B. Parlak and A. Uysal, “A novel filter feature selection method for text classification: Extensive feature selector,” Journal of Information Science, 2021. [Google Scholar]
9. M. Mounika, S. Gupta and B. Valarmathi, Detection of Depression Related Posts in Tweets Using Classification Methods–A Comparative Analysis. Cham: Springer, 2020. [Google Scholar]
10. J. Zheng, J. Bian and J. Jia, Diagnosis of Depression Based on Short Text. Cham: Springer, 2019. [Google Scholar]
11. J. Shen and F. Rudzicz, “Detecting anxiety through reddit,” in Proc. Computational Linguistics and Clinical Psychology—From Linguistic Signal to Clinical Reality, Vancouver, BC, pp. 58–65, 2017. [Google Scholar]
12. M. Tadesse, H. Lin, B. Xu and L. Yang, “Detection of depression-related posts in reddit social media forum,” IEEE Access, vol. 7, pp. 44883–44893, 2019. [Google Scholar]
13. I. Fatima, B. Abbasi, S. Khan, M. Al-Saeed, H. Ahmad et al., “Prediction of postpartum depression using machine learning techniques from social media text,” Expert Systems, vol. 36, pp. e12409, 2019. [Google Scholar]
14. R. Meena and V. Thulasi Bai, “Depression detection on COVID 19 tweets using chimp optimization algorithm,” Intelligent Automation & Soft Computing, vol. 34, no. 3, pp. 1643–1658, 2022. [Google Scholar]
15. C. Sudeshna, H. F. Mahdi, M. H. A. Al-Abyadh, K. Pant, A. Sharma et al., “Large-scale textual datasets and deep learning for the prediction of depressed symptoms,” Computational Intelligence and Neuroscience, vol. 2022, pp. 5731532, 2022. [Google Scholar]
16. F. A. Hashima, E. H. Houssein, K. Hussain, M. S. Mabrouk and W. Al-Atabany, “Honey badger algorithm: New metaheuristic algorithm for solving optimization problems,” Mathematics and Computers in Simulation, vol. 192, pp. 84–110, 2022. [Google Scholar]
17. A. K. Mohamed, A. W. Mohamed, E. Z. Elfeky and M. Saleh, “Enhancing AGDE algorithm using population size reduction for global numerical optimization,” in Proc. AMLTA2018, Springer, Cham, vol. 723, pp. 62–72, 2018. [Google Scholar]
18. R. Poli, J. Kennedy and T. Blackwell, “Particle swarm optimization,” Swarm Intelligence, vol. 1, pp. 33–57, 2007. [Google Scholar]
19. V. Hayyolalam and A. A. P. Kazem, “Black widow optimization algorithm: A novel meta-heuristic approach for solving engineering optimization problems,” Engineering Applications of Artificial Intelligence, vol. 87, pp. 103249, 2020. [Google Scholar]
20. A. W. Mohamed, A. A. Hadi and A. K. Mohamed, “Gaining-sharing, knowledge based algorithm for solving optimization problems: A novel nature-inspired algorithm,” International Journal of Machine Learning and Cybernetics, vol. 11, pp. 1501–1529, 2020. [Google Scholar]
Cite This Article
 Copyright © 2023 The Author(s). Published by Tech Science Press.
This work is licensed under a Creative Commons Attribution 4.0 International License , which permits unrestricted use, distribution, and reproduction in any medium, provided the original work is properly cited.
 Downloads
 Citation Tools