
 Submit a Paper
 Propose a Special lssue
 Open Access
ARTICLE

Heartbeat and Respiration Rate Prediction Using Combined Photoplethysmography and Ballisto Cardiography
1 Department of Electronics and Communication Engineering, St. Peter’s College of Engineering, Chennai, 600054, Tamilnadu, India
2 Department of Electronics and Communication Engineering, Saveetha Engineering College, Chennai, 602104, Tamilnadu, India
3 Department of Electronics and Communication Engineering, Tagore Engineering College, Chennai, 600127, Tamilnadu, India
* Corresponding Author: Valarmathi Ramasamy. Email:
Intelligent Automation & Soft Computing 2023, 36(2), 1365-1380. https://doi.org/10.32604/iasc.2023.032155
Received 09 May 2022; Accepted 01 August 2022; Issue published 05 January 2023
 View Full Text
 Download PDF
Abstract
Owing to the recent trends in remote health monitoring, real-time applications for measuring Heartbeat Rate and Respiration Rate (HARR) from video signals are growing rapidly. Photo Plethysmo Graphy (PPG) is a method that is operated by estimating the infinitesimal change in color of the human face, rigid motion of facial skin and head parts, etc. Ballisto Cardiography (BCG) is a nonsurgical tool for obtaining a graphical depiction of the human body’s heartbeat by inducing repetitive movements found in the heart pulses. The resilience against motion artifacts induced by luminance fluctuation and the patient’s mobility variation is the major difficulty faced while processing the real-time video signals. In this research, a video-based HARR measuring framework is proposed based on combined PPG and BCG. Here, the noise from the input video signals is removed by using an Adaptive Kalman filter (AKF). Three different algorithms are used for estimating the HARR from the noise-free input signals. Initially, the noise-free signals are subjected to Modified Adaptive Fourier Decomposition (MAFD) and then to Enhanced Hilbert vibration Decomposition (EHVD) and finally to Improved Variation mode Decomposition (IVMD) for attaining three various results of HARR. The obtained values are compared with each other and found that the EHVD is showing better results when compared with all the other methods.Keywords
With the rapid growth of remote medical monitoring, it is unsurprising that video-based heart rate monitoring is gaining popularity [1]. The signals for photoplethysmography and ballistocardiography are estimated in most cases using video images taken during the procedure. They must estimate either microscopic color changes or rigid head/face motion to function correctly [2]. Remote health monitoring is a relatively new concept in biomedical engineering. When physiological parameters could be measured using a digital camera, the development of remote sensing technology accelerated significantly [3]. The researchers extracted BCG signals by exploiting the uncontrollable head movement caused by increased brain blood flow. As a result, the BCG signals were extracted from a video of a person’s face. Due to the left ventricle contraction, blood is pushed rapidly through the aortic arch. The carotid arteries return blood to the brain and spine at the end of each circulation cycle [4]. Additionally, photoplethysmographic (PPG) signals are used in a wide variety of other applications. According to preliminary research, it appears possible to calculate respiratory, heart, and blood pressure rates using PPG signals. The PPG signal from the wrist is frequently used in sports to monitor heart rate and other vital signs (HR). Home-based healthcare systems benefit from the PPG device’s ease of use, mobility, comfort, and cost-effectiveness. In terms of physiological monitoring and pervasive healthcare, one of the most promising candidates is the PPG signal obtained from pulse oximetry [5]. Photoplethysmography (PPG) has been shown to be highly effective in this application [6]. The optical technique is used to determine changes in the micro vascular blood volume. According to Beer-law, Lambert’s a tissue’s ability to draw blood is determined by its ability to reflect and transmit light. Despite its difficulty to see with the naked eye, this phenomenon can be captured using the commercial camera found on the majority of modern smart phones [7]. Methods for measuring the PPG signal in both transmitted and reflected modes are nearing completion and will soon be used in non-invasive cardiac monitoring applications. The current state of the art in PPG signal measurement is centered on the transmission mode, which detects signals at the fingertip. The proposed work stood ahead of the state of art methodologies in terms of accuracy in prediction of Respiration rate and heart beat.
With the help of a consumer-grade camera and ambient light, Rong et al. devised a method for measuring remote plethysmo graphic signals [8]. In comparison to the other two channels, the green channel contains the most plethysmo graphic information (red, green, and blue). Wu et al. calculated heart rate with the aid of digital colour video captured from a camera [9]. It is possible to derive a time-varying intensity signal from the intensity variance of facial pixels by using a time-varying intensity signal generator. The subject was identified with the help of the Viola-Jones face detector [10]. This technique was used to extract the face’s pixels. It kept track of the subject’s face throughout the experiment. Kumar et al. obtained temporal signals with red, green, and blue intensity variants by spatially averaging facial pixels and comparing them to the original signals [11]. When Wang et al. applied temporal filtering to the PPG signal; they were able to refine their method. In order to improve ROI selection, the authors reduced the entire face ROI to 60 percent of its width in order to reduce the number of choices [12]. They could do this because they could ignore pixels that had nothing to do with the face [13]. Zafraniec et al. proposed a PPG-based heart rate measurement system that uses the green spectrum of the RGB camera to measure heart rate [14]. Face detection was achieved by fitting a discriminative response map to the skin region below the eyes on the lower half of a person’s face, located on the lower half of their face [15]. As a result, we used KLT feature tracking to track the return on investment over time [16]. We used a neural network to remove motion artefacts from the green spectrum signal. This allowed us to automate the measurement of patient heart rate fully. To compensate for motion, they used a non-rigid motion elimination algorithm with a normalized least mean square adaptive filter to achieve their results. In their study, Lam et al. found that using green spectrum data from an RGB camera could achieve comparable results. Data were collected by the authors of this study using BSS after extracting multiple green spectrum signals from random patches and combining them. Na Hye Kim et al. calculated PPGs by analyzing the red and green spectra of the RGB camera’s red and green filters, respectively [17]. The authors calculated the PPG signal using an adaptive green and red differentiation function, which they developed themselves. Researchers Jeremy Speth et al. recently proposed that chrominance features on the face could be used to detect heart rate [18]. To estimate the PPG signal from the chrominance features of data in this study, the authors devised an adaptive matrix computation method, which they tested in this work [19]. The respiratory process modulates the PPG signal in several ways. These include pulse-amplitude modulation, baseline modulation, and pulse frequency modulation. Chenglong Ye et al. estimated the respiratory rate using a three-way average of three respiratory rates (RRs) derived from three changes in PPG due to respiration [20]. They developed the Lazaro algorithm to determine the respiratory rate. Additionally, with the assistance of the PPG, Nakajima, and colleagues developed the RR and HR. RR estimations may be inaccurate if they occur outside of the predefined frequency band. The authors estimate the RR from PPG using wavelet functions, which is a novel technique [21]. Recent research indicates that Hilbert vibration decomposition (HVD) is a powerful technique for studying non-stationary signals [22]. HVD has been used in a wide variety of biomedical signal processing applications, including cardiovascular signal processing. Included among these is the removal of baseline wander from ECGs as well as the calculation of respiratory rate from ECGs. When PPG signals are filtered in a specific frequency band, a previous study discovered that artefacts and low perfusion variations significantly impact the accuracy of HR estimation [23]. PPG epochs of at least 30 s were used in many validation techniques; however, shorter recordings are better suited for use in clinical applications [24]. Due to the short data length of the PPG signal, more research will be needed in the future to achieve accurate and reliable HR estimation. -In signal processing, a non-recursive technique known as “variational mode decomposition” (VMD) is used to process non-stationary signals [25]. VMD is an intrinsic non-recursive method that does not produce a result. For example, seismological time-frequency analysis, sleep apnea monitoring, and speech signal detection are all possible uses for this decomposition technique. Recursive shifting, inability to deal with noise, hard band restrictions (wavelet techniques), and predefined filter bank boundaries are all examples of limitations (empirical wavelet transform) [26]. In 2021, Dragomiretskiy et al. proposed the non-recursive VMD method, which was implemented in the software [27]. It is necessary to employ optimal solution methods for variational problems, such as mode decomposition. The optimization process results in forming a mode cluster with a band limit. Wiener filters that have been combined to form VMD [28]. Modes with different centre frequencies can be distinguished using this technique. Using VMD, EMD, EEMD, and EWT, Wang et al. compared the effectiveness of rubbing-caused signatures identification using the four different methods. VMD was successfully used by Zhang et al. to extract the rolling bearing signal from a multistage centrifugal pump [29], which was previously reported. According to the findings of this study, VMD extracts more features than other methods. An optimization index was developed by Tang et al. in, which was the ratio of residual energy to original signal energy. In this case, it was determined when the ratio fell below a predetermined level. Mode mixing can occur as a result of the methods ecause the characteristics of the signal component are not taken into account. The authors optimized the VMD mode number as well as the penalty parameter. Even though it can obtain the desired parameter value, this method is inefficient. From the Literature Review, the major identified drawback is the failure of predicting the heart beat and respiratory rate accurately. The major cause for this setback is the existence of noise in the boundaries and the leading filters fails to optimize it.
The proposed model for measuring the HARR is framed using a combined PPG and BCG model. The main objective is to calculate the frequency of heartbeat
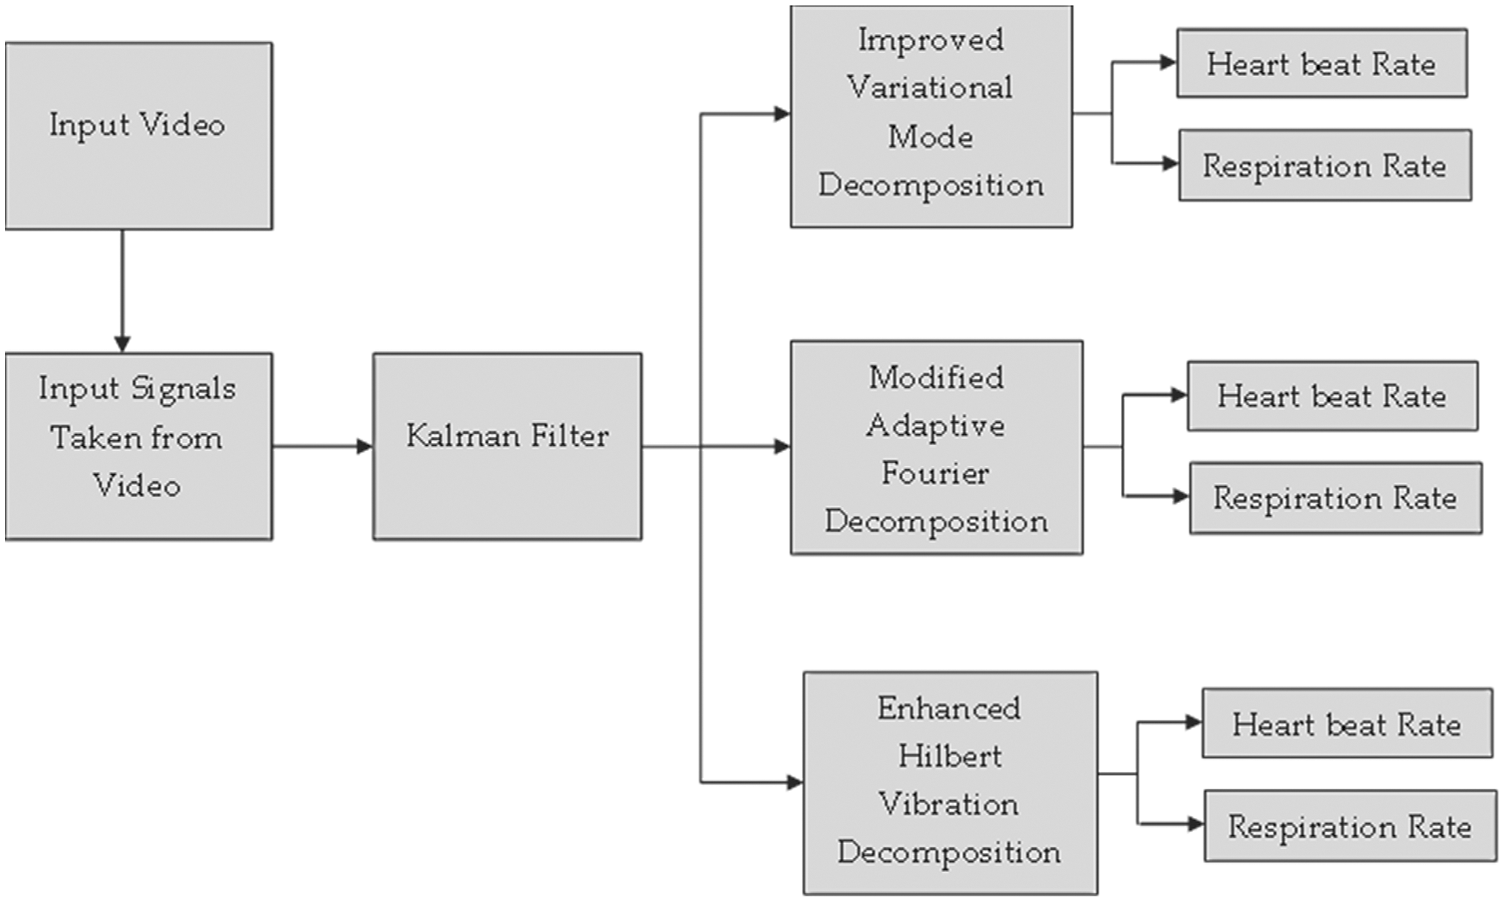
Figure 1: Proposed model architecture
The input taken for this research is the video signals which are taken in real-time. The captured signals are split into frames using a hybrid video segmentation (HVS) method. The hybrid method consists of object-based video segmentation in addition to the keyframe extraction method. The obtained frames are made noise-free and are subjected to IVMD, MAFD, and EHVD for determining the HARR value.
3.1 Hybrid Video Segmentation (HVS)
The hybrid video segmentation (HVS) method combines the key frame extraction method in association with the object-based video segmentation method. Here the statistical model of the training method is implemented for facilitating the object-based video segmentation using key frame extraction. The shot-based video segmentation and the object-based segmentation are the two needed components used for segmenting the video signals. Especially the key frame extraction method is needed for providing the video representation which is of compact details containing the most wanted structures of the video contents. The video segmentation using the joint spatiotemporal method is used for extracting the various video objects through a clustering method. This could be used for classifying the whole video information and is used for enhancing the combined video segmentation based on key frame refinement. The HVS algorithm consists of three processes
• Extraction of key frame for the shot abstraction of video
• Object segmentation using model-based clustering
• Key frame refinement
A better algorithm for key frame extraction is used by modifying certain attributes for getting a condensed input video representation and then the modified gaussian mixture model (GMM) is used for extracting the needed video objects. At last the trained GMM model is used for refining the key frames which is extracted for obtaining more condensed video shot representation architecture for video object prediction is illustrated in Fig. 2.
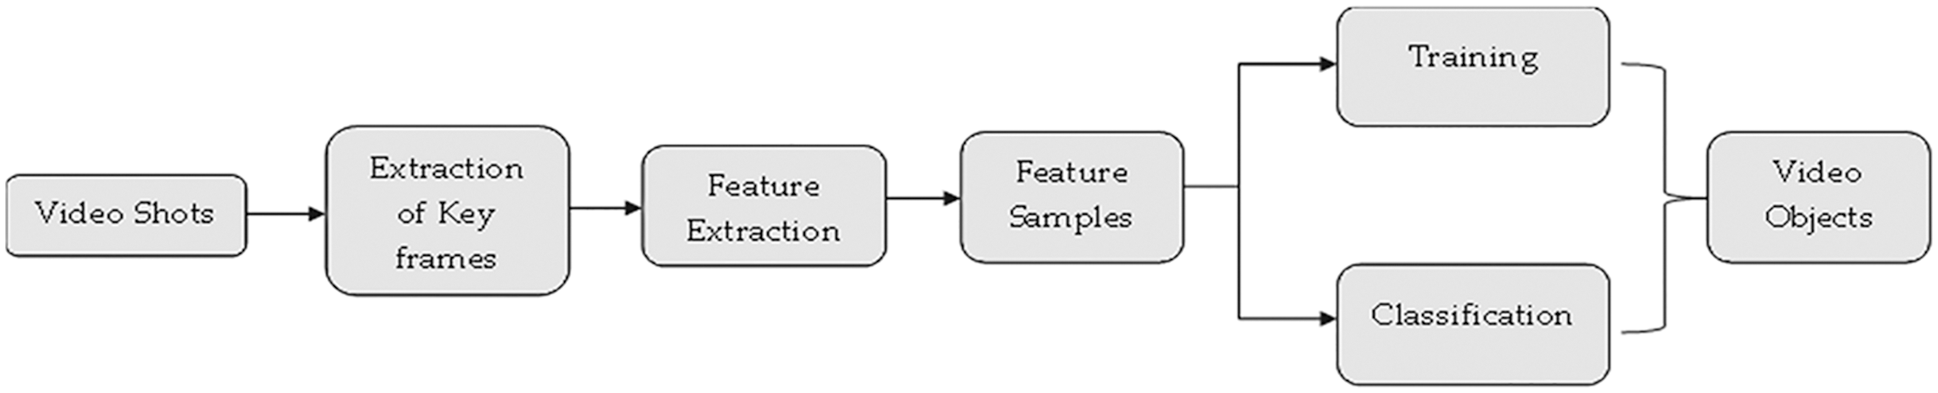
Figure 2: Architecture for video segmentation framework
3.1.1 Extraction of Key Frame for the Shot Abstraction of Video
Consider one video shot v of F frames, for example
If the resemblance value possesses more means the identical frames are more similar when considering the histogram. When a new cluster is added to the group of clusters, then the centroid value is to be calculated first. The keyframe is extracted from the sequence of clusters by comparing it with the threshold value, T.
3.1.2 Object Segmentation Using Model-Based Clustering
In this approach, object-based segmentation from the video is extracted using the GMM model. The Gaussian distribution is used because it is highly traceable and the central limit theorem used here guarantees the summing of random variables from the gaussian distribution. Hence the performance of GMM is better, as no data assumption is made possible over here. A probabilistic video-based segmentation is used for extracting the object from the video segments. The probabilistic space determination is made by the abstraction of feature samples from a set of gaussian mixtures. The estimation of density in GMM is obtained in a semi-parametric mode as the complexity of the data is a deterministic factor and the size of data is a non-deterministic factor.
The raw video data which is in the time-space is transformed into multidimensional feature space, in which the feature vectors are provided with a topology for regularisation like the patterns of motion, colour, textures of the video information’s. The selection of feature is used for identifying the effective features, but somehow it is not possible to extract the whole contents because of dimensionality variation. The effectiveness of the features will be depending on the selection methods and the extraction methods by considering the motion, color and the texture. Here in this approach a pixel wise feature extraction is used which directly extracts the video data using the extraction process. The feature extraction is made for all the pixels in the frames.
The extraction of key frames is used for facilitating the object-based video segmentation. The clustering results is used for refining the keyframes which will make the shot-oriented representation compactible because of GMM. The extraction of key frame is made with the help of threshold value T. this will make the selection of video frames to be efficient and is needed more for object-based representation. After the extraction of key frames, a keyframe set S is obtained as
The distance between the
Then the distance in between the two successive keyframes kni and knj is calculated using the following mathematical expression
The information from the raw video signals are segmented to video frames and the shot videos signals are interpolated to 23 frames per second. Then the normalization process is started from the obtained signal X(t) as
where η and λ are the mean and standard deviation of X(t). The Kalman filter is used for smoothing the signal in order to amplify the heart pulse and respiration pulse. Once the attenuation process of the signal is over then it is subjected to band pass FIR filter. At last, the heart rate and the respiration rate from the signal using the specific algorithm used for real time prediction of the video signals. The robustness and the accuracy are made in control by using Lomb periodogram. The algorithm is shown below in Tab. 1. The apriori and aposteriori are the terms used to determine the Heart rate and respiration rate.

3.3 Amplification and Smoothing of the Signals
The Kalman filter is used for filtering out the unwanted signals and to retrieve back the original signal. It contains a nonstationary recursive filter for estimating the needed signal from the noisy background. The Kalman filter is described in steady state with two different stochastic equations
Here,
The obtained vector value μk is the state transaction noise and another value wk is the measurement noise. The matrix for X is determined with the time step value k−1 in consideration with the absence of the noise and the values are marked as below
Normally the Kalman filter consists of two different parts like updating the equations based on time constraints and updating the equations based on the measurements. For time updates the equation might be
For measurement updates the equation might be
Here, Γk is the Kalman gain, the error covariance estimation is determined with the setting of 3 × 3 matrix for the value ρk. Then the error covariance prediction is make with the value ρ−1. This could be shown in the matrix as
For deriving the constants X and Y, the value of Ak is to be determined with uniform sampling rate. Here Ak value is set to be
The derivative approximation is expressed as
From the above equations it is clear that the estimated value Bk possess some value which is much lower than the predicted value and the final expression for the filter design is formulated as
The smaller value α and β shows that the Ak + 1 exceeds the value Bk + 1 that shows the prediction of heart pulse and respiration pulse is marked amplified.
3.4 Modified Adaptive Fourier Decomposition (MAFD)
In this research, the MAFD is supporting the adaptive decomposition of the video frames in the process of prediction of the HARR value. The obtained frames are grouped as F(t) which is made to place in H-Space and is given as
where, Sm(t) is the series of mono components and ΨN is the standard remainder.
The MAFD uses the ration system for pertaining the orthogonality process by fixing the functions for determining the HARR value. The main process involved in MAFD is to extract the mono components from the sequence of high component generation to the low component generation. The estimation of the energy relation is done by fixing the corresponding value of the standard remainders ΨN.
For achieving the higher convergence rate, the obtained energy value of the standard remainder, Ψn at all parts of the decomposition level is maintained to be minimum. Hence the maximum rate of the projection is shown below.
The MAFD value get differed from the normal Fourier decomposition models. For the normal frequency analysis, the various signals are decomposed with the help of MAFD which is purely depends on the distribution of energy that makes it possible for determining the overall frequency ranges with individual energy considerations.
The application of MAFD is measured by considering the noise-based signal which effectively removes the noises by using the Hilbert transform.
The analytic representation of the obtained noisy signal is determined as
Eq. (18) is applied as input to the MAFD. If the noise signal is expressed as
3.5 Enhanced Hilbert Vibration Decomposition (EHVD)
The EHVD will decompose the non-stationary signals with various mono components along with the sequentially varying signals with suitable frequencies and amplitudes. The amplitude variation of the signal is decomposed by considering the first components of the input signal. The main part of the mixture is obtained with the highly complicated amplitude signals with lower amplitude. The instantaneous frequency is computed with the largest component analysed and is subtracted with the already extracted mono components from the input signals. Hence the EHVD decomposing of the signal s(t) is obtained by using the mathematical expression
The envelope of the signal is represented as α(t) and β(t). the EHVD method might use the analytical signal representation of the input signal for computing the amplitude of the envelope from the obtained. It is projected with highly complicated respiratory components for attaining the PPG signal which has lower energy components of EHVD.
3.6 Improved Variation Mode Decomposition (IVMD)
The IVMD is a completely inherent and adaptable technique that decomposes a signal into many modes with varying centre frequencies, energy, and bandwidth. When synthesizing the incoming signal, each sub-signal has a particular sparsity and a central wavelength with low bandwidth. Here the parameters which is used for initializing the process might includes with some representation of the nodes. The larger values of the IVMD method is not provided with appropriate value, it may depends upon the application it is used. As the larger value in the IVMD method founds difficulties in estimating the center frequencies in an accurate manner. Here the obtained PPG and BCG signals are decomposed into its corresponding frequency spectrum values. The decomposition of the noise signal is correlated with the noise signals
For validating the performance of the proposed model, a set of experiments are conducted with some real-time video samples.
The video samples are taken from 25 participants (12 females and 13 males). The age range among the participants are ranging from 20 to 40 years. The video signals are collected by manually testing the participants with the HARR monitor. The subjects are asked to assemble in a separate hall during periodic intervals. The hall is equipped with all setups supporting real-time observation. A pulse oximeter is used for tracing out the real heartbeat value and the exact value is obtained using the BCG and the respiration rate is monitored using the method PPG in addition to manual checking. The data collection is made in a random manner by extracting about 10 frames per second for up to 10 min. The subjects are allowed to sit freely for 15 min, hence their head motion, face reaction, and all are noted.
The efficiency of the proposed model is tested with different aspects. Initially, the information from the PPG and BCG is obtained with video information. The video information is converted into various frames using the HVS method. The information regarding the signal conversion is shown in Tab. 2.
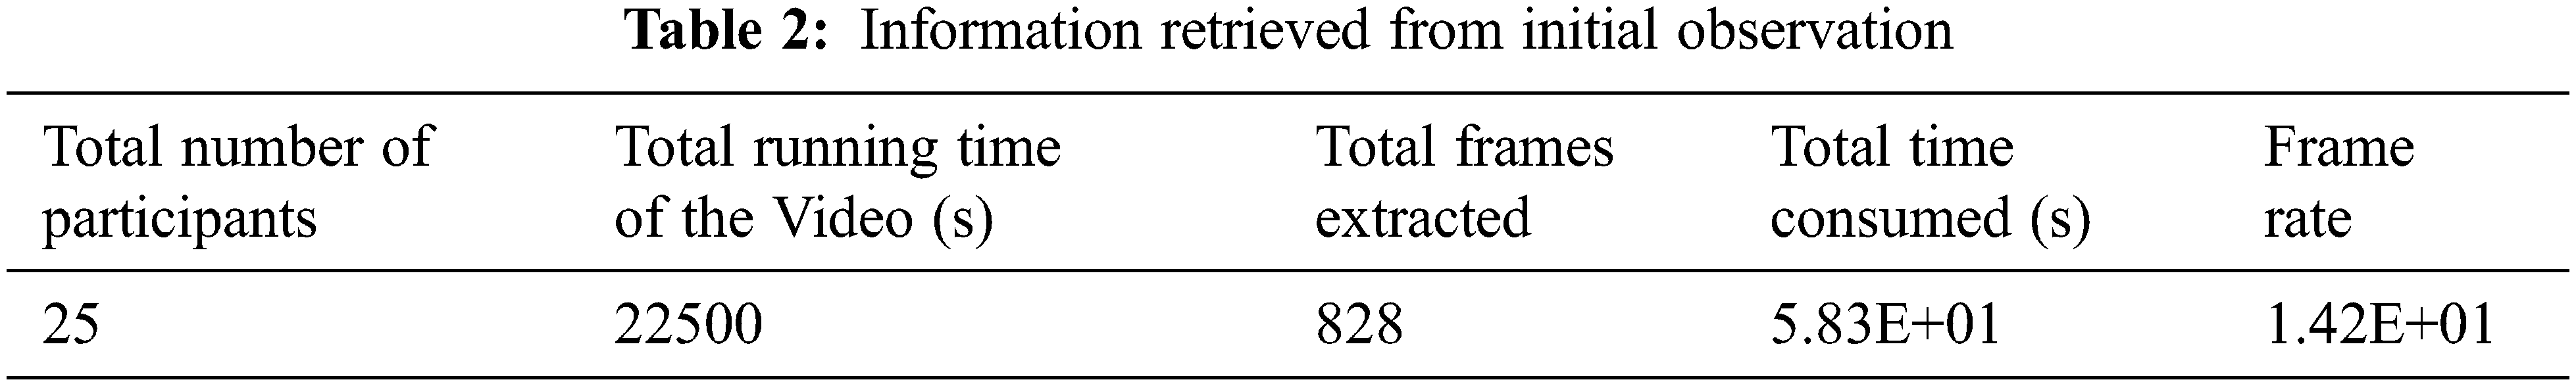
From the total information retrieved (i.e., 22500 s of video) only a part is considered for the analysis. Most of the contents are removed by a process of smoothing and refinement. Mostly the video is taken out in real-time and hence the noise attack is more in the video and it can be removed with the help of the Kalman filter. Initially, the video signals are pre-processed before feeding into the Kalman filter. Mostly the videos are taken with the help of cameras with high-resolution pixels representation. After converting the videos into frames there is a need for checking the synchronization process. The distance between the frames is to be calculated and make sure that the identical distances are to be fixed in between the frames. After then the signal frames are to be set into various clusters or groups. The obtained RGB signal generated after setting up the groups is shown in Fig. 3.
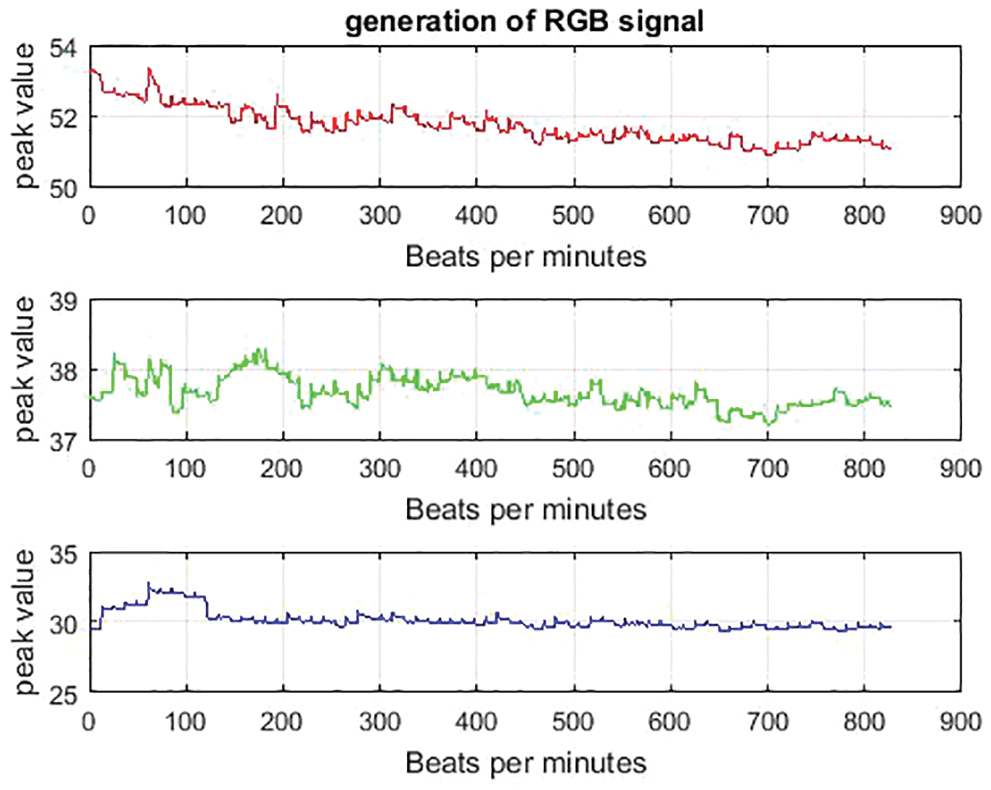
Figure 3: Generation of RGB signal
The groups of RGB signals from the video output are divided into various frames using the suitable segmentation process. Here the process of detrending the signals are to be needed for estimating the exact RGB value. Since the signals are grouped there is a need for separation between the frames, so a form of synchronization is needed for combining the original signal with the grouped signal. The detrending process is illustrated in Fig. 4.
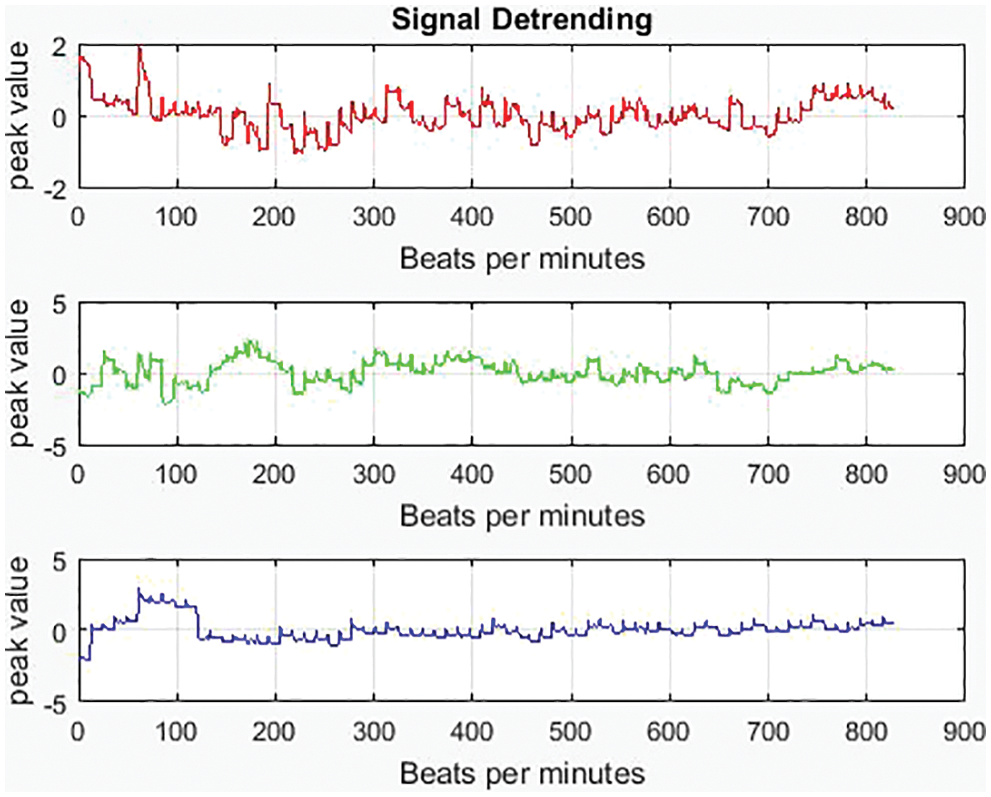
Figure 4: Process of signal detrending
After synchronization, the extraction of green signals from the whole set of frames is needed. The video frames separation is mentioned in another way as green signal separation. For estimating the exact value in separated video frames, the green signal separation supports the process and is illustrated in Fig. 5.

Figure 5: Separation of green signals
From the above Fig. 5, it is clear that the green signals are separated from the whole video sequence. These predicted green signals must possess some errors due to the involvement of noises. In the proposed model an adaptive Kalman filter is implemented for removing the noises.The noise-included video frames are subjected to an adaptive Kalman filter for further processing. For effective prediction of the HARR value, the removal of noise is mandatory. The signal coming out from the video frames is shown in Fig. 6.

Figure 6: Before Kalman filter
The Fig. 3 shows the signals retrieved from the video frames are clustered and is analysed. After the implication of the filtering process, the signals get removed with noise and is refined. This is illustrated in Fig. 7.

Figure 7: After the implementation of the Kalman filter
The change in the peak value shows the effectiveness of the algorithm using the Kalman filter. The variation is predicted with a suitable approach made in the estimation of the true value in association with the Kalman filtered value. The Smoothening process is made effective in the determination of the exact value of information without noise. The axis is taken at different intervals within the time and valuable consideration. The exact comparison of the true value and the Kalman filtered value is shown in Fig. 8.

Figure 8: Comparison of Kalman filter
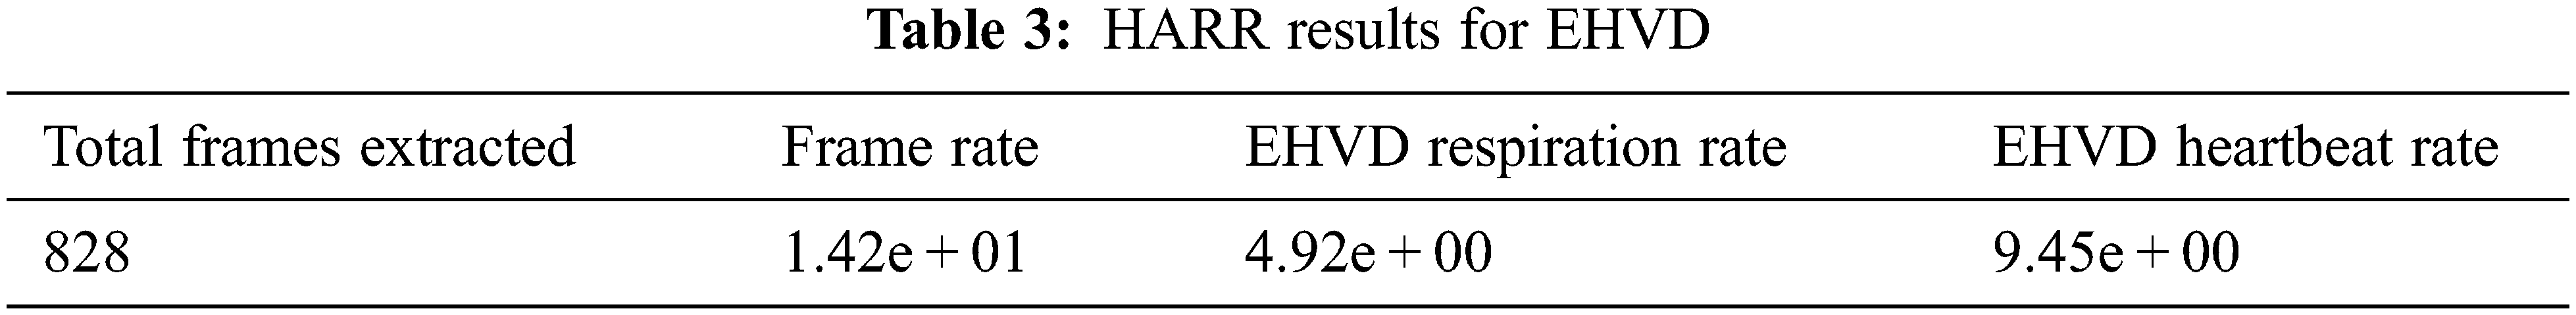
The noise-free signals are subjected to the Enhanced Hilbert vibration decomposition (EHVD) method and the result obtained is illustrated in Fig. 9.

Figure 9: HARR results obtained from EHVD
The parameters are fixed for the values are analysed between the Beats per minutes to heart rate and respiration rate. The peak value is to be detected for identification of the peak points where the pulse is so active. The values obtained from the given sources are shown in Tab. 3.
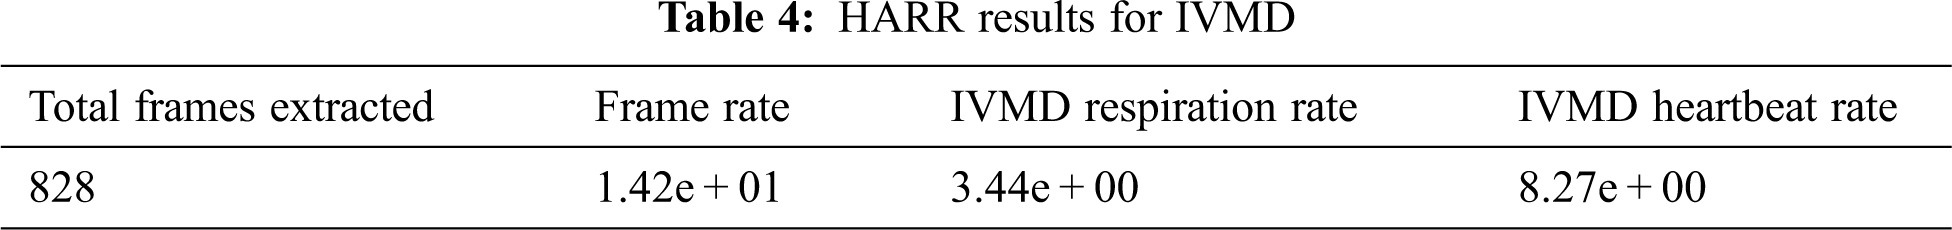
Then the improved variational mode decomposition method is implemented for the determination of the HARR value. The peak value determination shows that the respiration rate and heart beat rate estimation is proved to be more effective in the analysis. This is illustrated in Fig. 10.

Figure 10: HARR results obtained from IVMD
The estimation is made for the values beats per minutes along with the deterministic values. The total values obtained after the experimentation analysis of IVMD are shown in the Tab. 4.
The modified adaptive Fourier decomposition is used for the estimation of the heartbeat and the respiration rate. Here the peak value is identified to be in approximated range in many areas. A form of stability is found in the estimation of signals. The estimation of the HARR value suing MAFD is illustrated in Fig. 11.

Figure 11: HARR results obtained from MAFD5
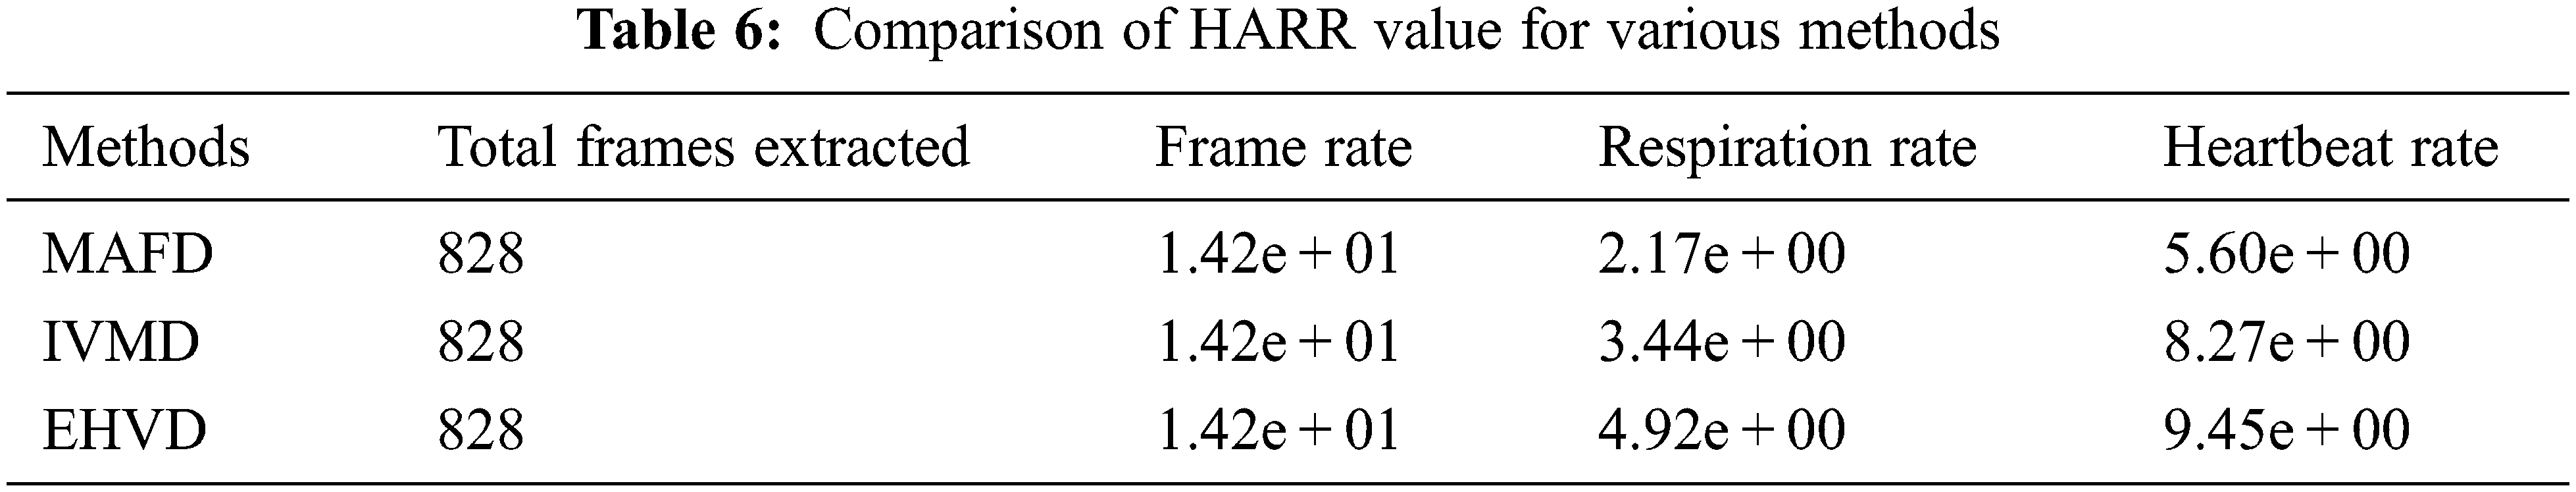
From the overall analysis held with the estimation of HARR value after the implementation of the three various models like IVMD, MAFD, and EHVD, a small variation was identified. The comparison status of the HARR value along with the three models are shown in Tab. 5.
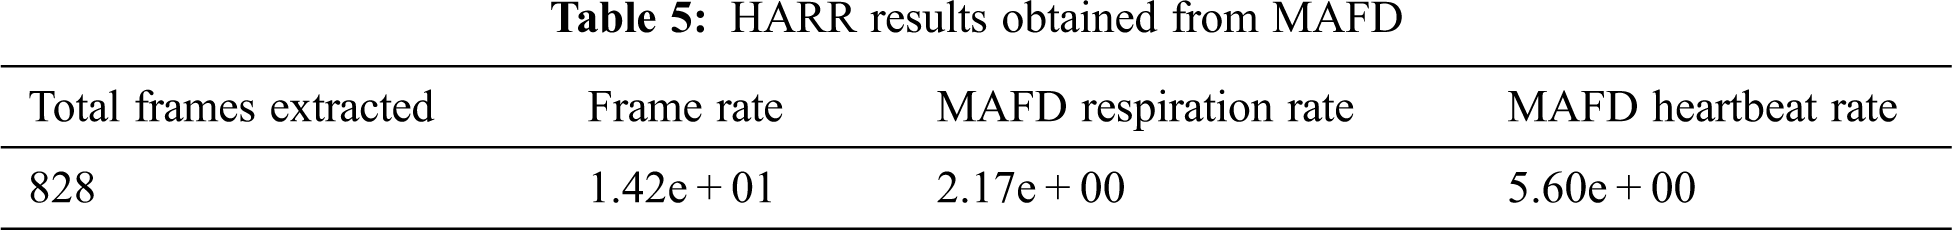
From the above Tab. 6, it is clear that the respiration rate of the MAFD process is 2.17e + 00, for IVMD it is 3.44e + 00 and for EHVD it is 1.42e + 00. Then the heartbeat rate is predicted to be 5.60e + 00 for MAFD and 8.27e + 00 for IVMD and 9.45e + 00 for EHVD. From the obtained values the EHVD possesses better performance in the estimation of heartbeat rate and the respiration rate.
In this research, a video-based HARR measuring framework is proposed based on combined PPG and BCG. Here, the noise from the input video signals is removed by using an adaptive Kalman filter (AKF). Three different algorithms are used for estimating the HARR from the noise-free input signals. Initially, the noise-free signals are subjected to Modified Adaptive Fourier decomposition (MAFD) and then to Enhanced Hilbert vibration decomposition (EHVD) and finally to Improved Variation mode decomposition (IVMD) for attaining three various results of HARR. The experimental analysis proves that the HARR value of the EHVD possess better value when compared with IVMD and MAFD. The performance of the proposed model shall further be improved with a better filter and decomposition algorithm.
Funding Statement: The authors received no specific funding for this study.
Conflicts of Interest: The authors declare that they have no conflicts of interest to report regarding the present study.
References
1. X. Liu, W. Wei, H. Kuang and X. Ma, “Heart rate measurement based on 3D central difference convolution with attention mechanism,” Sensors, vol. 22, no. 2, pp. 688–697, 2022. [Google Scholar]
2. S. Chen, F. Tan, W. Lyu, H. Luo, J. Yu et al., “Deep learning-based ballistocardiography reconstruction algorithm on the optical fiber sensor,” Optics Express, vol. 30, no. 8, pp. 13121–13133, 2022. [Google Scholar]
3. A. S. Oliver, T. Jayasankar, K. R. Sekar, T. K. Devi, R. Shalini et al., “Early detection of lung carcinoma using machine learning,” Intelligent Automation & Soft Computing, vol. 30, no. 3, pp. 32–45, 755–770, 2021. [Google Scholar]
4. X. Chen, X. X. Liu, R. S. Koundal, X. R. Elkin, X. Zhu et al., “Cerebral amyloid angiopathy is associated with glymphatic transport reduction and time-delayed solute drainage along the neck arteries,” Nature Aging, vol. 2, no. 3, pp. 214–223, 2022. [Google Scholar]
5. J. Luo, J. Zhen, P. Zhou, W. Chen and Y. Guo, “An iPPG-based device for pervasive monitoring of multi-dimensional cardiovascular hemodynamics,” Sensors, vol. 21, no. 3, pp. 872–885, 2021. [Google Scholar]
6. J. Cheng, Y. Juan, Y. Xu, C. R. Song, Y. Liu et al., “Prediction of arterial blood pressure waveforms from photoplethysmogram signals via fully convolutional neural networks,” Computers in Biology and Medicine, vol. 5, no. 138, pp. 104877–104889, 2021. [Google Scholar]
7. L. Bai, W. Lei, Y. W. Yi, Y. Wang, Y. Tian et al., “A PdMobimetallene with precise wavelength adjustment and catalysis for synergistic photothermal ablation and hydrogen therapy of cancer at different depths,” Journal of Materials Chemistry, vol. 9, no. 32, pp. 6441–6459, 2021. [Google Scholar]
8. Y. Rong, P. C. Yu, G. Panagiotis, C. Georgios and W. Daniel, “A new principle of pulse detection based on terahertz wave plethysmography,” Scientific Reports, vol. 12, no. 1, pp. 1–15, 2022. [Google Scholar]
9. K. Wu, S. Chunlei, Z. Yuan, S. Wan, L. Wang et al., “Anti-jamming heart rate estimation using a spatial–temporal fusion network,” Computer Vision and Image Understanding, vol. 216, no. 3, pp. 103327–10339, 2022. [Google Scholar]
10. K. Wang and L. Y. Qing, “An analysis of the Viola-Jones face detection algorithm,” Image Processing on Line, vol. 4, no. 9, pp. 128–148, 2014. [Google Scholar]
11. M. Kumar, A. Mayank, A. Veeraraghavan and A. Sabharwal, “DistancePPG: Robust non-contact vital signs monitoring using a camera,” Biomedical Optics Express, vol. 6, no. 5, pp. 1565–1588, 2015. [Google Scholar]
12. C. Wang, T. Chen, G. T. Pun and G. Chanel, “A comparative survey of methods for remote heart rate detection from frontal face videos,” Frontiers in Bioengineering and Biotechnology, vol. 6, no. 33, pp. 271–27–83, 2014. [Google Scholar]
13. N. L. Ningqi, W. Dai, C. Li, Z. Zhou, L. Lu et al., “Flexible piezoresistive sensor patch enabling ultralow power cuffless blood pressure measurement,” Advanced Functional Materials, vol. 26, no. 8, pp. 1178–1187, 2016. [Google Scholar]
14. S. Zafraniec, H. Hannah, J. Jose, M. Valdez, E. Iffrig et al., “Feature tracking microfluidic analysis reveals differential roles of viscosity and friction in sickle cell blood,” Lab on a Chip, vol. 22, no. 8, pp. 1565–1575, 2022. [Google Scholar]
15. H. Kim, G. N. Hye, S. G. Yu, S. Eui Kim and E. Chul Lee, “Non-contact oxygen saturation measurement using ycgcrcolor space with an RGB camera,” Sensors, vol. 21, no. 18, pp. 6120–6135, 2021. [Google Scholar]
16. J. Speth, N. Jeremy, P. N. Vance, K. K. Bowyer and A. Czajka, “Unifying frame rate and temporal dilations for improved remote pulse detection,” Computer Vision and Image Understanding, vol. 4, no. 210, pp. 103–121, 2021. [Google Scholar]
17. Y. Chenglong and J. Steven, “Mechanisms underlying limited soil carbon gains in perennial and cover-cropped bioenergy systems revealed by stable isotopes,” GCB Bioenergy, vol. 12, no. 1, pp. 101–117, 2020. [Google Scholar]
18. E. Vavrinsky, E. Erik, M. N. E. Esfahani, V. M. Hausner, A. Kuzma et al., “The current state of optical sensors in medical wearables,” Biosensors, vol. 12, no. 4, pp. 217–223, 2022. [Google Scholar]
19. Y. Guo, W. Jin, Z. Guo and Y. He, “Iterative differential autoregressive spectrum estimation for Raman spectrum denoising,” Journal of Raman Spectroscopy, vol. 53, no. 1, pp. 148–165, 2022. [Google Scholar]
20. S. Maqsood, S. Sumbal, S. S. Xu, M. S. Tran, K. Saurabh et al., “A survey: From shallow to deep machine learning approaches for blood pressure estimation using biosensors,” Expert Systems with Applications (2022vol. 4, no. 9, pp. 116788–116795, pp. 2022. [Google Scholar]
21. L. Lin, C. Chen, L. Pan, J. Zhang and Y. Xiang, “SoK: An overview of PPG’s application in authentication,” arXiv preprint, vol. 21, no. 5, pp. 2201–2225, 2022. [Google Scholar]
22. W. Wang, H. Zhang, C. Yang and C. Hu, “Experimental analysis of flow instability detection in a centrifugal compressor using variational mode decomposition,” The Aeronautical Journal, vol. 4, no. 21, pp. 1–25, 2022. [Google Scholar]
23. X. Liu, M. Pedersen and R. Wang, “Survey of natural image enhancement techniques: Classification, evaluation, challenges, and perspectives,” Digital Signal Processing, vol. 22, no. 7, pp. 103547–103558, 2022. [Google Scholar]
24. Z. Zhang and W. C. Hong, “Application of variational mode decomposition and chaotic grey wolf optimizer with support vector regression for forecasting electric loads,” Knowledge-Based Systems, vol. 228, no. 9, pp. 107297–107318, 2021. [Google Scholar]
25. S. Yu and J. Ma, “Complex variational mode decomposition for slop-preserving denoising,” IEEE Transactions on Geoscience and Remote Sensing, vol. 56, no. 1, pp. 586–597, 2017. [Google Scholar]
26. A. Babiker, C. Abdalla, Q. C. Yan, J. Q. Li, A. J. Meng et al., “Initial fault time estimation of rolling element bearing by backtracking strategy, improved VMD and infogram,” Journal of Mechanical Science and Technology, vol. 35, no. 2, pp. 425–437, 2021. [Google Scholar]
27. W. Wei, J. Tang, N. Zhao, X. Liu, X. Y. Zhang et al., “Joint precoding optimization for secure SWIPT in UAV-aided NOMA networks,” IEEE Transactions on Communications, vol. 68, no. 8, pp. 5028–5040, 2020. [Google Scholar]
28. J. Zheng, J. Jinde, Y. J. Cheng and Y. Yang, “Partly ensemble empirical mode decomposition: An improved noise-assisted method for eliminating mode mixing,” Signal Processing, vol. 96, no. 8, pp. 362–374, 2014. [Google Scholar]
29. S. Haldar, Y. Susanta, Y. Y. Zhang, S. Y. Xia, B. Islam et al., “Mechanistic insights into the ligand-induced unfolding of an RNA G-Quadruplex,” Journal of the American Chemical Society, vol. 6, no. 22, pp. 322–336, 2022. [Google Scholar]
Cite This Article
 Copyright © 2023 The Author(s). Published by Tech Science Press.
This work is licensed under a Creative Commons Attribution 4.0 International License , which permits unrestricted use, distribution, and reproduction in any medium, provided the original work is properly cited.
 Downloads
 Citation Tools