
 Submit a Paper
 Propose a Special lssue
 Open Access
ARTICLE

SNCDM: Spinal Tumor Detection from MRI Images Using Optimized Super-Pixel Segmentation
1 Department of Electronics and Instrumentation Engineering, Saveetha Engineering College, Chennai, Tamilnadu, India
2 Department of Electronics and Communication Engineering, Saveetha Engineering College, Chennai,Tamilnadu, India
3 Department of Electronics and Communication Engineering, Tagore Engineering College, Chennai, Tamilnadu, India
* Corresponding Author: T. Merlin Inbamalar. Email:
Intelligent Automation & Soft Computing 2023, 36(2), 1899-1913. https://doi.org/10.32604/iasc.2023.031202
Received 12 April 2022; Accepted 12 May 2022; Issue published 05 January 2023
 View Full Text
 Download PDF
Abstract
Conferring to the American Association of Neurological Surgeons (AANS) survey, 85% to 99% of people are affected by spinal cord tumors. The symptoms are varied depending on the tumor’s location and size. Up-to-the-minute, back pain is one of the essential symptoms, but it does not have a specific symptom to recognize at the earlier stage. Numerous significant research studies have been conducted to improve spine tumor recognition accuracy. Nevertheless, the traditional systems are consuming high time to extract the specific region and features. Improper identification of the tumor region affects the predictive tumor rate and causes the maximum error-classification problem. Consequently, in this work, Super-pixel analytics Numerical Characteristics Disintegration Model (SNCDM) is used to segment the tumor affected region. Estimating the super-pixels of the affected region by this method reduces the variance between the identified pixels. Further, the super-pixels are selected according to the optimized convolution network that effectively extracts the vertebral super-pixels features. Derived super-pixels improve the network learning and training process, which minimizes the maximum error classification problem also the efficiency of the system was evaluated using experimental results and analysis.Keywords
Development of the abnormal tissues in the spinal column or spinal cord [1] is a spinal tumor. These abnormal tissues are grown uncontrollably, influencing and controlling normal cell growth. The spinal tumor [2] has two subtitles primary and secondary tumors. The spinal cord originated abnormal cells are primary and cancer spreading from another region to the spine is a secondary or metastatic tumor. The tumors are identified in two ways: region (sacrum, lumbar, thoracic, and cervical) and locations (Intradural-extramedullary,Intramedullary, and Extradural) [3]. The intradural tumors have occurred in the thin region of the spinal cord, around 40% [4]. The intramedullary tumor cells are developed inside the cord obtained from ependymal cells, and 5% in frequency of occurrence [5]. Then, extradural is located outside of the dura, and 55% [6] is the frequency of occurrence. These abnormal tissues encompass the nerve roots. In addition to this, bone metastasis is one of the general bony spinal which experience almost 30% to 70% of patients [7]. The bone spine is vertebral hemangiomas are benign lesions that have rare symptoms like pain. Lower or middle back pain is the most common spinal tumor symptom [8]. The back pain not only occurred by injuries; it also happened physical and stress activities. The main spread from the back to the legs, hips, arms, and feet aggravates over time. Additionally, a spine tumor has several symptoms: muscle weakness, sensation loss, stiff back, neurological symptoms, walking difficulties, sensitivity loss, paralysis, and scoliosis [9].
Once the patient suffers from these symptoms, a medical examination must require to diagnose spinal tumors. The radiological tests [10] include computed tomography (CT scan), X-ray, Magnetic Resonance Imaging (MRI), and Bone Scan. These radiological experiments investigated the inner details that help to identify the tumor types. However, a biopsy [11] needs to diagnosis the unclear findings to maximize the treatment procedures. During the treatment, abnormal tissues or neoplasms are classified by examining spinal canal involvement, soft tissues, and bony. Then, abdomen and lung scanning are suggested to confirm the spine tumors. The manual medical examination consumes more time as well as failure to identify the exact affected area. Therefore, various medical analysis is performed to create an automated computer-aided system for detecting the spine tumor [12]. The computerized system utilizes radiological images to achieve clinical examination using image processing and machine learning techniques. The automated system utilizes the MRI images [13] to detect the spine tumor because the MRI images can identify the tumor position, size, and type with minimum effort. It can discriminate the normal small tissues and tissue density changes and mutations linked with tumors. The main reason for choosing an MRI image is, it does not have any ionizing radiation. The captured MRI images are investigated by segmentation techniques [14] that predict the spine modalities, which helps identify the tumor issues accurately.
The image segmentation process identifies the affected region by minimizing the manual delineation time consumption. The segmenting process locates the density changed tissues by contouring the MRI images. This process identifies the irregular boundaries and tissue interest variation from images effectively. Although, the exact tumor detection is a complex task while overlapping between the normal and abnormal tissues. Then most of the tissues are heterogeneous in tumor size, shape, appearance, and position, so the abnormal tissues [15] affect average tissue growth. The MRI high-resolution images are needs high computational resources and memory to segment the affected region. Different types of methods were introduced to overcome the spinal MRI image segmentation process. The segmentation process decomposes the images into 2D slices processed sequentially while training the MRI image features. The second method decomposes the images into patches that effectively process the volumetric data. However, the traditional techniques are facing difficulties while investigating image topological changes like splitting and merging issues. This causes slow convergence and optimal local problems, which reduces the overall tumor detection accuracy.
Several researchers utilize advanced techniques that include integrating machine learning and swarm intelligent techniques to resolve the convergence issues. The swarm techniques optimize the system’s performance by updating the network parameters, and the global solution is obtained during the updating process. However, the region interest intensity should be identified to improve the recognition accuracy. For this, an intense training set is needed to enhance the system performance with minimum difficulties. Thus the primary intention of this study is to improve the tumor segmentation accuracy with minimum complexity. In this paper, the super-pixel analytics Numerical characteristics Disintegration Model (SNCDM) approach is utilized. The SNCDM approach segments the region based on the super-pixels that minimize the variance between the identified pixels. The vertebral super-pixel is examined that extracts the spinal features based on the super-pixel using the optimized convolution neural networks. This process reduces the maximum inaccurate segmentation problem (MIS) successfully. The effectiveness of the system is evaluated using MATLAB tool with respective performance metrics.
Then the rest of the paper is organized as follows; Section 2 discusses the various researchers’ analyses about spinal tumor detection—Section 3 analyzes the SNCDM method-based spinal tumor detection framework. Section 4 evaluates the effectiveness of the system discussed, and the conclusion is summarized in Section 5.
Alafri 2019 [16] recommended deep neural networks to detect lumbar spinal stenosis from MRI images. The method investigates the boundary of the spine images according to the lumbar spine characteristics. The method uses the network layers that classifies the changes in MRI image. The method maintains the system’s consistency, quality, and confidence while segmenting the affected region. In addition, the Jaccard metric shows that the deep learning approach has highly differentiated the normal and abnormal tissues in MRI images.
Liu, et al., 2019 [17] apply convolution neural network technique to identify and detect the lumbar in MRI images. The method uses the convolute layers that speed up the computation process and store the memory. The method derives the S1 shapes from the spine image, and L1-L5 features are extracted from the round region. The discussed system attains 98.9% of accuracy while detecting Lumbar.
In MRI image analysis, Alam et al., 2019 [18] introduced fuzzy c-means clustering to detect brain tumors. Initially, the image grey level intensity value is estimated, which helps to identify the cluster center. Then fuzzy membership values are computed to group the similar pixel, and this computation is updated according to the membership values. The clustered details are investigated to extract entropy, energy, contrast, homogeneity, dissimilarity, correlation, and entropy value. According to these features, the affected tumor region was detected with minimum time.
Chmelik et al., 2018 [19] detected spinal lesions from 3D CT data by applying the deep convolutional network. Here, convolution networks are utilized to extract the automatic features without depending on the patient’s activities. The extracted features are processed by a random forest approach that classifies the lesion region. Then medial axis transform is applied to improve the overall segmentation approach.
Anter et al., 2019 [20] applying neutrosophic fuzzy c-means and adaptive watershed algorithm to segment the tumor region from CT liver image. The CT images are processed by median filter and histogram equalization approach to eliminate noise and improve the quality of the image. Then, a clustering algorithm is applied to differentiate the image regions. Here, morphological and adaptive threshold values are utilized to determine the segmenting strategies. This process ensures 95% of accuracy and minimum time while segmenting the tumor-affected region.
Punarselvam et al., 2019 [21] analyzed MRI spine images for detecting tumors by applying the soft computing and finite element approaches. The gathered MRI images are continuously analysed to detect the boundary lines. The region boundaries are predicted using different methods like Roberts, Prewitt, Sobel, and canny edges. The predicted edges are smoothened by noise removal techniques that help to improve the overall spine tumor detection accuracy. In addition to this, the method investigating the L4 and L5 lumbar predicts changes in spinal structure effectively.
Jena et al., 2020 [22] recommend a canny, morphological, and Sobel (CMS) edge detection approach to predict image edges. The method uses mathematical operators to identify the edges in the color and greyscale images. The extracted edges are more powerful to derive the affected region. The obtained results are compared with Laplacian of Gaussian, Roberts, Sobel, and Prewitt detection approaches.
Reza et al., 2019 [23] segmenting tumor region from spine MRI images using cascaded convolution neural networks. This paper uses the auto context model that uses the learners to identify the tumor voxel and fine-tuning procedure applied to classify the tumor region. The method predicts the correlation between the features with maximum accuracy and minimum deviations. According to the various researcher’s analyses, the MRI image segmentation is performed by applying different image processing and machine learning techniques. However, the existing approaches consume more time and create a segmentation problem. Therefore, in this paper, Super-pixel analytics Numerical characteristics Disintegration Model (SNCDM) is utilized to improve the overall segmentation accuracy. The detailed working process of this study is illustrated in Section 3.
3 Spinal Tumor Detection Using SNCDM Framework
The SNCDM framework-based spinal tumor prediction process is illustrated in Fig. 1. This system aims to overcome the maximum inaccurate segmentation problem (MIS) by segmenting the relevant region from an MRI image. The images are investigated via super pixels because it helps to identify the pixel characteristics during the segmentation. The super pixel identifies the relationship between the pixels, ensuring the changes in region intensity, position, and size. The successive identification of the affected region solves the maximum error classification while classifying the spinal tumor. The SNCDM framework is illustrated in Fig. 1.

Figure 1: SNCDM framework
The captured spinal cord images are analyzed by elliptical Fourier descriptors used to get the vertebral shape. This process does not consider the aliasing issues in different resolution images but produces continuous descriptors. The captured spinal cord image
The
The descriptor coefficients are derived from the trigonometry computation of angular frequency (
The coefficients
From the investigated regions in
The derived coefficients are more valuable to identify the super-pixel (SP) in the spinal image. The SP computation helps to get the features from the images by considering the image boundaries, shapes, and location characteristics. This process converts the images into a sequential representation which helps to identify the exact tumor affected region. Here, the
In the image, the
The super-pixel
According to this computation, the loss function (Eq. (8)) is computed from the property of interest and super-pixel spatially compact.
The loss function (

Figure 2: Super-pixel identification process using convolution networks
With the help of the computed super-pixel, vertebral features are extracted to identify the affected region precisely. For each super-pixel, a set of features are extracted that helps to quantify the pixel orientation, position, and shape. Initially, orientation and position-related features are extracted concerning the super-pixel. The super-pixel centroid value

Figure 3: Orientation and position feature analysis
After that, complexity features such as fractal and shape information is retrieved from the MRI spinal image. Generally, the MRI images are obtained from a specific orientation and frame, which helps derive the complexity features with minimum cost. Here, fractal features

Figure 4: Complexity feature extraction process
The maximum error-rate classification problem is reduced by applying the effective training process. Consider, the training set has a set of images
For the entire super-pixel relative training process illustrated with respective parameter settings
The successful computation of these training parameters generate S value and the collective training response shown in Eq. (11)
From the derived
Then the collective response of the feature set for the entire super-pixel is denoted as,
The extracted features
The derived features and labels are fed into the convolution network that uses the softmax activation function to classify the tumor-affected region effectively. According to the above process, training is performed with minimum computation complexity. The training process requires network parameter updating, which is done by applying the genetic bee optimization algorithm—the network parameter updating working according to the genetic and bee algorithm characteristics. The algorithm uses the onlooker, employee, and scout bees that choose the optimized parameters. The parameters are selected in a specific population space
Here, a solution is to get from minimum (
The selected solution probability value is computed to identify the best parameter, using Eq. (17).
This updating process reduces the binary optimization problem and the selected criteria defined in Eq. (18).
The choice principles are defined based on the uniformly distributed values of
The effectiveness of introduced Super-pixel analytics Numerical characteristics Disintegration Model (SNCDM) based tumor region segmentation is discussed in this section. This work uses the Lumbar Spine MRI Dataset information to apply the introduced SNCDM framework.
The dataset has a collection of MRI images captured from 515 patients who were having back pain. The MRI images are scanned in axial view or sagittal view of vertebrae, and each patient is instructed to scan many times. MRI images are taken in the axial view’s three most small vertebra details: one between the last and sacrum vertebrae. In most cases, the orientation of the vertebra should be considered while scanning the patient’s spine. The total number of slices is varied from 12 to 15; in most cases, it can vary up to 20 slices. According to the instrumental setup and technical analysis, around 48345 MRI images are scanned. The scanned images are 320*310 resolution. The pixels have a 12-bit pixel precision value more significant than the standard greyscale images (8 bit). The straight and perpendicular pixel spacing is 0.6875 mm, and the adjacent slice is 4.4 mm. The patients are clinically examined, and the MRI images are recorded in the head-first supine position. In the resting stage, feet-first supine position related MRI images is taken. Therefore, this clinical analysis uses has 15 to 45-minute duration to record patient spinal details. Then the sample spinal cord images are illustrated in Fig. 5.

Figure 5: Sample spine MRI images
The collected images are processed by applying the above-discussed approaches, which recognize the super-pixels from the image. Then various features are extracted to get the tumor details that help to predict the tumor region. The identified region is more useful in post-processing. Then the created system effectiveness is evaluated using different performance metrics such as Jaccard Index (JI), Dice similarity, sensitivity, specificity, accuracy, recall, and precision metrics. These metrics are computed using the below equations.
The Tab. 1 clearly illustrates that the introduced Super-pixel analytics Numerical characteristics Disintegration Model (SNCDM) based tumor region segmentation attains higher accuracy (accuracy-98.9%, specificity-98.7%, precision–98.7%, recall-99%, and specificity-99.4%). The obtained SNCDM approach results are higher compared to the other existing methods discussed in related works. The introduced method uses the training set that consists of a set of MRI images

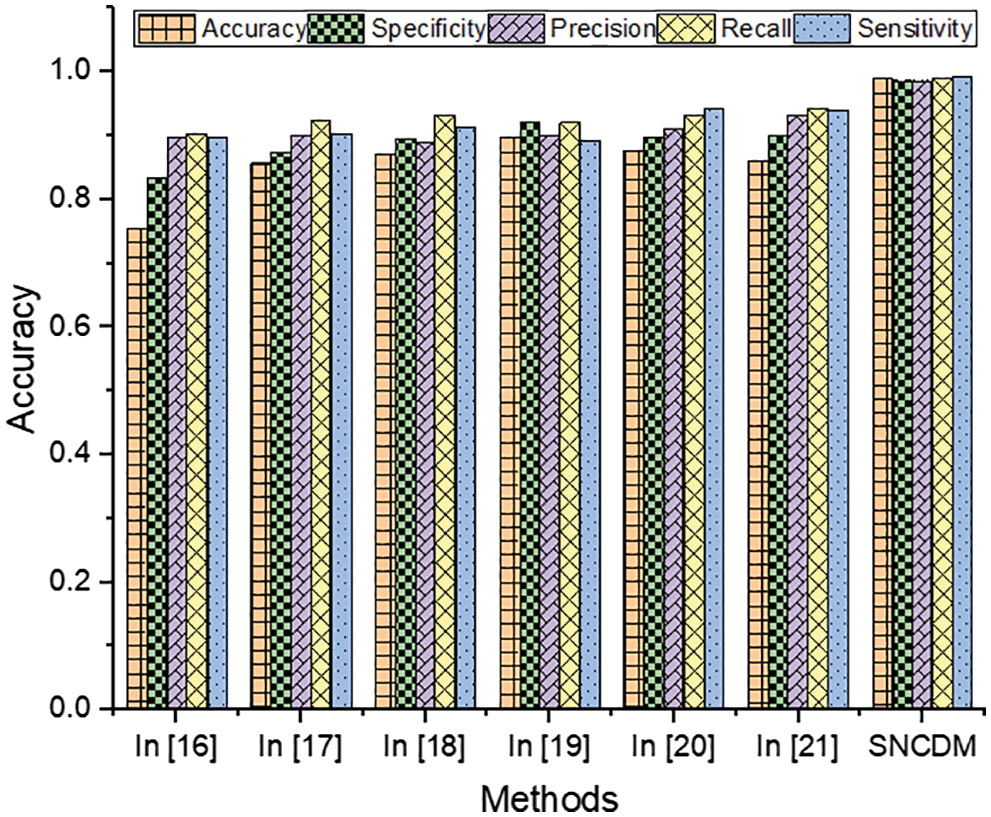
Figure 6: Efficiency of segmentation techniques
From the Fig. 6, it clearly shows that introduced SNCDM system attains the high efficiency while classifying the MRI images. The successful identification of each pixels and relationship between the pixels according to the properties. Here, the image descriptors are identified based on various image directions with cosine
These metrics are utilized to perform the SNCDM approach is compared with various methods in terms of number of superpixels and number of patients. The obtained results are illustrated in Fig. 7.
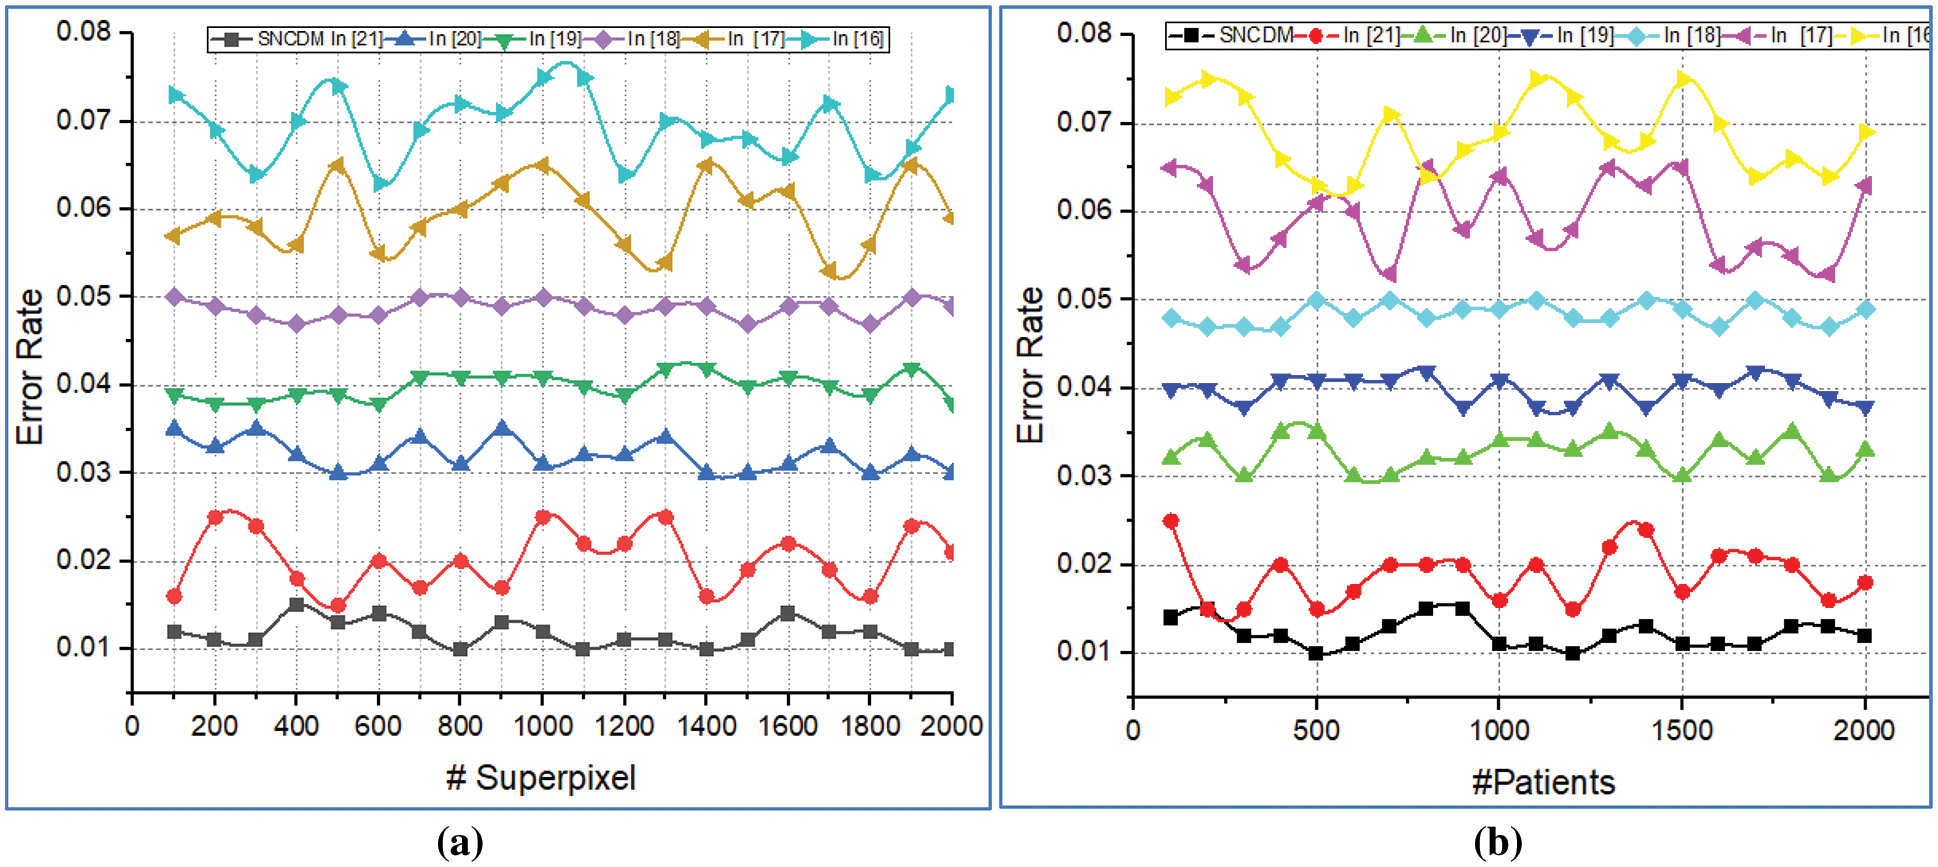
Figure 7: Error rate analysis of (a) # Superpixels (b) # Patients
Fig. 7 illustrates that the error rate analysis introduced SNCDM approach with several existing approaches. Here the comparison is made with the number of super pixels and number of patients. The system consumes minimum error rate while analysing the super pixel on given MRI images. The method continuously update the network parameters according to the genetic bee operators. The network utilizes the
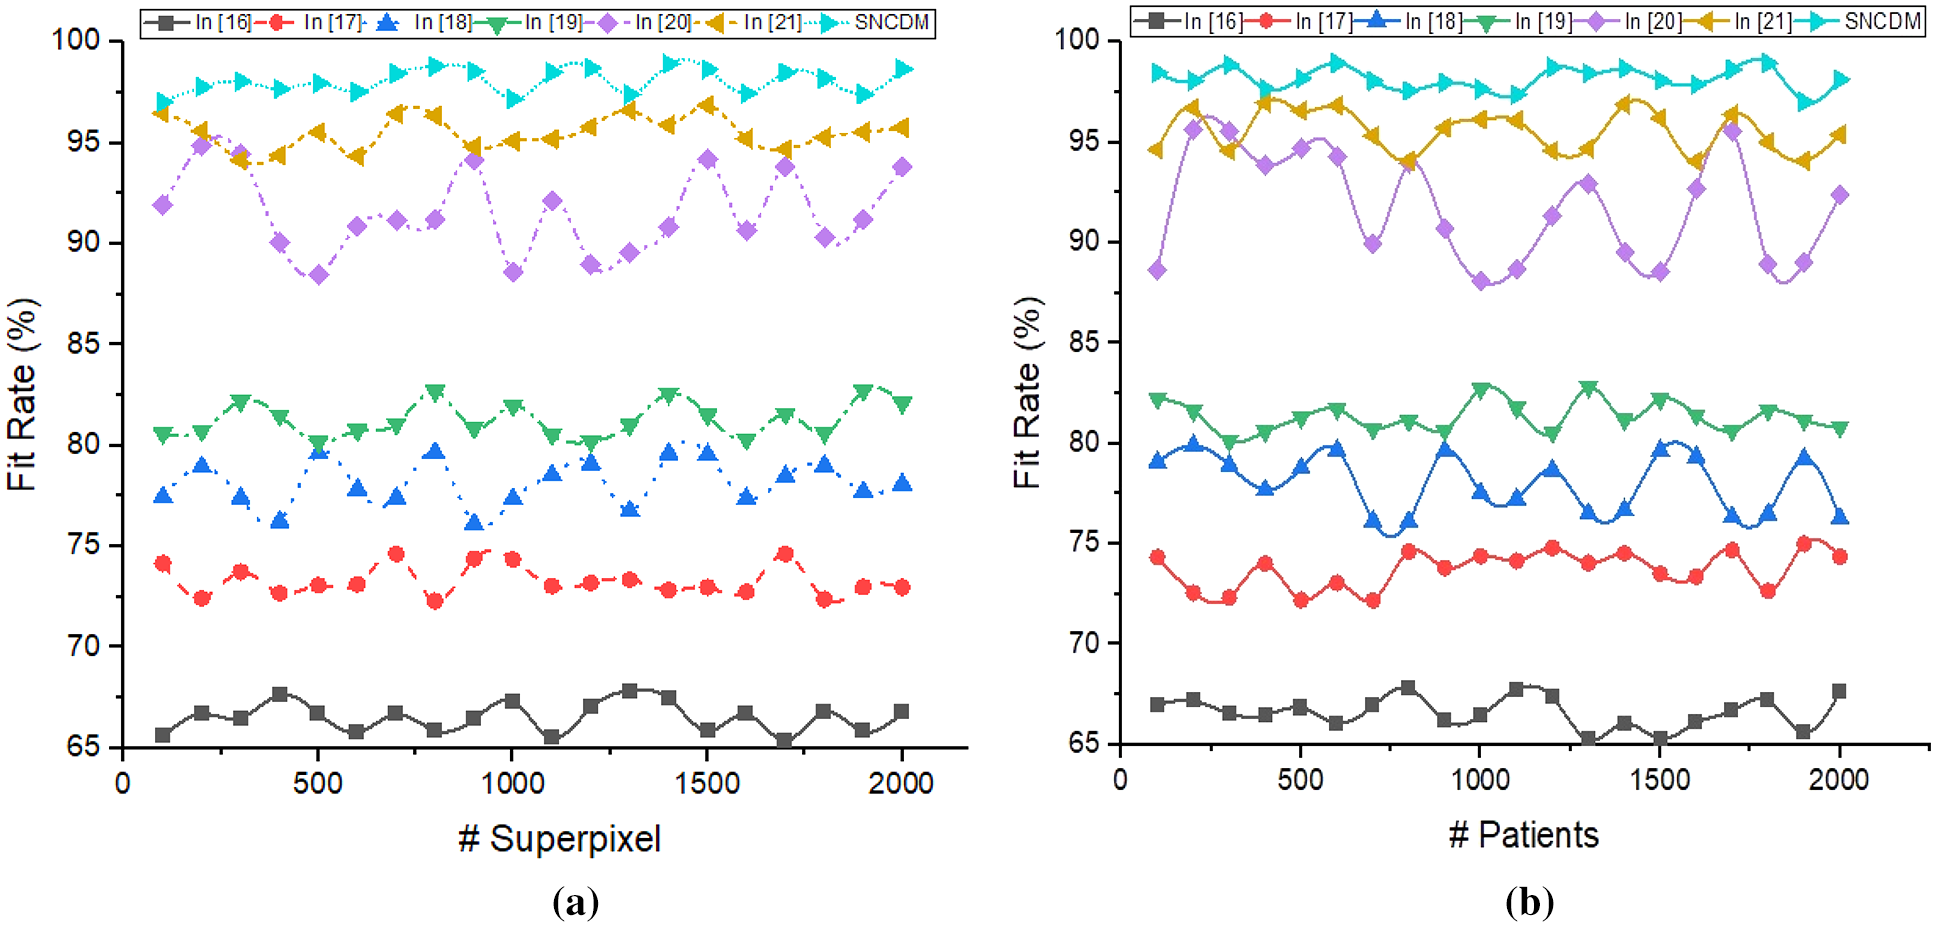
Figure 8: Fit rate analysis of (a) # Superpixels (b) # Patients
Fig. 8 illustrated that the fit rate analysis of different segmentation process such as [16–21] and introduced SNCDM. The method predicts the image coordinates with respective super pixel values


The proposed SNCDM maximize the region identification accuracy (98.04%) on number of super pixel identification from MRI images. The identified regions are more similar to the expected outcome that is identified in Jaccard Index (0.978%) and Dice Score (0.97%).
According to the above discussions, the optimized Super-pixel analytics Numerical characteristics Disintegration Model (SNCDM) algorithm successfully matches the trained tumor region with test tumor region while predicting the spinal tumor. The effective recognition of spinal tumor manages the system reliability, scalability and efficiency.
Thus the paper analyzing the Super-pixel analytics Numerical characteristics Disintegration Model (SNCDM) based spinal tumor segmentation process. In this work uses the Lumbar Spine MRI Dataset information which are processed by applying the introduced machine learning approach. The gathered images are investigated in both axis to obtain the Fourier descriptors. The derived descriptors further examined to obtain the super-pixels which match with other pixels presented in the image. Then, different features such as complexity and shape related information extracted to classify the tumor relevant pixels successfully. The segmentation performance improved because of effective training process with respective labels. Then the efficiency of the system evaluated using experimental results in which system attains high recognition accuracy and minimum error rate. In future, the effectiveness of the system improved by applying the optimized segmentation techniques.
Funding Statement: The authors received no specific funding for this study.
Conflicts of Interest: The authors declare that they have no conflicts of interest to report regarding the present study.
References
1. V. Hauwe, L. Luc, C. Pia, S. Sundgren and E. Flanders, “Spinal trauma and spinalcord injury (SCI),” Diseases of the Brain, Head and Neck,” Spine, vol. 2, pp. 2020–2023, 2020. [Google Scholar]
2. X. Zheng, X. Qi, J. Fenghuangand A. Wu, “Prognosticnomograms to predict overall survival and cancer-specific survival in sacrum/pelvic chondrosarcoma (SC) patients: A population-based propensity score–matched study,” Clinical Spine Surgery, vol. 34, no. 3, pp. 177–185, 2021. [Google Scholar]
3. C. Chhabra, S. Shobhit, B. More, D. Ranade and P. Punia, “Clinical profile, management and surgical outcome of spinal cord tumors,” International Surgery Journal, vol. 8, no. 10, pp. 3013–3018, 2021. [Google Scholar]
4. H. Hwang, S. Hwan, H. Park and C. Chung, “How to approach anatomical compartment: Intradural pial-extrapialtumor,” Surgery of Spinal Cord Tumors Based on Anatomy, vol. 112, pp. 111–120, 2021. [Google Scholar]
5. R. Y. Shih and K. K. Koeller, “Intramedullary masses of the spinal cord: Radiologic-pathologic correlation,” RadioGraphics, vol. 40, pp. 1125–1145, 2020. [Google Scholar]
6. L. Jun and C. Chung, “How to approach anatomical compartment; extradural intracanal tumor,” in Surgery of Spinal Cord Tumors Based on Anatomy, vol. 110, pp. 77–84, 2021. [Google Scholar]
7. W. Patrick, S. Shotaro, N. Naganawaand T. Moritani, “Primary and metastatic spine tumors, “ In Diffusion-Weighted MR Imaging of the Brain, Head and Neck, and Spine, vol. 105, pp. 803–838, 2021. [Google Scholar]
8. X. R. Zhang, X. Sun, W. Sun, T. Xu and P. P. Wang, “Deformation expression of soft tissue based on BP neural network,” Intelligent Automation & Soft Computing, vol. 32, no. 2, pp. 1041–1053, 2022. [Google Scholar]
9. J. Jankovic, F. Josephand E. Lang, “Diagnosis and assessment of Parkinson disease and other movement disorders,” Bradley’s Neurology in Clinical Practice E-Book, vol. 10, pp. 175–198, 2020. [Google Scholar]
10. K. Khalid, H. Muzammil, H. Mohammed, l. Ghamdi and T. Khalid, “A comparative systematic literature review on knee bone reports from mri, x-rays and ct scans using deep learning and machine learning methodologies,” Diagnostics, vol. 10, no. 8, pp. 518–531, 2021. [Google Scholar]
11. C. Paola, P. Kapetas, A. Stöttinger, A. Bumberger and P. Baltzer, “A risk stratification algorithm for lesions of uncertain malignant potential diagnosed by vacuum-assisted breast biopsy (VABB) of mammographic microcalcifications,” European Journal of Radiology, vol. 135, pp. 109–128, 2021. [Google Scholar]
12. S. R. Zhou and B. Tan, “Electrocardiogram soft computing using hybrid deep learning CNN-ELM,” Applied Soft Computing, vol. 86, pp. 198–209, 2020. [Google Scholar]
13. A. Alhassanand W. Zainon, “BAT algorithm with fuzzy C-ordered means (BAFCOM) clustering segmentation and enhanced capsule networks (ECN) for brain cancer MRI images classification.” IEEE Access, vol. 8, pp. 201741–201751, 2021. [Google Scholar]
14. A. Alsiddiky, A. Abdulmonem, W. Awwad, K. Bakarman and M. Mahmoud, “Magnetic resonance imaging evaluation of vertebral tumor prediction using hierarchical hidden Markov random field model on Internet of Medical Things (IOMT) platform,” Measurement, vol. 159, pp. 821–851, 2019. [Google Scholar]
15. D. Zhang, J. Hu, F. Li, X. Ding, A. K. Sangaiah et al., “Small object detection via precise region-based fully convolutional networks,” Computers, Materials and Continua, vol. 69, no. 2, pp. 1503–1517, 2021. [Google Scholar]
16. A. Alafri, “Boundary delineation of mriImages for lumbar spinal stenosis detection through semantic segmentation using deep neural networks,” IEEE Access, vol. 7, pp. 43487–43501, 2019. [Google Scholar]
17. Y. Liu and Y. Chen, “Automatic lumbar mri detection and identification based on deep learning,”Journal Digit Imaging, vol. 32, pp. 513–520, 2019. [Google Scholar]
18. W. Wang, H. Liu, J. Li, H. Nie and X. Wang, “Using CFW-net deep learning models for X-ray images to detect COVID-19 patients,” International Journal of Computational Intelligence Systems, vol. 14, no. 1, pp. 199–207, 2021. [Google Scholar]
19. C. Chmelik, J. Jiri, R. Jakubicek and G. Gavelli, “Deep convolutional neural network-based segmentation and classification of difficult to define metastatic spinal lesions in 3D CT data,” Medical Image Analysis, vol. 49, pp. 76–88, 2018. [Google Scholar]
20. S. He, Z. Li, Y. Tang, Z. Liao, F. Li et al., “Parameters compressing in deep learning,” Computers Materials & Continua, vol. 62, no. 1, pp. 321–336, 2020. [Google Scholar]
21. P. Punarselvam and P. Suresh, “Investigation on human lumbar spine mriimage using finite element method and soft computing techniques,” Cluster Computing, vol. 22, no. 6, pp. 13591–13607, 2019. [Google Scholar]
22. J. Jena, K. Kumar, S. Mishra and S. Mishra, “An algorithmic approach based on cmsedge detection technique for the processing of digital images,” in Examining Fractal Image Processing and Analysis, vol. 21, pp. 252–272, 2020. [Google Scholar]
23. R. Reza, D. Parkand A. Butman, “Cascaded convolutional neural networks for spine chordoma tumor segmentation from MRI,” Medical Imaging 2019: Biomedical Applications in Molecular, Structural, and Functional Imaging, vol. 10953, pp. 1095–1125, 2019. [Google Scholar]
Cite This Article
 Copyright © 2023 The Author(s). Published by Tech Science Press.
This work is licensed under a Creative Commons Attribution 4.0 International License , which permits unrestricted use, distribution, and reproduction in any medium, provided the original work is properly cited.
 Downloads
 Citation Tools