
 Submit a Paper
 Propose a Special lssue
 Open Access
ARTICLE

Moth Flame Optimization Based FCNN for Prediction of Bugs in Software
Department of CSE, Noorul Islam Center for Higher Studies, 629180, Tamil Nadu, India
* Corresponding Author: C. Anjali. Email:
Intelligent Automation & Soft Computing 2023, 36(2), 1241-1256. https://doi.org/10.32604/iasc.2023.029678
Received 09 March 2022; Accepted 12 April 2022; Issue published 05 January 2023
 View Full Text
 Download PDF
Abstract
The software engineering technique makes it possible to create high-quality software. One of the most significant qualities of good software is that it is devoid of bugs. One of the most time-consuming and costly software procedures is finding and fixing bugs. Although it is impossible to eradicate all bugs, it is feasible to reduce the number of bugs and their negative effects. To broaden the scope of bug prediction techniques and increase software quality, numerous causes of software problems must be identified, and successful bug prediction models must be implemented. This study employs a hybrid of Faster Convolution Neural Network and the Moth Flame Optimization (MFO) algorithm to forecast the number of bugs in software based on the program data itself, such as the line quantity in codes, methods characteristics, and other essential software aspects. Here, the MFO method is used to train the neural network to identify optimal weights. The proposed MFO-FCNN technique is compared with existing methods such as AdaBoost (AB), Random Forest (RF), K-Nearest Neighbour (KNN), K-Means Clustering (KMC), Support Vector Machine (SVM) and Bagging Classifier (BC) are examples of machine learning (ML) techniques. The assessment method revealed that machine learning techniques may be employed successfully and through a high level of accuracy. The obtained data revealed that the proposed strategy outperforms the traditional approach.Keywords
The quality and stability of computer software have grown increasingly significant and critical as the functionality of computer operations has gotten more important and intricate in modern civilization. As the need for software grows, so does the amount, complexity, and importance of the code. The amount of the code increase, the quantity of flaws in the program grows as well (Felix, E.A et al., 2020) [1]. Except a software module contains a large number of bugs that severely limit its functioning, it is said to be bug-prone. One strategy for boosting the efficiency and efficacy of software testing is software bug prediction [2]. Bug prediction includes acquiring bug data, selecting an appropriate model based on the data, arranging input data in terms of time, applying statistical techniques to the reliability model, and analyzing the projected effects. Bug prediction has been a primary focus of software reliability growth models. Our research will focus on a variety of aspects of software bug prediction. During the life cycle’s development phase, which also includes planning, deployment, design, testing, problem assessment, development, along with continuation, as well as software development life cycle models, machine learning techniques are used to anticipate software bugs. Machine learning techniques and statistical analysis may both be used to anticipate bugs (Saharudin, S.N et al., 2020) [3]. During the software development process, many approaches are employed to get better excellence. The objective of this research is to be able to estimate the number of bugs in software ahead of time utilizing software data such as the characteristics, methods, number of lines of code, and other significant software aspects [4]. We’ll also analyze the datasets utilized in the model, as well as commonly used software metrics and performance criteria for the model’s evaluation. As a result, we can gain the desired approaches and procedures for use in future experiments.
The following is how the remaining of the paper is structured: The strategy for locating relevant research was detailed in Section 2. The proposed methodology was mentioned in Section 3. The implementation was explained in Section 4. At last, in Section 5, we wrap up the report and make suggestions for further research.
Errors, mistakes, and flaws in the source code are known as software bugs (Huggins, 2006) [5]. Memory bugs contribute to the detection of memory bug root causes, which occur when memory corruption extends throughout effecting awaiting a visible crash, such as a software collapse; occur (Jeffrey et al. 2009) [6]. Security concerns play a vital role in identifying security flaws that were previously classified as non-security (Gegick et al., 2010) [7]. There is a strong link between the number of bugs and the number of flaws in the source code that cause the software to fail (Tran 2012) [8]. The most important or relevant indicators were chosen using principal component analysis (Fioravanti et al., 2001) [9]. Different software metrics are utilized for defect prediction, and some of the most essential metrics for forecasting software module defects are defined (Okutan et al. 2014) [10]. For bug prediction, both black box and white box techniques are utilized (Rana 2015) [11]. To forecast uncertainty, a machine learning technique is also employed (Delphine Immaculate et al., 2019) [12]. Decision Trees are made up of decision nodes, which are made up of branch and leaf nodes and are nothing more than decisions. The model predicts 73 percent accuracy (AwniHammouri et al, 2018) [13]. Artificial Immune Network-based hyper-parameter optimization outperforms the default hyperparameters. The accuracy of the model is 73.9 percent. The software bug prediction model’s results revealed that machine learning models with optimized hyperparameters outperformed those with default hyperparameters (Khan, F et al., 2020) [14]. Multiple linear regressions can be used to forecast fault density in open-source software. predictive factors use include source lines of code (SLOC), code churn, commits count, and developers count up (S. Rathaur et al., 2020) [15].
The objective of this research is to be able to predict in advance the number of bugs in the software using the software data itself such as the number of attributes, number of methods, number of lines of code, and other important software properties. In Python, the term “central tendency” refers to a single-center value that describes the whole distribution. The main steps are Advanced EDA and visualization using proposed Faster Convolution Neural Network (FCNN), Dimensionality reduction algorithms, and evaluation parameters. Each process includes some algorithms for processing. The Advanced Exploratory Data Analysis (EDA) and visualization using FCNN include descriptive statistics. correlation matrix, feature importance (Lasso), feature importance (RFC), kernal density estimation, 3D scatter cross plots, UMAP dimensionality reduction, Principal Component Analysis (PCA) dimensionality reduction, and clustering analysis. The Dimensionality reduction algorithm has two stages. The First stage is hyper-parameter tuning and solving the imbalance problem and the second stage is to tackle imbalance. The first stage includes classifying data where the classes are: no bugs, 1 bug, or > 2 bugs, and classifying data where the classes are: no bugs, > 0 bugs. Under Sampling, Over Sampling, and Feature Selection is used in the second stage for tackling imbalance. Hyper-parameter tuning is the process of obtaining the optimum model architecture using parameters that influence the architectures. Accuracy, ROC, F-1 Score, Confusion Matrix, Area under the curve of ROC are the evaluation parameters in this research. Fig. 1 depicts the proposed method’s block diagram.
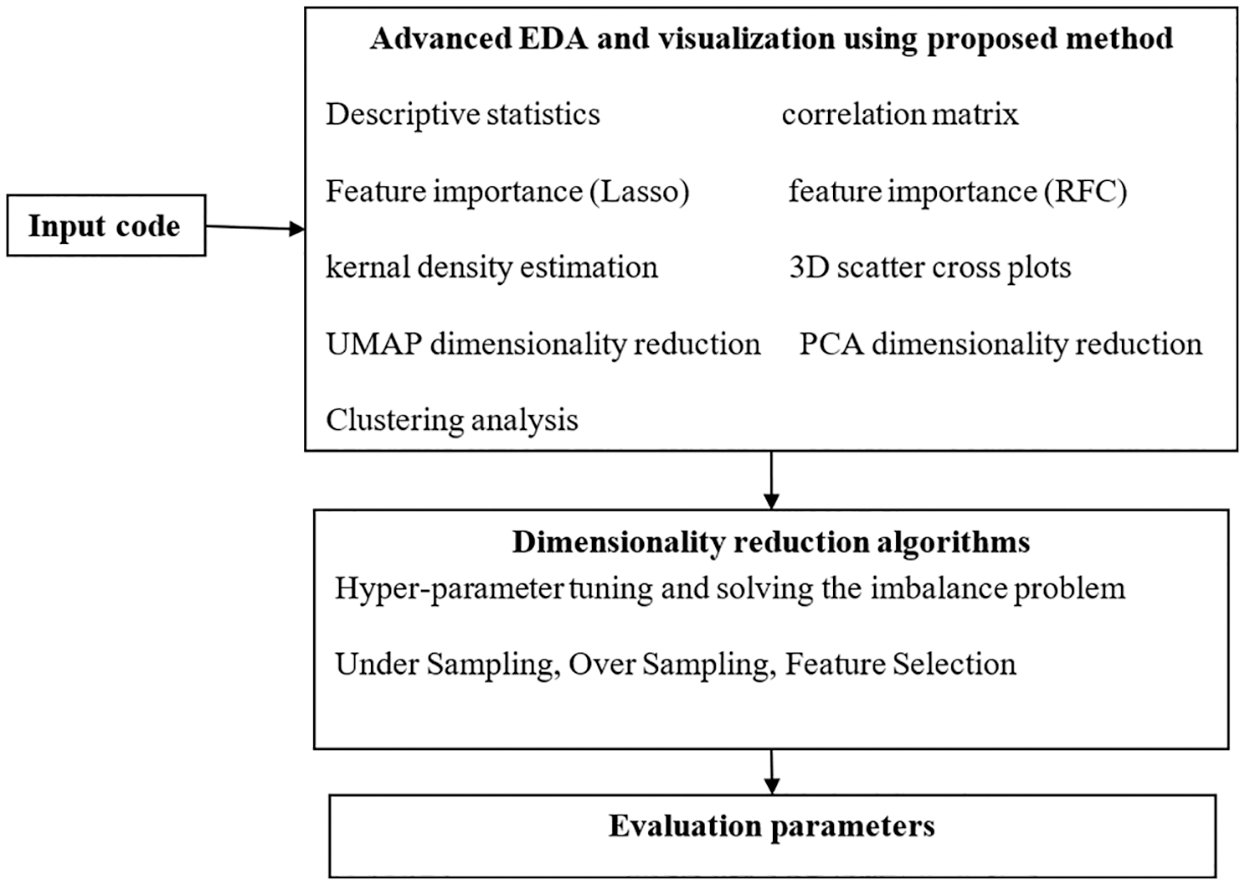
Figure 1: Block diagram of the proposed method
To predict bugs, data analysis employs two basic statistical methodologies. There are two types of inferences: descriptive and inferential. Descriptive statistics describe data using tools like mean and standard deviation on a sample. Inferential statistics examine data that might fluctuate randomly and then draws inferences. The descriptive statistics approach is used to forecast software bugs.
3.1 Faster Convolutional Neural Network (FCNN) Based Bugs Prediction
Convolutional Neural Networks give weightage in deep learning for sufficient feature extraction in bug prediction. We may get high precision with the aid of this strategy. Using this method, the train and test data programs are first transformed into abstract syntax trees. The nodes of each tree are then chosen and turned into token vectors. These token vectors are then sent to FCNN after being transformed to numerical vectors in the encoding stage. It produces semantic and structural features for software, which are then coupled with bug prediction features already in place. The characteristics are then fed into a logistic regression model to determine whether or not the software is bugged. The following Fig. 2 depicts the convolutional neural network structure.
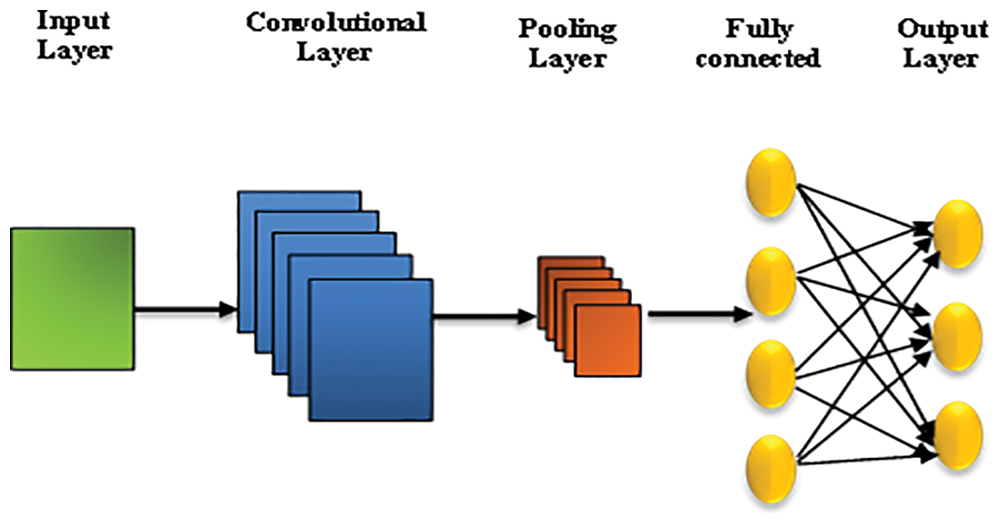
Figure 2: Schematic of convolutional neural network
3.2 Moth Flame Optimization Algorithm
Mirjalili initially presented MFO, a swarm optimization technique, in 2015. A moth is a bug of the butterfly group, and its major activity begins in the dark. The core concept for MFO is derived from the exploration progression of moths when seeking light in nature is known as the orientation of transverse while migrating toward the light at dark, depending on whether the light is emitted by the light. The location of moths is determined by a set movement angle in relation to the incoming light. Moths travel in a circular pattern, attempting to maintain a comparable angle for the artificial light. Such flying techniques will result in a fatal spiral flight track for moths (Mirjalili, S., 2015) [16].
Each moth represents a possible solution in the problem’s search area. The moths’ solutions are shown in the matrix below.
where, n denotes to the number of moths, d denotes the problem dimension.
The finest spots in the search space are represented by a series of flames. The set of flames is depicted in the below matrix, which is analogous to the moth’s matrix.
Here, n and d denote the number of moths and dimensions of the search space, correspondingly. In the search space, flames and moths are solutions. The biggest distinction between them, though, is the update procedure. Moths despise the real search agents who roam the search space. Every moth explores the area around a flame and updates its position. This method allows moths to strike a balance between the explorative and exploitative processes while searching. Using the fitness values from each generation, all flames are arranged ascendingly. As a result, the moths’ locations are updated using a process based on the nearest best solutions.
Eq. (3) depicts the flame-based updating process, where
where l is the number of iterations actually performed, T is the maximum number of iterations and
N is a preset value that denotes the starting number of flames at the first iteration.
The dataset was interpreted after pre-processing, and the details were passed to a vector using the Python function. Two parameters were created, one of which was given the Quality level, while the other was applied to other attributes that were chosen. Data sets were shown to have an incredibly strong link between software consistency and defect count. The software’s consistency is likely to be influenced by the timing and cost of development. Fig. 3 depicts the bugs and their occurrences. The bug occurrences may differ as to the number of lines of code, methods, and characteristics are differing.
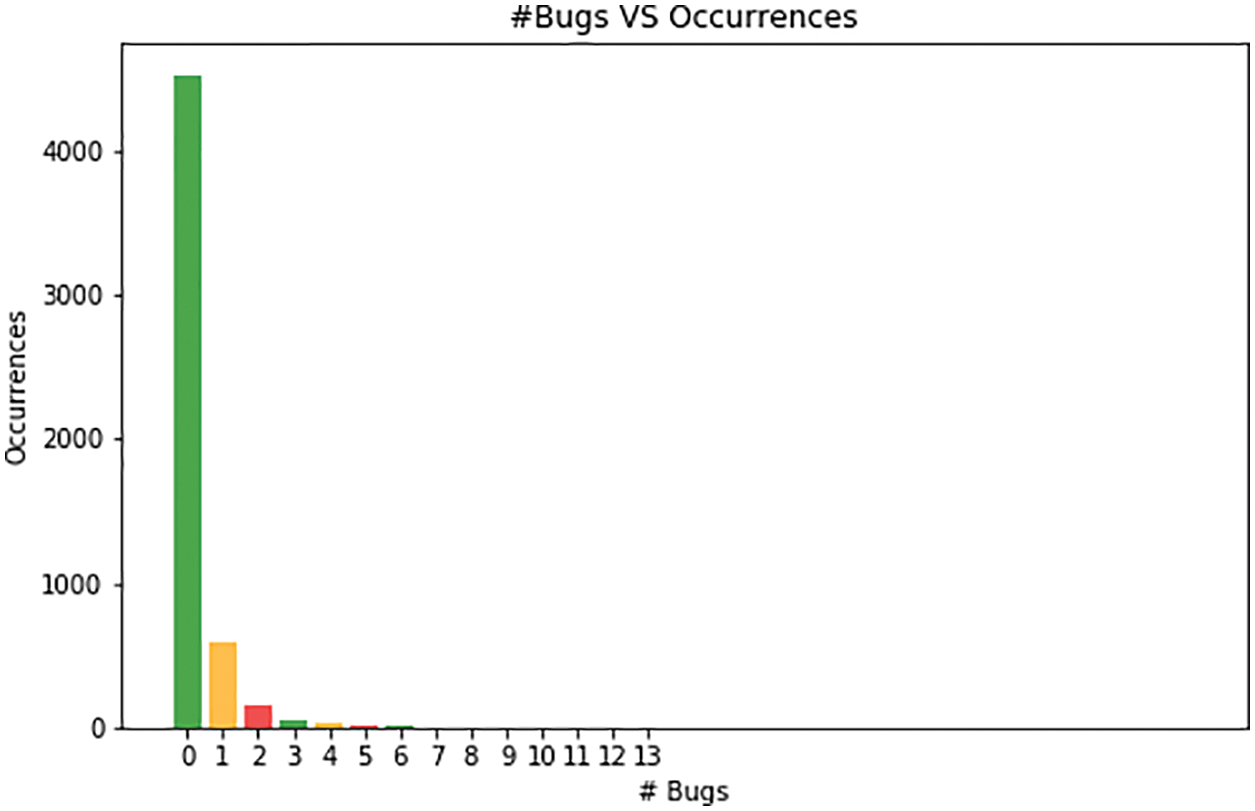
Figure 3: Bug vs. occurrences
Must be careful not to overfit or have the classifier prefer “Class 0” unjustly based on these class balances. The value of the correlation coefficient between sets of variables is shown in a correlation matrix, which is a table. This demonstrates the correlation between cbo, dft, fanln, fanout, lcom, noc, number of public attributes inherited, number of public attributes, number of private attributes inherited, number of attributes, number of private attributes, number of attributes inherited, number of methods, number of methods inherited, number of lines of code, wmc, rfc, and bugs. The highest correlated variables with Bugs are (Fig. 4):
1. cbo is correlated with fanIn, fanOut
2. fanout is correlated with wmc, rfc, number of lines of code, number of methods
3. number of lines of code is correlated with wmc, rfc, number of methods
4. number of methods is correlated with wmc, rfc, number of public methods
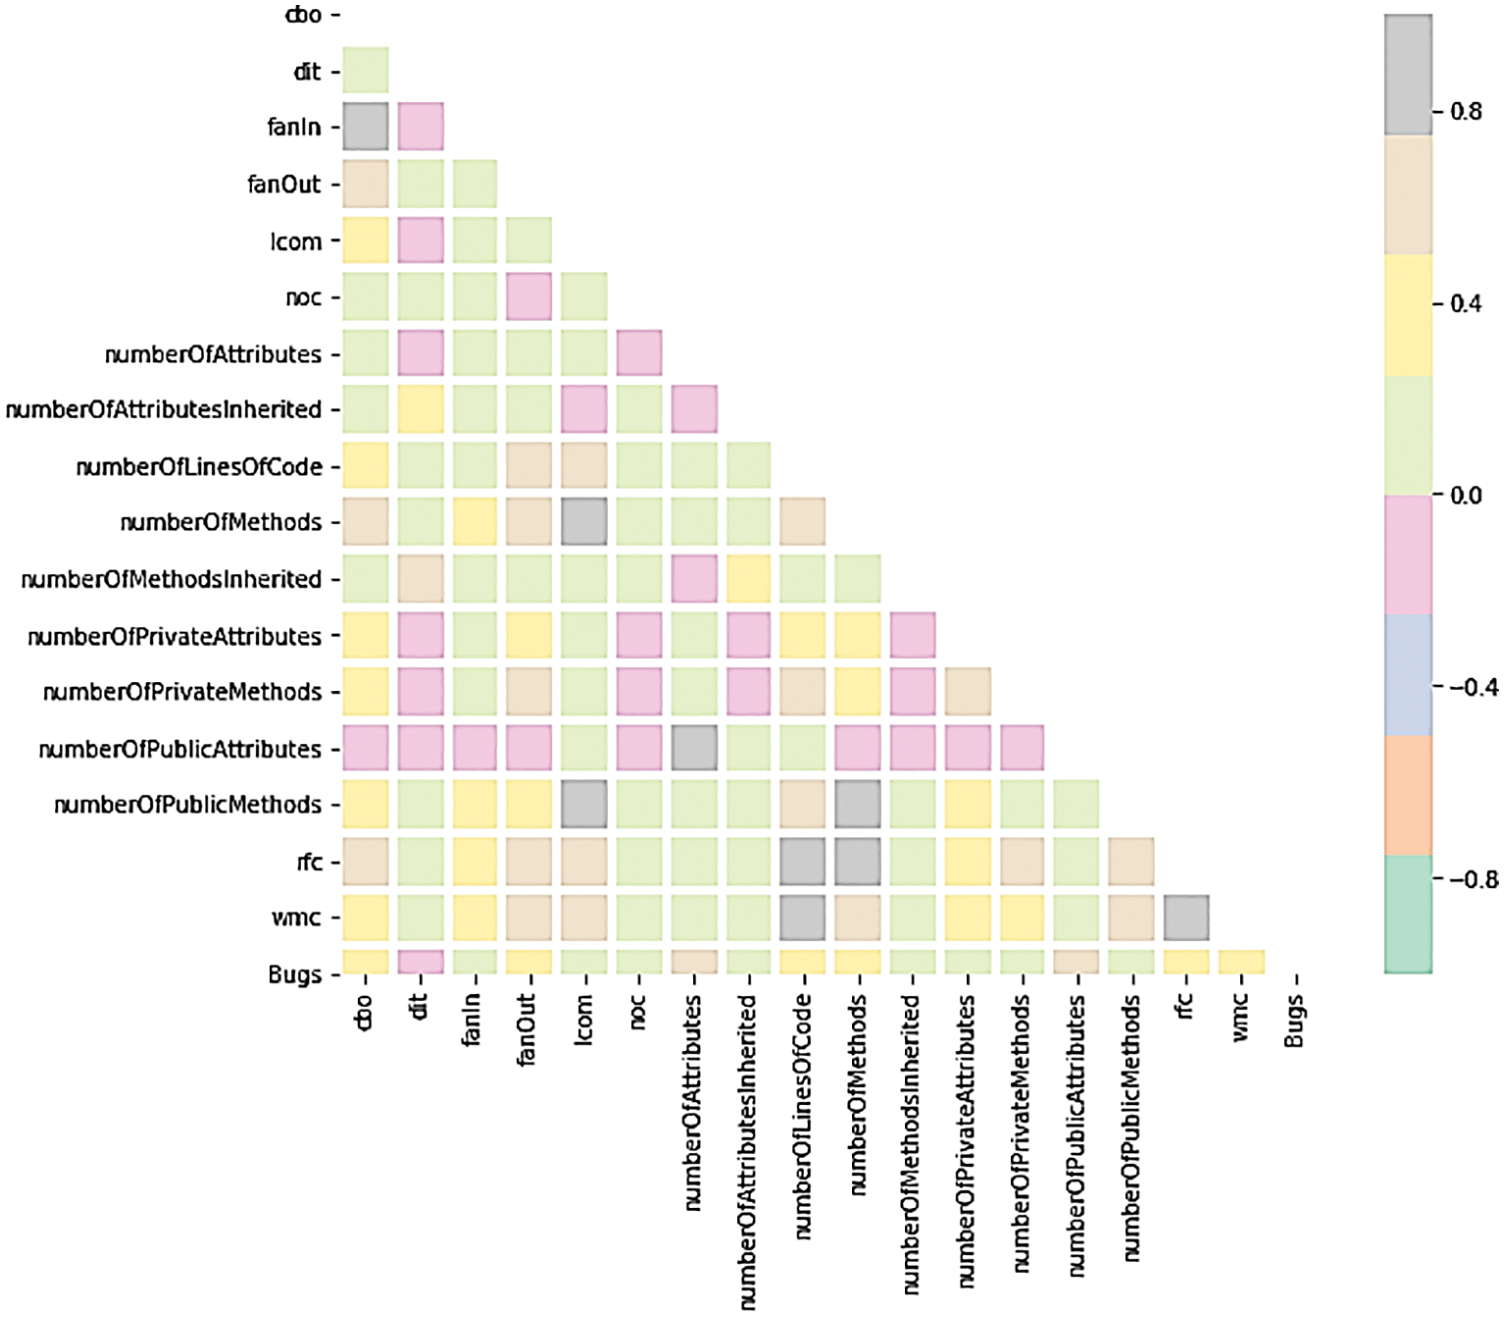
Figure 4: Correlation matrix
rfc, cbo, fanOut, wmc, number of lines of code, and number of methods inherited are some of the most important characteristics from this research analysis with correlation matrix, lasso regression feature importance, and random forest classifier feature relevance: Fig. 5 depicts feature importance with Lasso regression and random forest classifier, while Fig. 6 depicts Kernel Density of Classes with respect to one variable. Kernel density estimation is a basic data smoothing issue that entails inferring population conclusions from a small sample of data. Kernel density estimates are similar to histograms, but they can have smoothness and continuity if the correct kernel is used.
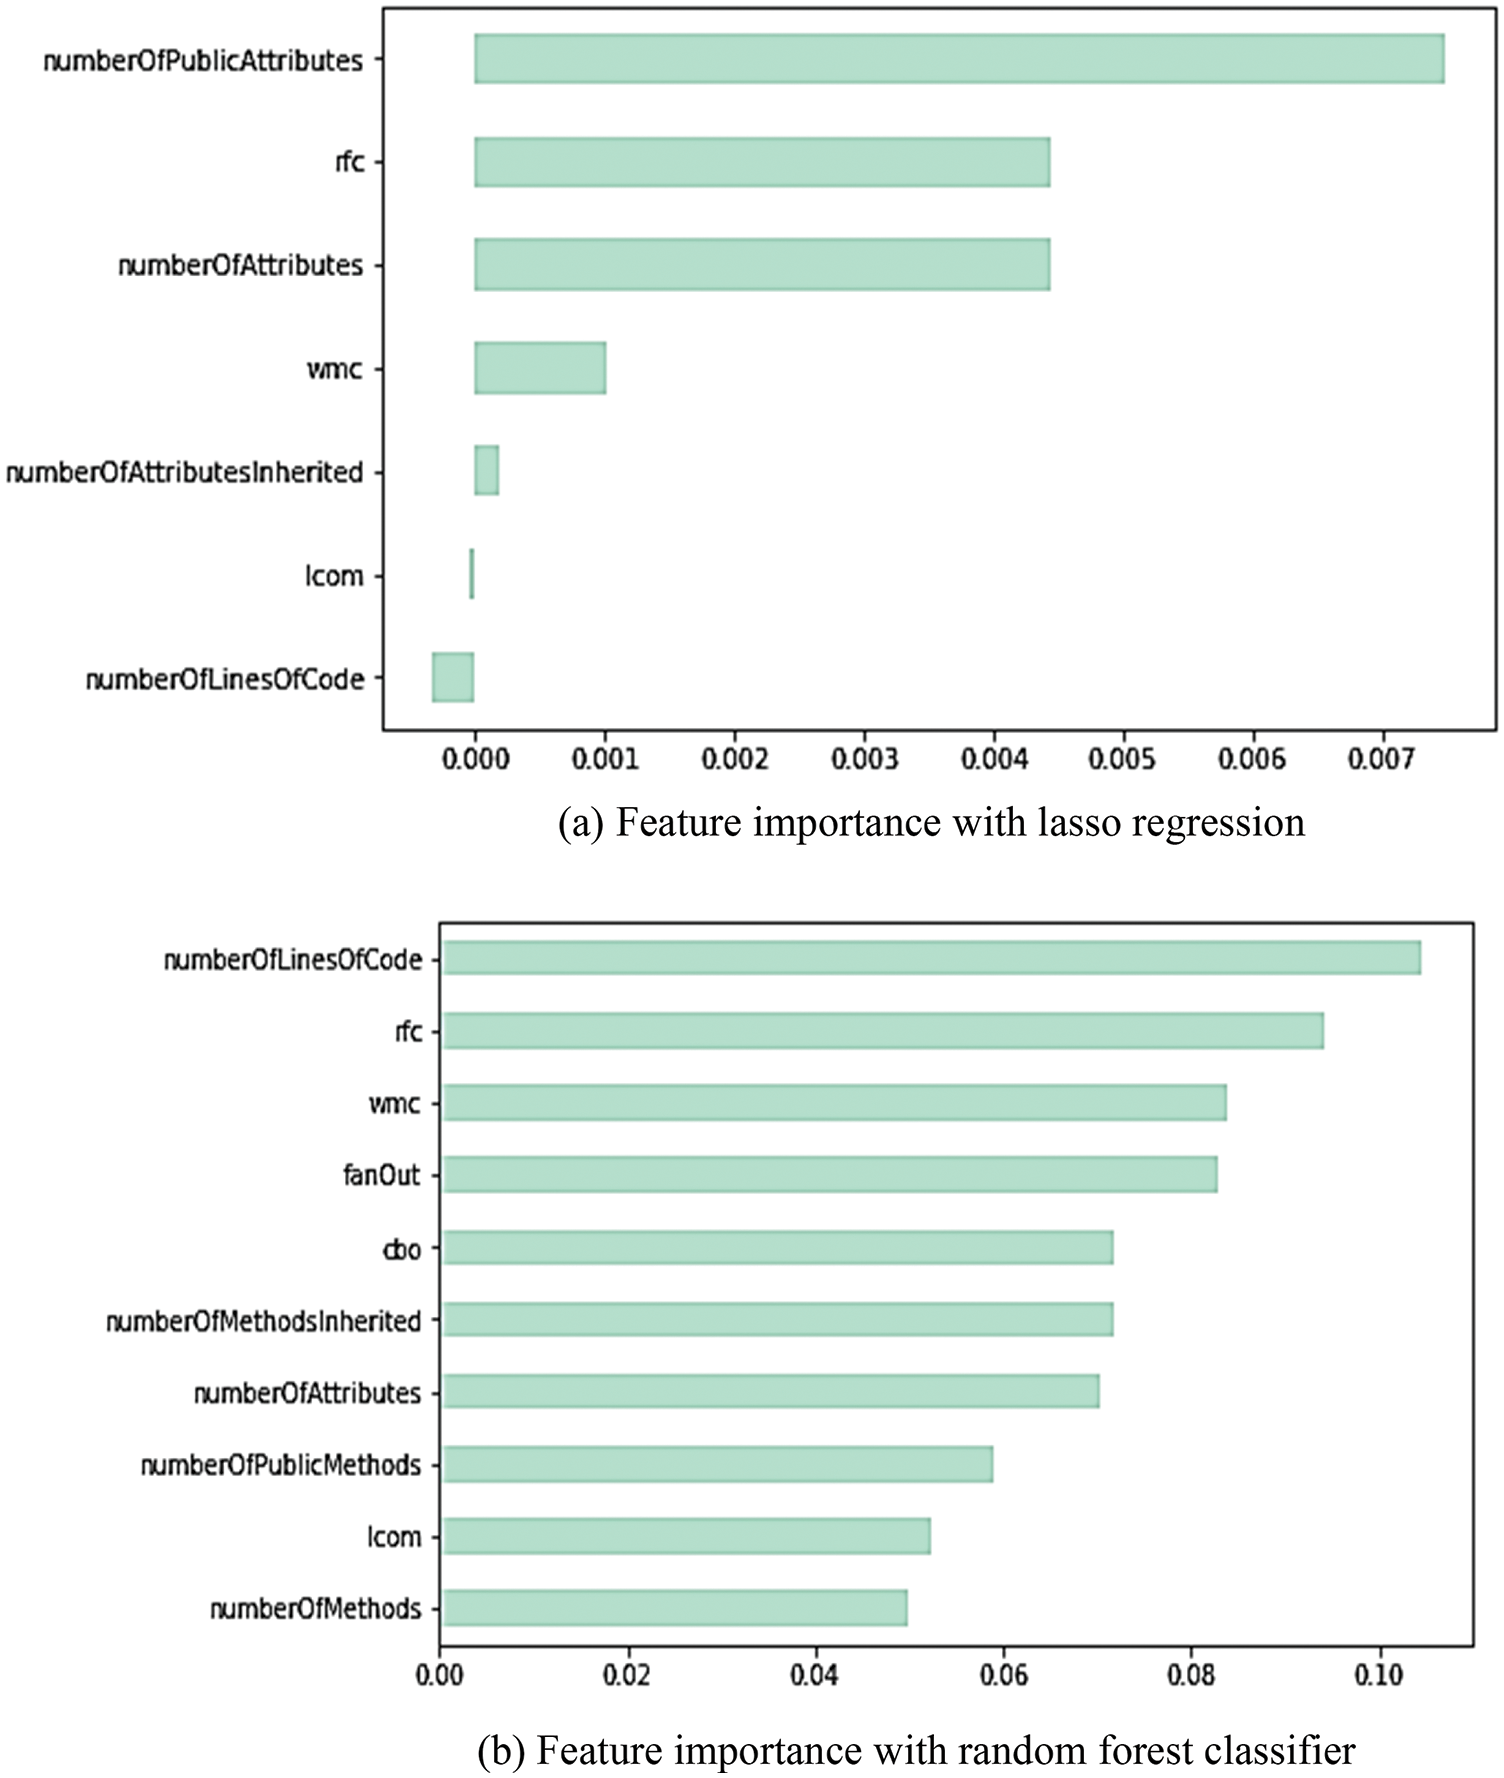
Figure 5: Feature importance

Figure 6: Kernel density of classes with respect to one variable
When employing up to two-way multiple regression analysis to regress Y on X and Z, the Scatter 3D Cross Plot process offers the ability to rotate the data so that may look at it from different perspectives. It also has the option to visualize the multiple regression surfaces. This was shown in Figs. 7 and 8 shows the features vs. bugs plot in scatter 3D cross plot. From the above Fig. 8, the greater number of negative qualities have the highest possibility of bugs. The plot is colored by K-Means predictions in Clustering Analysis using the UMAP Dimensionality Reduction method (Fig. 9a). UMAP method is comparable to t-SNE, and it potentially maintains more of the global structure while providing better run time speed. It reduces different software metrics having bugs by using the K-mean center. UMAP may also be utilized as a general-purpose machine learning dimension reduction strategy because it has no computational limits on embedding dimensions. There is no correlation between the number of bugs and the clusters created by the K-Means predictor in this graph. The numbers 0, 1, and 2 represent the number of clusters that K-Means require (Fig. 9a). The Next Plot is colored by real values (y train) and K-Means centers are provided to clear up any confusion (Fig. 9b). PCA Dimensionality Reduction Algorithm (Fig. 9c) and Next Plot is colored by K-Means cluster predictions rather than actual values (y train) (Fig. 9d).
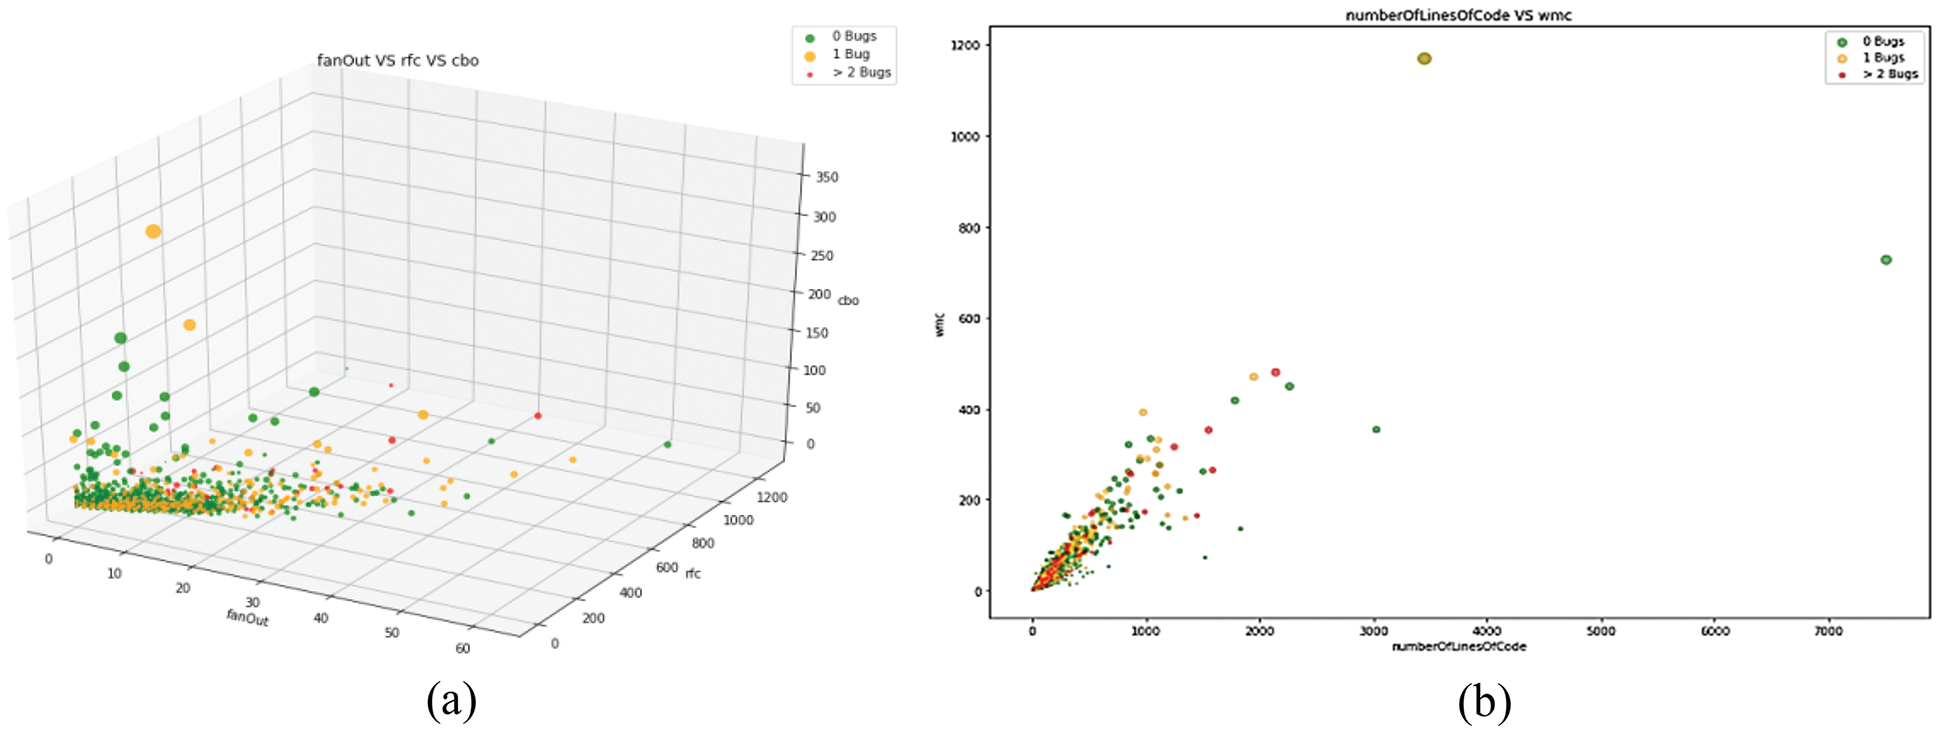
Figure 7: Scatter 3D cross plot

Figure 8: Features vs. bugs plot in scatter 3D cross plot

Figure 9: Clustering analysis
In this research, two types of modeling were used to predict bugs. The corresponding AUC curve was shown in Fig. 10. There are two kinds of categorization: Multi-Class Classification and Binary Classification. Some clarifying algorithms are utilized for each technique. For Multi-Class Classification, Random Forest Classifier (Ensemble), K-Nearest Neighbor, and K-Means Clustering are utilized.
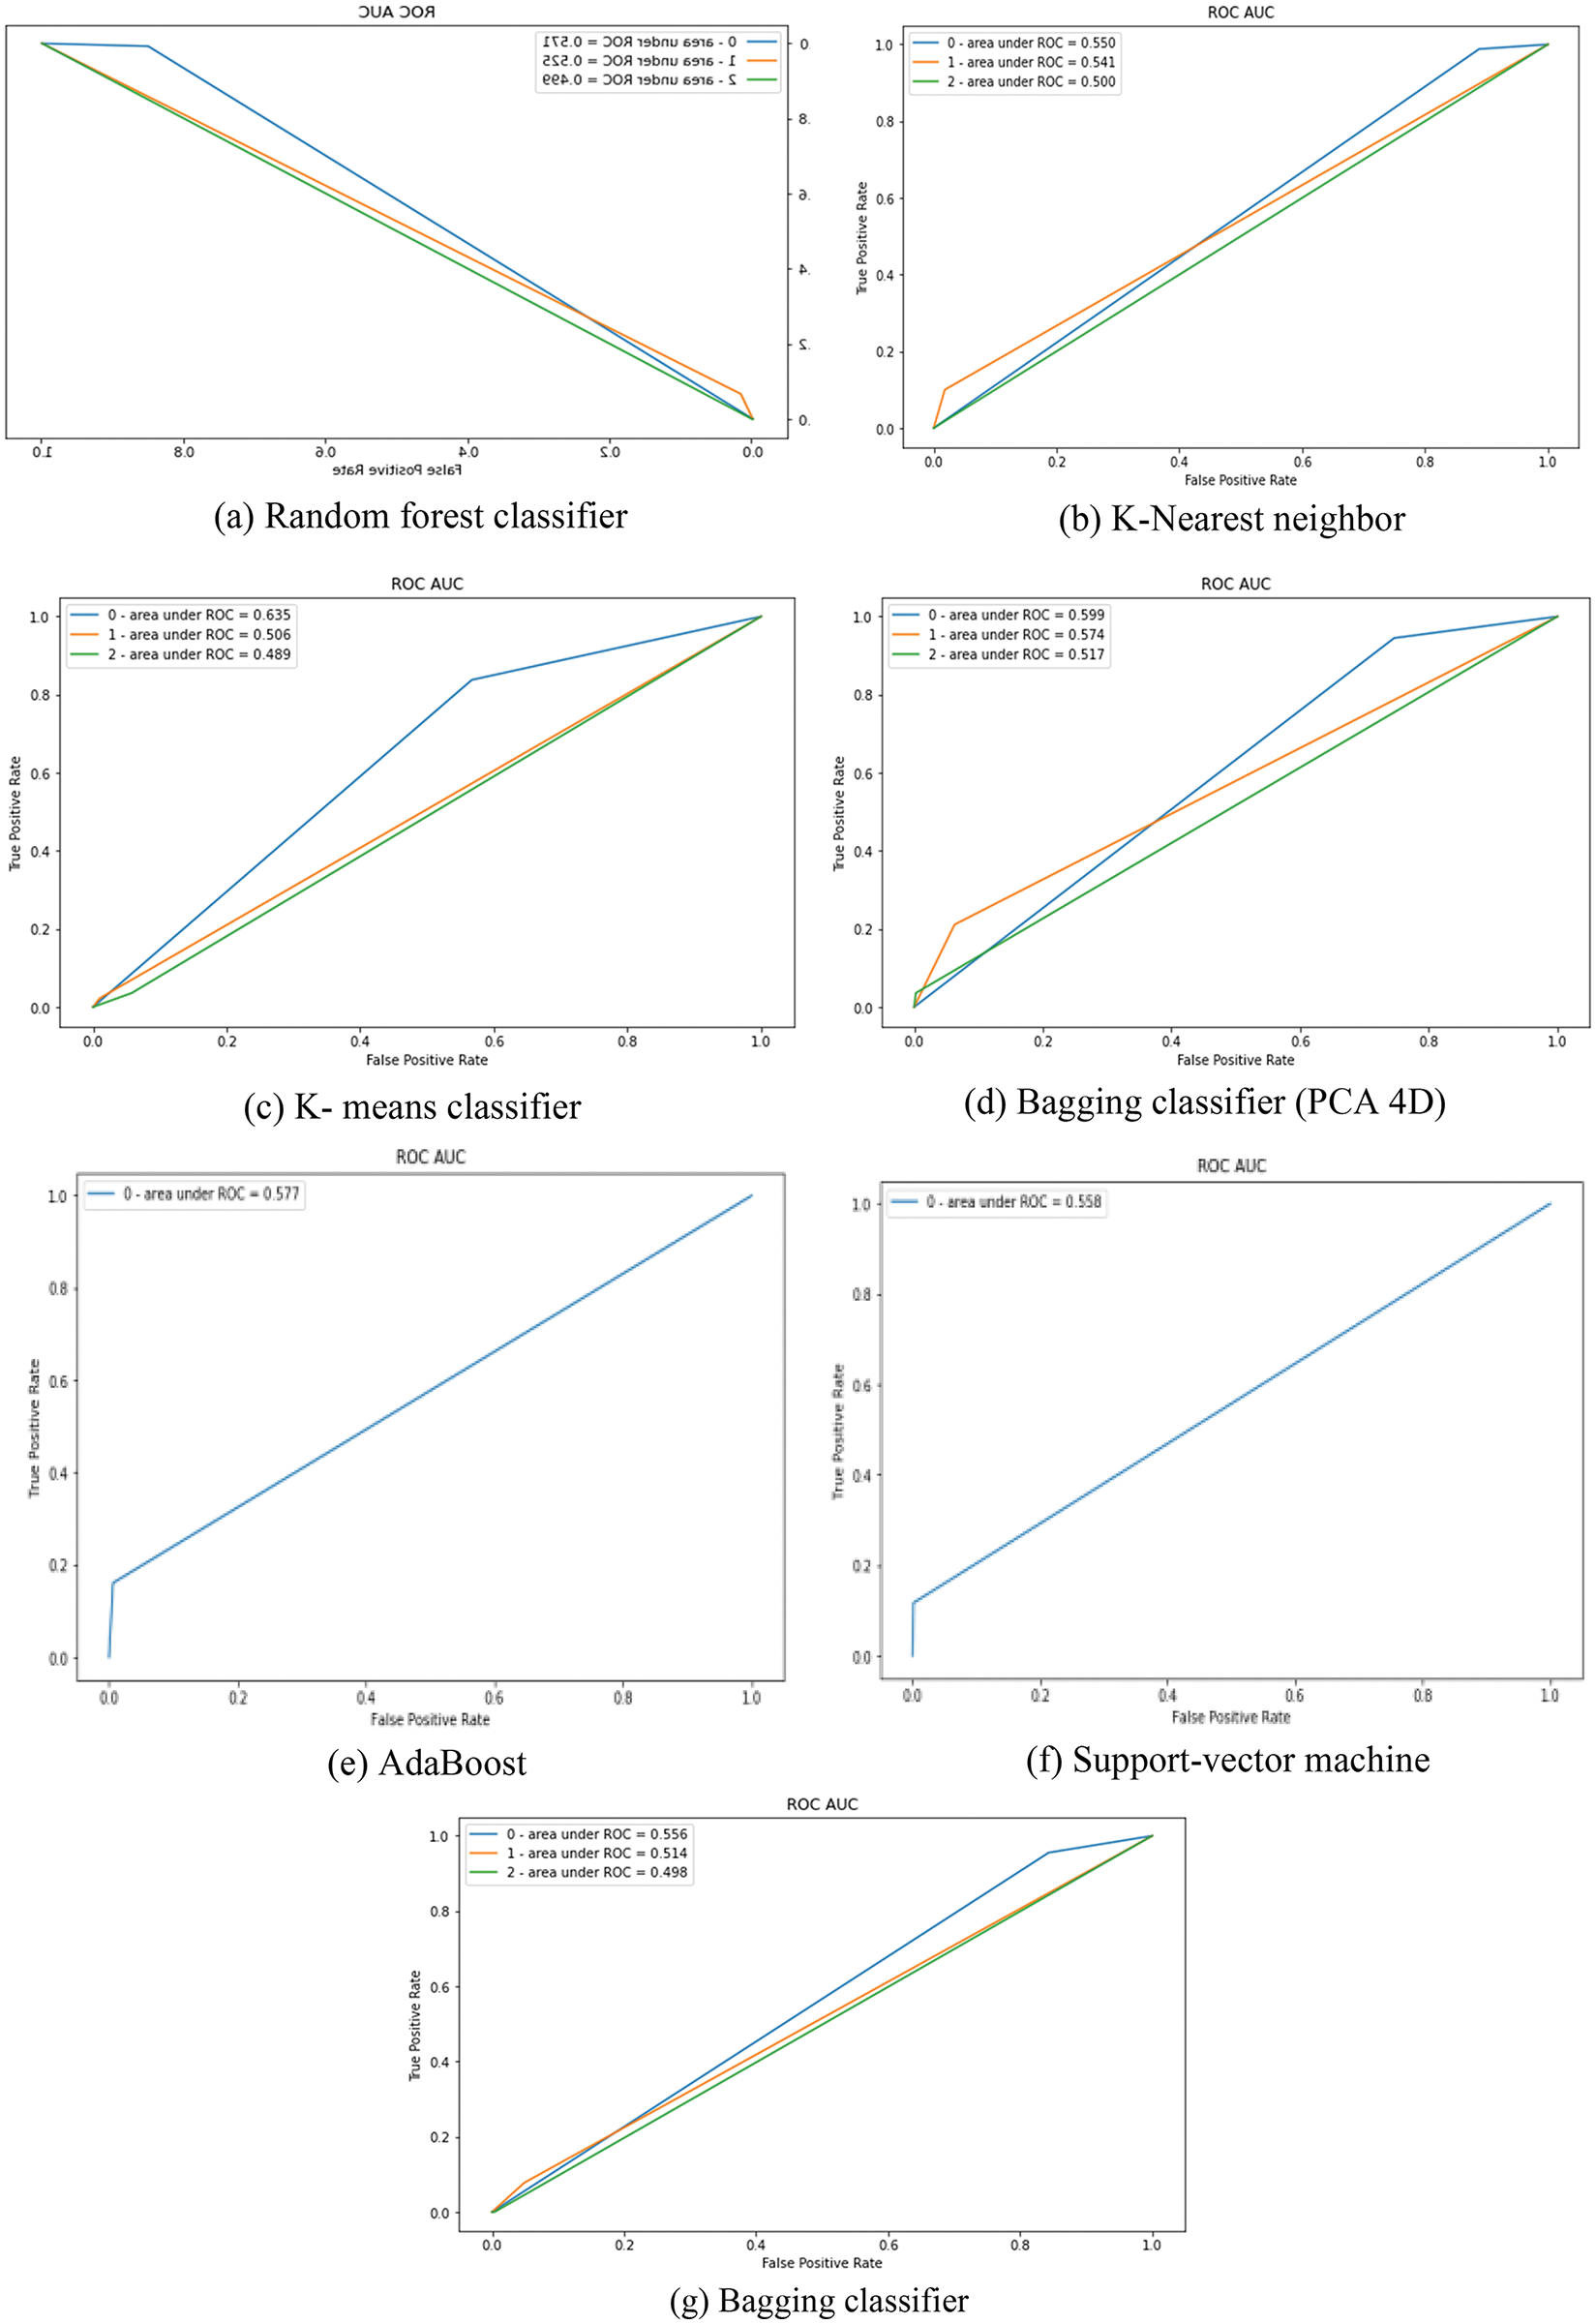
Figure 10: AUC curve of classifiers
The AdaBoost algorithm, the Support-Vector Machine, and the Bagging Classifier are all employed. Neural Network (FCNN) is also utilized for Binary Classification. these SVM, KNN, K-Means, FCNN models require scaling for more generalized results, because they are distance-based and, might favor one feature over another. However, if the weak learner is a tree-based classifier for AdaBoost, Bagging, or RFC, the weak learner is not affected by scaling. Confusion Matrix is a table that displays right guesses as well as several sorts of wrong predictions.
False Negative, True Negative, False Positive, and True Positive are the four possible consequences for each model (Fig. 10). The accuracy, AUC, and F-measure of the classifiers employed in this study are all utilized to evaluate their performance. Fig. 11 shows the results of the Evaluator Function of the MFO-FCNN. The percentage of precise estimates over the total number of forecasts made represents the model’s accuracy. The total accuracy is expressed as follows:
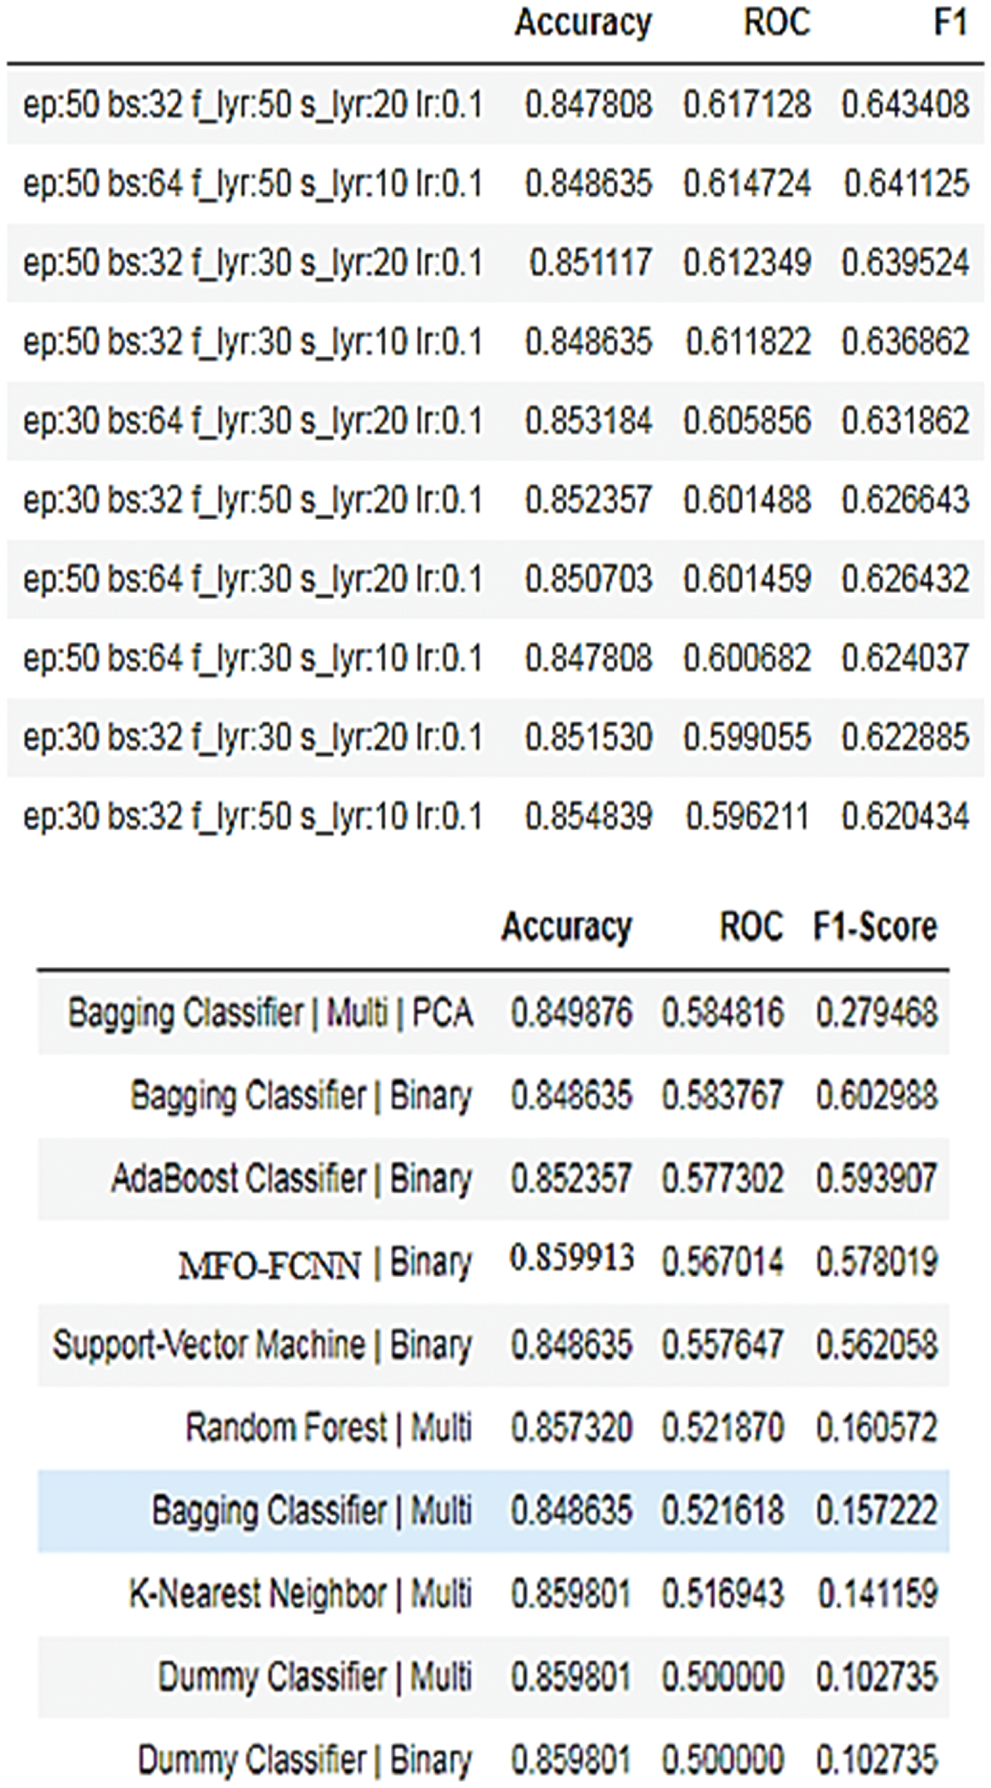
Figure 11: Evaluator function results of MFO-FCNN
The F-measure i.e., F1-score is a test accuracy metric that takes both precision and recall into account.
Precision (Positive Predictive Value) is the percentage of positive cases among all those that are projected to be positive.
To calculate the bug rate, recall (sensitivity) is a metric that accurately detects the flaws.
The AUC (Area Under the Receiver Operating Characteristic Curve) is a measurement of the area under the receiver operating characteristic curve. It’s a graphical representation of a prediction model’s diagnostic capabilities at various threshold levels. On the y-axis, the true positive rate is displayed, while the false positive rate is plotted on the x-axis (Fig. 10).
The area under the curve is the probability that a classification algorithm would rank a randomly selected positive module higher than a randomly selected negative module. This FCNN approach will value all classes equally; with no one class having a disproportionate influence on the measure. As a result, both the ROC and the F1-Score will be calculated using Macro-Averaging. The scores will be far lower than expected as a result of the imbalance (Fig. 11).
Fig. 12 depicts the effect of Data-Driven Model Optimization. Select the top three models in this category, such as Under Sampling, Over Sampling, and With Feature Selection. Reducing the number of samples in the majority class at random such that the two classes are balanced in Under Sampling, and then testing it on an unbalanced real-world-like dataset.
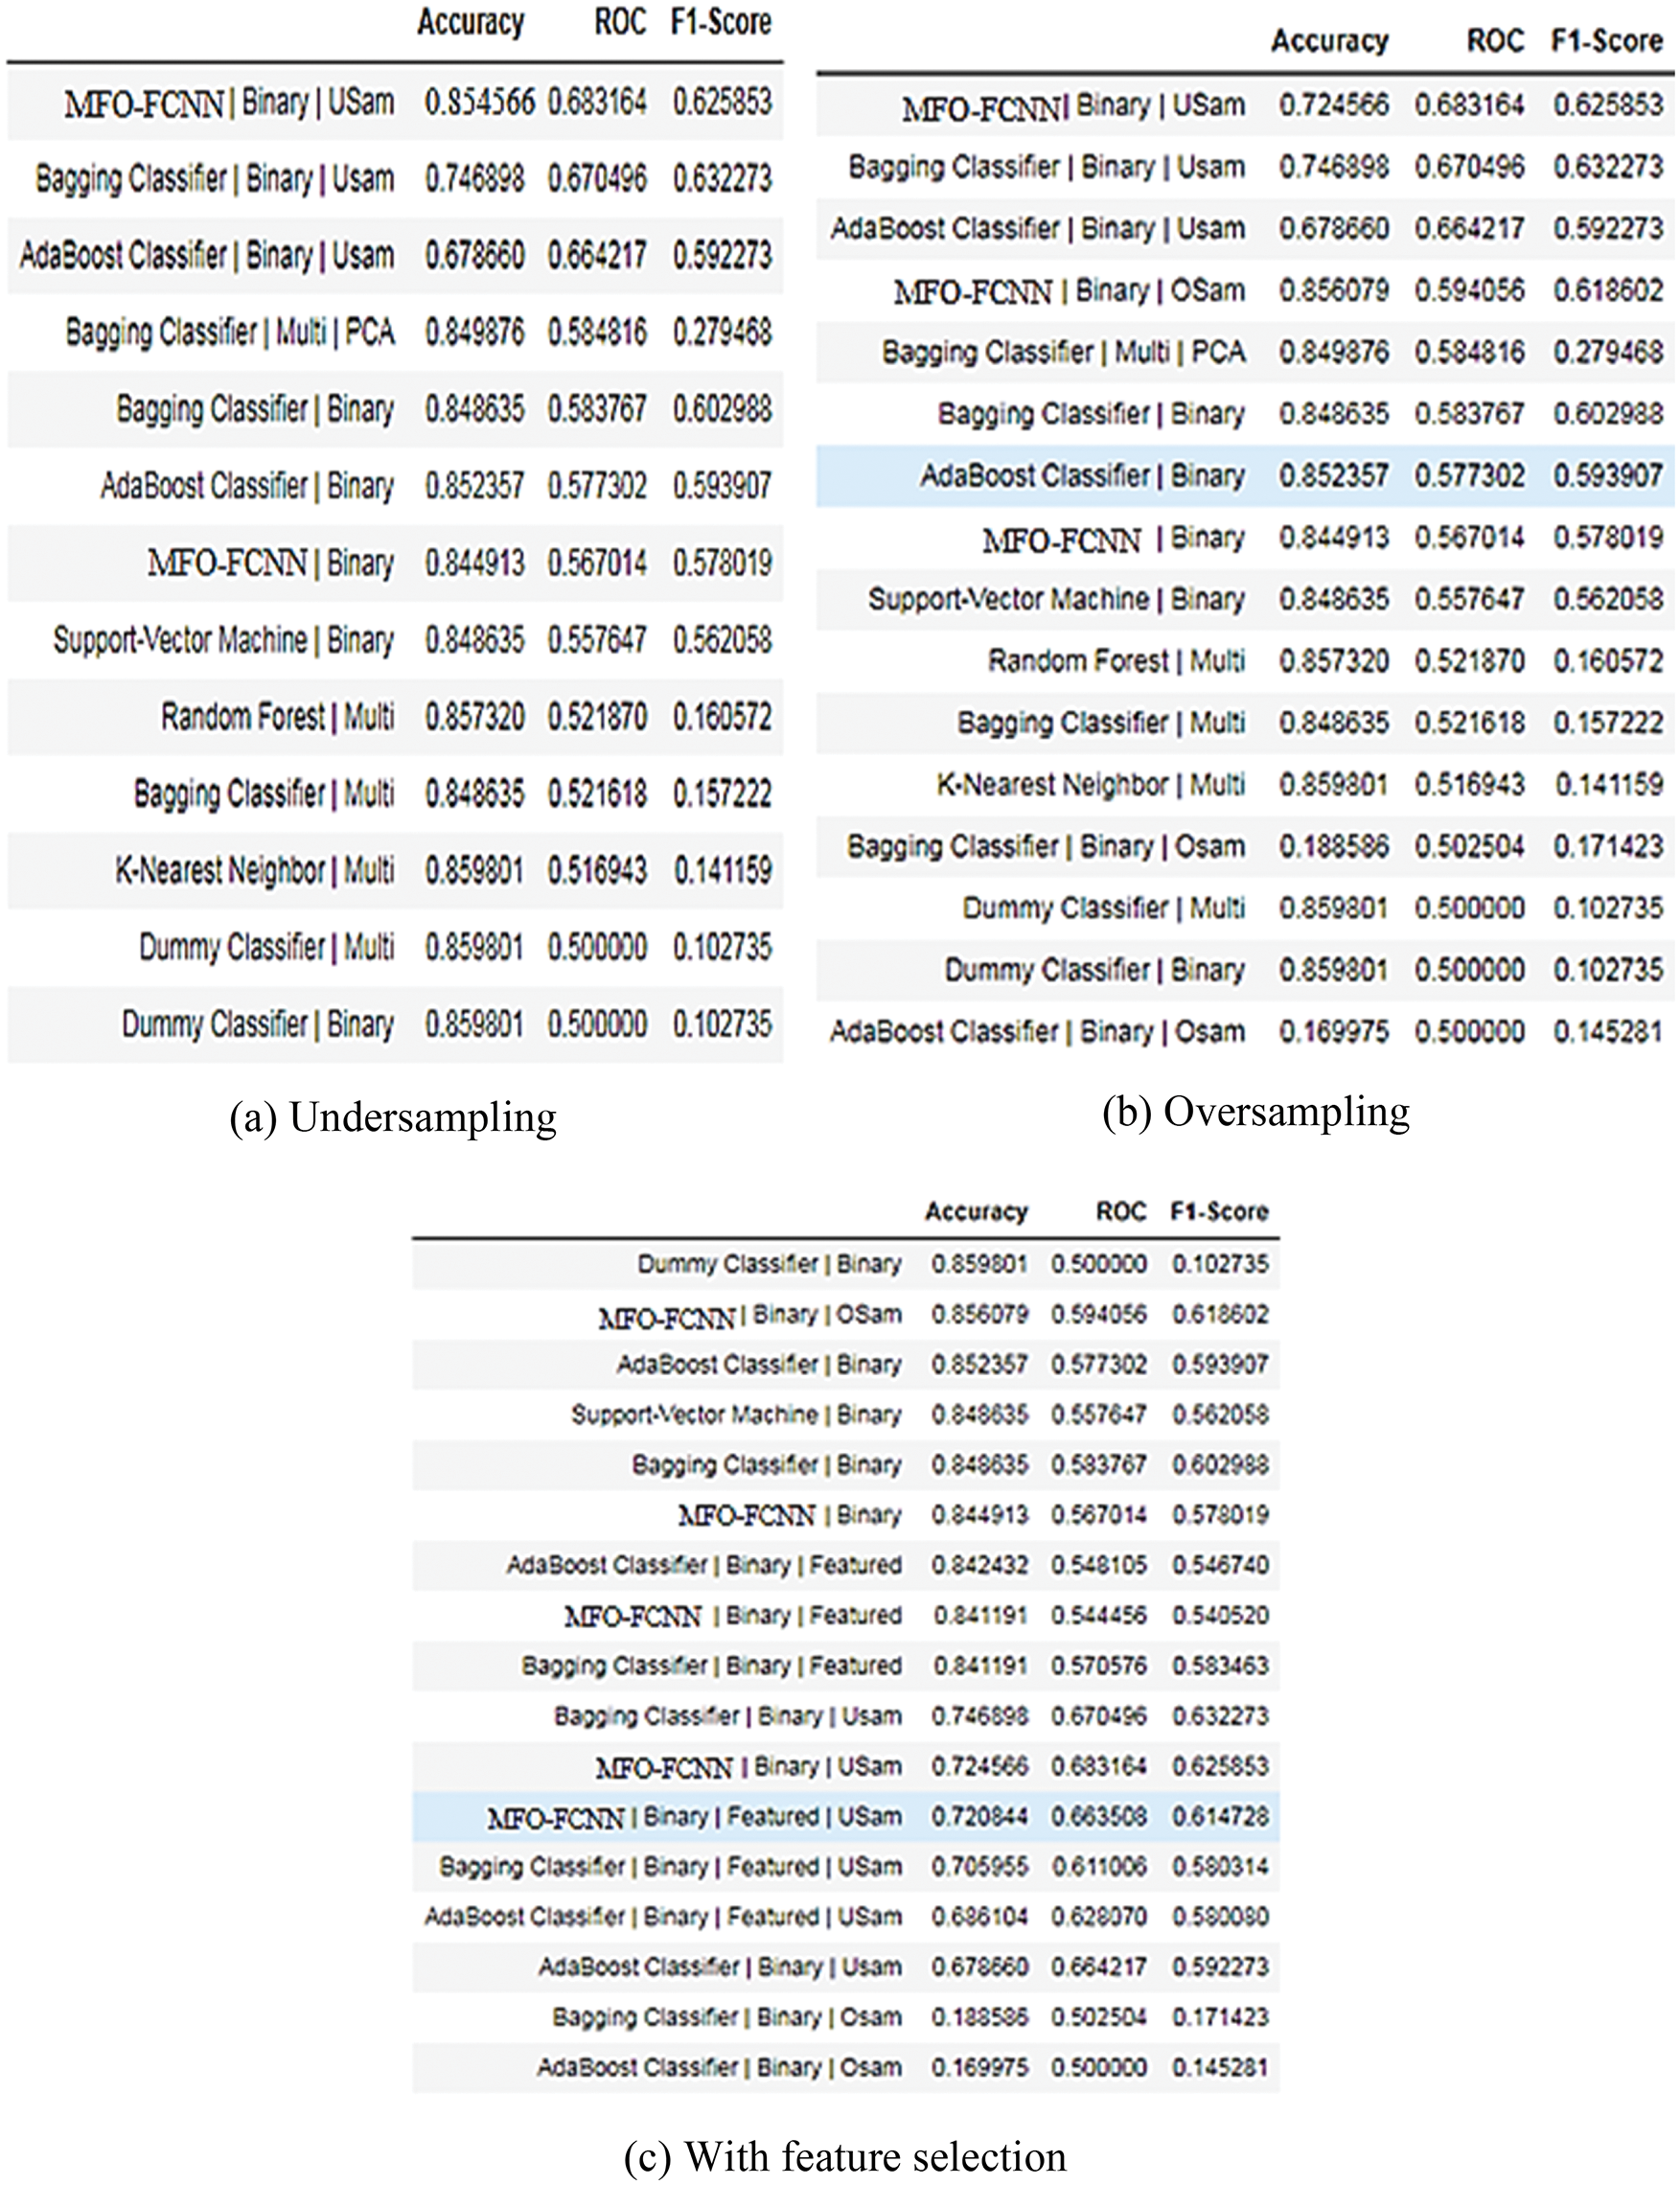
Figure 12: Data-driven model optimization result
The characteristics evaluated for the MFO-FCNN include rfc, cbo, fanOut, wmc, number of lines of code, and number of methods inherited (Fig. 12). This research model was also trained with and without under-sampling on a PCA training set.
The software industry benefits more from the identification of issue causes and bug prediction in order to supply high-quality goods to users. Prediction accuracy is determined by the precise causes of software faults as well as the performance of the prediction model. Quality and dependability are being prioritized, resulting in fewer software application failures, improved security, and improved application performance. The software business, as well as IT workers, has a difficult difficulty in identifying and anticipating the most critical vulnerabilities. This research has made a substantial contribution to the detection of underlying causes of software issues, as well as the forecast of bug numbers using a variety of approaches. This research uses a mix of the Faster Convolution Neural Network and the Moth Flame Optimization method to anticipate the frequency of faults in software based on program data. The proposed method has f1-score is 0.1351 %, the value of AUC-ROC is 0.8746% and the Accuracy is 0.8411%. That means the MFO-FCNN has 84% of accuracy. As a consequence, when compared to other current algorithms, the outcomes of these existing approaches reveal how accurate they are. Still, attempts are being made to learn more about this technology for anticipating a bug, which uses machine learning algorithms to improve accuracy for huge datasets. Other measures might be included in the future study. More open-source data sets might be incorporated to improve bug prediction accuracy.
Acknowledgement: The author with a deep sense of gratitude would thank the supervisor for his guidance and constant support rendered during this research.
Funding Statement: The authors received no specific funding for this study.
Conflicts of Interest: The authors declare that they have no conflicts of interest to report regarding the present study.
References
1. E. A. Felix and S. P. Lee, “Predicting the number of defects in a new software version,” PLoS One, vol. 15, no. 3, pp. e0229131, 2020. [Google Scholar]
2. A. Ahilan and P. Deepa, “Improving lifetime of memory devices using evolutionary computing-based error correction coding,” in Proc. Computational Intelligence, Cyber Security and Computational Models, Singapore, Springer412, pp. 224–237, 2016. [Google Scholar]
3. S. N. Saharudin, K. T. Wei and K. S. Na, “Machine learning techniques for software bug prediction: A systematic review,” Journal of Computer Science, vol. 16, no. 11, pp. 1558–1569, 2020. [Google Scholar]
4. R. Dhaya, R. Kanthavel and A. Ahilan, “Developing an energy-efficient ubiquitous agriculture mobile sensor network-based threshold built-in MAC routing protocol (TBMP),” Soft Computing, vol. 25, no. 18, pp. 12333–12342, 2021. [Google Scholar]
5. J. S. Huggins, Computational goals correctness & efficiency. In: Principles of Computation. CORTINA: Carnegie Mellon University, pp. 15–105, 2002. [Google Scholar]
6. D. Jeffrey, N. Gupta and R. Gupta, “Identifying the root causes of memory bugs using corrupted memory location suppression,” in Proc. Int. Conf. on Software Maintenance, Beijing, China, pp. 356–365, 2008. [Google Scholar]
7. M. Gegick, P. Rotella and T. Xie, “Identifying security bug reports via text mining: An industrial case study,” in Proc. 7th IEEE Working Conf. on Mining Software Repositories (MSR 2010), Cape Town, South Africa, pp. 11–20, 2010. [Google Scholar]
8. Q. C. Tran, “Empirical evaluation of defect identification indicators and defect prediction models,” Master thesis, School of Computing, Sweden, 2012. [Google Scholar]
9. F. Fioravanti and P. Nesi, “A study on fault-proneness detection of object-oriented systems,” in Proc. Fifth European Conf. on Software Maintenance and Reengineering, Lisbon, Portugal, pp. 121–130, 2001. [Google Scholar]
10. A. Okutan and O. T. Yıldız, “Software defect prediction using bayesian networks,” Empirical Software Engineering, vol. 19, no. 1, pp. 154–181, 2014. [Google Scholar]
11. R. Rana, “Software defect prediction techniques in automotive domain: Evaluation, selection and adoption,” Ph.D. Dissertation, University of Gothenburg, Gothenburg, 2015. [Google Scholar]
12. S. D. Immaculate, M. F. Begam and M. Floramary, “Software bug prediction using supervised machine learning algorithms,” in Proc. Int. Conf. on Data Science and Communication (IconDSC), Bangalore, India, pp. 1–7, 2019. [Google Scholar]
13. A. Hammouri, M. Hammad, M. Alnabhan and F. Alsarayrah, “Software bug prediction using machine learning approach,” International Journal of Advanced Computer Science and Applications, vol. 9, no. 2, pp. 78–83, 2018. [Google Scholar]
14. F. Khan, S. Kanwal, S. Alamri and B. Mumtaz, “Hyper-parameter optimization of classifiers, using an artificial immune network and its application to software bug prediction,” IEEE Access, vol. 8, pp. 20954–20964, 2020. [Google Scholar]
15. S. Rathaur, N. Kamath and U. Ghanekar, “Software defect density prediction based on multiple linear regression,” in Proc. Second Int. Conf. on Inventive Research in Computing Applications (ICIRCA), Coimbatore, India, pp. 434–439, 2020. [Google Scholar]
16. S. Mirjalili, “Moth-flame optimization algorithm: A novel nature-inspired heuristic paradigm,” Knowledge-Based Systems, vol. 89, pp. 228–249, 2015. [Google Scholar]
Cite This Article
 Copyright © 2023 The Author(s). Published by Tech Science Press.
This work is licensed under a Creative Commons Attribution 4.0 International License , which permits unrestricted use, distribution, and reproduction in any medium, provided the original work is properly cited.
 Downloads
 Citation Tools