
 Submit a Paper
 Propose a Special lssue
 Open Access
ARTICLE

Chi-Square and PCA Based Feature Selection for Diabetes Detection with Ensemble Classifier
1 School of Computing and Information Sciences, Florida International University, USA
2 Department of Computer Science, Khwaja Fareed University of Engineering and Information Technology, Rahim Yar Khan, 64200, Pakistan
3 Department of Computer Science, Broward College, Broward County, Florida, USA
4 Department of Information and Communication Engineering, Yeungnam University, Gyeongsan-si, 38541, Korea
* Corresponding Author: Imran Ashraf. Email:
Intelligent Automation & Soft Computing 2023, 36(2), 1931-1949. https://doi.org/10.32604/iasc.2023.028257
Received 06 February 2022; Accepted 20 June 2022; Issue published 05 January 2023
 View Full Text
 Download PDF
Abstract
Diabetes mellitus is a metabolic disease that is ranked among the top 10 causes of death by the world health organization. During the last few years, an alarming increase is observed worldwide with a 70% rise in the disease since 2000 and an 80% rise in male deaths. If untreated, it results in complications of many vital organs of the human body which may lead to fatality. Early detection of diabetes is a task of significant importance to start timely treatment. This study introduces a methodology for the classification of diabetic and normal people using an ensemble machine learning model and feature fusion of Chi-square and principal component analysis. An ensemble model, logistic tree classifier (LTC), is proposed which incorporates logistic regression and extra tree classifier through a soft voting mechanism. Experiments are also performed using several well-known machine learning algorithms to analyze their performance including logistic regression, extra tree classifier, AdaBoost, Gaussian naive Bayes, decision tree, random forest, and k nearest neighbor. In addition, several experiments are carried out using principal component analysis (PCA) and Chi-square (Chi-2) features to analyze the influence of feature selection on the performance of machine learning classifiers. Results indicate that Chi-2 features show high performance than both PCA features and original features. However, the highest accuracy is obtained when the proposed ensemble model LTC is used with the proposed feature fusion framework-work which achieves a 0.85 accuracy score which is the highest of the available approaches for diabetes prediction. In addition, the statistical T-test proves the statistical significance of the proposed approach over other approaches.Keywords
Diabetes Mellitus (DM) also known as Diabetes, is one of the most common diseases in human beings and has been ranked among the top 10 leading causes of death by the world health organization (WHO) [1]. Recent years have witnessed an alarming increase in DM; a 70% increase in DM disease and an 80% increase in male deaths is observed since 2000. Reports for 2016 show that 1.6 million people died due to DM while in 2019, DM was the direct cause of 1.5 million deaths [2–6]. Currently, approximately 422 million people worldwide are diabetic and the number of DM patients is increasing rapidly in low-and middle-income countries than in high-income countries. In DM patients, the blood glucose level increases in the body, which is caused by defective insulin secretion or its impaired biological effects, or both. If untreated, it can damage the eyes, heart, kidneys, stroke and lower limb amputation, nervous system, and blood vessel and cause fatality in the end [2]. Among the leading causes of DM are high blood pressure, the rise of blood glucose beyond average or blood sugar levels during fasting consistently above the normal range (IFG), the high blood level of triglycerides. Similarly, lack of workouts in people aged 45 and above, pregnant women in their 30 s, a body mass index higher than 24 kg/m2, and a family history of DM. Early prediction of this deadly disease can be helpful to take timely precautions and treatment to reduce the death ratio.
Contrary to the traditional diagnostic procedure, machine learning approaches have been utilized for DM disease prediction. Machine learning approaches can help in making a preliminary judgment about DM by utilizing the daily physical examination data of people and it can serve as a reference for doctors [7,8]. Due to the increased prevalence of DM, several machine learning approaches have been presented for early prediction of DM such as random forest (RF) [9], regression models [10], and various ensembles [11]. Besides, models’ architecture and optimization, feature engineering is an important element to optimize the performance and increase classification accuracy. For this purpose, many feature selection approaches have been utilized in the past. For example, principal component analysis (PCA) and linear discriminant analysis (LDA) have been used for feature reduction and selection with different classifiers such as support vector machine (SVM), decision tree (DT), etc. [12].
Owing to the importance of machine learning in health analytic and medical-related systems, this study leverages machine learning techniques to predict DM with higher accuracy. For this purpose, this study proposes a machine learning model, called logistic tree classifier (LTC) which is a combination of logistic regression (LR) and extra tree classifier (ETC). LR, ETC are used to make the final prediction with soft voting criteria. In brief, this study makes the following contributions
• A hybrid model is proposed which incorporates LR, ETC through soft voting criteria to make the final prediction of DM. Additionally, a methodology is proposed to optimize the performance of machine learning classifiers.
• For achieving higher accuracy, feature extraction and selection are investigated and feature fusion is proposed which combines PCA and Chi-square (Chi-2). Best features from PCA and Chi-2 are joined to make the feature vector for training the classifiers.
• The performance of well-known machine learning classifiers is optimized through hyperparameter fine-tuning. Their efficacy is analyzed by experiments on a public dataset. These algorithms include RF, ETC, gradient boosting machine (GBM), LR, support vector machine (SVM), DT, Gaussian Naive Bayes (GNB), and Adaboost classifiers.
• Performance of the proposed LTC is compared with individual machine learning classifiers, as well as, state-of-the-art approaches concerning the accuracy, precision, recall, and F1-score.
The rest of the paper is organized as follows. A literature review of the work related to the current study is given in Section 2. Section 3 presents the proposed model, adopted methodology, dataset description, and machine learning models used in this study. Results and discussions are given in Section 4. Finally, Section 5 concludes this study and provides future work.
Data mining combined with machine learning is a powerful tool for resolving a wide range of issues. It is very challenging to analyze the medical data manually due to its volume and large feature vector. Machine learning has proved its importance in several application areas and healthcare is no exception. It has provided an accurate and precise system for medical applications while dealing with sensitive medical data [13–15]. Similarly, machine learning models have been used in identifying risks at the early stages of DM. Glucose, insulin, body mass index (BMI), and blood pressure are considered risk factors for DM.
For diabetes diagnosis and classification, various machine learning techniques have been presented. For example, [16] proposed an artificial immune system using an attributed weight scheme. The attributes’ importance in class discrimination decides the weights of the attributes, which are then used for the Euclidean distance calculation. By using 10-fold cross-validation, an accuracy of 75.87% is achieved for diabetes classification. The authors in [17] compared eight different methods for diabetes detection by using artificial neural network (ANN) and artificial immune systems (AIS). Of the investigated eight classifiers, DTDN achieved the highest accuracy of 76%. Similarly, [18] proposed a system using linear discriminant analysis (LDA) and SVM to diagnose diabetes from Pima Indian diabetes dataset. LDA is used to reduce feature variables while SVM classifies the data with higher accuracy. A feed-forward neural network is also implemented for the classification. SVM performed better and achieved an accuracy of 77.6.
The study [19] presents detailed research on machine learning techniques for diabetes detection. The research analyzed two primary data processors including LDA and PCA. Several experiments are carried out to find the best data preprocessor for each technique. For performance optimization, different parameters are fined tuned. Among the five employed algorithms (SVM, DT, LR, NN, and NB), the highest accuracy of 77.86% is obtained with 10-fold cross-validation. The authors present a machine learning system in the study [20] to predict type 2 diabetes (T2D) in the following year (y + 1) using a variable in the current year (y). The dataset is collected from a private medical institute Electronic Health Records (EHR) from 2013 to 2018. Two feature elimination methods are used such as analysis of variance (ANOVA) and chi-square. An accuracy of 81% is achieved using an ensemble classifier comprising confusion-matrix-based integration (CIM), stacking classifier (ST), and soft voting (SV).
A model is proposed in the study [21] that can prognosticate the likelihood of DM in patients with higher accuracy. Early detection of DM is made using three different machine learning algorithms including NB, DT, and SVM. Experimental results show an accuracy of 76.30% using NB. Results are also verified using receiver operating characteristics (ROC) curves. The study [22] found that most of the data related to medical shows non-linearity, inherit correlation, and non-normality. The study asserts that machine learning algorithms with Gaussian process-based classifier techniques are better solutions for medical data. Using three kernels linear, radial, and polynomial with machine learning enhance the classification accuracy to 81.97%.
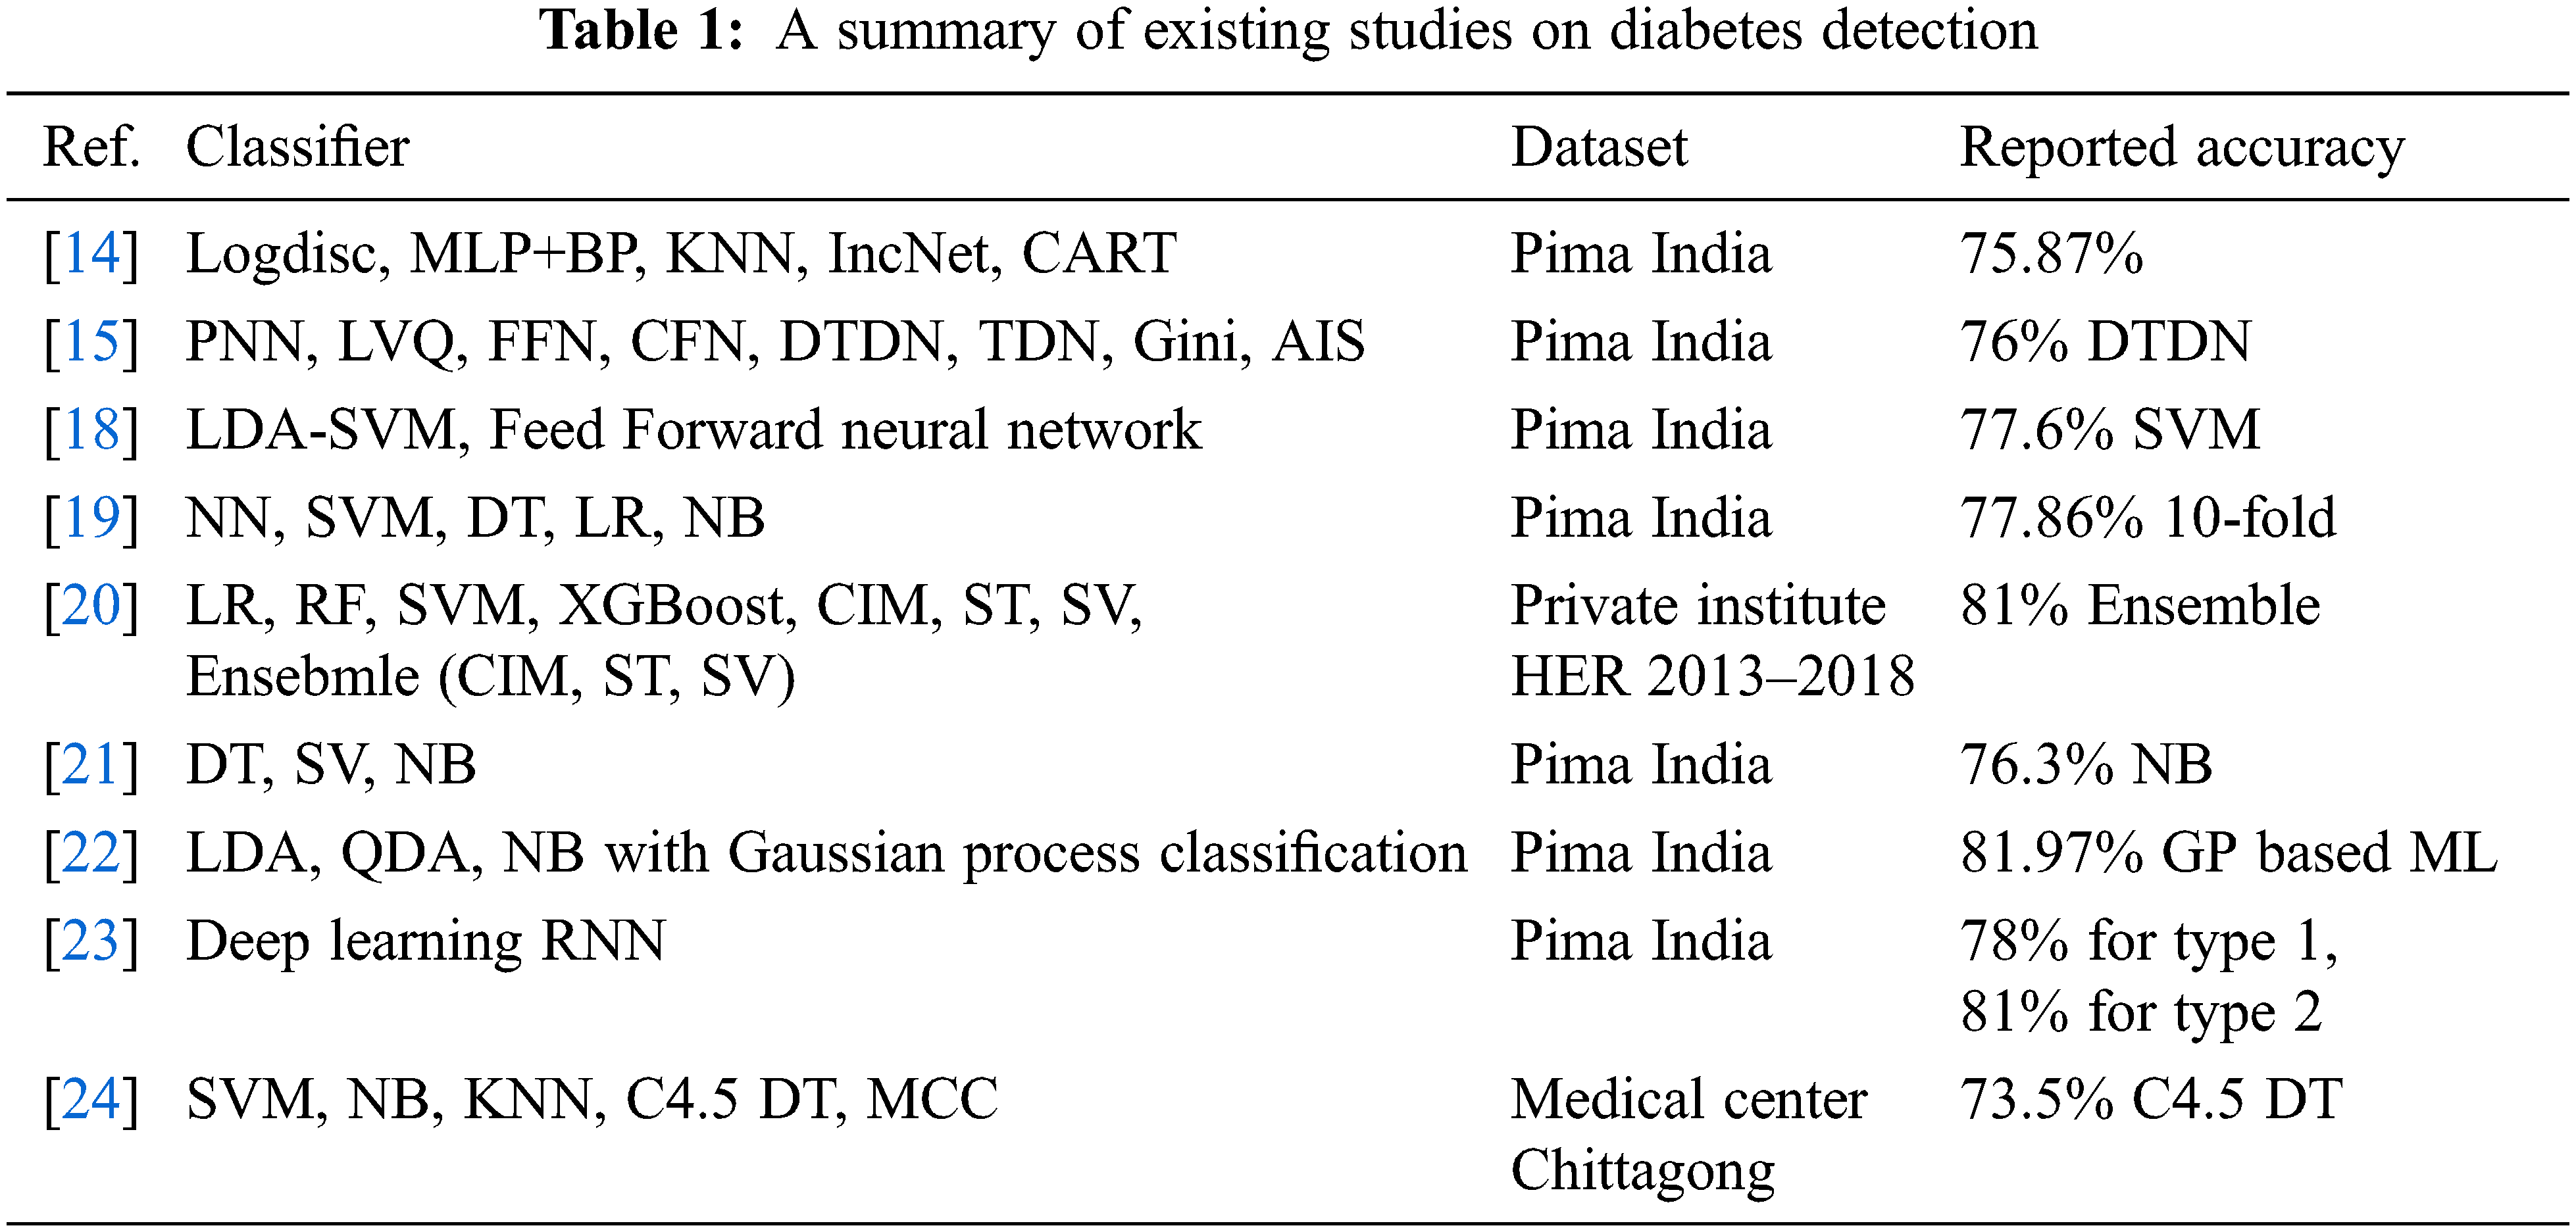
The study [23] proposed a deep learning-based model RNN for the prediction of two types of diabetes. Using an 80:20 train-test split, an accuracy of 78% and 81% is obtained for type 1 and type 2 diabetes, respectively. Similarly, the study [24] investigates the early prediction of DM using machine learning techniques. Four machine learning classifiers are investigated in particular. Using a dataset of 200 records, an accuracy of 73.5% is achieved with the C4.5 decision tree. The study [25] worked on diabetic prediction using data oversampling and augmentation. They deploy the deep learning model CNN to achieve significant results. They used sparse autoencoder for feature augmentation variational autoencoder for data augmentation. The proposed approach achieved a significant 92.31% accuracy score. The study [26] worked on a review for kidney and diabetes disease prediction using retinal detection. They perform analysis on deep learning approaches for disease detection in their study. Despite the above-discussed research works and the reported accuracy, these works lack in several ways. First, the reported accuracy requires further research and development of models to enhance the performance of models for DM prediction which includes novel architectures, parameter fine-tuning, and ensemble models. Secondly, several of the models discussed above use limited data and the results can not be generalized. Thirdly, the feature selection part is not very well studied for DM prediction. Owing to these factors, this study emphasizes the investigation of PCA and Chi-2 to enhance the performance of DM prediction. A summary of the above-cited research works is presented in Table 1.
This study proposed an approach using machine learning classifiers for the prediction of DM with higher accuracy. The architecture of the proposed approach is shown in Fig. 1.

Figure 1: Architecture of the proposed methodology
For the proposed approach, feature selection is performed using a feature fusion technique. Two individual feature selection techniques Chi-2 and PCA are used in feature fusion. After that, data are split into 85% and 15% ratios for training and testing, respectively. For classification, an ensemble model is used that combines LR, ETC classifiers using the soft voting criteria. In the end, the performance is measured in terms of accuracy, precision, recall, and F1-score.
The proposed model is a fusion of two best performing classifiers LR and ETC on the diabetic disease dataset. LR is a linear model while ETC is a tree-based ensemble model so the combination of these models gives a strong hybrid model LTC. Fusion of models is done using the soft voting criteria in which the probability of each class from an individual model process is used to calculate the average probability of a class. The mathematical representation of LTC is shown in Fig. 2.

Figure 2: LTC architecture diagram
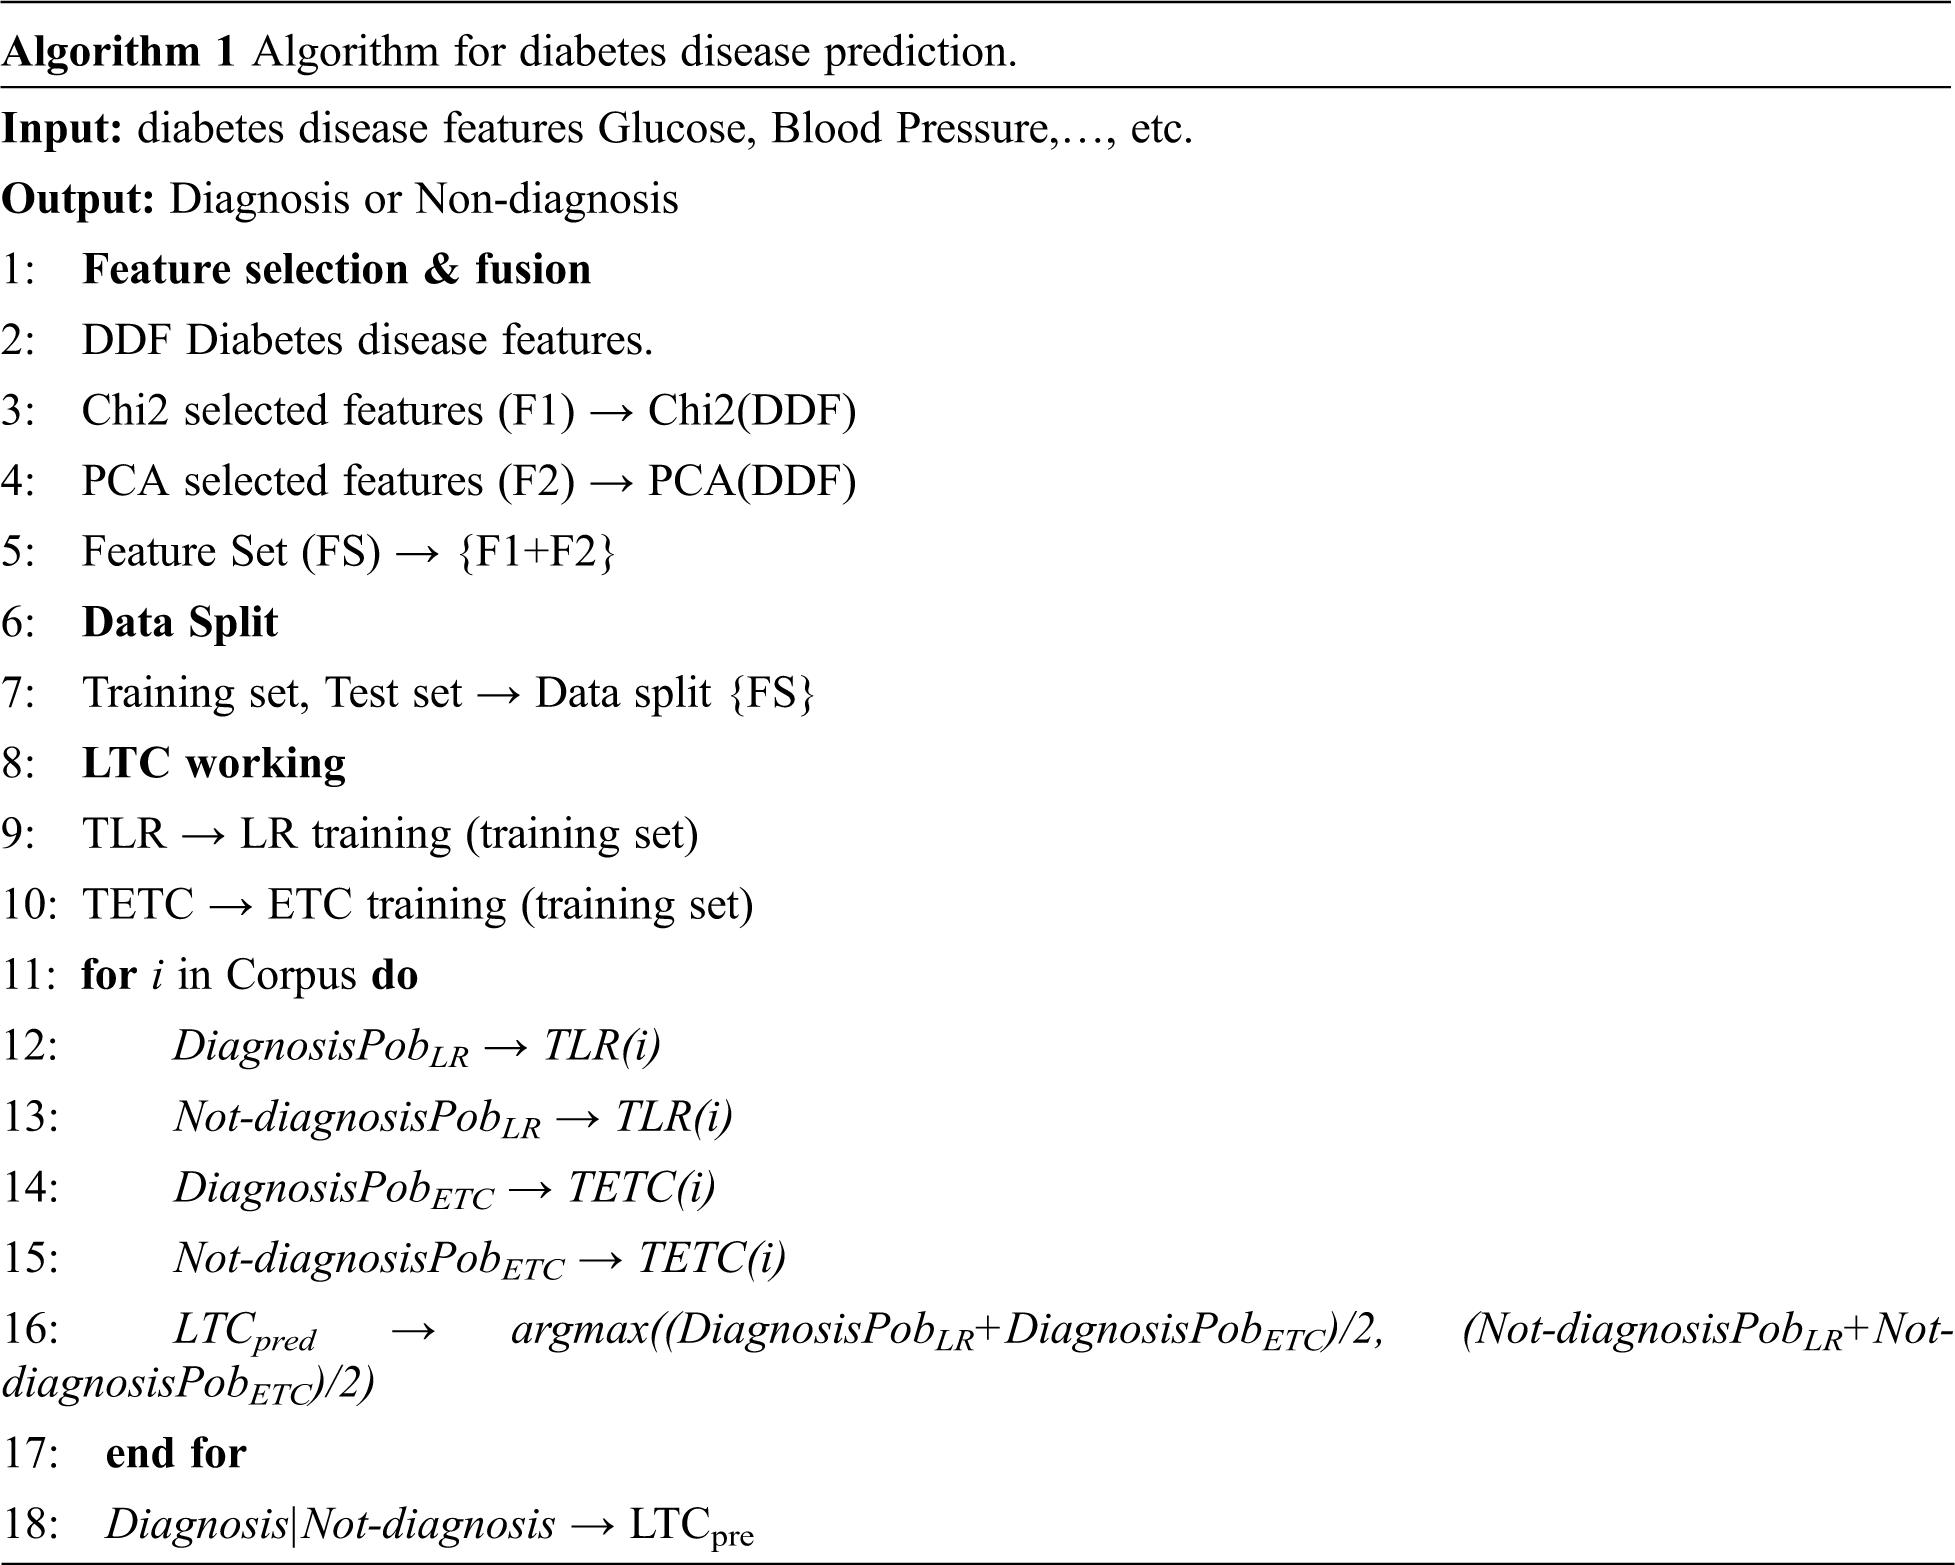
Algorithm 1 shows the working of the proposed model LTC. These models are combined under soft voting criteria. LTC takes the features from the diabetes disease data for training and prediction by finding the probability of each class using the steps given in Algorithm 1.
3.1.2 Feature Selection and Fusion
For identifying the appropriate features for the training of the machine learning model, feature selection techniques are used to extract and fuse the selected features to make an efficient feature set [26]. Feature selection is significant for the good fit of machine learning models because each feature has its importance with respect to the target class. So an approach is developed that only includes the features with a higher contribution for the final class prediction. As a result, several benefits can be obtained like essay interpretation of learning models, lowering the model variations, and reducing the training time and computational cost. The optimal future solution removes the complexity of the system and enhances the reliability of classification accuracy and stability. Two feature selection methods, chi-2 and PCA are used in this study for this purpose. Feature fusion can play a vital role to boost the performance of the machine learning models because it helps to generate a more correlated feature set [27,28]. This study also combined two feature sets into one to make the training feature set more correlated. We used two techniques for feature extraction Chi2 and PCA; both are good feature extraction approaches. Each technique gives the five best features but reduces the size of the feature set as compared to the original which impacts the performance of models. They both reduce the feature size but provide more appropriate feature set and combining the highly correlated feature sets make sense to obtain a better prediction. Empirical findings of this study showed that combining two highly correlated feature sets obtained using Chi2 and PCA is better than using either of them. Recent studies show that feature combinations help to obtain higher classification accuracy [29,30].
Chi-square is a non-parametric statistical and analyzing method which selects the top n features [31]. Chi-2 is widely used for data analysis tasks [32]. Chi-2 is used to find whether a specific term and the occurrence of a specific class are independent. Formally, for a given document D, the quantity for each term can be estimated and ranked by its score. Chi-2 finds the score by using the equation
PCA is a linear feature selection technique used to select the best features from the data given features [33]. It is an unsupervised approach based on Eigenvectors analysis to find the critical original features for the principal component. The principle component technically is a linear combination of optimal weighted observed features. The output of the PCA features selection technique is principal components which are the number of features less or equal to the original dataset. PCA feature selection can be useful in many problems but in cases of excessive multicollinearity, it’s not preferred. Fig. 3 shows the architecture diagram of the proposed feature fusion.

Figure 3: Architecture diagram for feature fusion using PCA and Chi-2
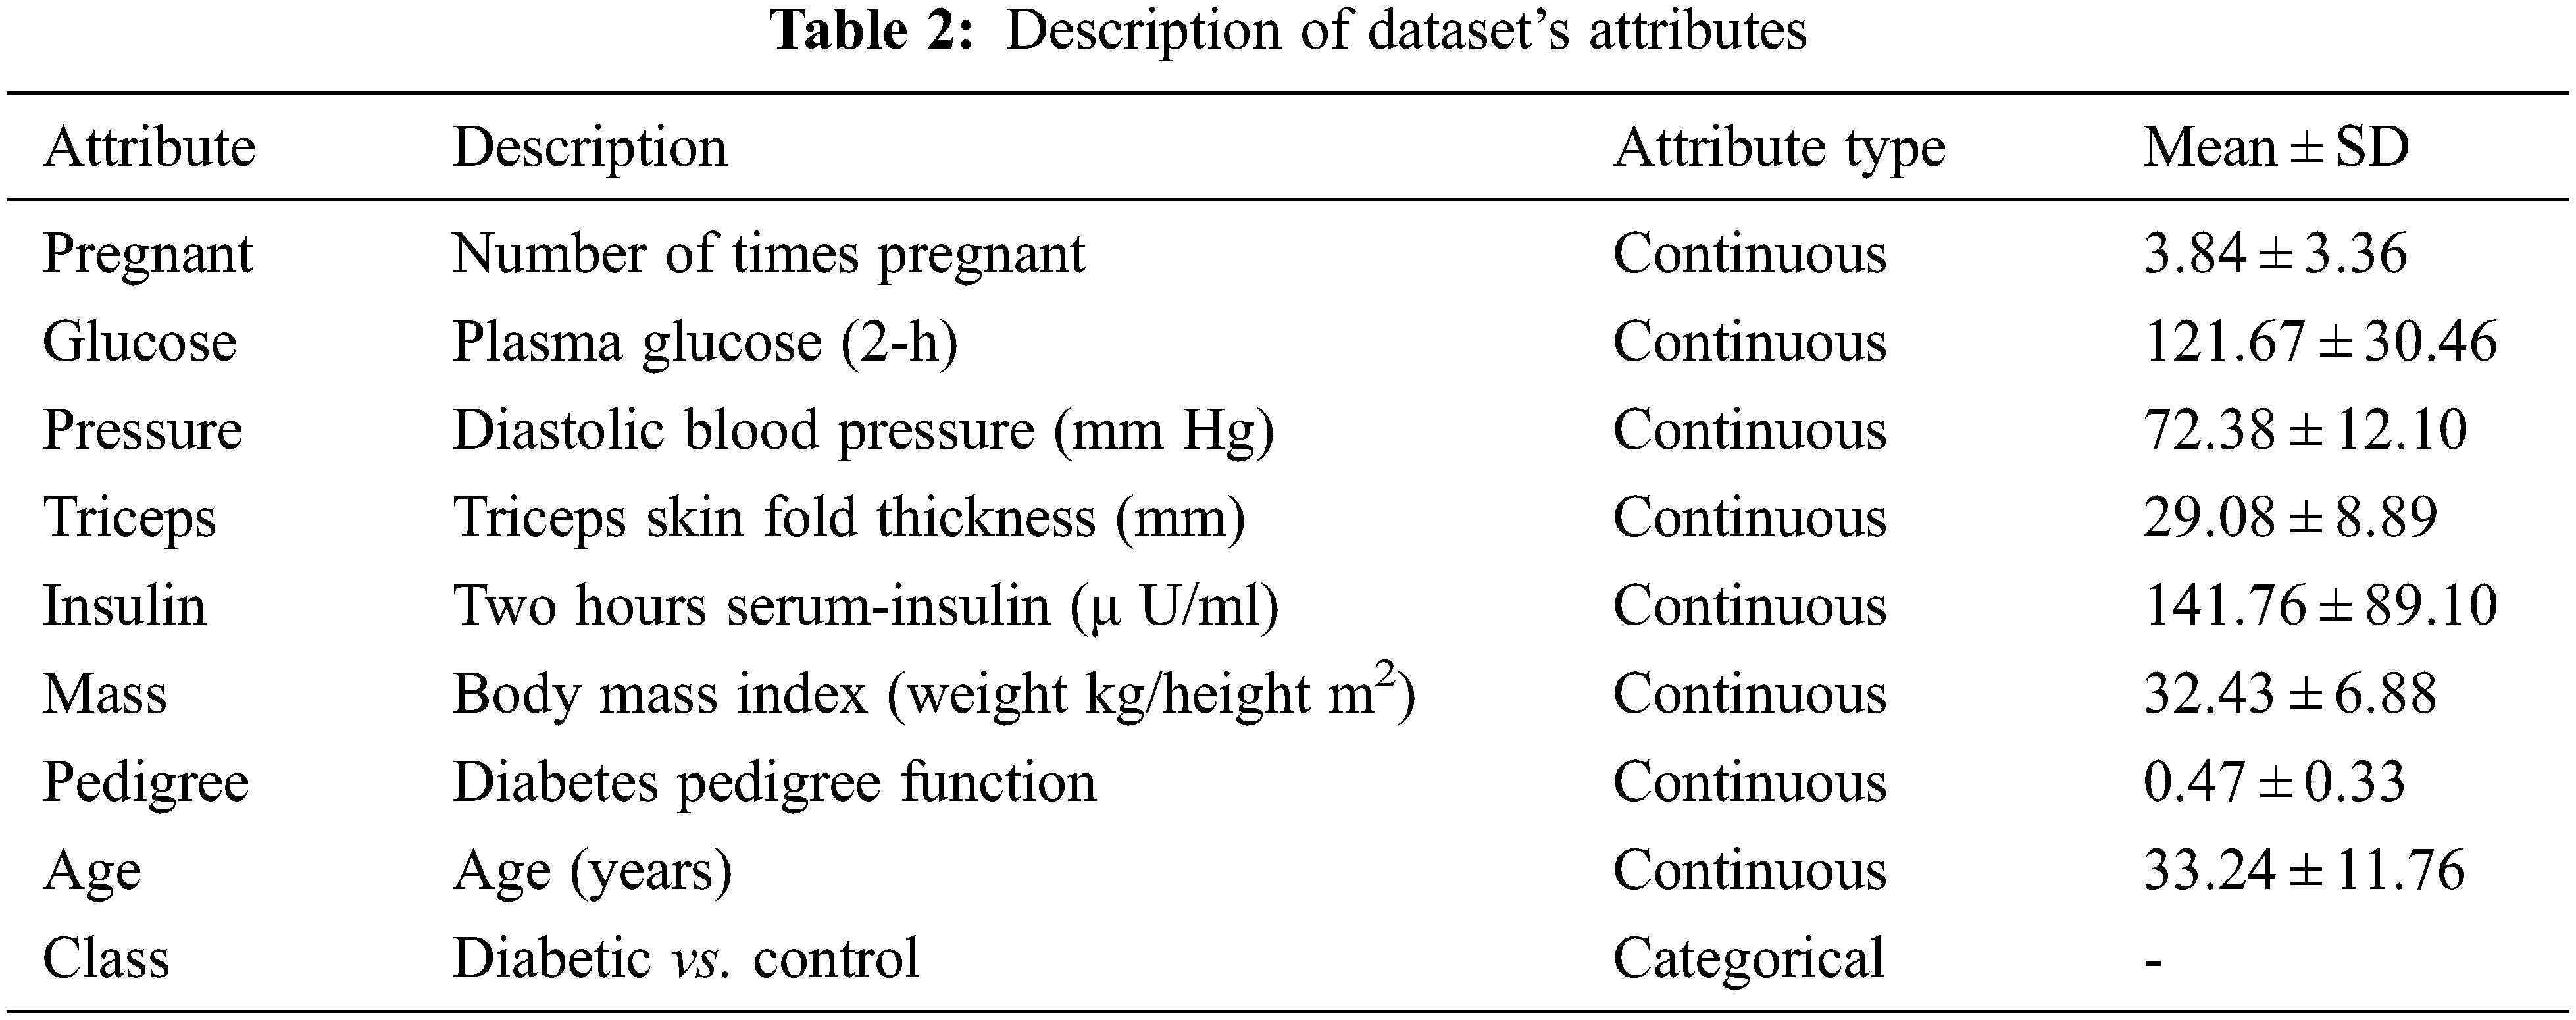
The dataset has been taken from the UCI (University Of California, Irvine) repository. It contains 768 samples from 21 years old female patients of Pima Indian heritage. Out of 768 samples, 268 samples belong to diabetic patients while the rest 500 are for non-diabetic patients. The dataset contains lots of zero values for different features such as 27 patients having 0 BMI. Similarly, diastolic blood pressure is 0 in 35 patients, 374 patient has zero serum insulin level, and 227 patient has zero skinfold thickness. To solve this problem, feature selection is carried out to select the features that contribute highly to predicting the final class. The feature description is shown in Table 2.
3.2 Machine Learning Algorithms
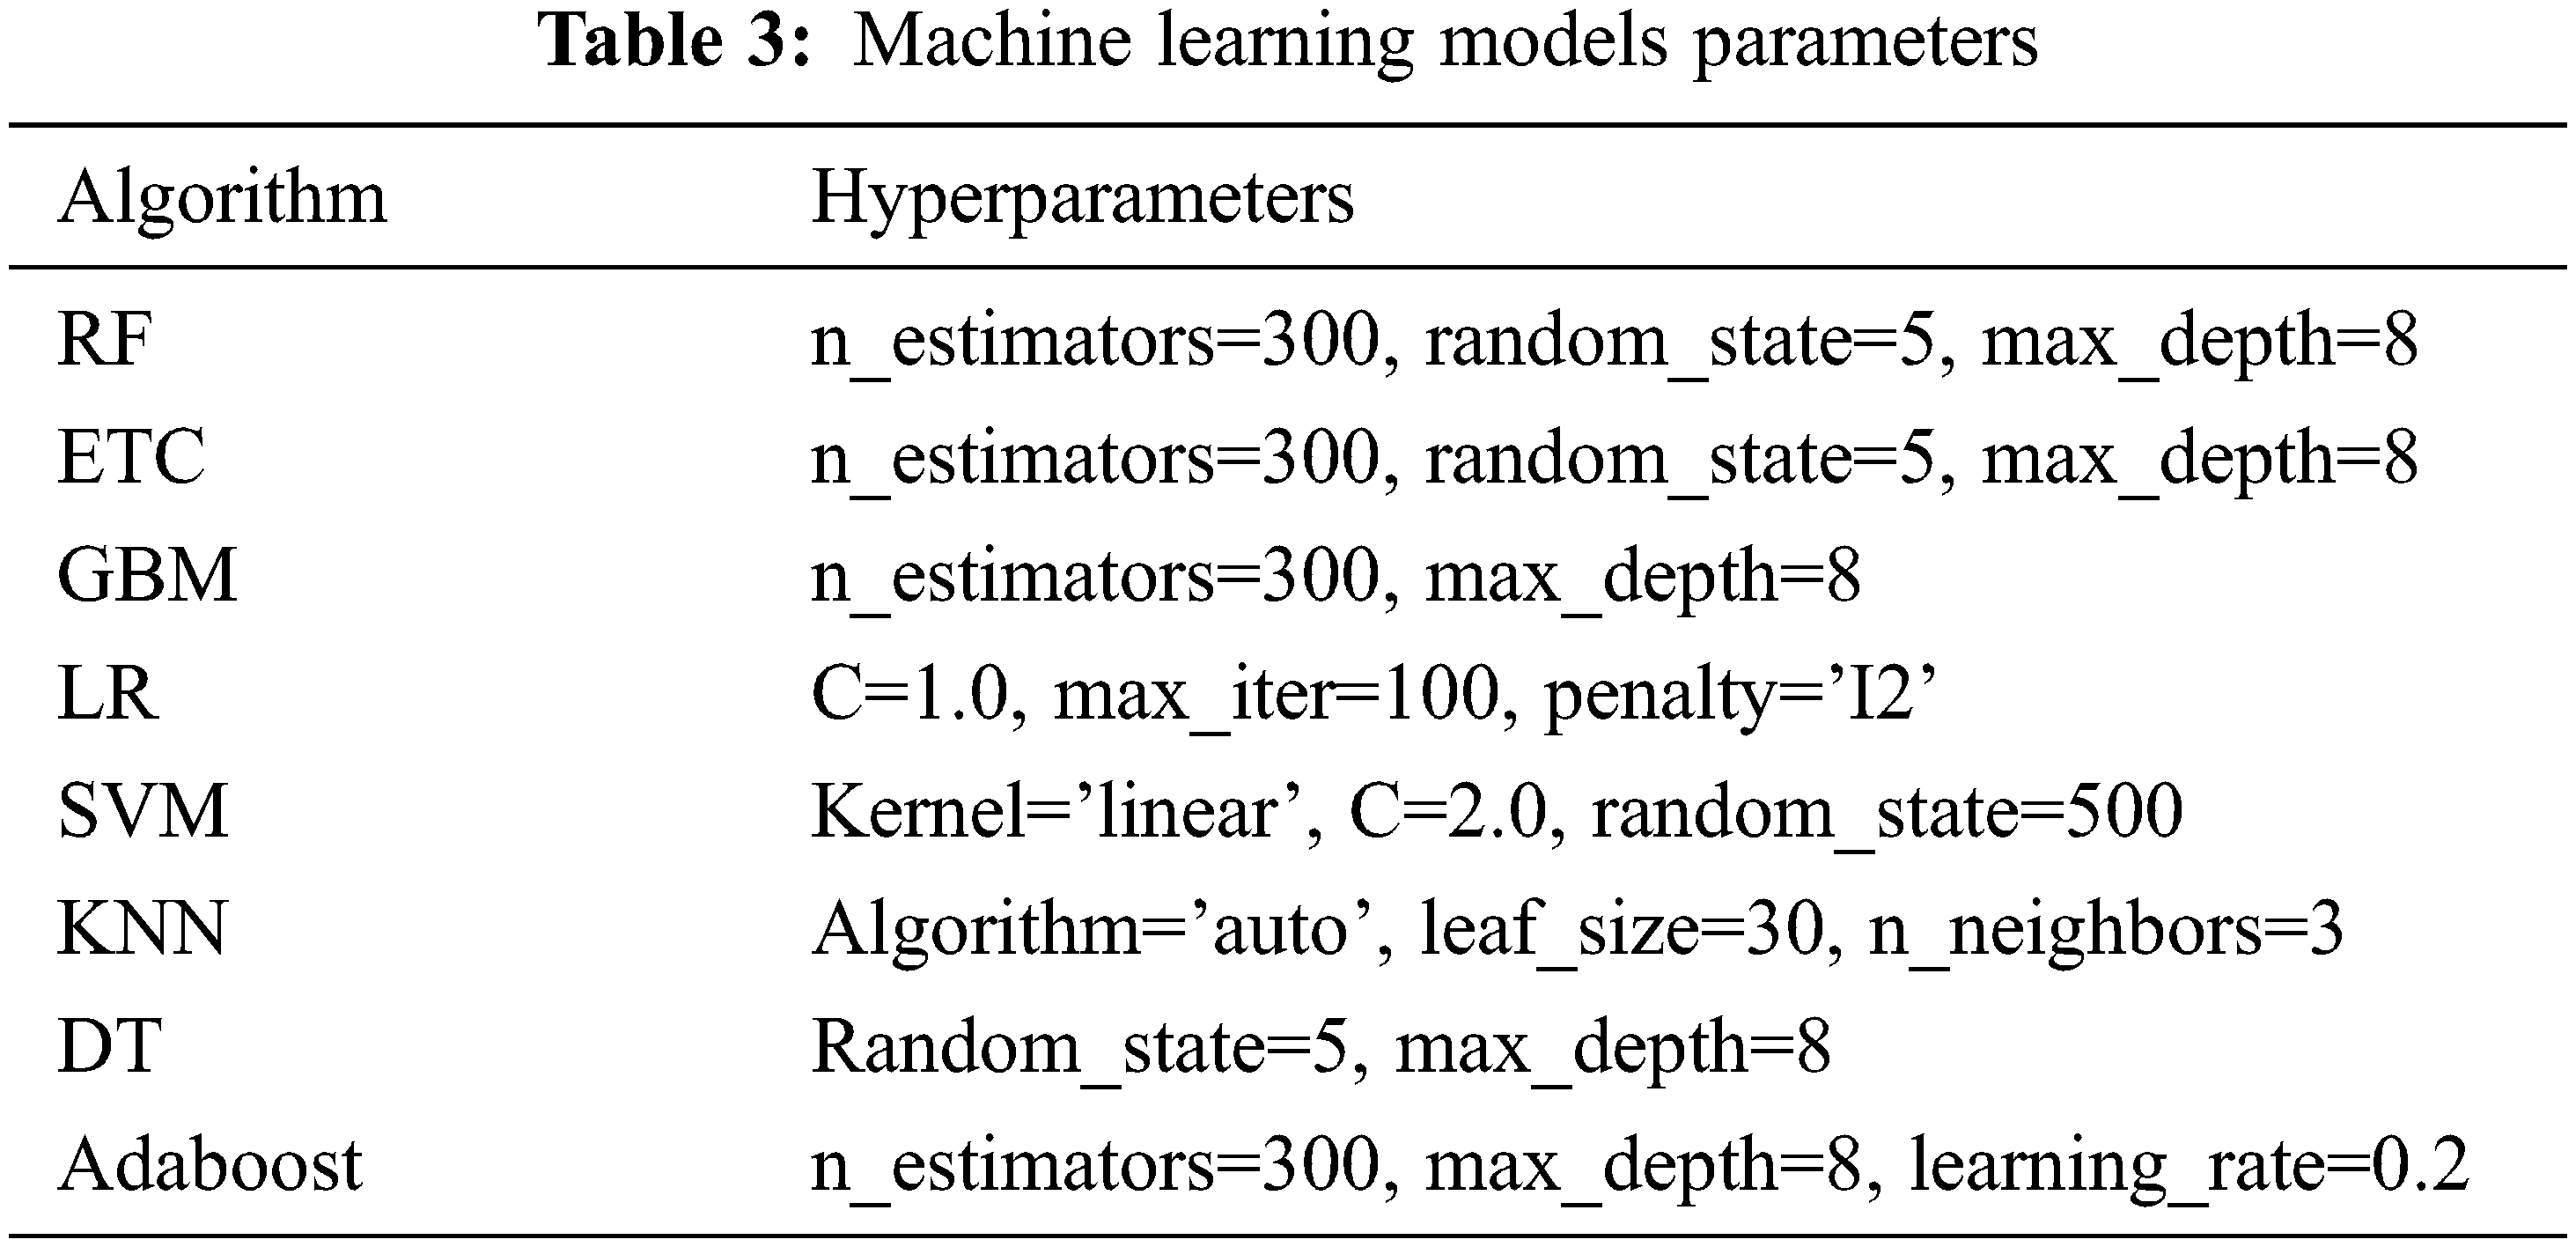
Several machine learning classifiers are used to perform diabetic disease prediction. Models such as LR, Adaboost, GNB, KNN, RF, ETC, and DT are first evaluated individually then the best performers are used to make a hybrid model. These models are used with their best hyperparameters setting which is found through fine-tuning. The list of used hyperparameters for each model is given in Table 3.
3.2.1 Support Vector Classifier
SVC is a supervised machine learning model that is widely used for classification and regression [23]. SVC uses a hyperplane to classify the data. SVC tries to find the best hyperplane to separate different classes by maximizing the distance between sample points and the hyperplane. For non-linear data classification SVC uses kernel trick which maps the input features into high dimensional space.
LR is an adaptive regression technique that builds predictors as a Boolean combination of binary co-variates [24]. LR is named for the function used at the core of the method, the logistic function. The logistic function is also called the sigmoid function. It is an S-shaped curve that can take any real-valued number and map it into a value between 0 and 1. LR is the best choice when the dependent variable is categorical. The logistic function can be defined as.
While logistic regression can be defined as
Adaboost is a tree-based ensemble classifier that uses boosting algorithms to train weak learners and transform them into strong learners. It is the best choice to use in conjunction with different algorithm types to enhance the classifier performance. It shows sensitivity in handling noisy data and outliers. Also known as an out-of-the-box classifier, it is less susceptible to the over-fitting problem than other machine learning algorithms [31]. The significant difference between Adaboost and DT is that Adaboost tries to resolve the weakness of the previous tree while the DT constructs an independent tree every time [32]. Each tree in the Adaboost depends on the outcome error rate of the previously built tree.
GNB is a variant of Naive Bayes which is based on Bayes theorem [33]. It works on conditional probabilities to predict the output of an occurrence [34]. For example, if the sample is fit into k categories with k = {c1, c2,…,ck}, the resultant output is c. The GNB function is given below where c shows class and d sample.
The k-NN is a non-parametric algorithm that takes the nearest neighbor to the point of prediction [35]. For example, in a document with the x train set, the algorithm finds all the neighbors of x. Given that there may be overlaps among neighbors, the algorithm is given a score to the K neighbors and only K neighbors with the maximum scores are considered. KNN weighted cosine measure is shown as
where T is the set of words, and yt and xt are the term frequencies. The sum of d neighbors that belong the class c can be calculated as,
Then the total similarity sum of d is
where d is contribution defined in terms of Sc of classes c.
RF is a tree-based ensemble classifier that is based on the number of DTs. It generates multiple DT models, where every DT independently learns and makes predictions. The predictions then collectively vote for the final predicted result using majority voting criteria [36]. The ensemble classifier gives better results by using multiple classifiers than an individual classifier. The predictions in RF are assigned based on voting as follows
ETC is a tree classifier constituted of randomized trees. It is an ensemble learning technique that makes the final classification result by aggregating de-correlated trees in DTs forest [37]. Its working principle is similar to RF but the difference lies in building a tree. Random samples of K best features are used for the decision tree, and Gini-index is used to select the best feature for the split data in the tree [38].
DT is the simplest machine learning algorithm that constructs association rates to find and predict the target labels. DT selects the root node to build the tree and traverses it down to the leaf node to predict the label [39]. There are two main techniques to find the root node in DT: Gini index and Information Gain (IG) [40]. IG is the default criteria to select the top node in DT.
This study used four evaluation matrices to evaluate the model performance. These evaluation parameters are accuracy, precision, recall, and F1 score.
Accuracy is the ratio of the number of correctly predicted samples to the total number of samples. The accuracy score range is between 0 and 1 where 0 is the minimum score and 1 is the maximum score.
where TP, TN, FP, and FN represent true positive, true negative, false positive, and false negative, respectively.
Precision is the ratio of the number of positive samples correctly predicted to the number of samples predicted as positive. The precision score range is between 0 and 1 where 0 is the minimum score and 1 is the maximum score.
Recall, also known as sensitivity, it is the ratio of the number of positive samples correctly predicted to the number of actual positive samples. The recall score range is between 0 and 1 where 0 is the minimum score and 1 is the maximum score.
F1 score is the harmonic mean of precision and recall. It has values ranging from 0 to 1. F1 score determines how precise and robust a classifier is by considering both precision and recall values. F1 score ranges between 0 and 1 where 0 is the minimum score and 1 is the maximum score
This section describes the results of the experiments for the DM prediction.
4.1 Performance of Machine Learning Classifiers Using Original Features
Initially, the experiments are performed using the original features from the dataset. Table 4 shows the results using all features from the dataset.
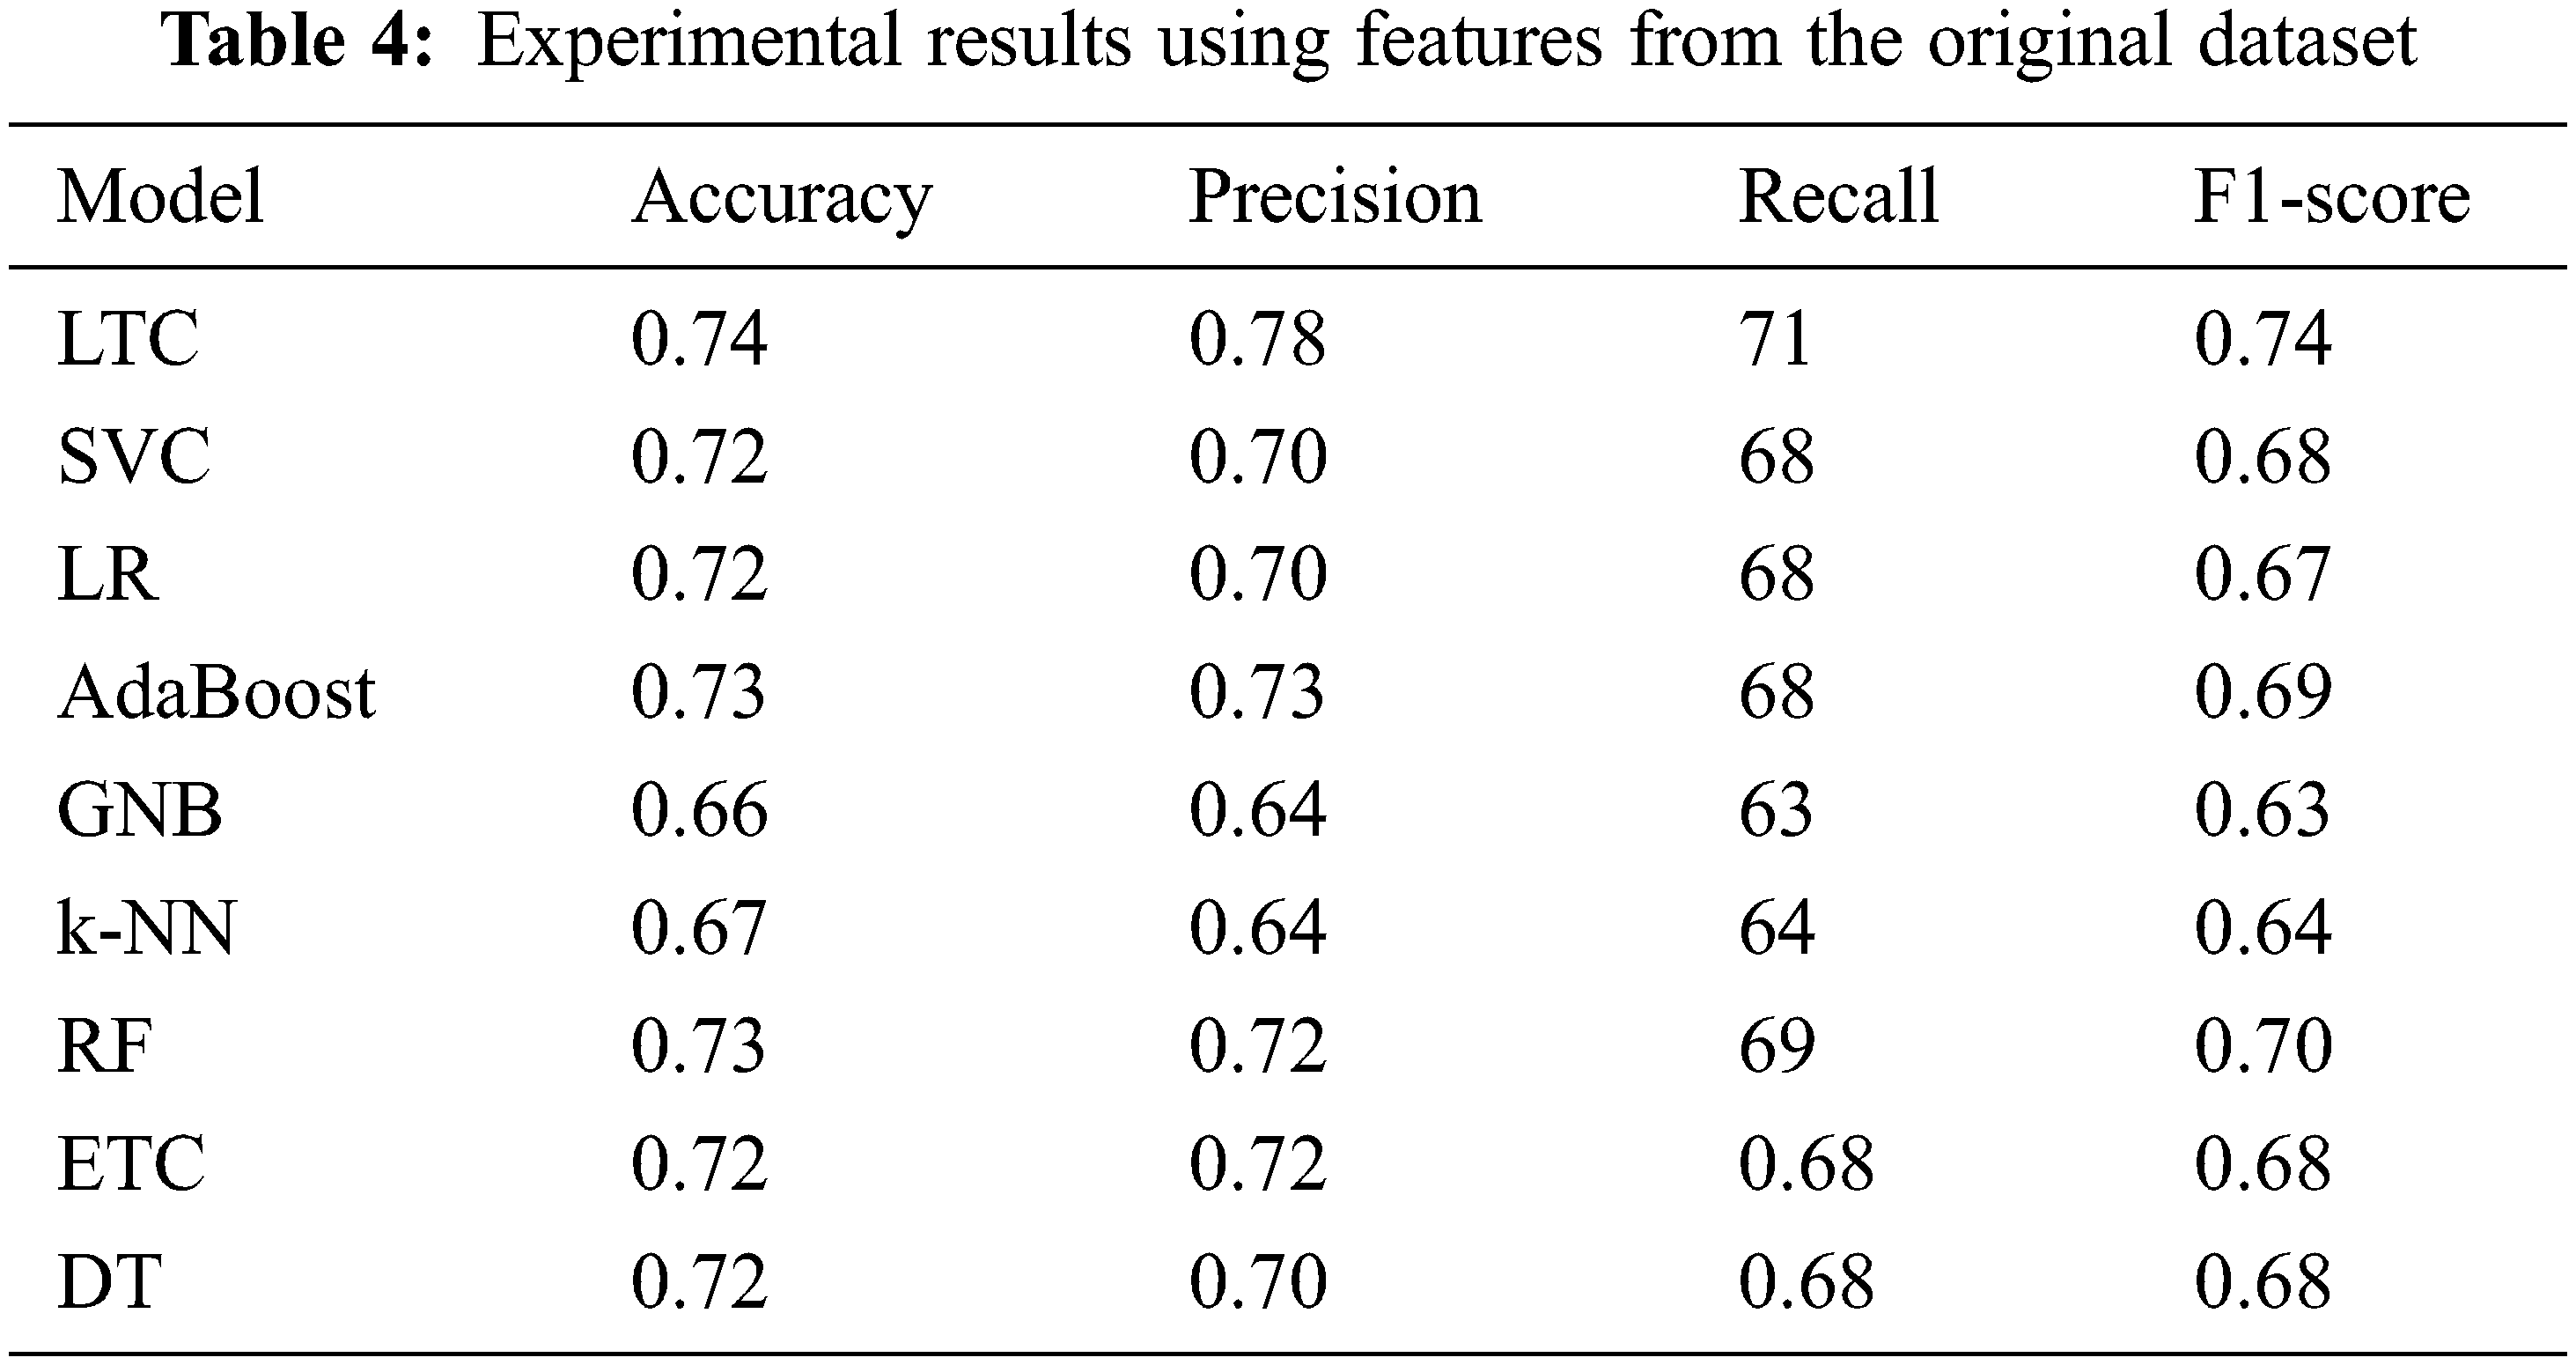
Results indicate that the proposed ensemble model LTC performs better than individual machine learn-ing classifiers with accuracy and F1-score of 0.74 each. Overall the performance of all machine learning classifiers is close to LTC, however, the difference between the accuracy and F1-score is higher than LTC. GNB and k-NN obtain the lowest accuracy scores of 0.66 and 0.67, respectively for the task at hand. Fig. 4 shows the comparison of accuracy, precision, recall, and F1 score for all classifiers used for experiments. It indicates that the performance of the proposed LTC is superior to all the classifiers used in this study in terms of accuracy, precision, recall, and F1-score.
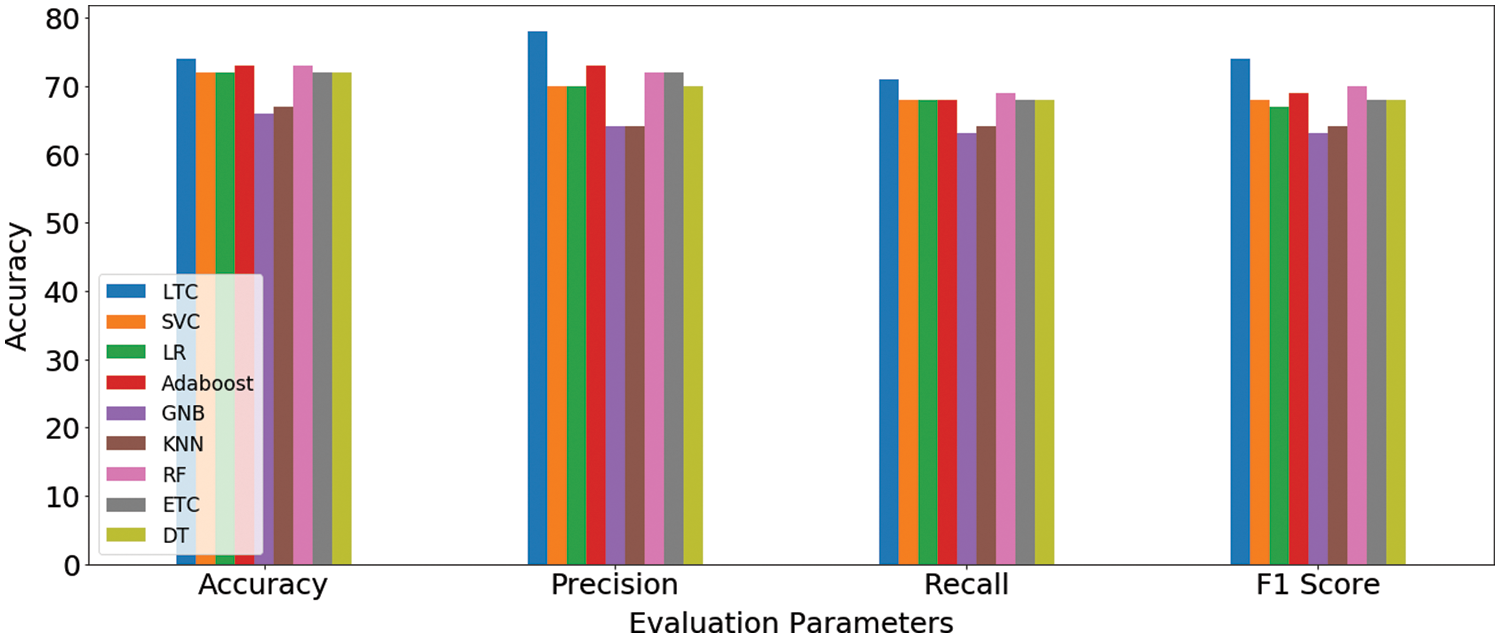
Figure 4: Machine learning models’ results comparison on original dataset features
4.2 Results Using PCA and Chi-2 Features
For analyzing the performance of PCA and Chi-2 selected features, initially the machine learning classifiers and the proposed model is trained and tested on features taken individually from PCA and Chi-2. Table 5 shows the results when classifiers are trained and tested on PCA features. Results indicate that the performance of machine learning classifiers has been degraded with PCA features. SVC achieves the best performance with a 0.73 accuracy score with a 0.10 increase as compared to features from the original dataset. Similarly, the performance of GNB has been increased. However, LTC, LR, AdaBoost, RF, ETC, and DT experience a substantial decrease in the performance with PCA features while k-NN has no change. Results are in conformity with other research work where PCA features show poor performance compared to original features [34]. PCA tends to show superior performance with a large number of features and instances.
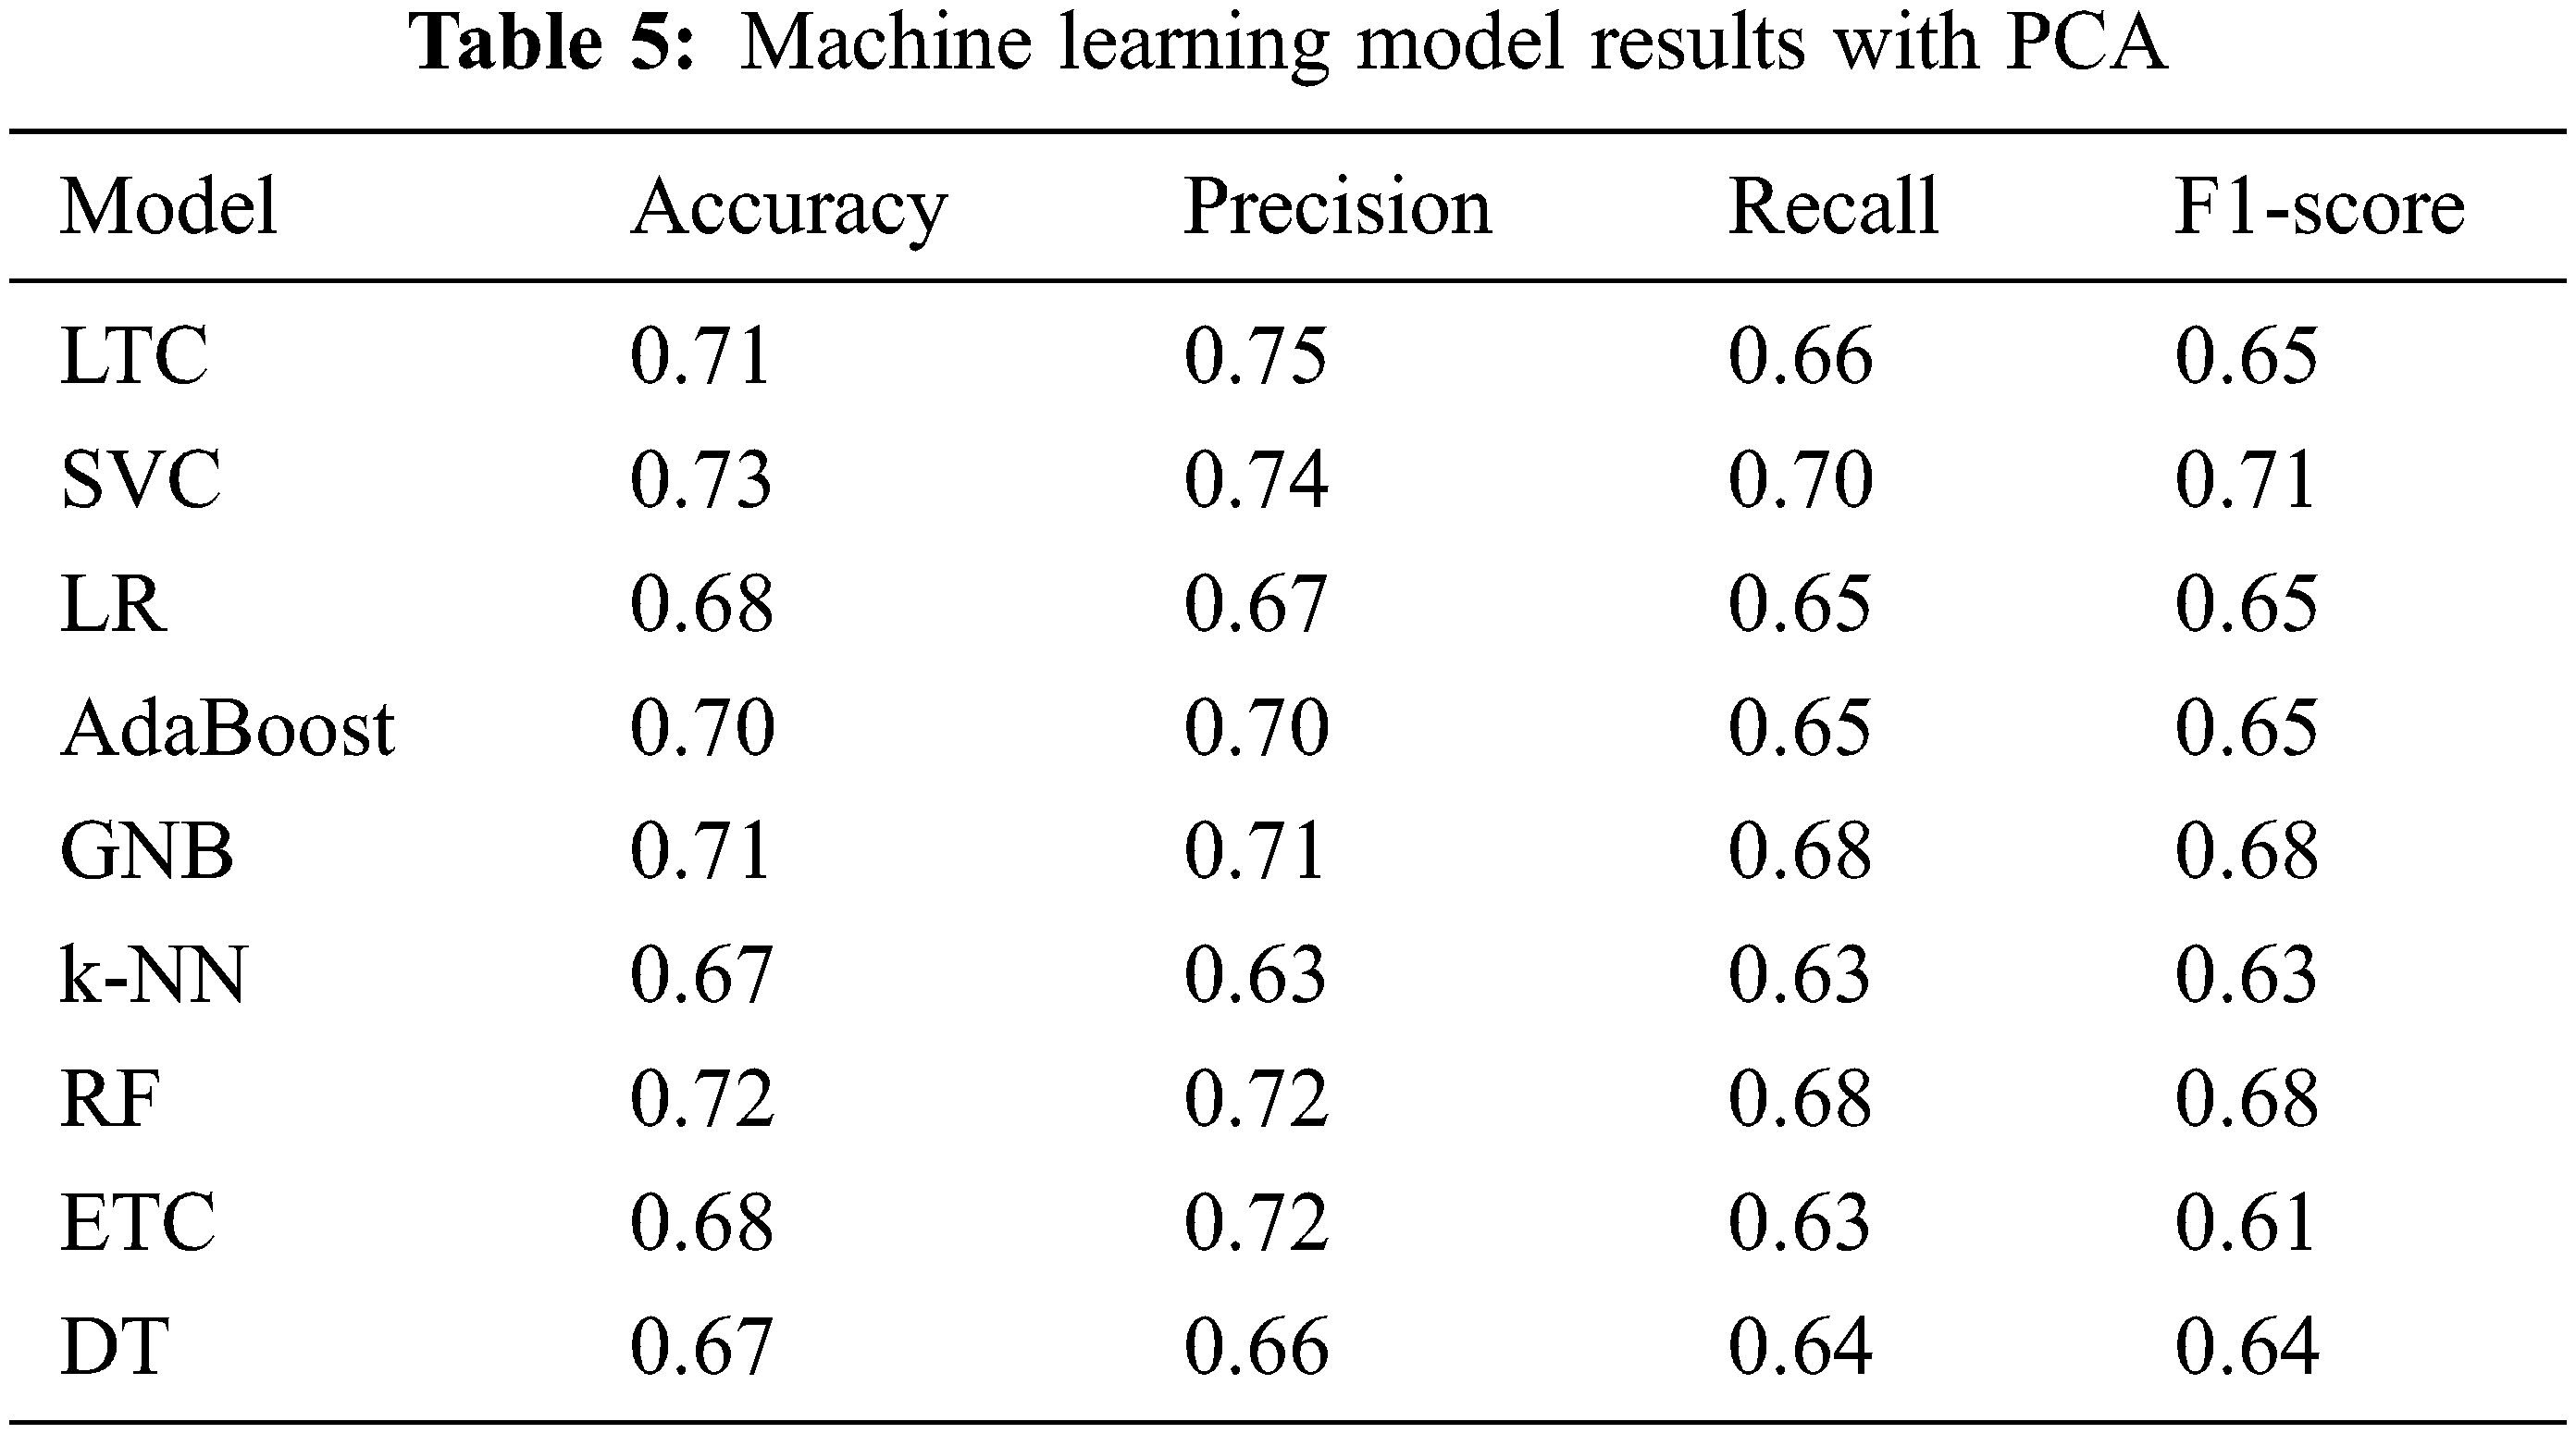
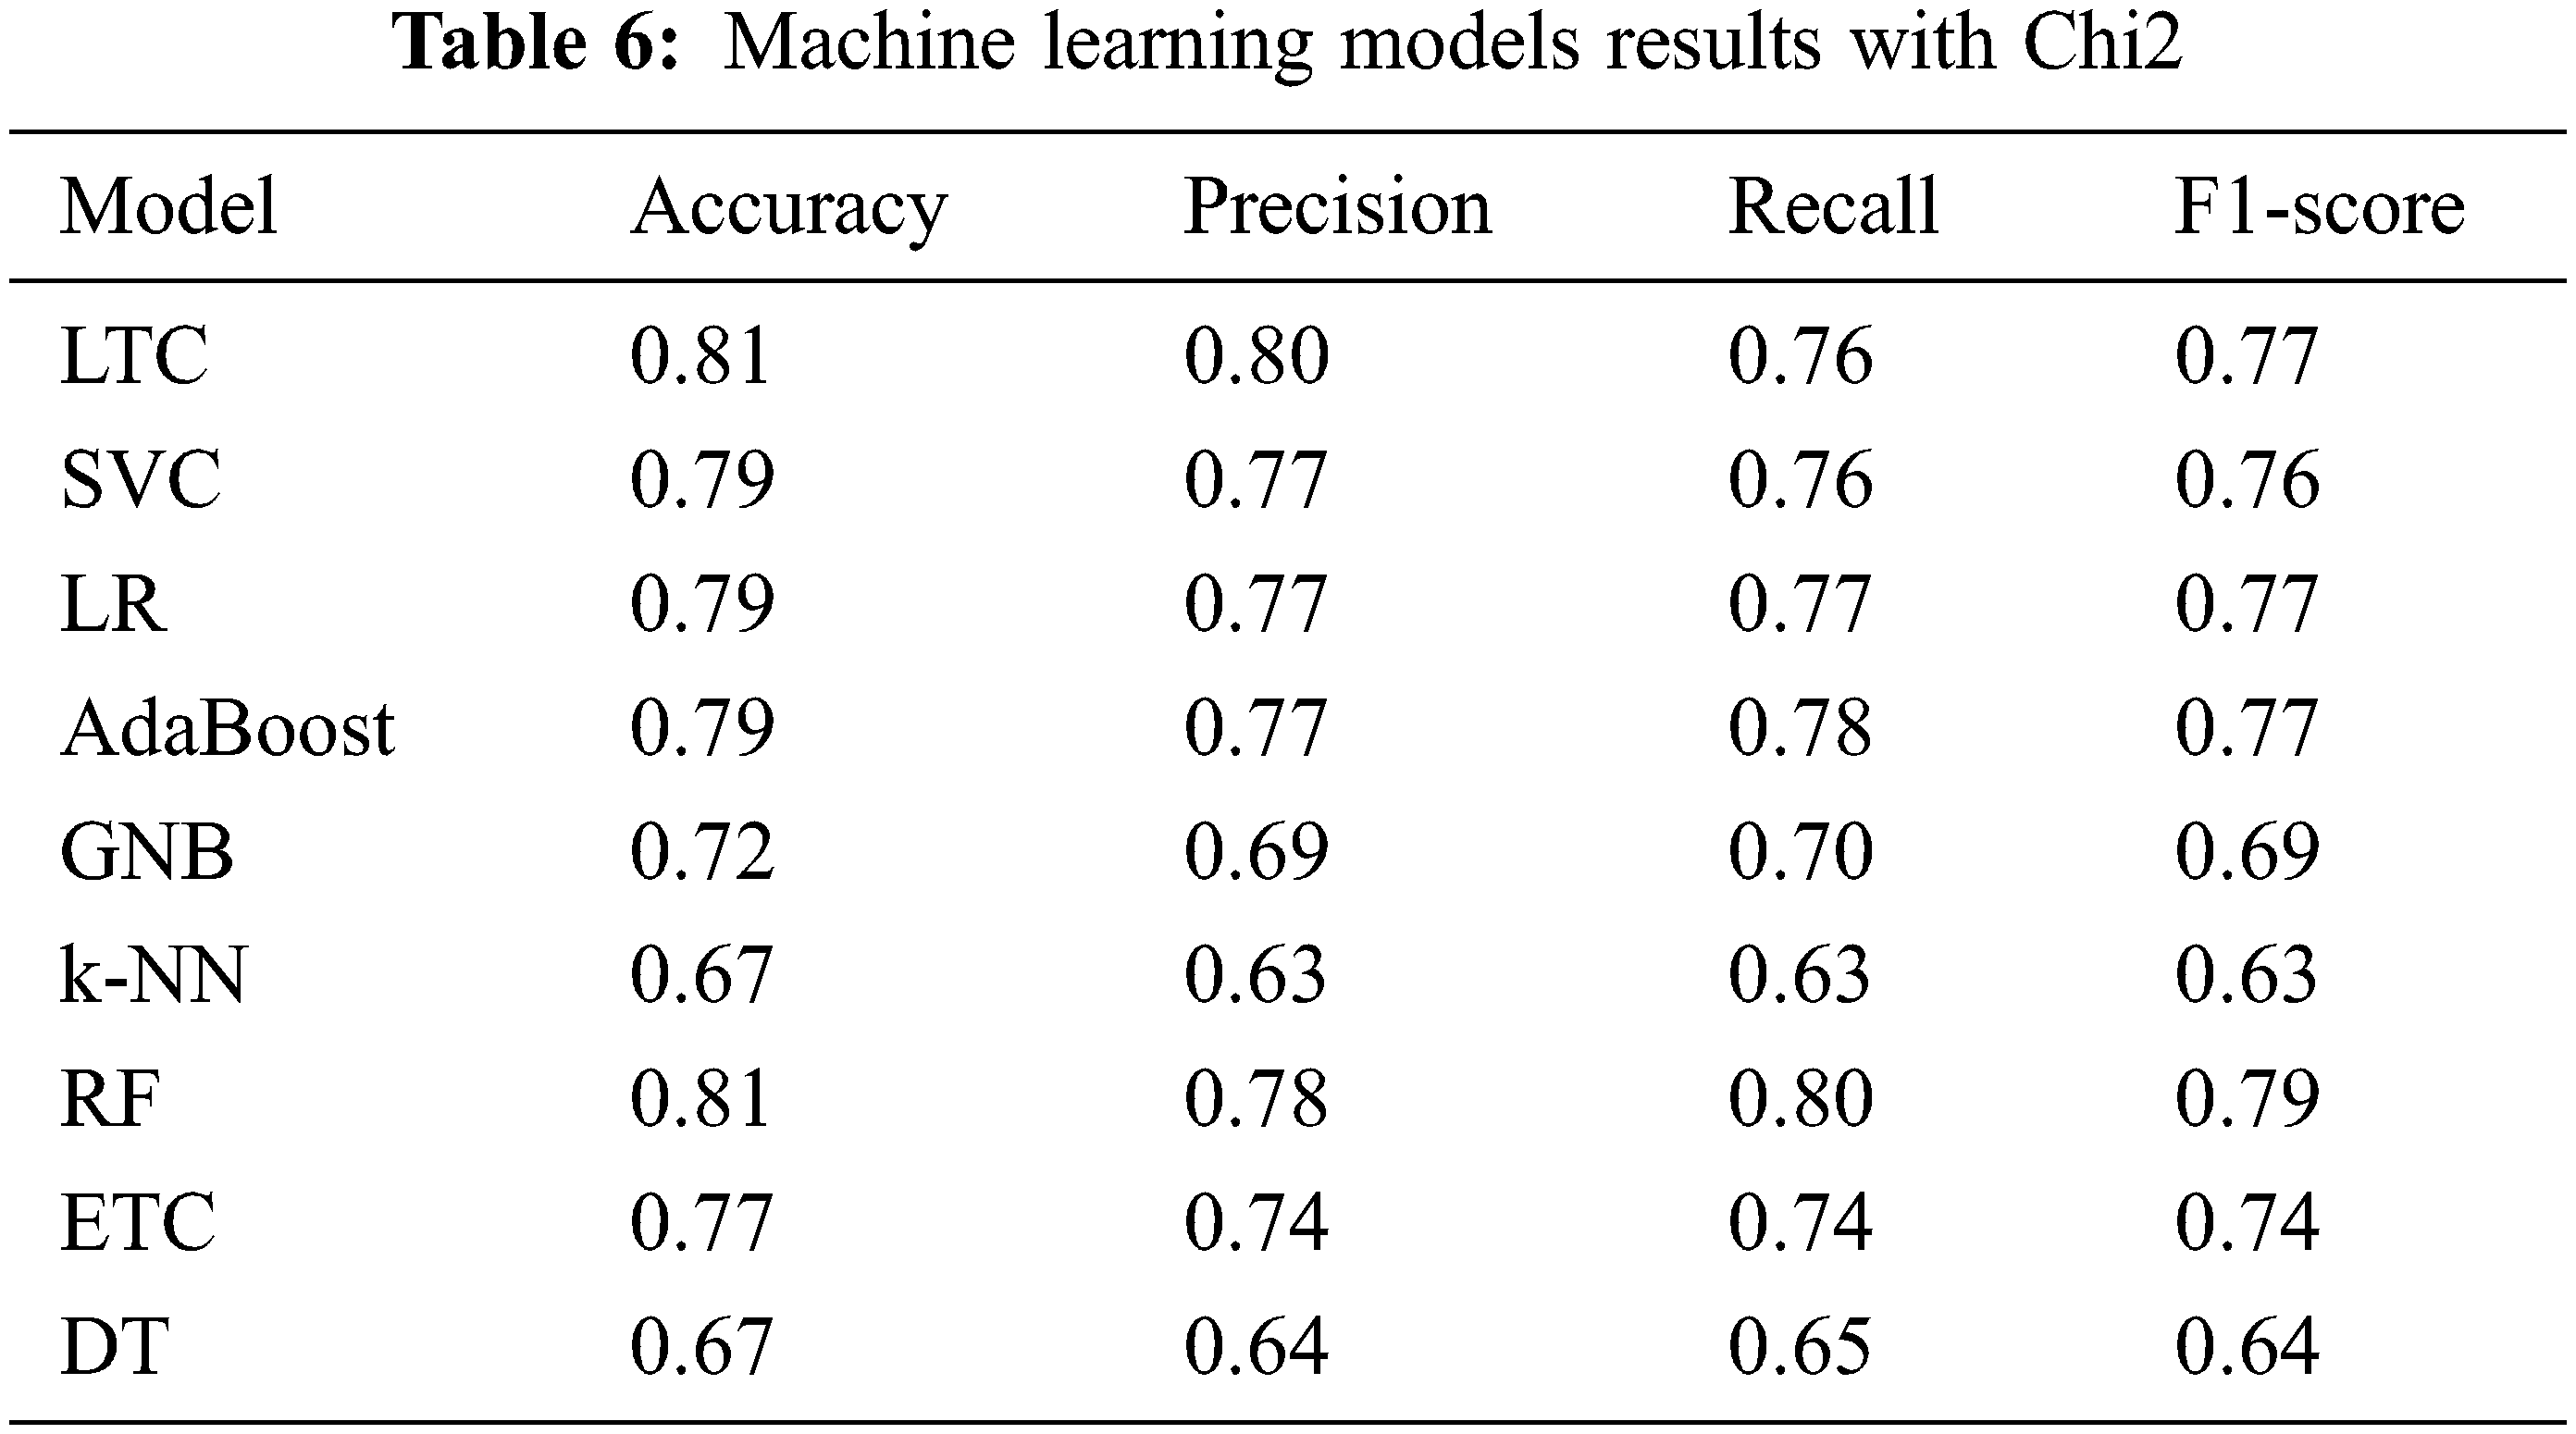
Table 6 shows the classification results when classifiers are trained and tested on Chi-2 features. Results suggest that the performance of the machine learning classifiers has been elevated when Chi-2 features are used. LTC and RF achieve the joint highest accuracy of 0.81 which is a 9% increase from the original features and a 14% increase compared to PCA features. Similarly, SVC, LR, AdaBoost, RF, ETC show better performance with Chi-2 features with the exception of DT whose accuracy is reduced from 0.72 to 0.67. There is no change in the performance of k-NN. Research [28] reports similar results where Chi-2 features show better performance than PCA features.
4.3 Results Using Feature Fusion
As previously discussed that all features are not equally important and various features can be dropped based on their minor contribution to predict the target class. The dataset contains eight features and all features are not important for a good fit of machine learning models. For reference, the importance of dataset features is shown in Fig. 5. So the extraction of the most important features for training can increase the performance of machine learning models. For that, important features are extracted using Chi-2 and PCA and fused to make one feature vector.
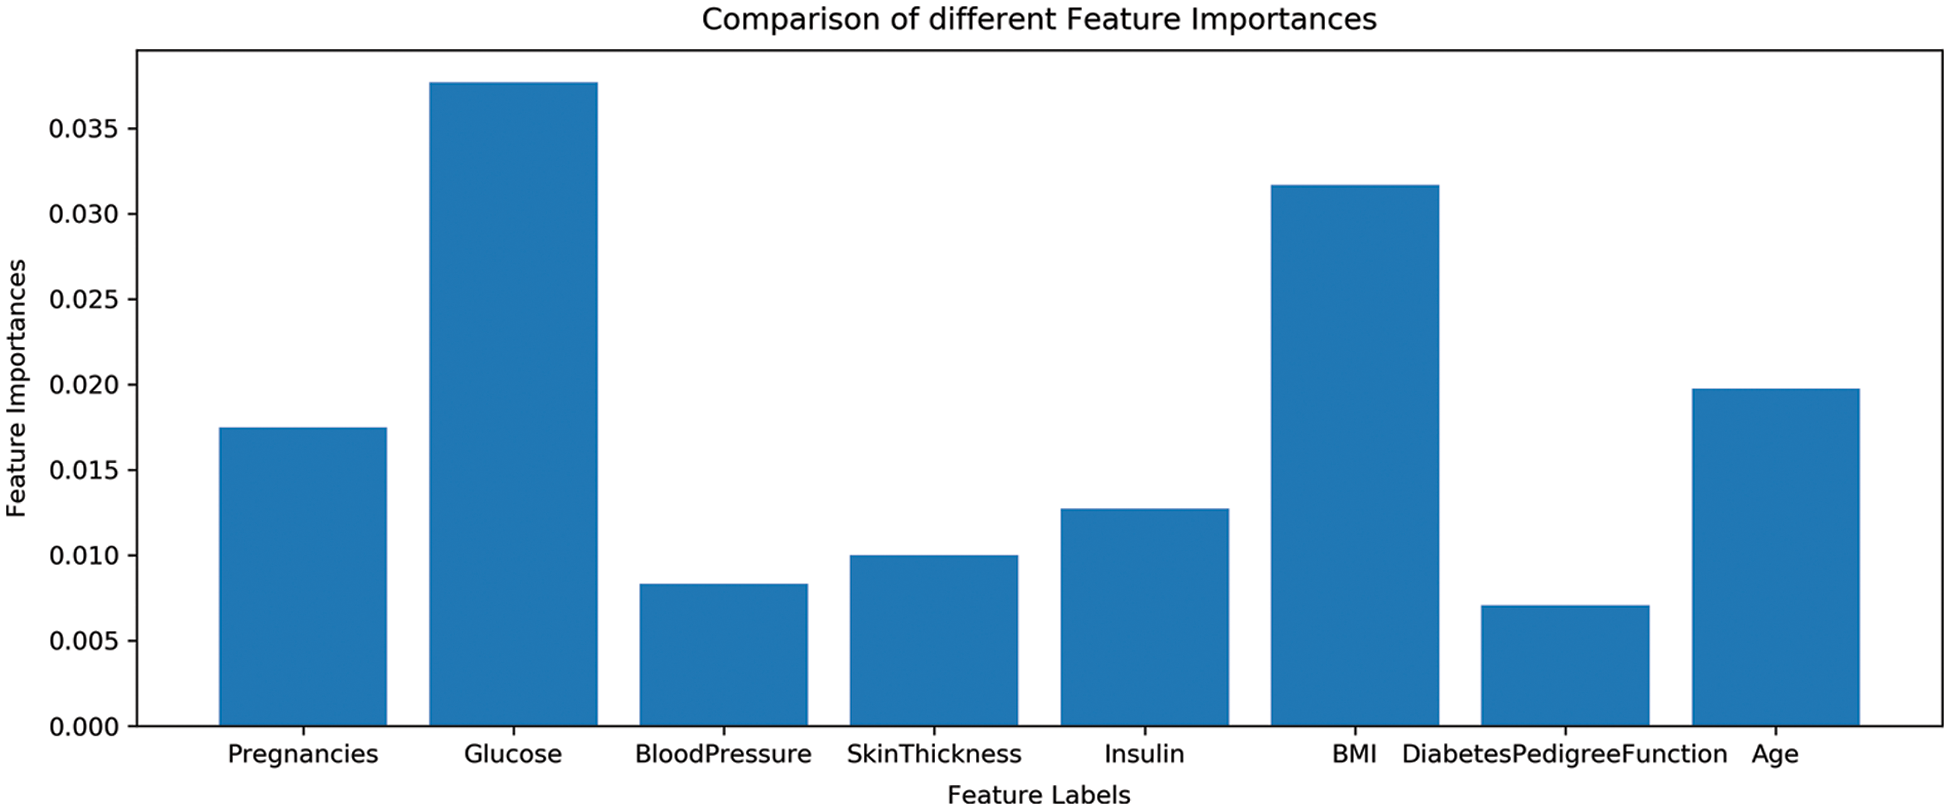
Figure 5: Features importance of used dataset
The fused feature vector is used for training and testing of the selected machine learning classifiers, as well as, the proposed LTC model. Experimental results are provided in Table 7 which indicates a substantial increase in the performance of the machine learning classifiers. For example, the accuracy of GNB and k-NN, two poorer performers on the original features, has been elevated to 83% and 72% from 66% and 67%, respectively. However, the proposed LTC outperforms all the classifiers with 85%, 86%, 79%, and 81% for accuracy, precision, recall, and F1-score, respectively. LR is the second-best performer with an accuracy of 83% when used with the feature fusion technique. A comparison of machine learning models for feature fusion is presented in Fig. 6.
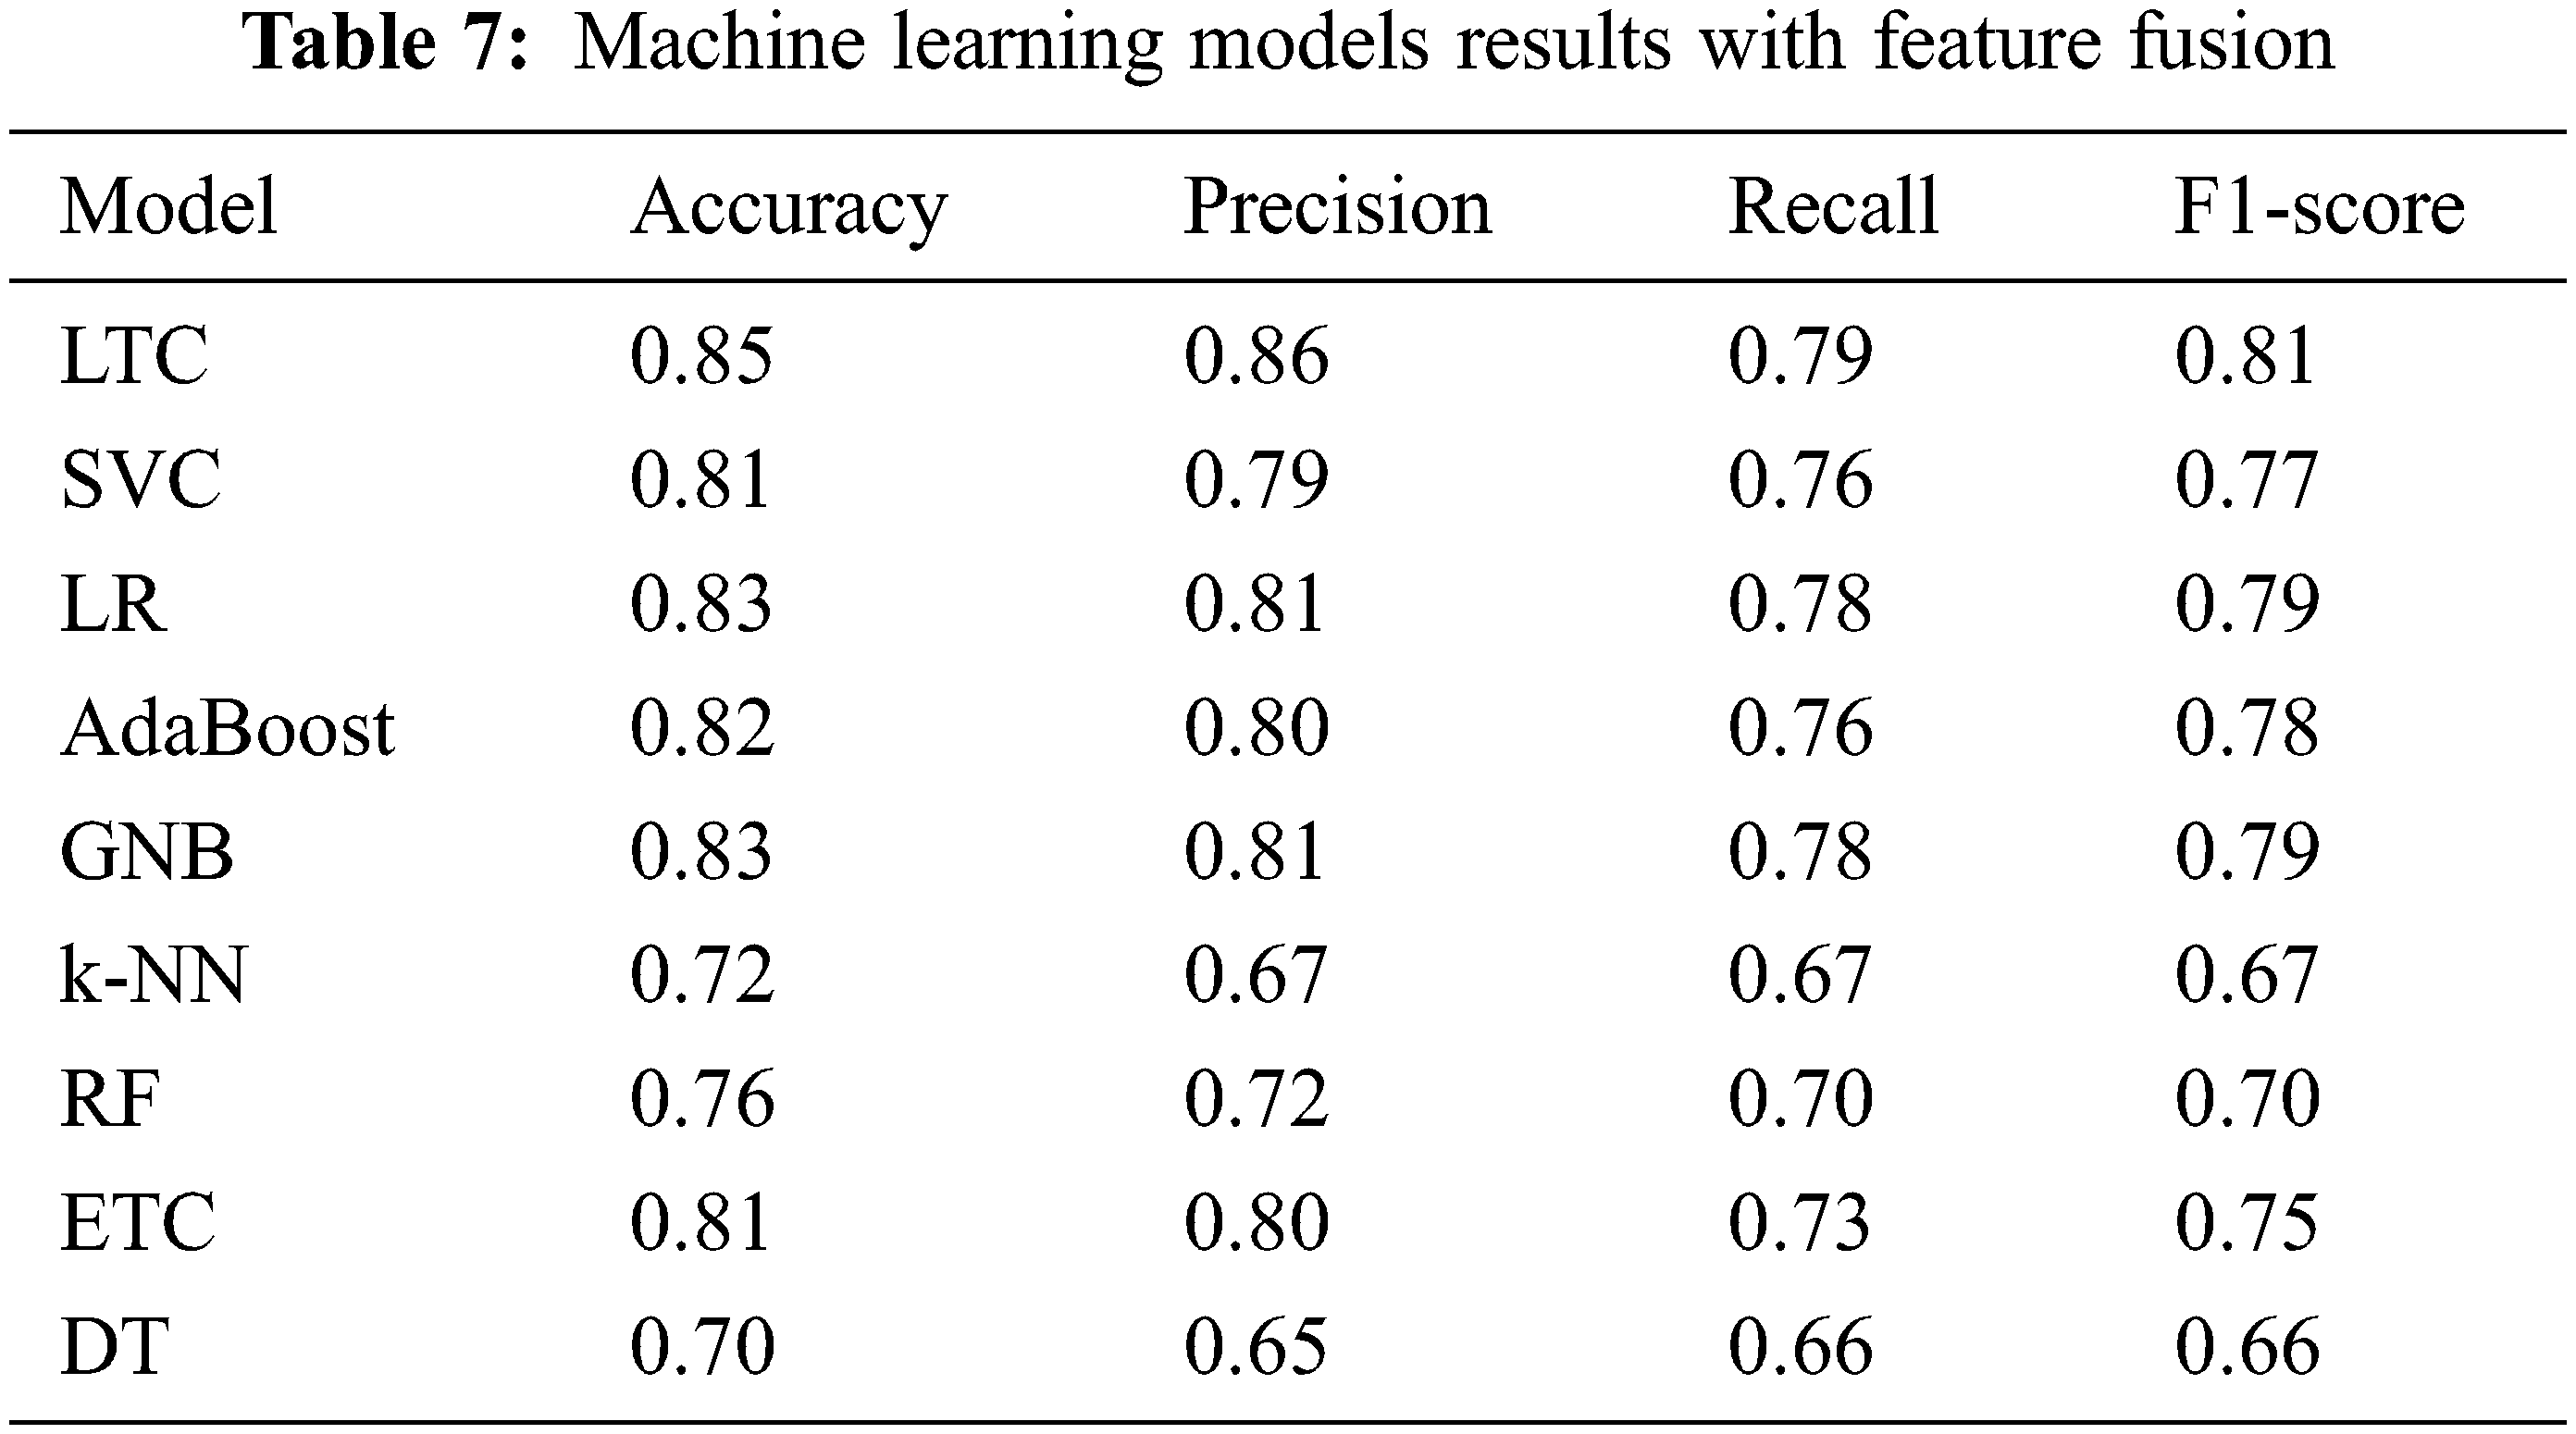
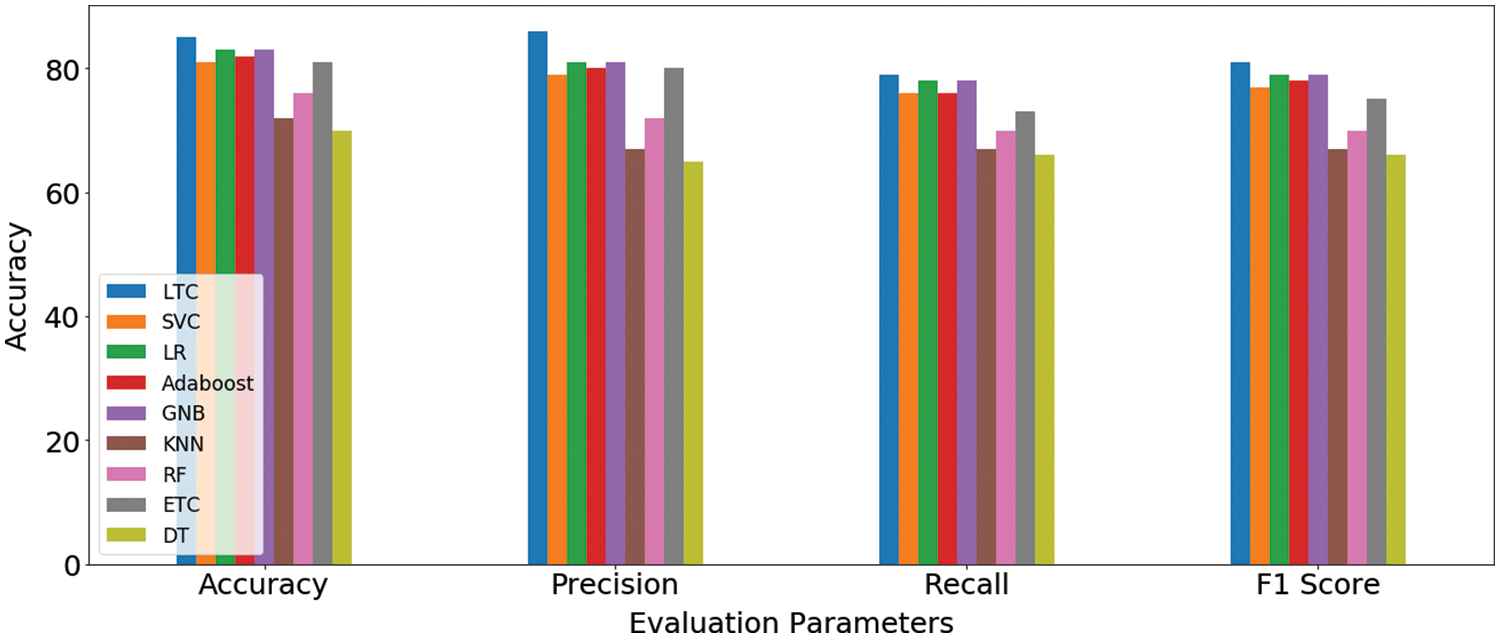
Figure 6: Machine learning models results comparison on feature fusion technique
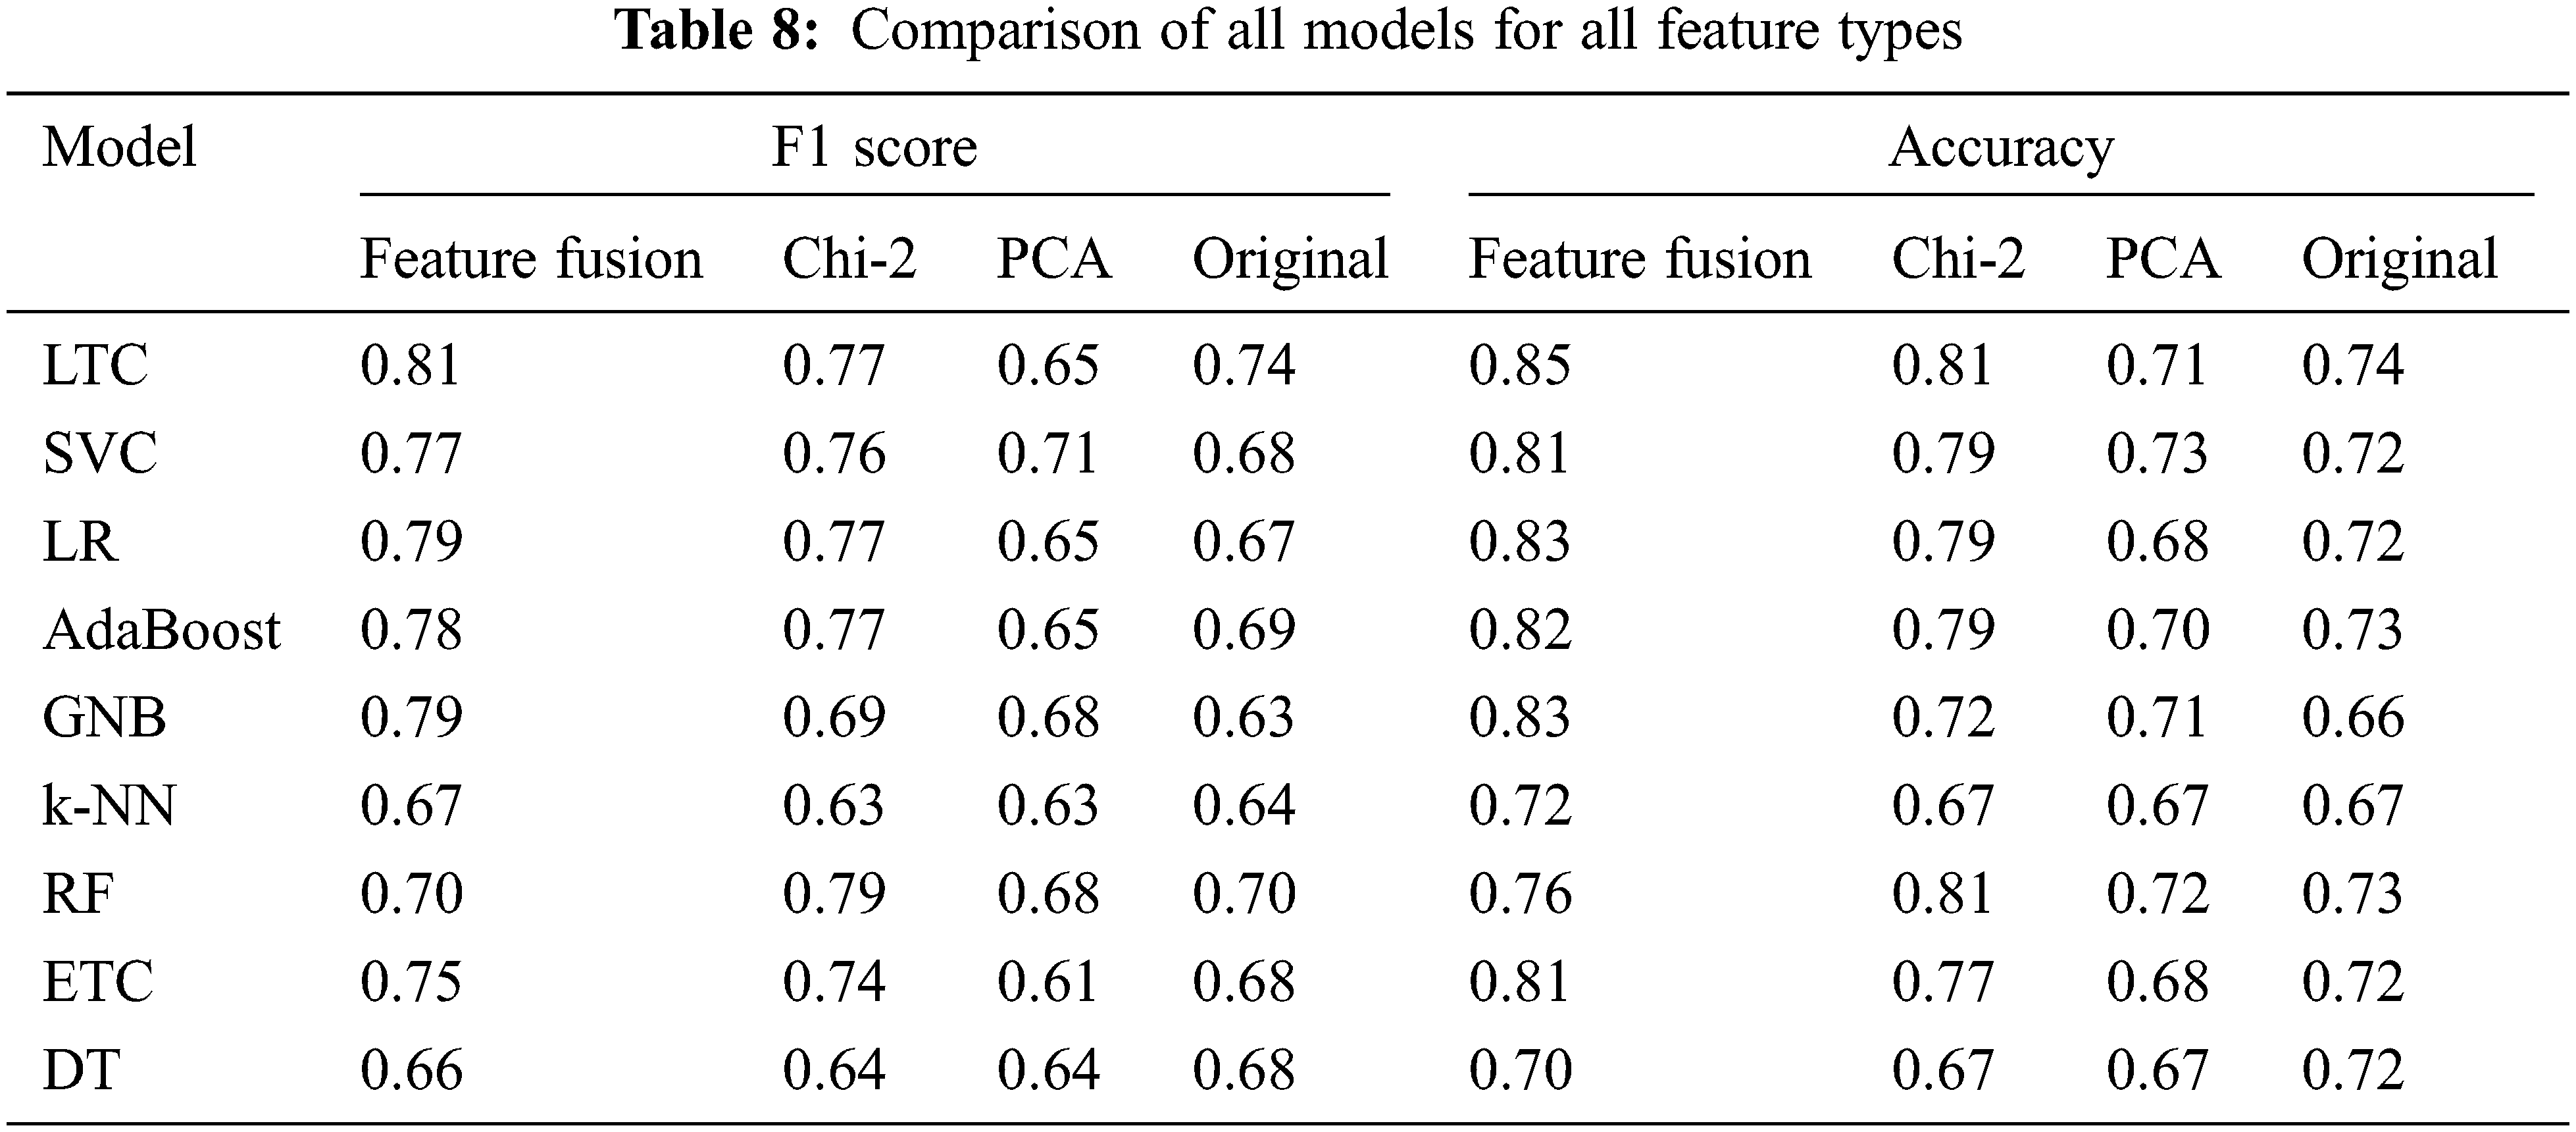
The performance of classifiers is increased by two factors in essence. First, selecting the most important features that highly contribute to the prediction of the target class helps to achieve higher accuracy. Second, joining important features selected using PCA and Chi-2 increases the importance and size of the feature vector to make a good fit for the classifiers and boosts their performance. The results show the importance of feature selection and feature fusion to enhance the performance of machine learning classifiers. A comparison of all approaches is presented in Table 8.
4.4 K-Fold Cross-Validation and Statistical T-Test
We performed 10-fold cross-validation with all approaches to show the significance of the proposed approach in terms of accuracy and efficiency. The LTC shows the highest results using the original features, PCA features, and feature fusion with significant accuracy scores. The results with 10-fold cross-validation are shown in Table 9.
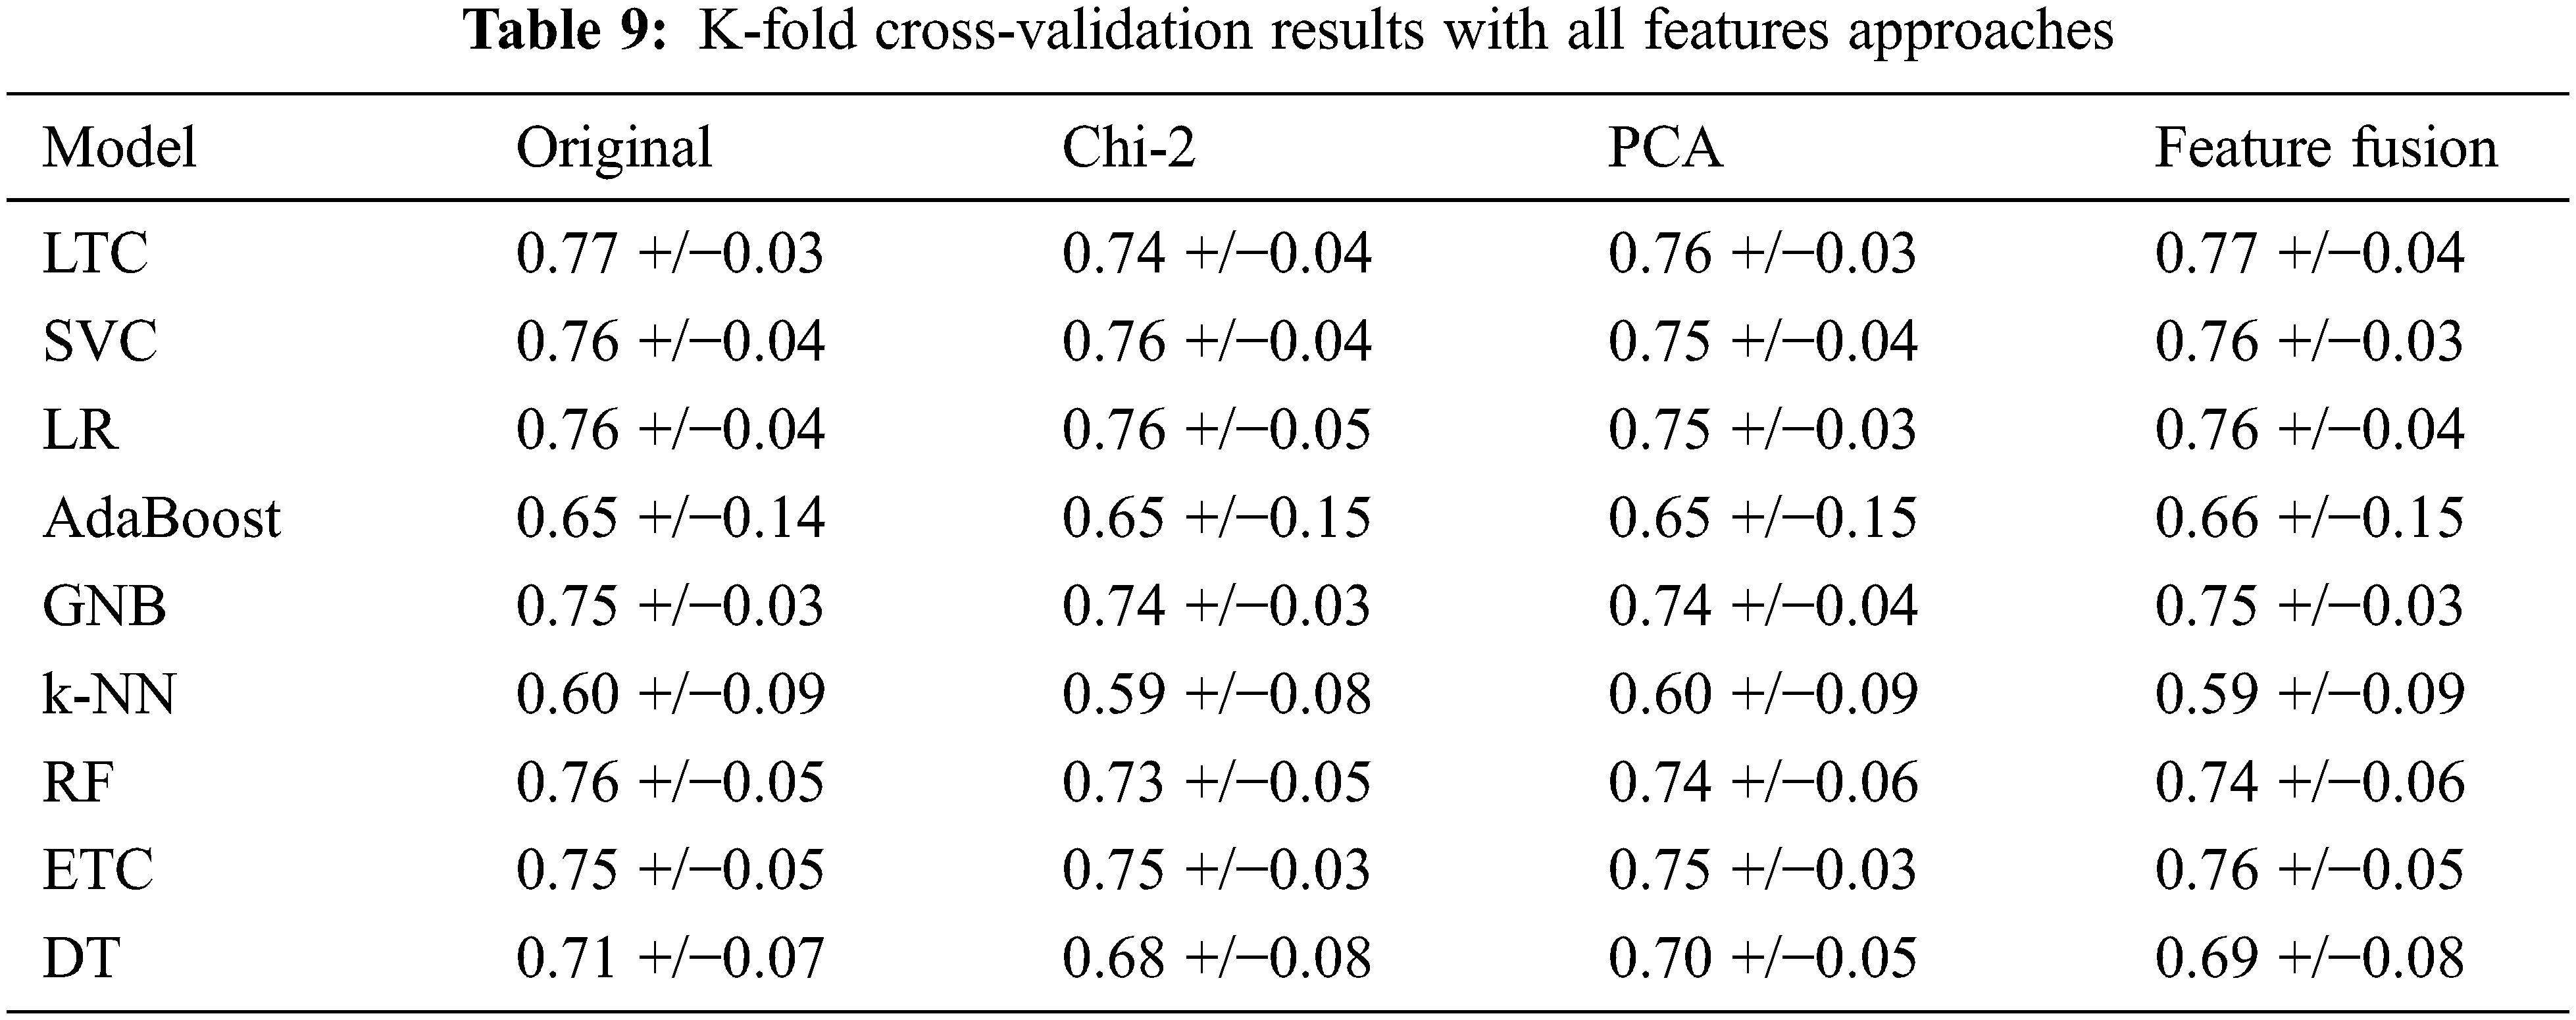
Further, we deployed a T-test on LTC results with each approach to show the significance of the proposed approach [41,42]. Results show that the T-test rejects the null hypothesis in all cases with t stats value 2.909 and critical value 0. So critical value is not greater than t-stats so it rejects the null hypothesis and accepts the alternative hypothesis which means that LTC results are statistically significant as compared to other models in the study.
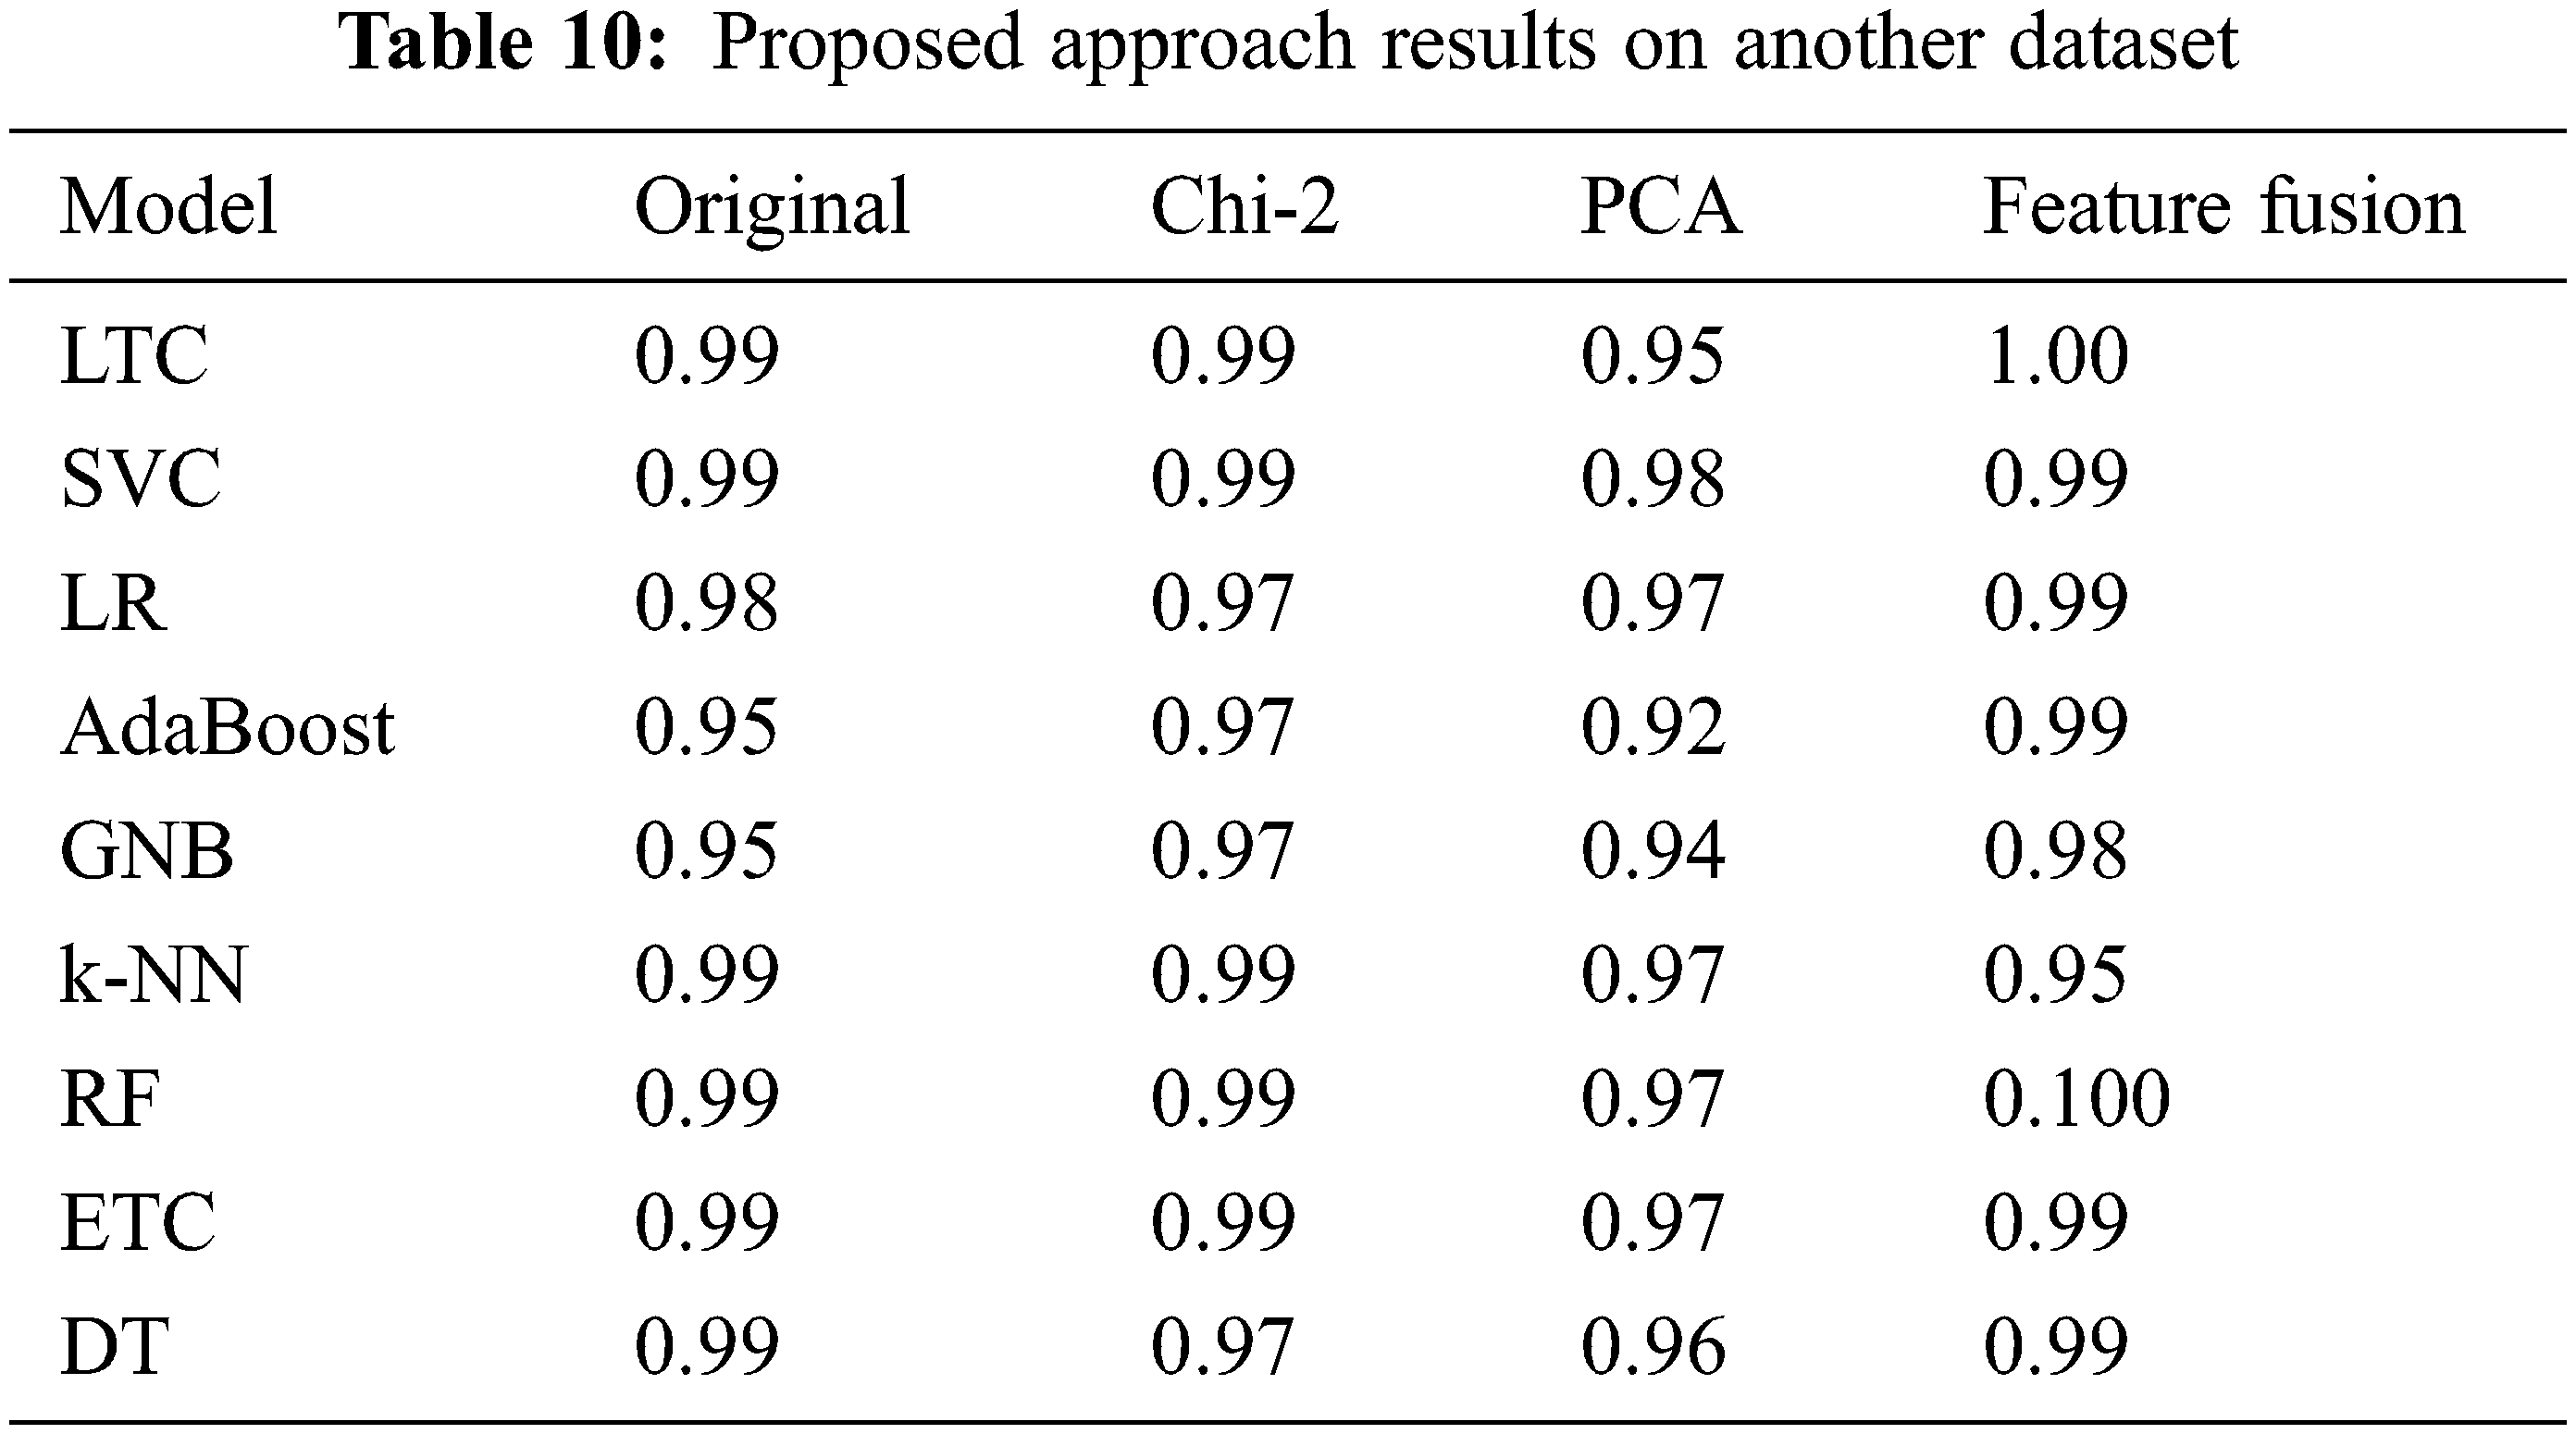
4.5 Results on Diabetic Disease Dataset
We deployed the proposed approach on another publicly available diabetes disease dataset [43]. The dataset consists of 1000 records and three target classes (Diabetic, Non-Diabetic, and Predicted-Diabetic). Performance of learning models is significant with proposed feature fusion technique as LTC achieved 1.00 accuracy and RF also achieved a significant accuracy score of 1.00, as given in Table 10.
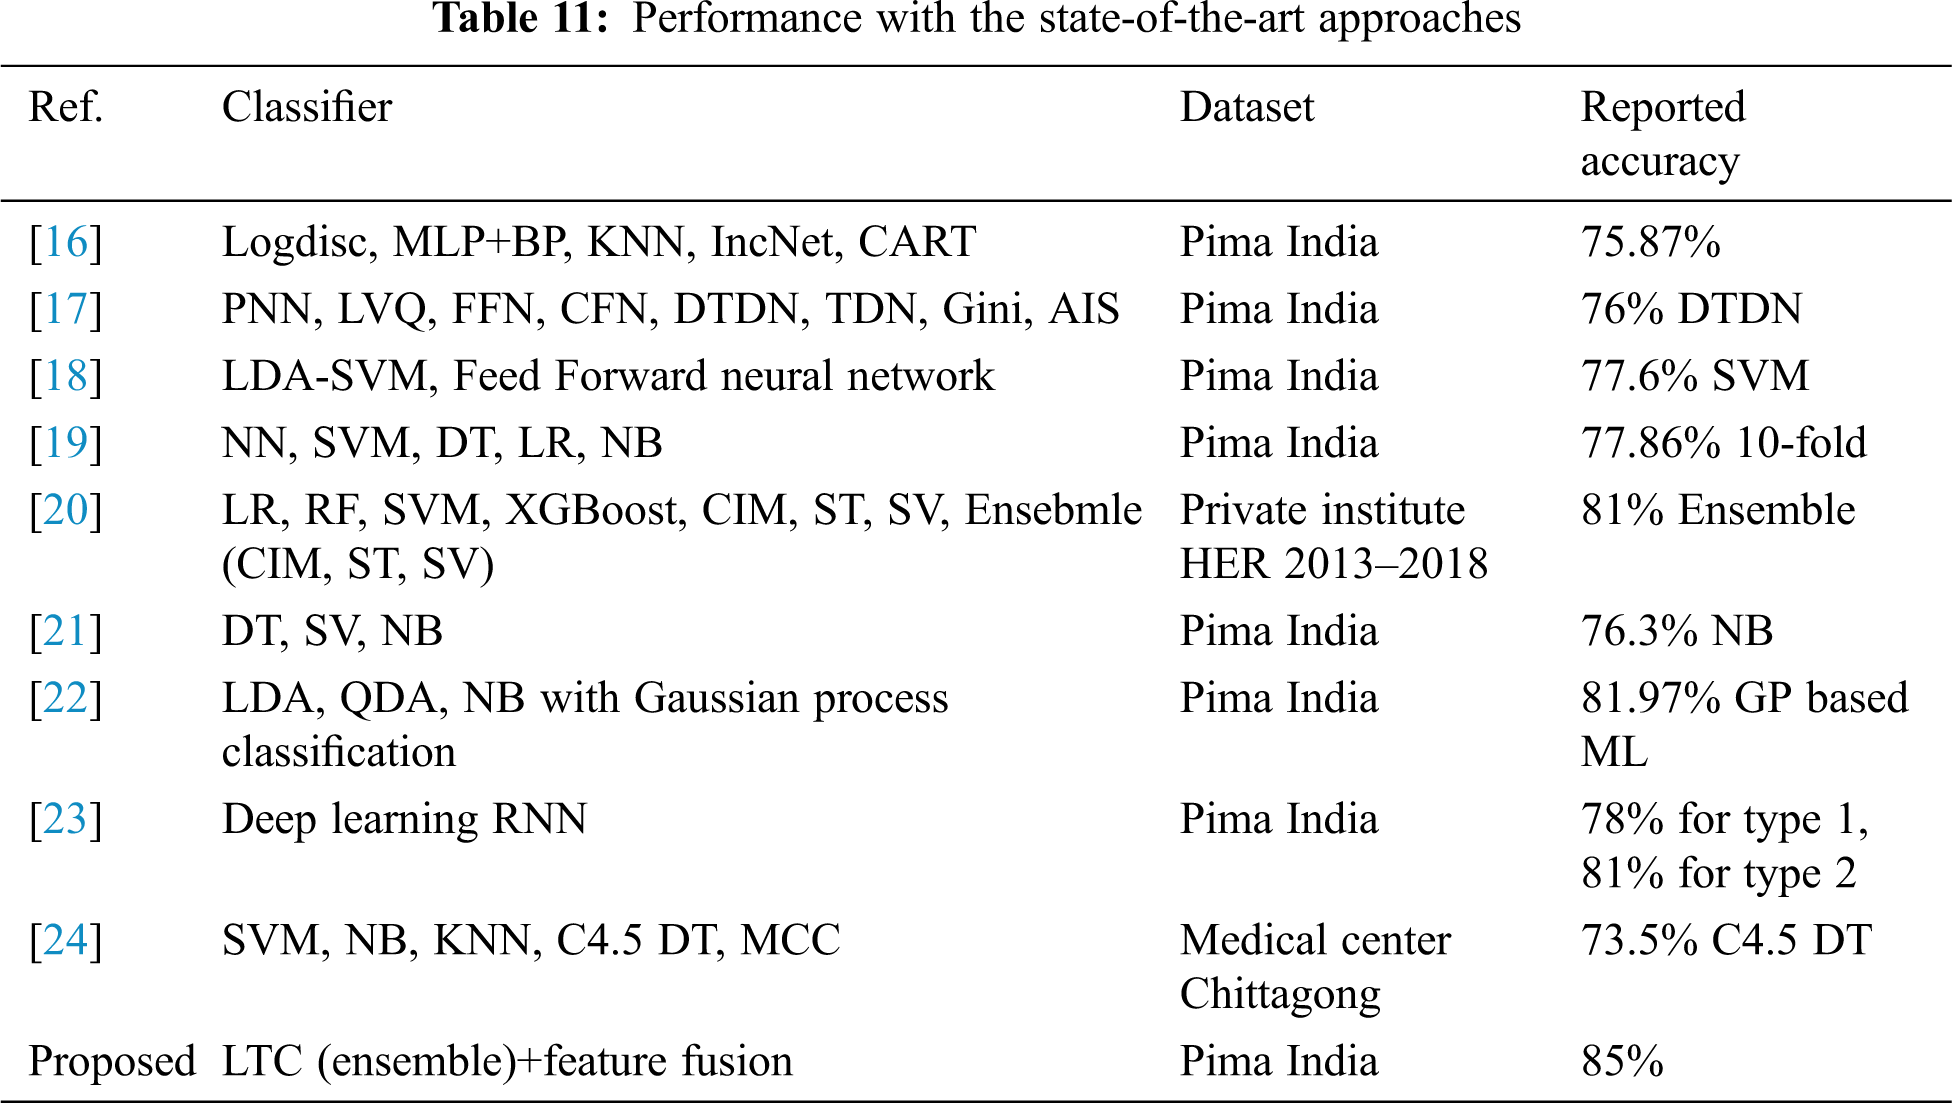
4.6 Comparison with State-of-the-art Approaches
For further corroboration and showing the efficacy of the proposed LTC and feature fusion approach, the performance of LTC is compared with several state-of-the-art approaches that utilize the dataset which is used in the current study. Performance comparison is given in Table 11. Results suggest that the proposed LTC outperforms state-of-the-art approaches and achieve an accuracy of 85% with the previous best of 81% for DM prediction.
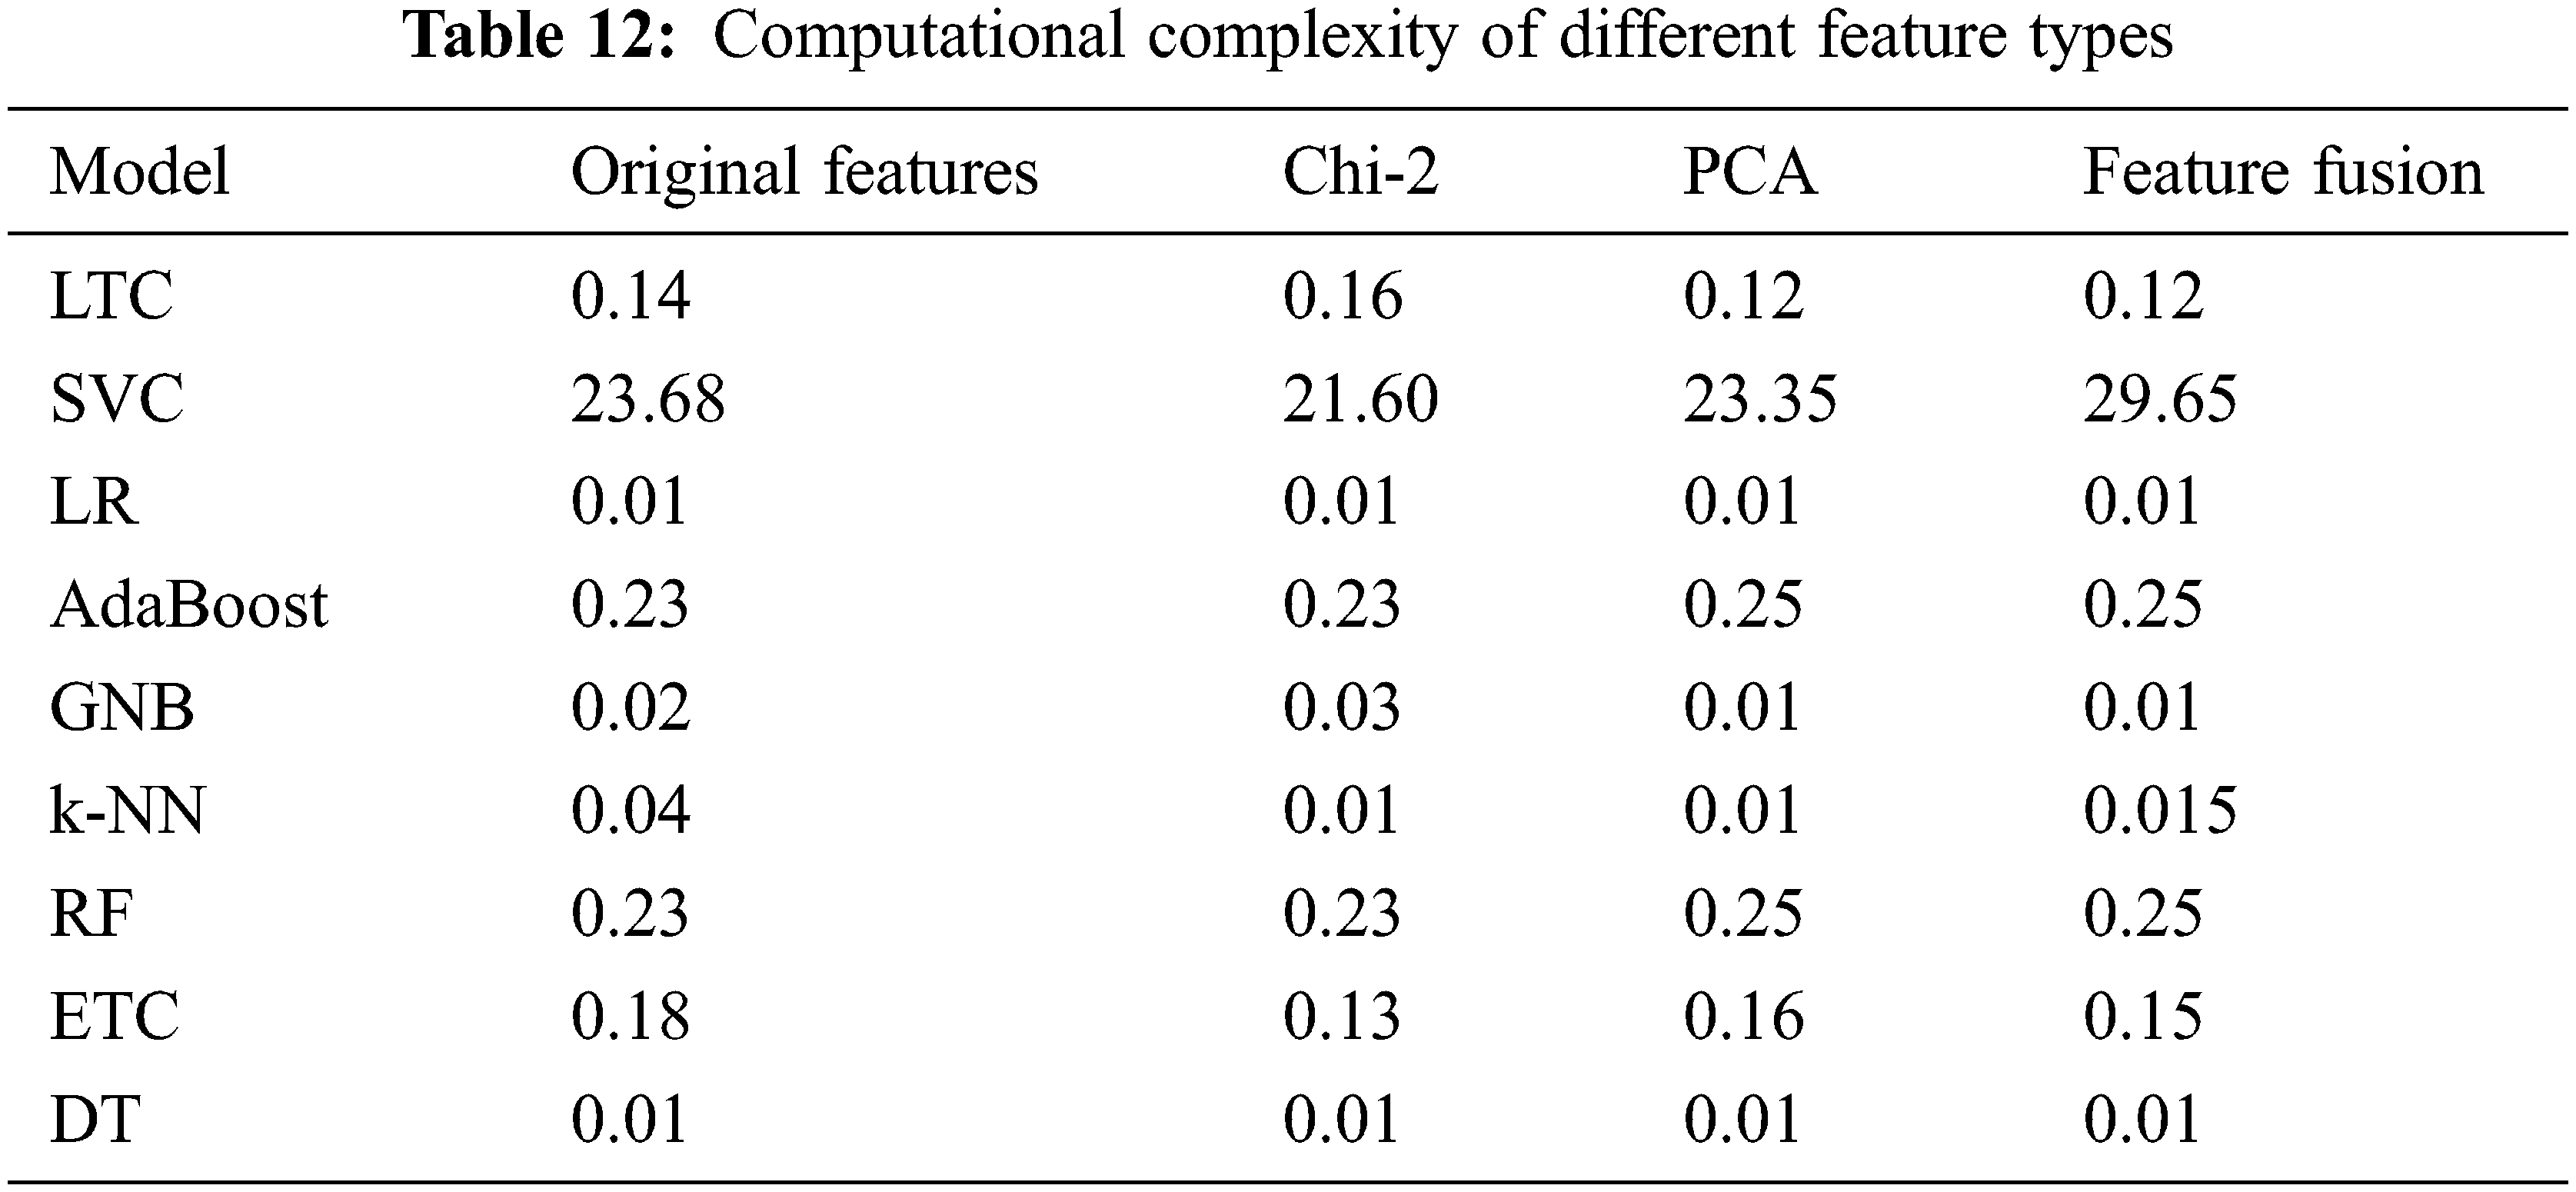
4.7 Computational Complexity of Different Approaches
The computational cost of each approach is determined to evaluate the cost in terms of execution time. Table 12. Results show that the change in the execution time is not substantial when the models are used with the combined features which makes it suitable to be used to obtain better performance.
This study has the following findings
1. The proposed approach is more accurate and efficient for diabetic disease detection in comparison to previous approaches.
2. Through several experiments, it is found that ensemble models can be used to enhance the performance of diabetes detection. The proposed ensemble model is a combination of two models LR and ETC. The combination of the linear model and tree-based model tend to show better results than either of them used alone.
3. We also analyzed that similar to ensemble learning, ensemble features can also improve the accuracy of learning models as in this study feature fusion technique combines PCA and Chi2 to make the training feature set more correlated which improves the prediction performance of machine learning models.
4. Using a small but highly correlated feature set can help to obtain better results.
Owing to the increase in the number of diabetes mellitus patients, automatic DM detection has become an area of potential interest from academia and the health industry. This study presents an automatic approach in this regard aiming at utilizing the selective features from patients’ data. The proposed classification model is a soft voting ensemble classifier comprising LR, ETC. Due to the importance of feature selection, two methods are explored including PCA and Chi-2 thereby proposing a novel feature fusion strategy that combines selective features from PCA and Chi-2. Experimental results from original, as well as, PCA and Chi-2 individual features and feature fusion are presented which indicate Chi-2 feature performs better than both original and PCA features. However, the performance is substantially improved with the proposed feature fusion approach. The proposed ensemble model can predict with a 0.85 accuracy score which is better than the current approaches for DM prediction. In the future, we intend to utilize deep learning models for DM prediction on a comparatively large dataset. Similarly, since PCA tend to show better performance with a large number of features and instance, experiments with large dataset are under consideration as well. The limitation of this study is the use of small datasets. Although two different datasets are used for experiments, both are relatively small. In addition, the number of samples for different classes is imbalanced. This small size dataset is not enough for learning models and an imbalanced dataset problem can cause the model to overfit. We intend to utilize feature augmentation and data resampling to improve the performance of learning models.
Funding Statement: This research was supported by the Florida Center for Advanced Analytics and Data Science funded by Ernesto.Net (under the Algorithms for Good Grant).
Conflicts of Interest: The authors declare that they have no conflicts of interest to report regarding the present study.
References
1. The top 10 causes of death. https://www.who.int/news-room/fact-sheets/detail/the-top-10-causes-of-death, 2020. [Google Scholar]
2. R. Gojka, “Diabetes,” World Health Organization, 2020. https://www.who.int/health-topics/diabetes#tab=overview (accessed on 02 Jan 2022). [Google Scholar]
3. S. El-Sappagh, F. Ali, S. El-Masri, K. Kim, A. Ali et al., “Mobile health technologies for diabetes mellitus: Current state and future challenges,” IEEE Access, vol. 7, pp. 21917–21947, 2018. [Google Scholar]
4. L. Mertz, “Automated insulin delivery: Taking the guesswork out of diabetes management,” IEEE Pulse, vol. 9, no. 1, pp. 8–9, 2018. [Google Scholar]
5. H. A. Klein and A. R. Meininger, “Self management of medication and diabetes: Cognitive control,” IEEE Transactions on Systems, Man, and Cybernetics-Part A: Systems and Humans, vol. 34, no. 6, pp. 718–725, 2004. [Google Scholar]
6. W. H. O. Diabetes, https://www.who.int/news-room/fact-sheets/detail/diabetes, 2020. [Google Scholar]
7. B. J. Lee and J. Y. Kim, “Identification of type 2 diabetes risk factors using phenotypes consisting of anthropometry and triglycerides based on machine learning,” IEEE Journal of Biomedical and Health Informatics, vol. 20, no. 1, pp. 39–46, 2015. [Google Scholar]
8. I. Kavakiotis, O. Tsave, A. Salifoglou, N. Maglaveras, I. Vlahavas et al., “Machine learning and data mining methods in diabetes research,” Computational and Structural Biotechnology Journal, vol. 15, pp. 104–116, 2017. [Google Scholar]
9. Q. Zou, K. Qu, Y. Luo, D. Yin, Y. Ju et al., “Predicting diabetes mellitus with machine learning techniques,” Frontiers in Genetics, vol. 9, pp. 515, 2018. [Google Scholar]
10. O. Arellano-Campos, D. V. Gómez-Velasco, O. Y. Bello-Chavolla, I. Cruz-Bautista, M. A. Melgarejo-Hernandez et al., “Development and validation of a predictive model for incident type 2 diabetes in middle-aged Mexican adults: The metabolic syndrome cohort,” BMC Endocrine Disorders, vol. 19, no. 1, pp. 1–10, 2019. [Google Scholar]
11. R. Birjais, A. K. Mourya, R. Chauhan and H. Kaur, “Prediction and diagnosis of future diabetes risk: A machine learning approach,” SN Applied Sciences, vol. 1, no. 9, pp. 1–8, 2019. [Google Scholar]
12. D. Çalisir and E. Doğantekin, “An automatic diabetes diagnosis system based on lda-wavelet support vector machine classifier,” Expert Systems with Applications, vol. 38, no. 7, pp. 8311–8315, 2011. [Google Scholar]
13. Z. Ahmed, K. Mohamed, S. Zeeshan and X. Dong, “Artificial intelligence with multi-functional machine learning platform development for better healthcare and precision medicine,” Database, vol. 2020, pp. 1–35, 2020. [Google Scholar]
14. B. Omar, F. Rustam, A. Mehmood and G. S. Choi, “Minimizing the overlapping degree to improve class-imbalanced learning under sparse feature selection: Application to fraud detection,” IEEE Access, vol. 9, pp. 28101–28110, 2021. [Google Scholar]
15. X. R. Zhang, X. Sun, X. M. Sun, W. Sun and S. K. Jha, “Robust reversible audio watermarking scheme for telemedicine and privacy protection,” Computers, Materials & Continua, vol. 71, no. 2, pp. 3035–3050, 2022. [Google Scholar]
16. S. Sahan, K. Polat, H. Kodaz and S. Güne, “The medical applications of attribute weighted artificial immune system (awaisDiagnosis of heart and diabetes diseases,” in Proc. Int. Conf. on Artificial Immune Systems, Alberta, Canada, pp. 456–468, 2005. [Google Scholar]
17. M. R. Bozkurt, N. Yurtay, Z. Yilmaz and C. Sertkaya, “Comparison of different methods for determining diabetes,” Turkish Journal of Electrical Engineering & Computer Sciences, vol. 22, no. 4, pp. 1044–1055, 2014. [Google Scholar]
18. A. Parashar, K. Burse and K. Rawat, “A comparative approach for pima Indians diabetes diagnosis using lda-support vector machine and feed forward neural network,” International Journal of Advanced Research in Computer Science and Software Engineering, vol. 4, no. 11, pp. 378–383, 2014. [Google Scholar]
19. S. Wei, X. Zhao and C. Miao, “A comprehensive exploration to the machine learning techniques for diabetes identification,” in Proc. IEEE 4th World Forum on Internet of Things, Singapore, pp. 291–295, 2018. [Google Scholar]
20. H. M. Deberneh and I. Kim, “Prediction of type 2 diabetes based on machine learning algorithm,” International Journal of Environmental Research and Public Health, vol. 18, no. 6, pp. 3317, 2021. [Google Scholar]
21. D. Sisodia and D. S. Sisodia, “Prediction of diabetes using classification algorithms,” Procedia Computer Science, vol. 132, pp. 1578–1585, 2018. [Google Scholar]
22. M. Maniruzzaman, N. Kumar, M. M. Abedin, M. S. Islam, H. S. Suri et al., “Comparative approaches for classification of diabetes mellitus data: Machine learning paradigm,” Computer Methods and Programs in Biomedicine, vol. 152, pp. 23–34, 2017. [Google Scholar]
23. S. Ramesh, H. Balaji, N. C. S. Iyengar and R. D. Caytiles, “Optimal predictive analytics of pima diabetics using deep learning,” International Journal of Database Theory and Application, vol. 10, no. 9, pp. 47–62, 2017. [Google Scholar]
24. M. F. Faruque, I. H. Sarker, “Performance analysis of machine learning techniques to predict diabetes mellitus,” in Proc. Int. Conf. on Electrical, Computer and Communication Engineering, Bangladesh, pp. 1–4, 2019. [Google Scholar]
25. M. T. García-Ordás, C. Benavides, J. A. Benítez-Andrades, H. Alaiz-Moretón, I. García-Rodríguez et al., “Diabetes detection using deep learning techniques with oversampling and feature augmentation,” Computer Methods and Programs in Biomedicine, vol. 202, pp. 105968, 2021. [Google Scholar]
26. A. Mitani, N. Hammel and Y. Liu, “Retinal detection of kidney disease and diabetes,” Nature Biomedical Engineering, vol. 5, no. 6, pp. 487–489, 2021. [Google Scholar]
27. H. H. Hsu, C. W. Hsieh and M. D. Lu, “Hybrid feature selection by combining filters and wrappers,” Expert Systems with Applications, vol. 38, no. 7, pp. 8144–8150, 2021. [Google Scholar]
28. F. Rustam, I. Ashraf, A. Mehmood, S. Ullah, G. S. Choi et al., “Tweets classification on the base of sentiments for US airline companies,” Entropy, vol. 21, no. 11, pp. 1078, 2019. [Google Scholar]
29. R. Budhi and S. Dhakal, “Combining sentiment lexicons and content-based features for depression detection,” IEEE Intelligent Systems, vol. 36, no. 6, pp. 99–105, 2021. [Google Scholar]
30. H. Chauhan, K. Modi and S. Shrivastava, “Development of a classifier with analysis of feature selection methods for COVID-19 diagnosis,” World Journal of Engineering, vol. 19, no.1, pp. 49–57, 2021. [Google Scholar]
31. M. Dash and H. Liu, “Feature selection for classification,” Intelligent Data Analysis, vol. 1, pp. 1–4, 1997. [Google Scholar]
32. M. F. Zibran, “Chi-squared test of independence,” in Department of Computer Science, University of Calgary, Alberta, Canada, pp. 1–7, 2007. [Google Scholar]
33. P. Meesad, P. Boonrawd and V. Nuipian, “A Chi-square-test for word importance differentiation in text classification,” in Proc. of Int. Conf. on Information and Electronics Engineering, Bangkok, Thailand, pp. 110–114, 2011. [Google Scholar]
34. A. Malhi and R. X. Gao, “Pca-based feature selection scheme for machine defect classification,” IEEE Transactions on Instrumentation and Measurement, vol. 53, no. 6, pp. 1517–1525, 2004. [Google Scholar]
35. A. K. Gárate-Escamila, A. H. El Hassani and E. Andrès, “Classification models for heart disease prediction using feature selection and pca,” Informatics in Medicine Unlocked, vol. 19, pp. 100330, 2020. [Google Scholar]
36. B. Pal, S. Zaman, M. A. Hasan, M. A. M. Hasan and F. Mahmud, “Chi-square statistic and principal component analysis based compressed feature selection approach for naïve Bayesian classifier,” Journal of Artificial Intelligence Research & Advances, vol. 2, no. 2, pp. 16–23, 2015. [Google Scholar]
37. “UCI repository of machine learning databases,” https://archive.ics.uci.edu/ml/index.php, 2020. [Google Scholar]
38. A. Al Jarullah, “Decision tree discovery for the diagnosis of type ii diabetes,” in Proc. Int. Conf. on Innovations in Information Technology, Abu Dhabi, UAE, pp. 303–307, 2011. [Google Scholar]
39. M. Khalid, I. Ashraf, A. Mehmood, S. Ullah, M. Ahmad et al., “GBSVM: Sentiment classification from unstructured reviews using ensemble classifier,” Applied Sciences, vol. 10, no. 8, pp. 2788, 2020. [Google Scholar]
40. S. Aslam and I. Ashraf, “Data mining algorithms and their applications in education data mining,” International Journal of Advance Research in Computer Science and Management Studies, vol. 2, no. 7, pp. 50–56, 2014. [Google Scholar]
41. M. Umer, I. Ashraf, A. Mehmood, S. Ullah and G. S. Choi, “Predicting numeric ratings for google apps using text features and ensemble learning,” ETRI Journal, vol. 43, no. 1, pp. 95–108, 2021. [Google Scholar]
42. M. Umer, I. Ashraf, A. Mehmood, S. Kumari, S. Ullah et al., “Sentiment analysis of tweets using a unified convolutional neural network-long short-term memory network model,” Computational Intelligence, vol. 37, no. 1, pp. 409–434, 2021. [Google Scholar]
43. A. Rashid, “Diabetes dataset,” Mendeley Data, vol. 1, 2020. https://doi.org/10.17632/wj9rwkp9c2.1. [Google Scholar]
Cite This Article
 Copyright © 2023 The Author(s). Published by Tech Science Press.
This work is licensed under a Creative Commons Attribution 4.0 International License , which permits unrestricted use, distribution, and reproduction in any medium, provided the original work is properly cited.
 Downloads
 Citation Tools