
 Submit a Paper
 Propose a Special lssue
 Open Access
ARTICLE

Deep Neural Network Based Cardio Vascular Disease Prediction Using Binarized Butterfly Optimization
Department of Computer Science and Engineering, Mepco Schlenk Engineering College (Autonmous), Sivakasi, India
* Corresponding Author: S. Amutha. Email:
Intelligent Automation & Soft Computing 2023, 36(2), 1863-1880. https://doi.org/10.32604/iasc.2023.028903
Received 21 February 2022; Accepted 05 May 2022; Issue published 05 January 2023
 View Full Text
 Download PDF
Abstract
In this digital era, Cardio Vascular Disease (CVD) has become the leading cause of death which has led to the mortality of 17.9 million lives each year. Earlier Diagnosis of the people who are at higher risk of CVDs helps them to receive proper treatment and helps prevent deaths. It becomes inevitable to propose a solution to predict the CVD with high accuracy. A system for predicting Cardio Vascular Disease using Deep Neural Network with Binarized Butterfly Optimization Algorithm (DNN–BBoA) is proposed. The BBoA is incorporated to select the best features. The optimal features are fed to the deep neural network classifier and it improves prediction accuracy and reduces the time complexity. The usage of a deep neural network further helps to improve the prediction accuracy with minimal complexity. The proposed system is tested with two datasets namely the Heart disease dataset from UCI repository and CVD dataset from Kaggle Repository. The proposed work is compared with different machine learning classifiers such as Support Vector Machine, Random Forest, and Decision Tree Classifier. The accuracy of the proposed DNN–BBoA is 99.35% for the heart disease data set from UCI repository yielding an accuracy of 80.98% for Kaggle repository for cardiovascular disease dataset.Keywords
American Heart Association identified Cardio Vascular Disease as the underlying cause of nearly 8,68,662 deaths in the US as per an updated fact sheet [1]. In India, the cardio vascular disease accounts for 60% of total adults deaths. World Health Organization predicted that the number of deaths due to this disease may reach 23 million by the year 2030. Cardiovascular disease is a chronic term that affects the heart and blood vessels. It is caused due to the deposit of fats in atherosclerosis. Cardiovascular diseases are conditions that affect the structures or jobs of the heart leading to abnormal heartbeats, coronary artery disease, heart attack, stroke, etc. Heart diseases may be seen and understood using various symptoms like chest pain, angina, breathing problems, pain in the shoulder or the back, etc. It may be worsened because of the factors such as increased blood pressure, alcohol intake, diabetes, smoking habits, cholesterol level, etc. The diagnosis of people who are at the risk of Cardio Vascular Disease has become the cornerstone of preventive therapy among people with other complications. There are various reasons behind the development of Cardiovascular disease among people like age, diabetes mellitus unhealthy lifestyles, blood pressure fluctuation, cholesterol level increase, obesity, unhealthy behaviors like smoking, alcohol intake, and in turn these factors increase the risks associated with this disease. If the parent of the affected person has cardiovascular disease, then it increases a person’s risk by three times. In this way, heredity serves as a major risk factor for cardiovascular disease. Genetic cardiovascular disease can be caused by a single mutation or a combination of multiple factors. Several risks are associated with Cardio Vascular Diseases. The risks associated with cardiovascular disease may be categorized as the risks that can be controlled and modifiable and those which do not come under human control and can’t be modified. The modifiable risks can be identified and used for anticipation of cardiovascular disease before the onset of it. In addition to the identification of risks associated with the disease, earlier diagnosis at the right time is crucial for reducing the mortality rate. Disease prediction is a method of recognizing a patient’s health using data mining and machine learning techniques to analyze the patient’s medical history. In the last decade, multiple risk prediction models for cardiovascular disease have been developed. However, the validity of these models has been questioned. Hence, a system with increased accuracy is an essential concern. And, also the accuracy of prediction of cardiovascular disease assists the practitioners to diagnose heart disease in a better way.
Amin et al. [2] developed a framework for classification using a voting technique that performed a combination of different attributes to get the best set of attributes which can result in better accuracy. The system used a brute force approach for feature selection. They achieved 87.4% accuracy for the UCI heart disease data set. Latha et al. proposed a framework [3] comprising classifiers and feature selectors for getting higher accuracy. The system was exercised with different machine learning algorithms such as Naïve Bayes, Multi LayerPerceptron, Random Forest, and ensemble techniques and it was found to be best when the classification is done using the ensemble technique boosting. They experimented with ensemble techniques like bagging, boosting, stacking, and majority voting and the best results for the UCI heart disease dataset were achieved using the majority voting technique. But, the system encountered an increased time complexity because of the time spent in the feature selection. Different feature selection algorithms such as Relief, LASSO, Bagging methods, and Principal Component Analysis (PCA) subset of features construction were applied [4–6] for increasing the accuracy of the prediction on the UCI dataset. Pandia Rajan et al. proposed a fog-based deep convolutional neural network [7] for feature selection and the selected features were fed to the Cancer classification.
Li et al. proposed a work [8] for the prediction of Cardio Vascular Disease using different machine learning algorithms such as Support Vector Machine, Logistic regression, Artificial Neural Networks, k-Nearest neighbor algorithms. The algorithms were exercised with attributes of the data set which are selected using the feature selection algorithm such as Relief, Minimal Redundancy, and Maximal relevance etc., The system yielded an increased accuracy of 92.37% with the combination of Support Vector Machine and fast conditional mutual information feature selection algorithm on the UCI data set.
Devi et al. proposed a work [9] using a deep learning-based stacking ensemble method for breast cancer classification. An automatic mammographic recognition system [10] was proposed by Kurek et al. and the authors experimented with the mammogram dataset with the help of the classical approach and deep learning-based approach. The authors exploited a sequential forward and backward selection strategy for getting an optimal set of features. The system yielded a better accuracy with the help of a Convolutional Neural Network which is the optimal approach for image classification. Priyatharshini et al. proposed a self-learning fuzzy rule-based system [11] for making heart disease predictions. The authors used a fuzzy expert system for decision making and there was a challenge in designing the rule base they believed that self-learning will help a lot as the accuracy was 90.7%. The system categorized the risks at different intensity levels. Ul Haq et al. developed a hybrid framework [12] for predicting heart disease using the typical machine learning algorithms along with feature selection algorithms such as the Relief algorithm and LASSO. The experimental study of their work revealed that the combination of Support Vector Machine with the proposed feature selection algorithms yielded a better accuracy of 86%. The time taken for the prediction was comparatively high because of the algorithm complexity and the accuracy can also be improved further where accuracy is the crucial aspect of medical diagnosis.
Nawaz et al. designed a framework [13] with machine learning and Gradient Optimization algorithms. The framework was implemented using the algorithms such as Support Vector Machine, K Nearest Neighbour (KNN), Artificial Neural Network, Naïve Bayesian, and Random Forest. Kozielski et al. designed a web application for symptom-based COVID-19 machine learning methods [14] for analyzing the data of sick patients. The authors used XG Boost algorithm for classification and parameter tuning so that it can be applied for screening the COVID data collected from affected people. The system resulted in getting the new thresholds for the parameters used to define the weights of classification quality measures for the screening data. Mohan et al. proposed a work [15] for heart disease prediction by combining the Linear Model and Random Forest algorithms. The authors have tested different machine learning algorithms such as Naïve Bayes, Generalized linear model, Logistic Regression, deep learning, etc. The proposed approach of their contribution resulted in higher accuracy of 88.4% for the UCI heart disease data set. Zdancewicz et al. applied deep learning architecture [16] for Parkinson’s disease diagnosis using voice signals. The advanced deep neural classifier is used to extract features automatically from voice input and a deep convolutional neural network was used for disease prediction. Ali et al. proposed a system [17] for cardiovascular disease prediction using χ 2-DNN. They used the chi-square model to remove irrelevant features and applied an exhaustive approach for feature selection. The deep learning and feature engineering combination yielded an accuracy of 96.6%. Zhang et al. designed a system [18] for predicting CVD using the deep neural network. The system improved the accuracy with the optimal features obtained using LASSO regression and got an accuracy of 98.56%.
Different researchers applied different optimization algorithms for arriving at optimal results. Vijay Mohan and Indumathi Ganesan proposed an application for person identification [19] using a well-known nature-inspired algorithm Elephant Deer Hunting Optimization for weight update of fused features. The optimal feature value obtained using the algorithm well supported the identification process. Arora et al. proposed an optimization algorithm [20] that comes under the category of the bio-inspired algorithm. The algorithm mimics the mating behavior and the butterfly moves in the direction where the fragrance value is more. The fragrance value is computed for local and global search space. The algorithm is tested on different benchmark datasets for spring design, gear design, etc., Tubishat et al. proposed a framework [21] for feature selection using a modified butterfly optimization algorithm with different data sets and the system yielded a better accuracy. The authors combined BoA with a Local Search Algorithm based on Mutation. Tlija et al. proposed an approach [22] for missing data replacement concerning the sensor data that acquired heart variable rate. Missing value replacement strategies hold a vital role in predicting an efficient model. The optimization algorithms boost the accuracy of the disease prediction and especially the nature-inspired algorithms nowadays find more applications. A prediction model [23] using the machine learning classifiers and the Swarm Optimization technique was proposed by Patro et al. The authors designed the prediction framework using different classifier algorithms such as Naïve Bayes, Bayesian Optimized Support Vector Machine (BO–SVM), K Nearest Neighbour and Swarm Optimized Neural Network. Among the experimented algorithms, the BO-SVM resulted in high accuracy. The optimization algorithm was the cause behind the improvement of classification results and also yielded a computational speed.
It is inferred from the literature survey that almost all of the machine learning algorithms were exploited for disease prediction by exploiting the benefits of using feature selection algorithms. But, still, there is a gap in terms of accuracy, required and significant features usage, and volume of the health data. That’s why the focus is given to the maximization of accuracy via a deep artificial neural network and the minimization of execution time via selecting significant features instead of the entire set of features. The flow of the proposed system is as follows. The data sets used for this work are pre-processed. The significant features are extracted from the data set. The significant features are fed as input to the classifier for predicting whether the patient is affected by cardiovascular disease or not.
The highlights of the proposed work are:
1. The significant features influencing the disease are identified using the BBoA.
2. The deep neural network architecture is constructed for accuracy boosting.
3. The accuracy of the prediction is improved which facilitates the disease diagnosis in a better way.
The proposed Deep Neural Network-based Binarized Butterfly optimization algorithm (DNN-BBoA) is designed to predict cardiovascular disease. The overall structure of the proposed work is shown in Figs. 1a and 1b. The system is composed of the modules data pre-processing, feature selection, and classification modules. The system paves the way for getting through a systematic approach to efficiently classifying the samples. The proposed system takes the raw input features to read from the data set. The input data is pre-processed during the standard normalization. The missing value replacement is done using the k nearest neighbor algorithm. The feature selection is done to extract the significant features out of the raw features and then optimal results achieving optimal features through the deep artificial neural network. The features are extracted using the Binarized Butterfly Optimization algorithm.
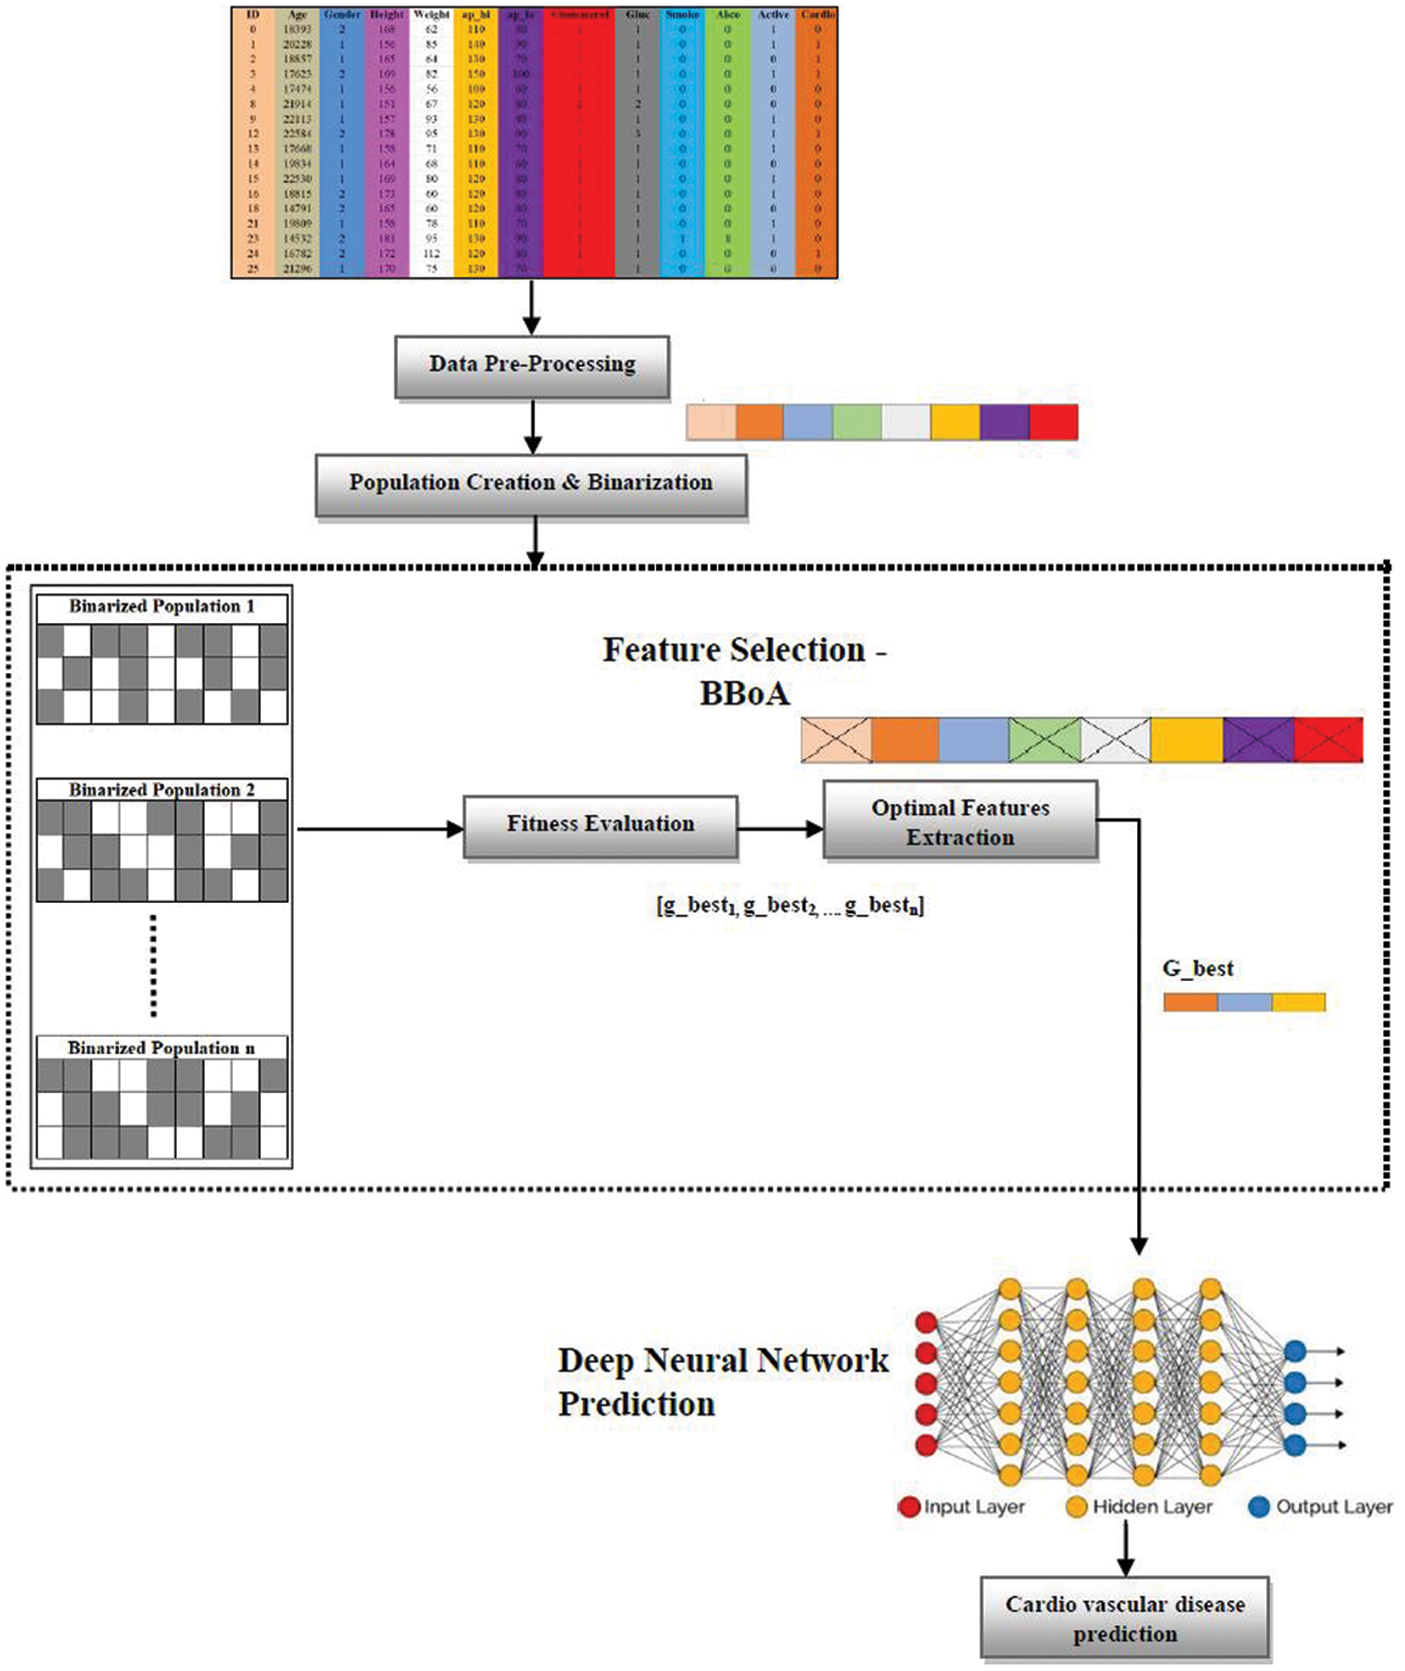
Figure 1: (a) Architecture of the proposed system
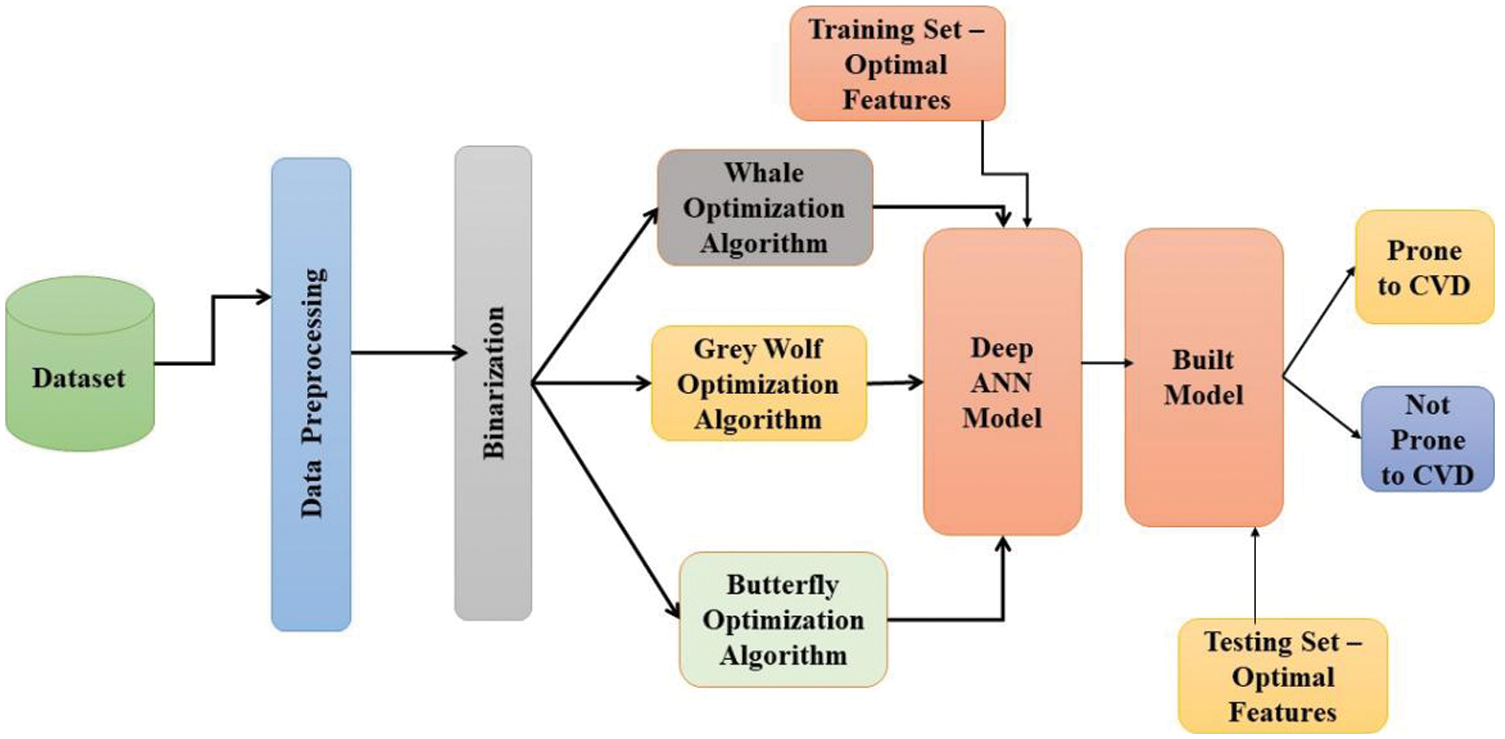
Figure 1: (b) System design
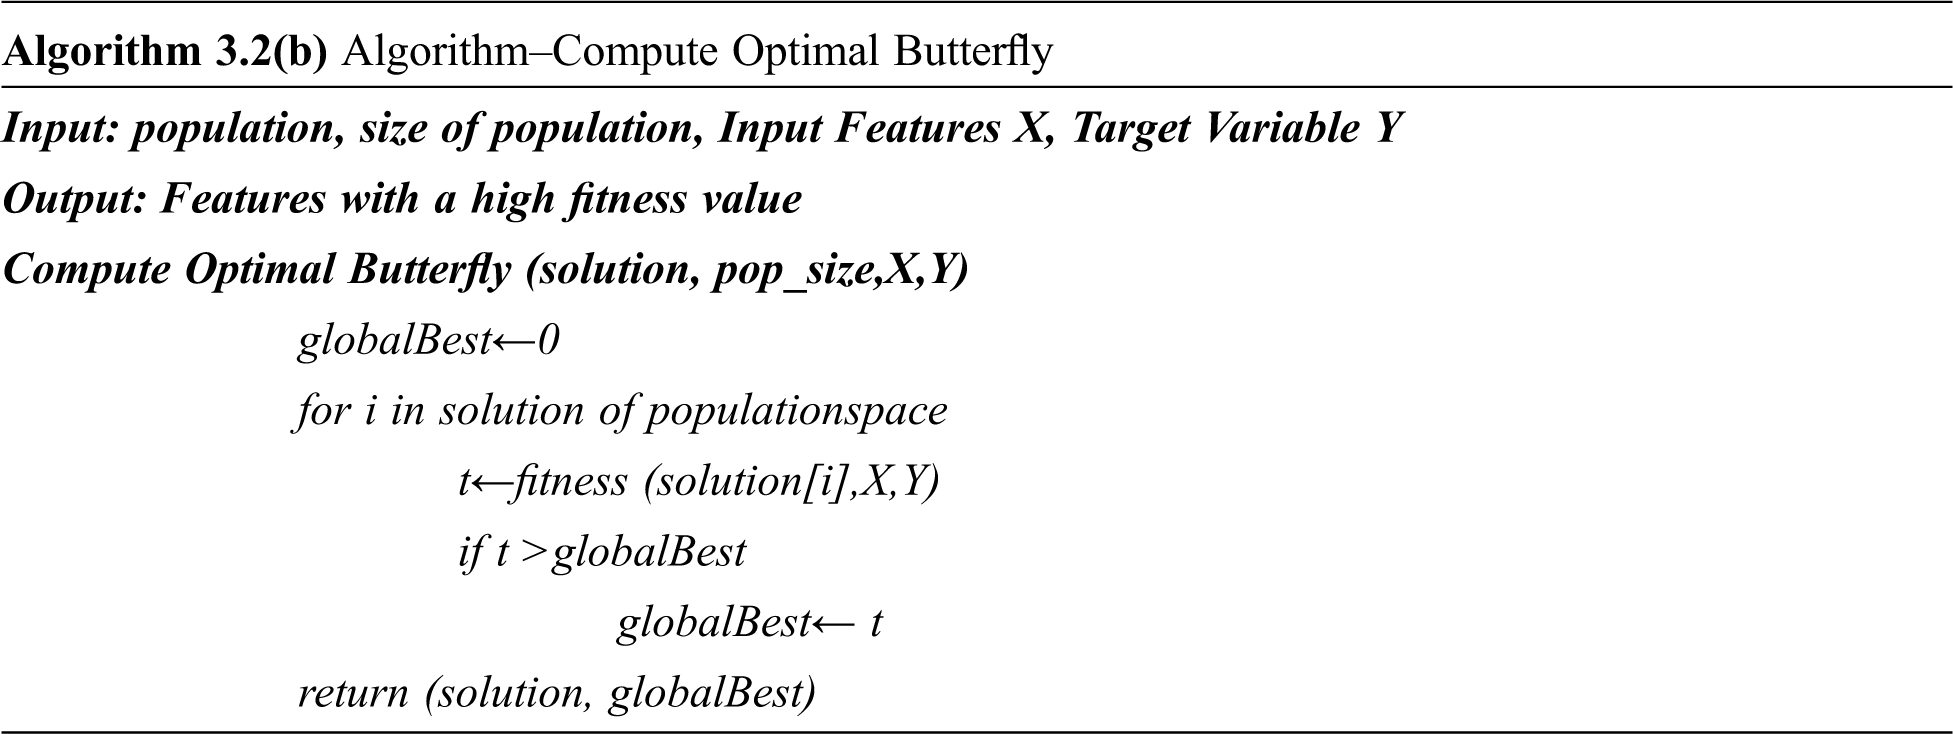
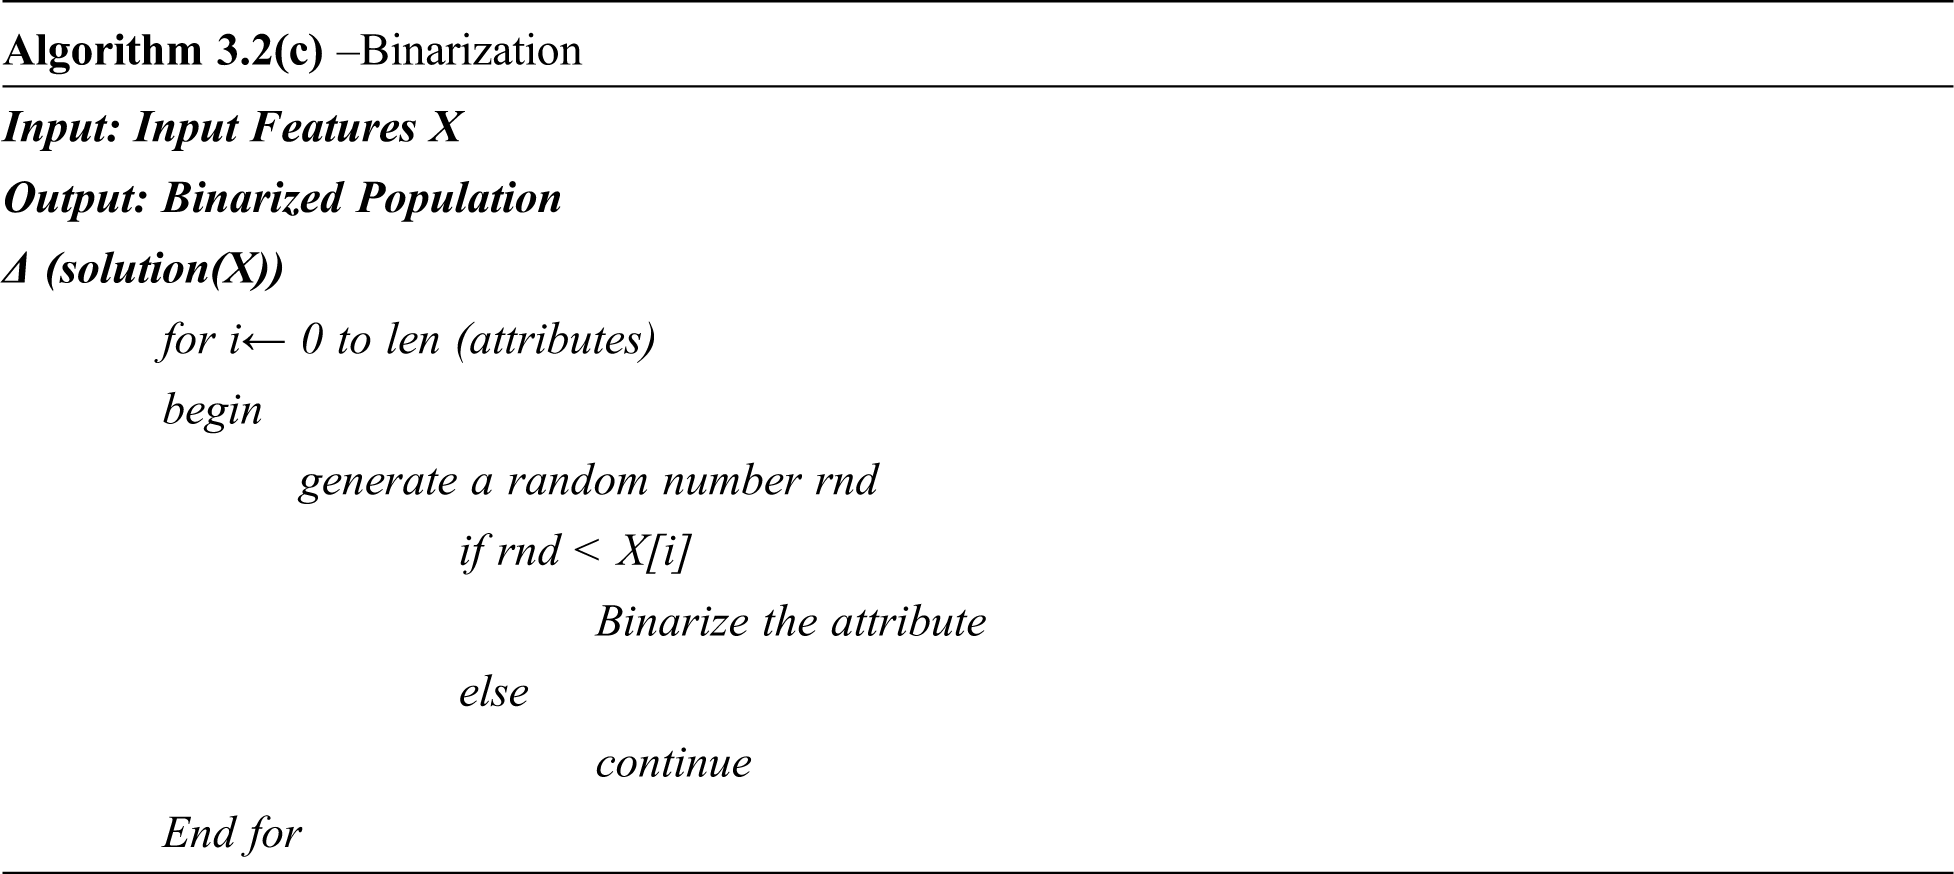
The input features are binarized. The input which is binarized with the value “1” indicates that the corresponding features are selected. The binarized features are split into n number of population which is populated initially with random features selected from the data set. The optimization algorithm generates the global best algorithm out of every iteration as in Eq. (1).
The population which yields the best results when validated with the optimization function is termed G_best as in Eq. (2)
The selected features of G_best population are fed to the deep artificial network classifier. The data set used for this work is taken from the UCI repository of heart disease and the cardiovascular disease dataset from Kaggle repository. The system is comprised of three modules namely data pre-processing, feature selection, and classification.
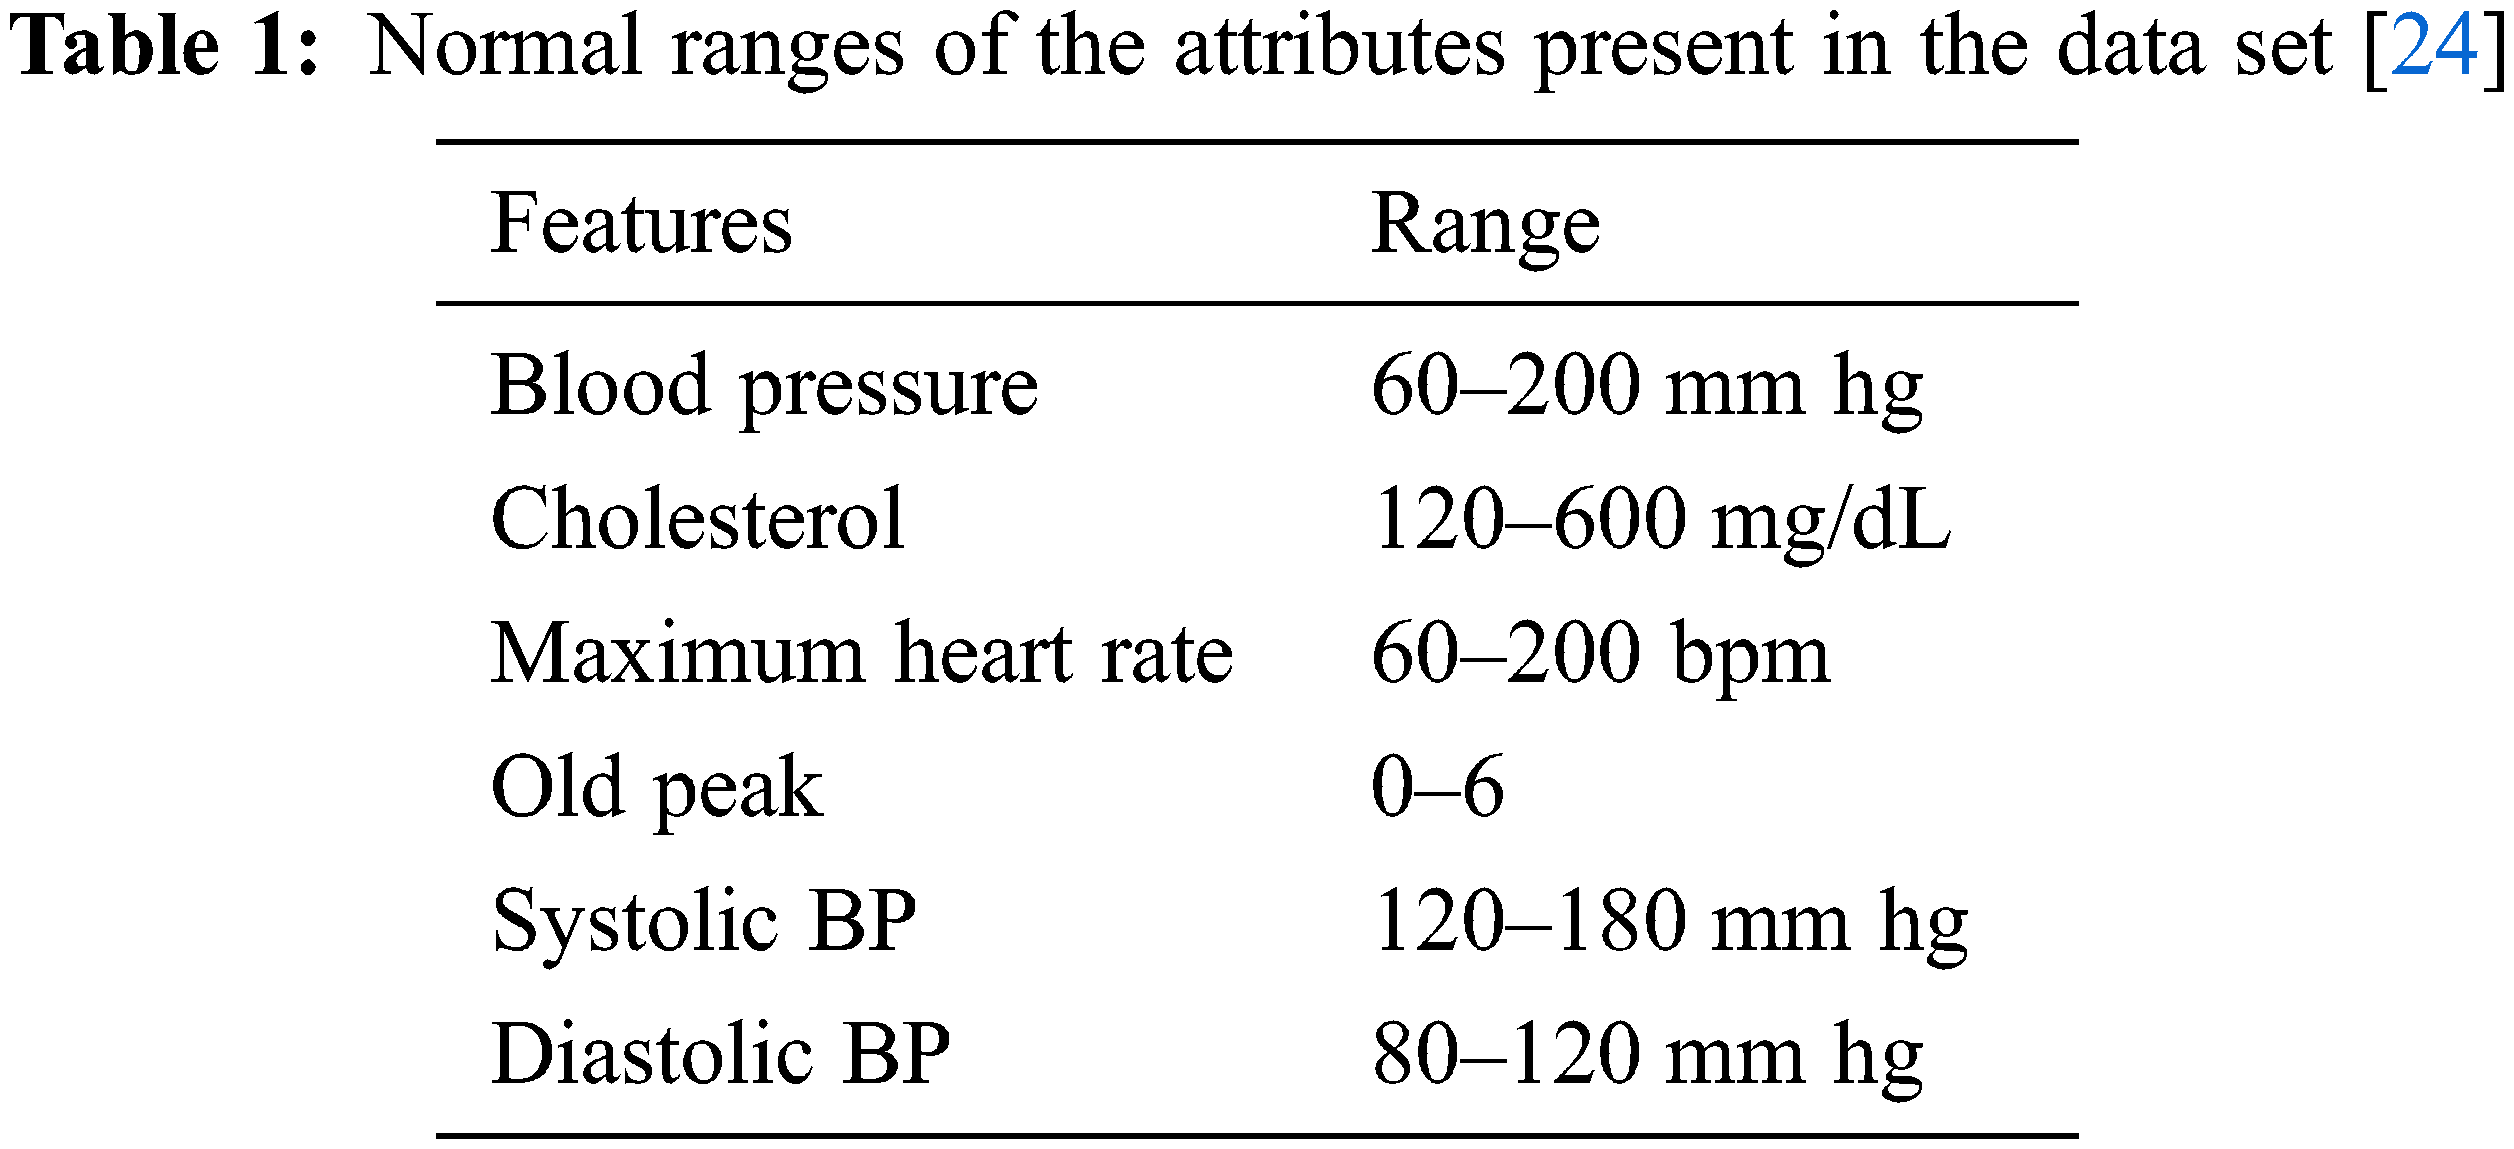
The UCI data set is normalized using standard normalization. The CVD dataset from Kaggle has certain irrelevant values that do not lie within the range of a normal human being. The irrelevant values are dropped from the dataset as per the following pre-processing steps.
if height >=2.5% of minHeight OR height <= 97.5% of maxHeight remove the record
if weight >=2.5% of minWeight OR weight <= 97.5% of maxWeight, remove the record
if SBP >=2.5% of minSBP OR SBP <= 97.5% of maxSBP, remove the record
if DBP >=2.5% of minDBP OR DBP <= 97.5% of maxDBP, remove the record
The normal range of values is listed in Tab. 1. The irrelevant values present in the data set are replaced with the k-nearest neighbor algorithm.
From the pre-processed data, it is necessary to select the appropriate subset of features before the learning process so that the learning can be effective. It is essential and appropriate for many applications such as disease prediction, fault prediction, and sentiment analysis as in [25].
There are two different types of feature selection strategies such as filter-based and wrapper-based methods. The filter-based approach extracts the dominant features using univariate statistics and these methods are expensive and have a low value of computational cost. The statistical metrics are the chi-square test, information gain, fisher’s score, correlation coefficient, etc. The dominant and informative features may be selected after ranking them based on the statistical metrics.
The Wrapper based approach follows the exhaustive approach of searching the features with all possible combinations of features. There are two selection strategies such as forward selection and backward selection. The forward selection opens up the feature selection with the empty set of features and starts adding feature one at a time until there is further enhancement in the accuracy, whereas the backward elimination approach starts with the entire set of features and prune the data set by eliminating the features one at a time. But it is an exhaustive approach increasing the time complexity. The feature selection is here inspired by Bio-inspired optimization called as Binarized Butterfly optimization algorithm.
Optimization Algorithms
Optimization is the process of finding the finest solution. There are various optimization techniques. Among them, the bio-inspired or meta heuristics algorithms are the optimization algorithms that are influenced and realized by the biological behavior of birds, and animals to yield an improved accuracy for classification. The Grey wolf optimization algorithm (GWO) is an optimization algorithm that imitates the hunting behavior of wolves. The GWO algorithm is modeled after the natural leadership structure and hunting mechanism of grey wolves. For replicating the leadership structure, four sorts of grey wolves are used: alpha, beta, delta, and omega. In addition, to accomplish optimization, three primary processes of hunting are implemented: searching for prey, encircling prey, and attacking prey. The Whale Optimization Algorithm is the optimization algorithm that mimics the hunting behavior of whales. It uses three main components to implement the search for prey, encompassing prey, and bubble-net foraging characteristics of humpback whales. The butterfly optimization algorithm mimics the food search and mating behavior of butterflies.
Butterfly Optimization Algorithm (BOA)
The optimization algorithms are used to tune the performance of the classifiers. The optimization algorithm comes under the category of the bio-inspired algorithm. The algorithm is enhanced to get the finer results of classification which is very crucial for health care applications.
The data set used as such in classification may degrade the performance and increase the computational cost of the classifier. The features of the data set can be selected based on the contributing faster and more effective prediction of results. The significant features are identified using the Butterfly Optimization algorithm. The Butterfly optimization algorithm is based on the movement of the butterflies toward the best fragrance. The butterflies sense the fragrance with the help of three parameters such as sensory modality (c), stimulus intensity (I), and the power exponent (a).
The fragrance of the solution is calculated using the Eq. (3).
To compute the best solution, there are two strategies followed. They are:
A. Global Search
The global search moves in the solution space towards the global best solution global* which is represented by Eq. (4).
where, Gbest* represents the best solution of the current iteration. fi is the fragrance of the ith solution. r is the random value in the range [0, 1] and git represents the jth butterfly.
B. Local Search
The local search moves solution space towards a new random place and the local search space is given by Eq. (5).
The movement pattern of the solution is correlated with the process of searching for the optimal solution (i.e., best fitness function). The search for the solution is done in local and global spaces. The context migration between local and global search is based on the probability value p which is selected and initialized as an algorithmic specific parameter. The above processes are repeated until a saturated point is reached and the algorithm emits the best solution with high accuracy.
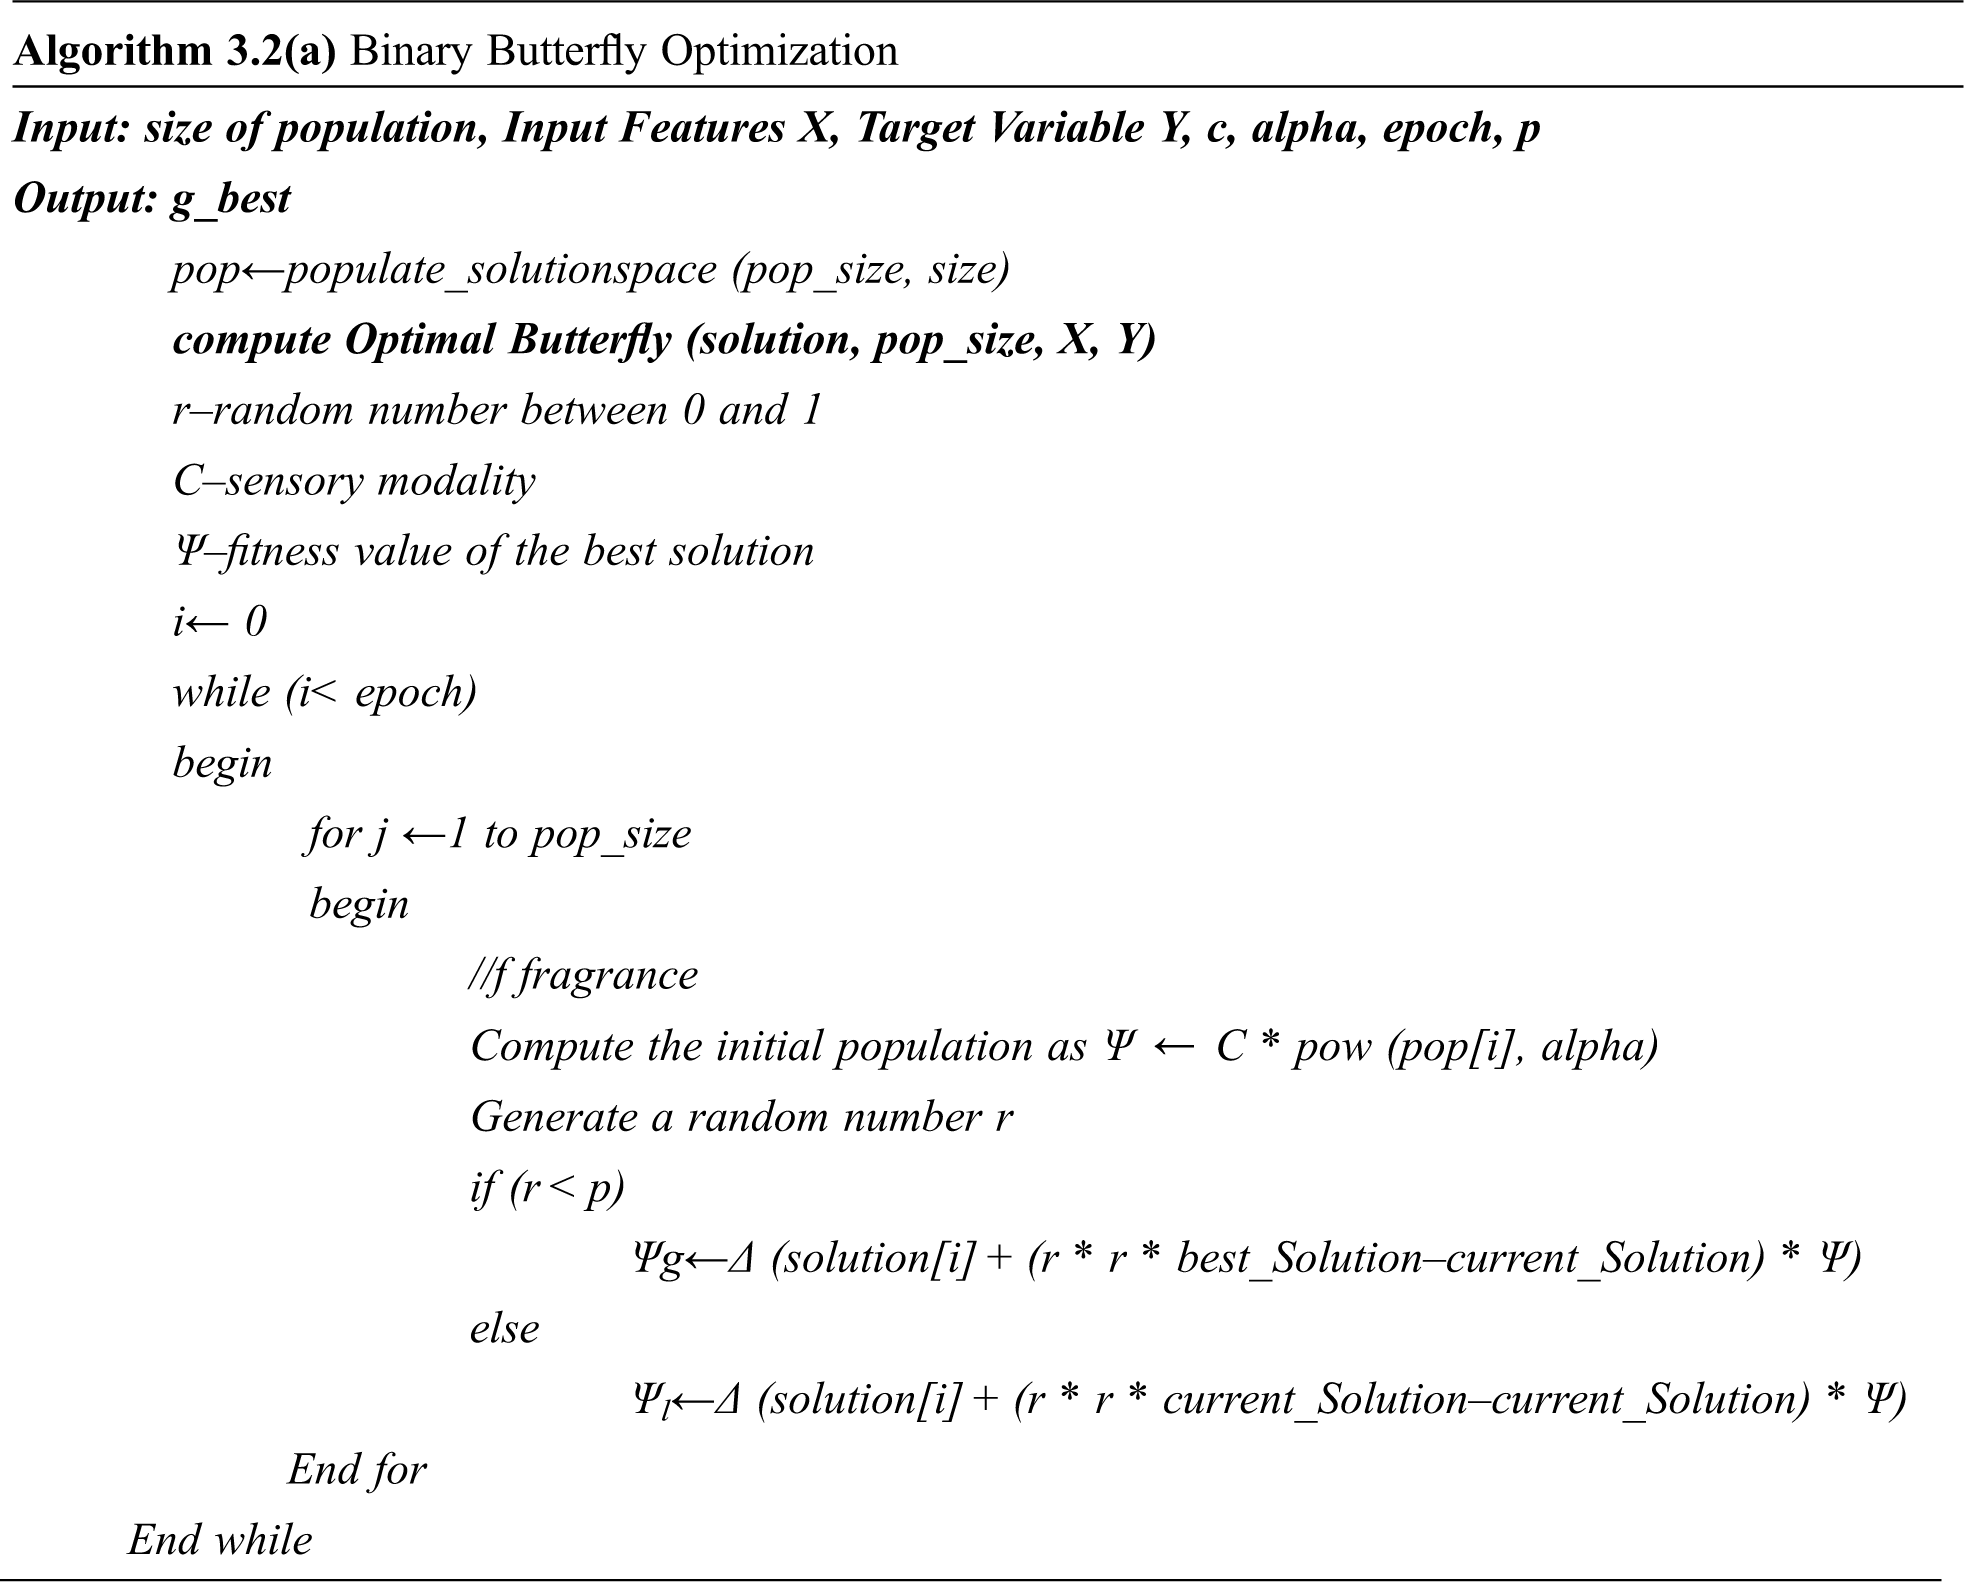
Proposed Binarized Butterfly Optimization Algorithm
The BOA is modified to have a novel global and local search algorithm based on the binarization of the attribute values with the help of randomly generated threshold ‘t” as given in the algorithm. Algorithm 3.2(a) represents the pseudo-code for the binarized butterfly optimization algorithm where epoch refers to the number of iterations done for getting the optimal solution and p is the probability value.
Randomized Binary Butterfly Optimization Algorithm
Initialize the parameters as follows:
epoch = 10
pop_size = 10
c = 0.01depth
p = 0.8
alpha = 0.1
Different classifiers are available for prediction and machine learning classifiers such as Support Vector Machine, Random Forest, Naïve Bayesian, and Decision Tree are used by different researchers. The deep artificial neural classifier algorithm increases the learning rate and yields higher accuracy.
Deep Neural Network
Machine Learning is the concept that comes under the umbrella of Artificial Intelligence and deep learning is another interior subset of machine learning. The artificial neural network is used for classifying data that can yield precise results. It mimics the structure and behavior of the human nervous system. It also tries to learn effectively yielding better performance. The artificial neural network has the sequence of layers for learning the features. The layers facilitate the extraction of features from lower layers. The extracted information is the backbone of the model with fewer hidden parameters.
The features extracted out of the BBoA are fed to the input layer. The Deep Neural Network facilitates learning by accomplishing different abstraction layers. The number of layers decides the depth of the network. The deep neural network structure used in the proposed system is depicted in Fig. 2. Deep learning is based on the neural networks as a backbone and it is realized as biological neurons. The deep neural network comprises neurons as layers. A dense layer is constructed as a result of a set of inputs collected together. The layers are meant for transforming inputs by going through different mathematical formulations. Using constructing different layers, the inputs are transformed with the complex formulation. The deep neural network is constructed after experimenting with 4, 5, 6 hidden layers with varying numbers of neurons. The optimal deep neural network identified is the network with 4 layers and 14 neurons in each layer. Transformation at every layer makes the system move towards the solution.

Figure 2: Architecture of deep neural network for prediction
The feature transformation of weighted input to output is done with the help of activation functions. The rectified linear activation function (ReLU) and sigmoid activation functions are used for the transformation of input features. The rectified linear activation function (ReLU) is the default activation function predominantly used yielding improved classification accuracy. The activation function is implemented using Eq. (6).
The sigmoid activation function is the nonlinear function used for input transformation and it is implemented as follows using Eq. (7). The sigmoid function is used at the output layer.
4 Experimental Results and Discussion
Performance Metrics
There are different metrics to measure the performance of the binary classifiers such as accuracy, sensitivity, specificity, and F-measure.
Accuracy is the most used measure for classification performance comparison. It is the ratio of correct prediction to the total number of instances. Accuracy is calculated based on the number of true positive (TP), true negative (TN), false positive (FP), and false-negative samples (FN) and it is represented as a confusion matrix of 2 * 2 dimensions for a binary classification problem. It is represented as follows.
Specificity is the measure of the ability of the classifier to predict the negative instances correctly. It reveals how far it is predicting the true negative instances correctly. If the specificity is 100%, the system can predict all instances the cardiovascular disease. It is computed using Eq. (9).
Sensitivity is the measure of the ability of the classifier to predict the positive instances correctly. It reveals how far it is predicting the true positive instances correctly. If the sensitivity is 100%, the system can predict all instances without cardiovascular disease. It is represented by the Eq. (10).
Data Set Description
The proposed system DNN–BBoA is tested on different data sets. They are the CVD data set from the UCI machine learning repository and the CVD data set from the Kaggle repository. All researchers focused on finding a solution to improve the prediction accuracy of the UCI machine learning dataset. The proposed system experiments with the two CVD datasets. The public data set for Cardio Vascular Disease data set from the UCI repository is available for different data sets such as Cleveland, Hungary, Switzerland, and VA Long Beach datasets and altogether forms a merged database of 1025 records with 13 features. The target is a binary output ‘0’ or ‘1’ which tells whether the patient is affected by CVD or not. The data set taken from Kaggle is also tested using the proposed system. It has 12 attributes of 70,000 instances. The data set description is mentioned in the Tabs. 2 and 3.
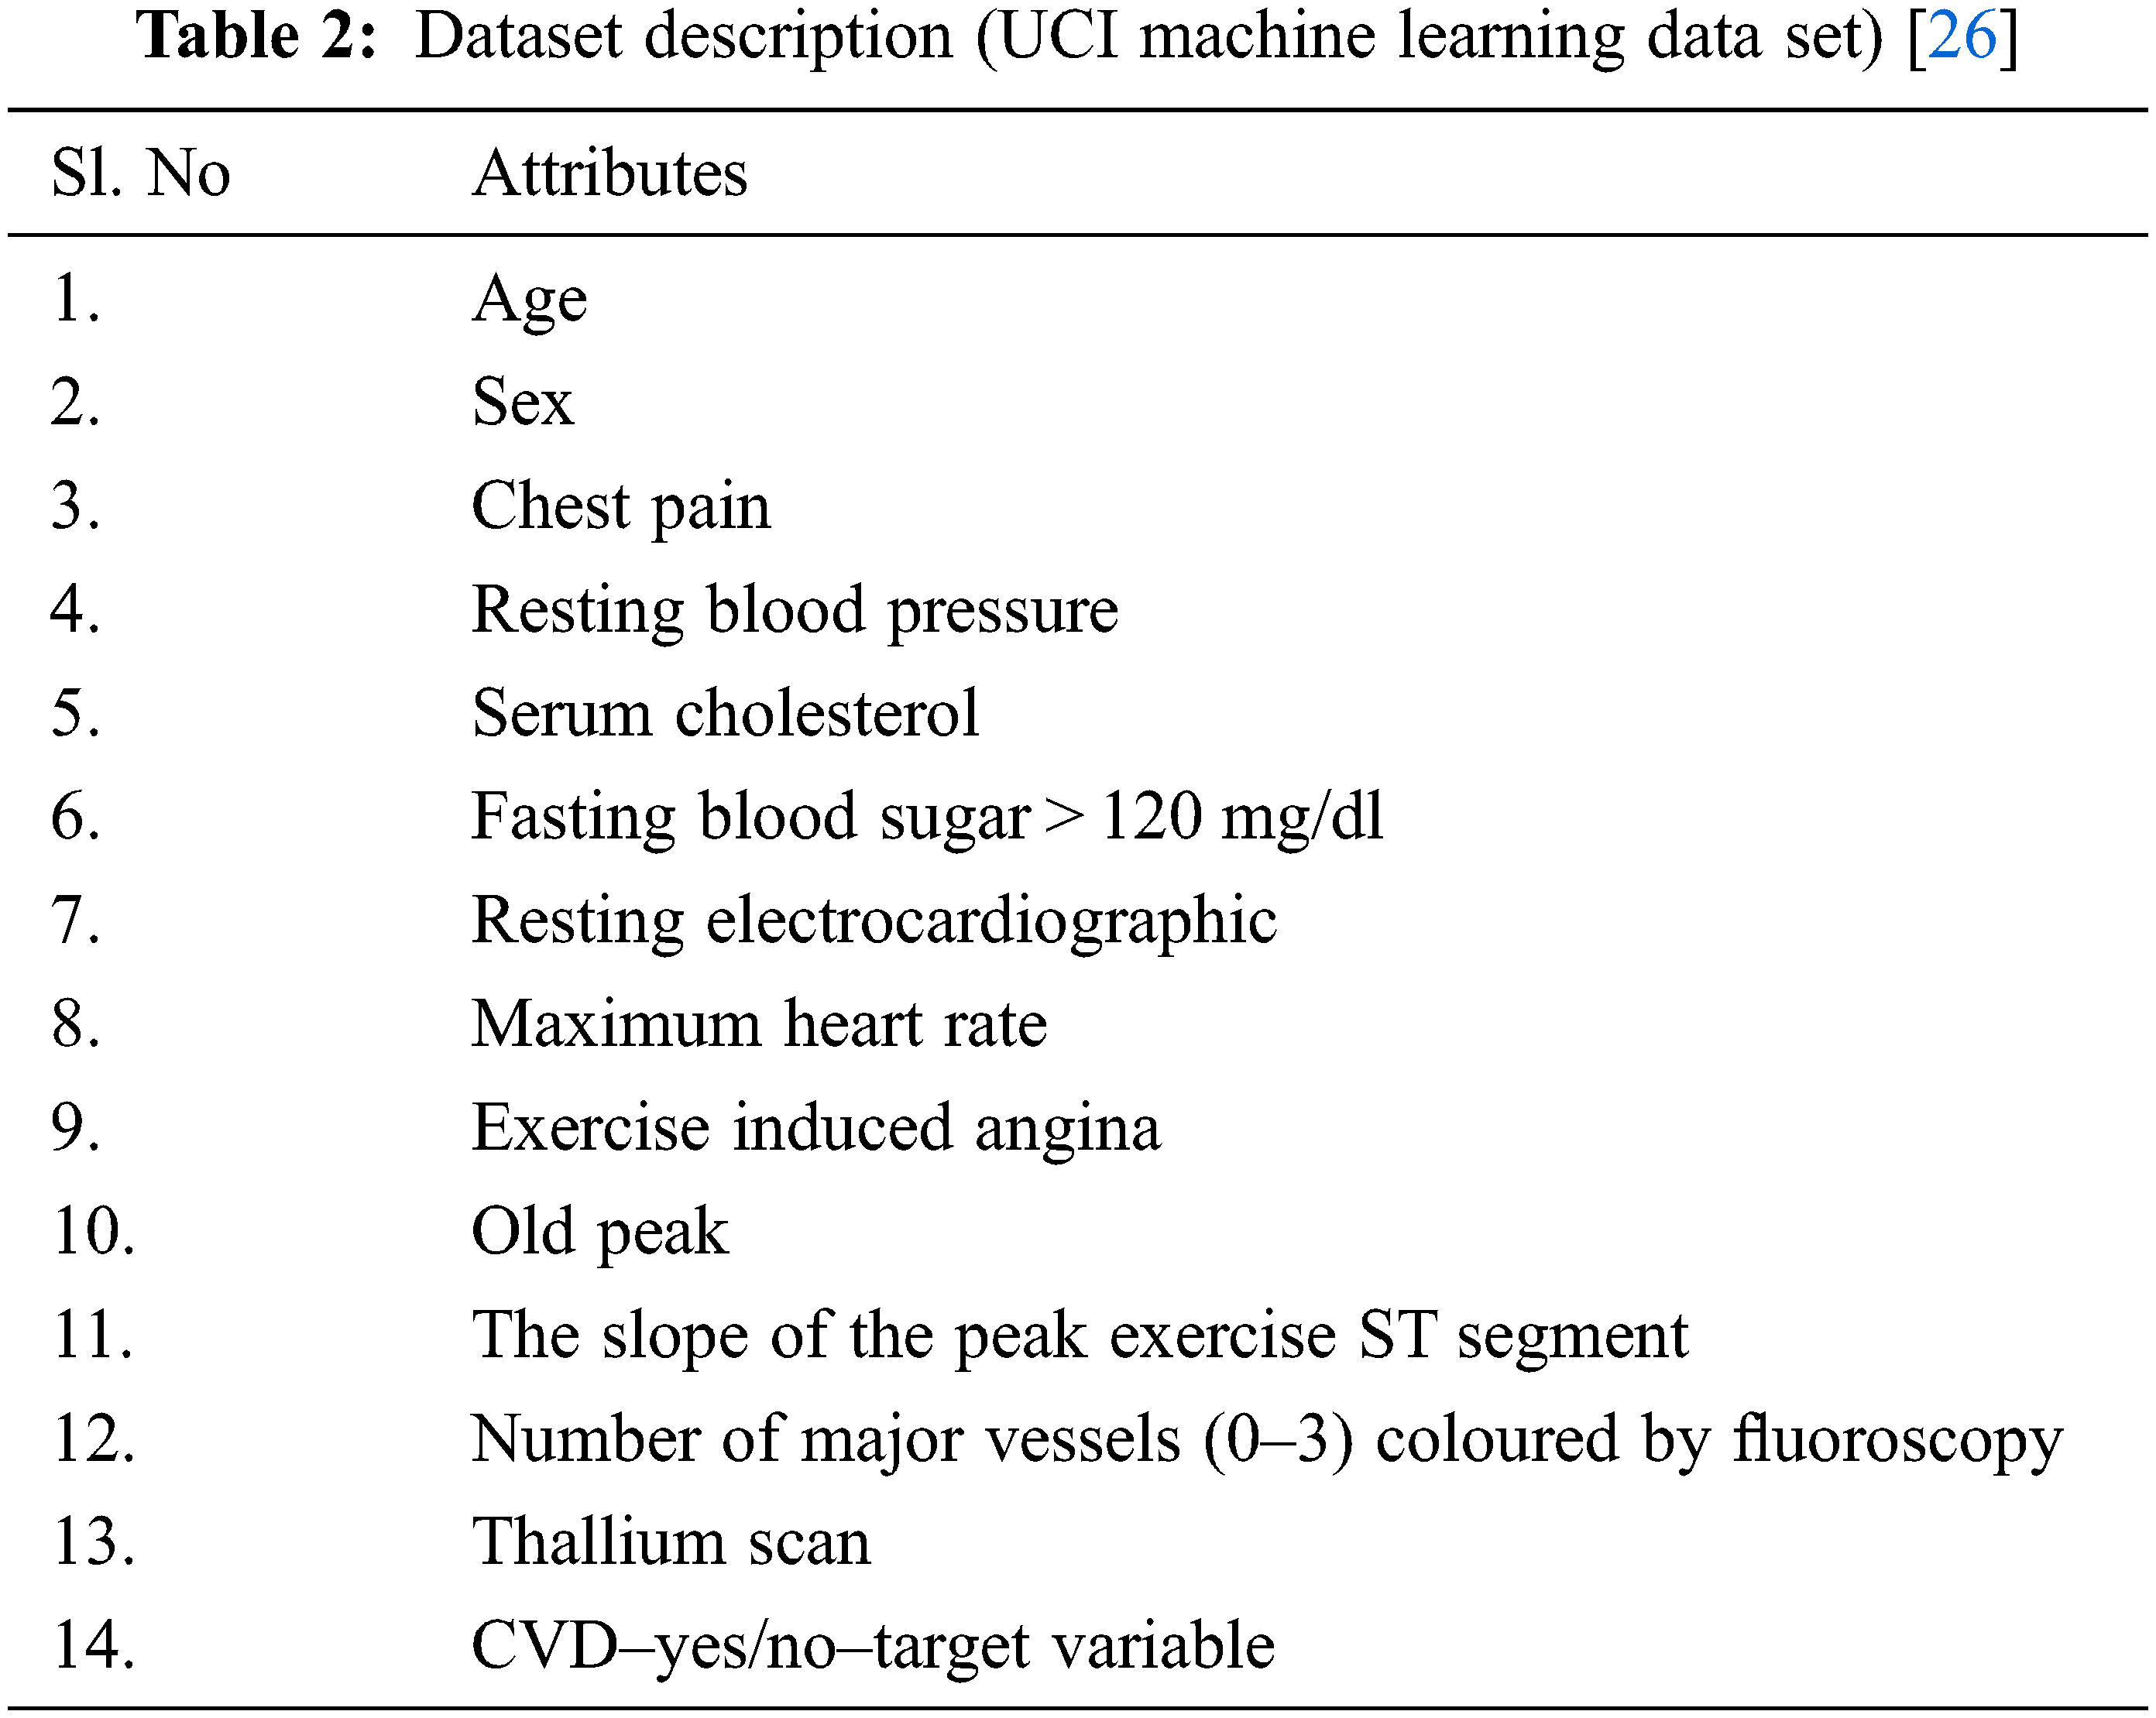
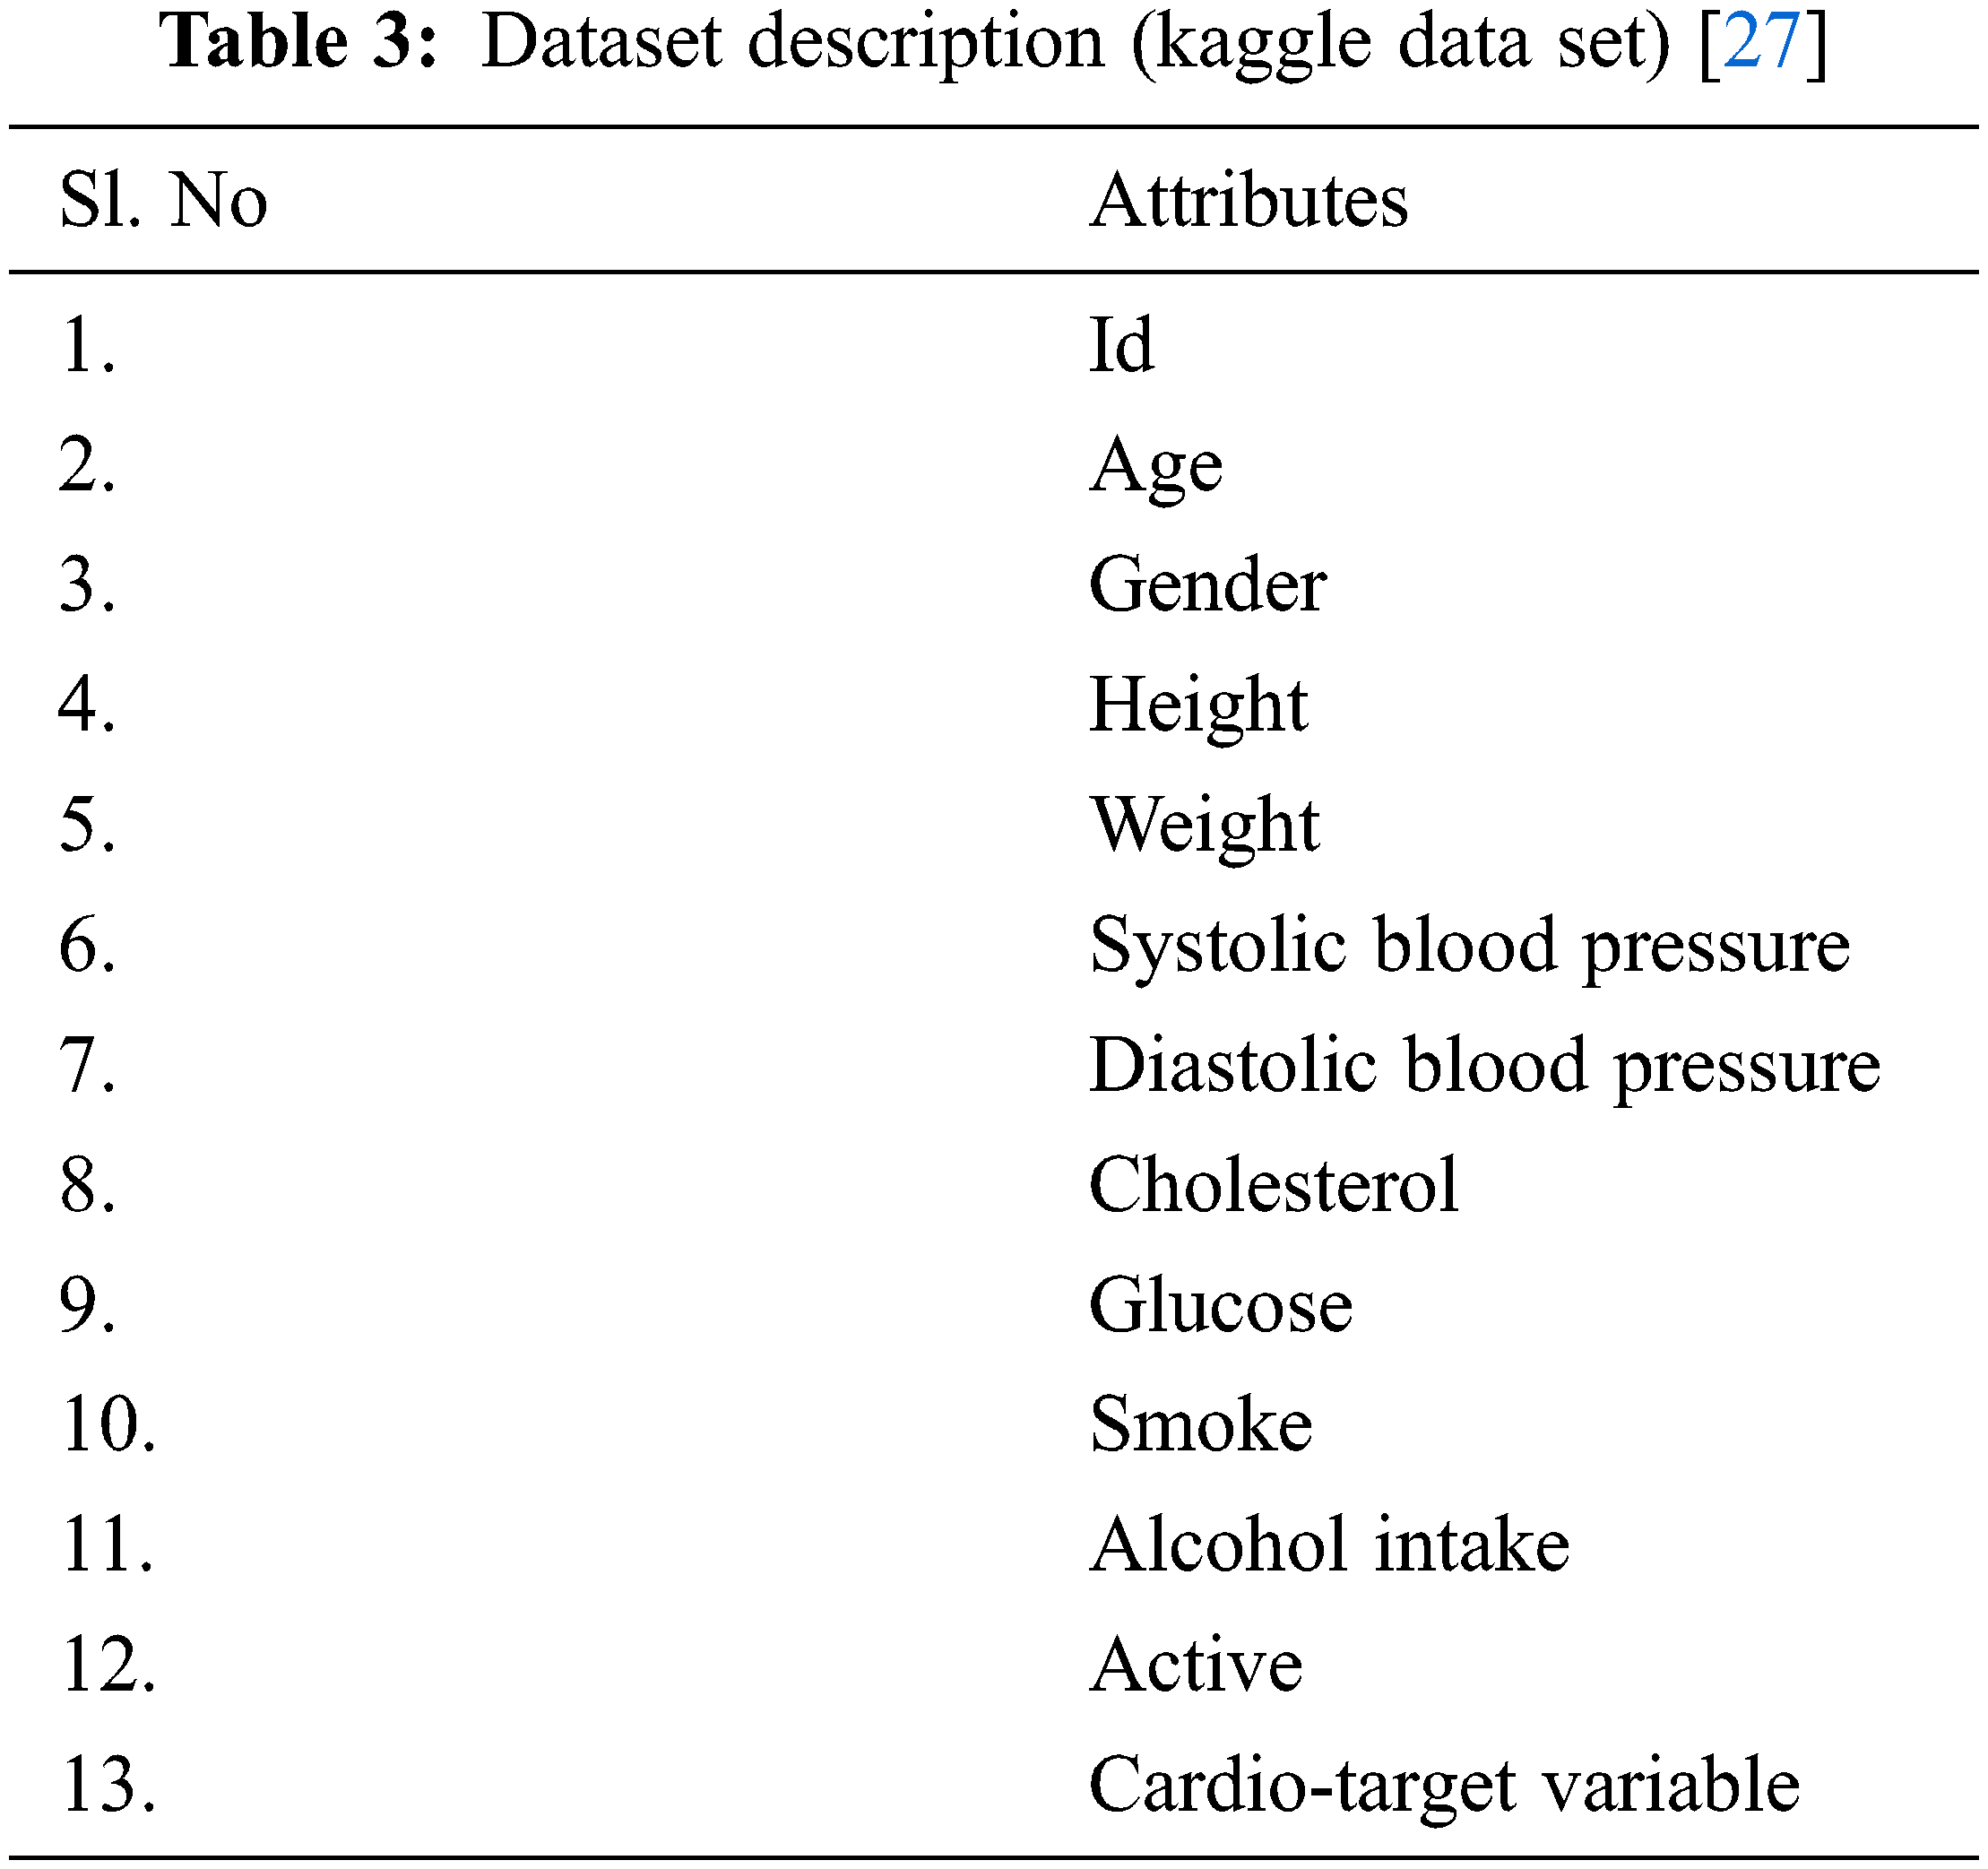
The features such as Age, Blood Pressure, Glucose, Cholesterol contribute to disease prediction. The heart disease dataset from the UCI machine learning dataset has 1025 instances (499 positive samples and 526 negative samples) and the missing value replacement is done. The Cardio Vascular Disease Dataset from the Kaggle data set has 70,000 instances (35021 positive samples and 34979 negative samples). It has certain irrelevant values in Systolic Blood pressure and diastolic blood pressure, height and weight. Hence, after irrelevant values removal, 61825 instances are fed for subsequent processing.
Different possibilities are explored to design an effective prediction system. The exploration is implemented and compared with the different number of features and these experimental results are shown in Fig. 3. It shows the results of the chi-square selection algorithms along with different machine learning classifiers such as Support Vector Machine, Naïve Bayesian, Random Forest, and Decision Tree Classifiers. The best results are produced when the no. of features = 9 and the Decision Tree Classifier for Heart Disease data set and it is best produced when no. of features = 7 and the Support Vector Machine are applied for the EDA Cardio Vascular Disease data set.

Figure 3: Accuracy comparison with CHI square feature selection and Ml classifiers
But, as these results are not promising, the proposed algorithms were deployed to improve further. That’s why the Binarized Butterfly optimization algorithm is applied to the raw data set yielding optimal features with higher accuracy as explained in visual Fig. 4. The optimal features contributed in the classifier for both the data sets are Weight, Blood pressure, and Glucose. This reveals that the proposed algorithm performs well on both the data sets and identifies the true significant features.
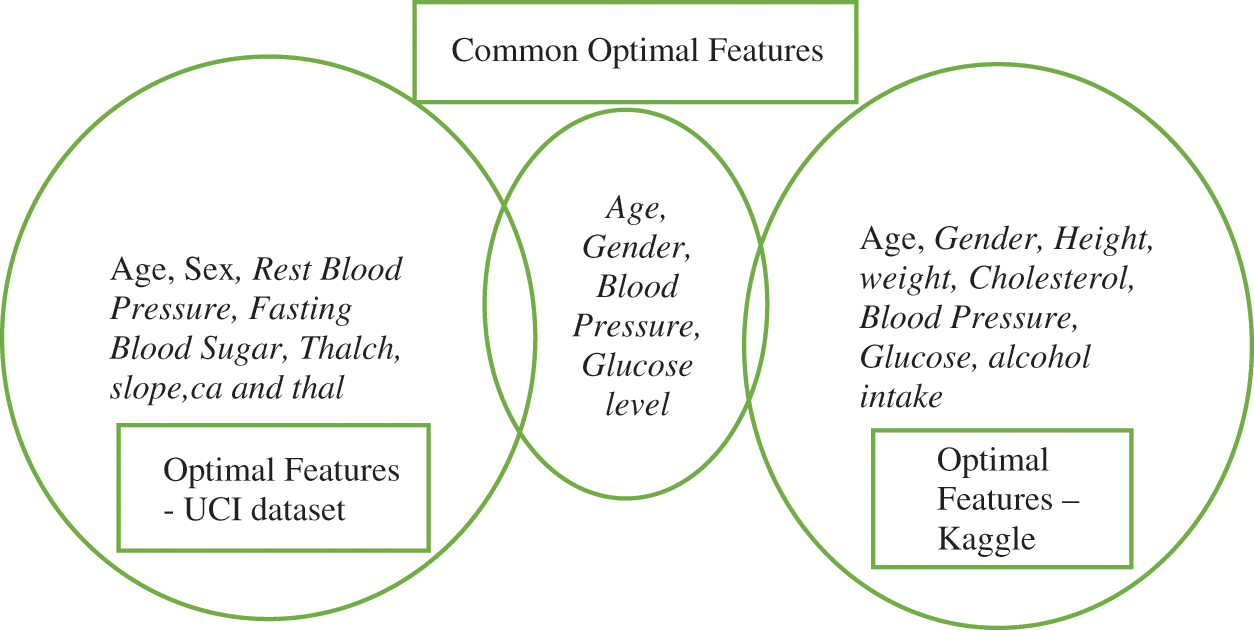
Figure 4: Optimal features analysis
The results are enhanced by applying the proposed system (DNN–BBoA). The same is exercised on the two data sets UCI machine learning data sets. The proposed algorithm (BBoA) assumes the values of the parameters as c = 0.01, p = 0.8, and a = 0.1 and the number of epochs = 150 facilitates the achievement of higher accuracy. The algorithm is executed with the selected population for 10 iterations. The fitness function (i.e.,) the classifier is used to find the executed optimal features and the accuracy value is achieved by evolving through different iterations. The accuracy value started saturating and the maximum accuracy is obtained for 8 features and they are listed in Fig. 5. The BBoA optimizer produces the prominent features and then they are fed to the deep neural network where the neural model used has the following configuration.
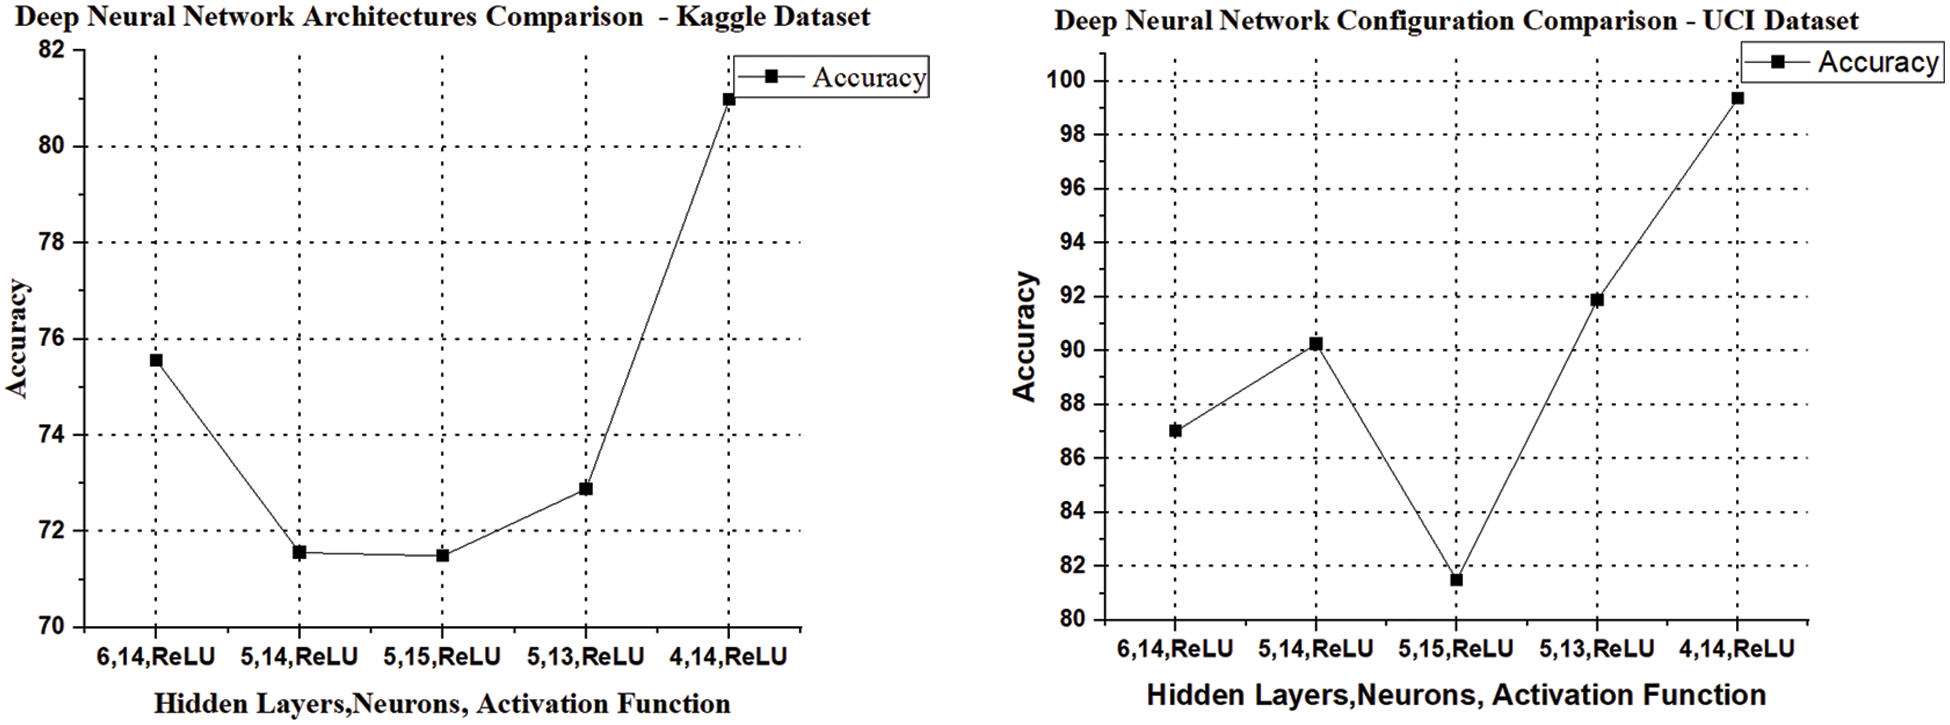
Figure 5: Deep neural network architecture comparison
Deep Neural Network Architecture Analysis
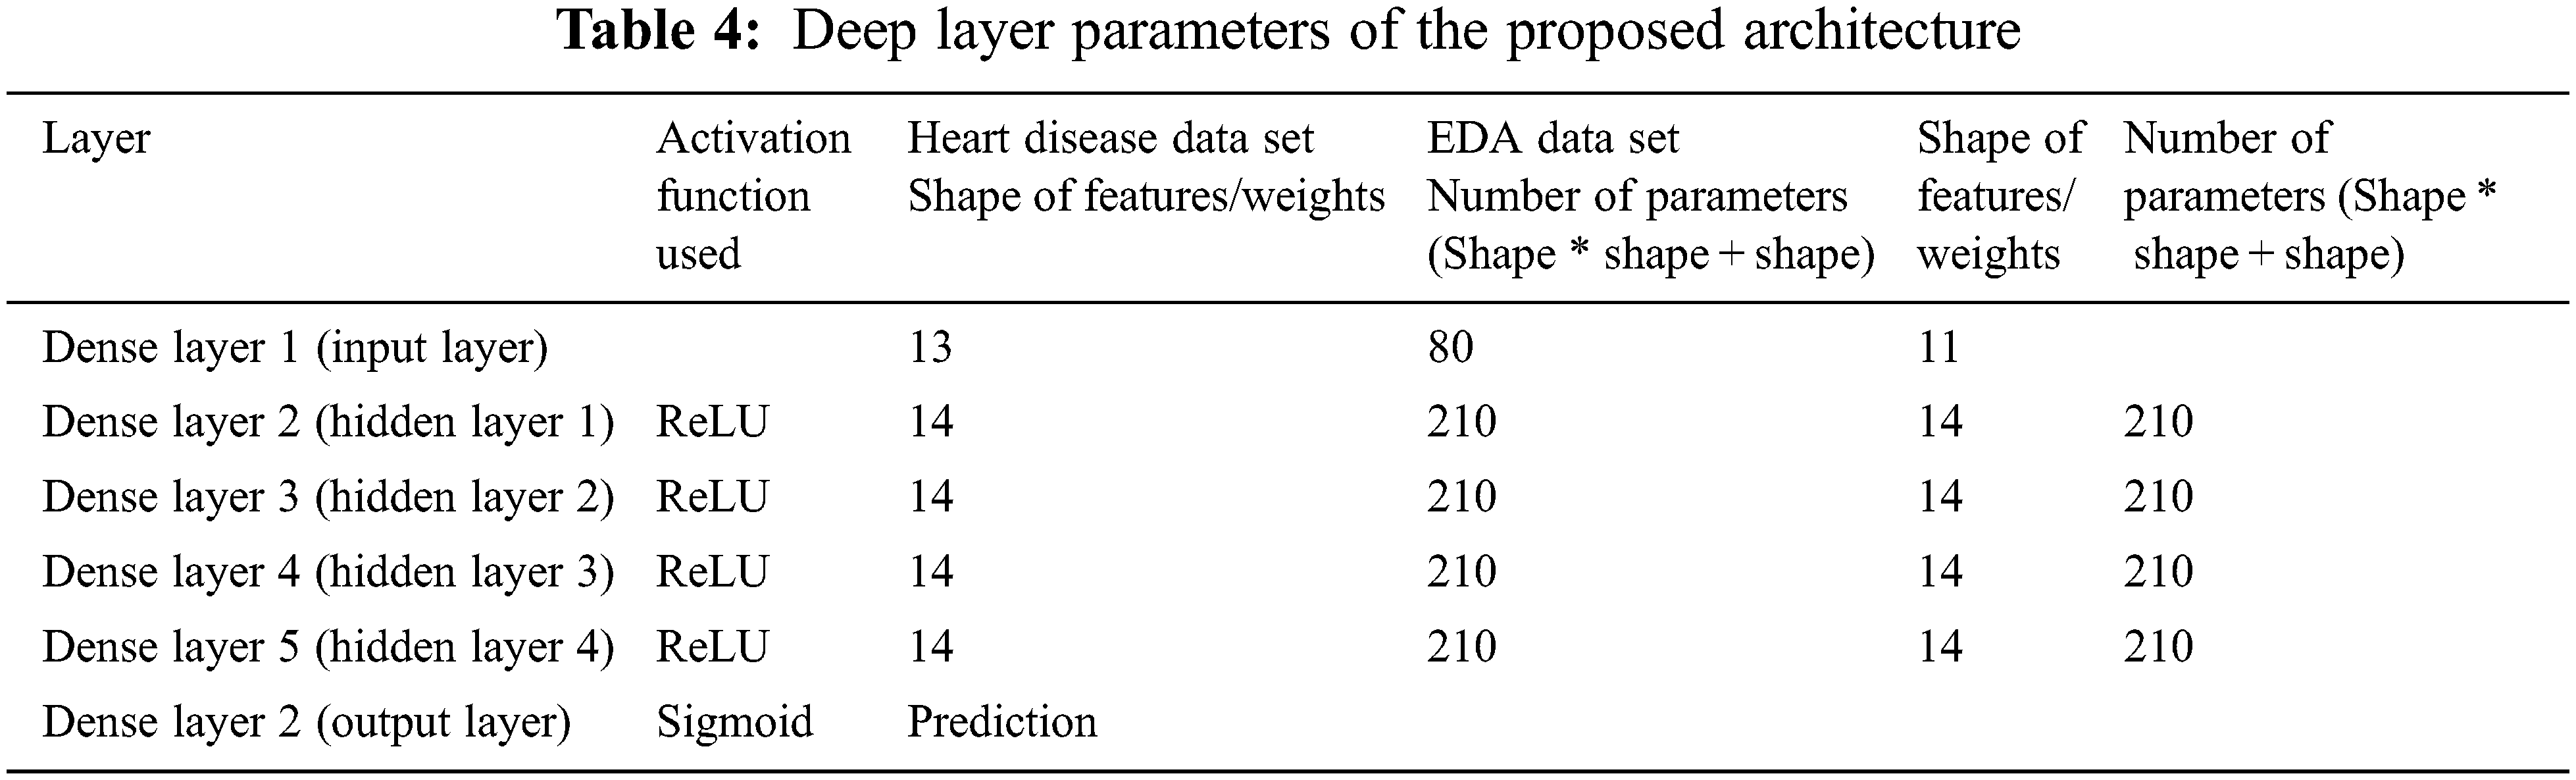
To get efficient deep layer architecture, different deep layers are exercised for getting higher accuracy. The activation function “Rectified Linear Unit” along with the different number of hidden neurons is exercised on both datasets. The results of different deep architectures are presented in Fig. 5 and it shows that the deep artificial neural network with 4 hidden layers of each 14 input neurons with ReLU activation function is identified as the ideal deep architecture and it is presented in Tab. 4.
Performance of the Proposed DNN–BBoA
The performance comparison of the proposed work is shown by incorporating different optimization algorithms along with different machine learning algorithms. Different optimization algorithms were exercised and compared with the proposed system. The Grey wolf optimization algorithms is tested on both UCI and Kaggle data sets and achieved the accuracy of 90.58% and 75.53% respectively. The Whale optimization algorithms are tested on both UCI and Kaggle data sets reaching the accuracy of 88.56% and 76.69% respectively. But these algorithms incurred an increased time complexity even on smaller data sets.
UCI Data Set
The experimental results shown in Fig. 3 compare the efficiency of different classifiers. The algorithms such as Decision Tree Classifier, Random Forest, and Support Vector machine achieve the accuracy within the range of 80%–89%. But, the Gaussian Naïve Bayesian gives a lower accuracy, since the classification is based on probability. The optimal features significantly contributed to the classifier are Age, Sex, Rest Blood Pressure, Fasting Blood Sugar, Thalch (maximum heart rate achieved), slope (the slope of the peak exercise ST segment, ca (number of major vessels (0–3) colored by fluoroscopy) and thal) using the proposed DNN–BBoA and it outperforms the other classifiers reaching the accuracy of 99.35%. The confusion matrix after classification is as follows.
Kaggle Data Set
The performance comparison shown in Fig. 3 reveals that the algorithms Support Vector Machine and Random Forest give the accuracy that lies in the range of 70%–75%. The Gaussian Naïve Bayes classifier produces a lower accuracy than in the UCI data set. The optimal features significantly contributed to the classifier are a set are Age, Gender, Height, weight, Cholesterol, Blood Pressure, Glucose, and alcohol intake using the proposed DNN–BBoA and it outperforms the other classifiers giving the accuracy of 80.98%. The confusion matrix after classification is as follows.
Tab. 3 and Fig. 6 are presented as proof of the efficiency of the proposed system. The performance results exercised on the two different datasets are graphically compared as follows:
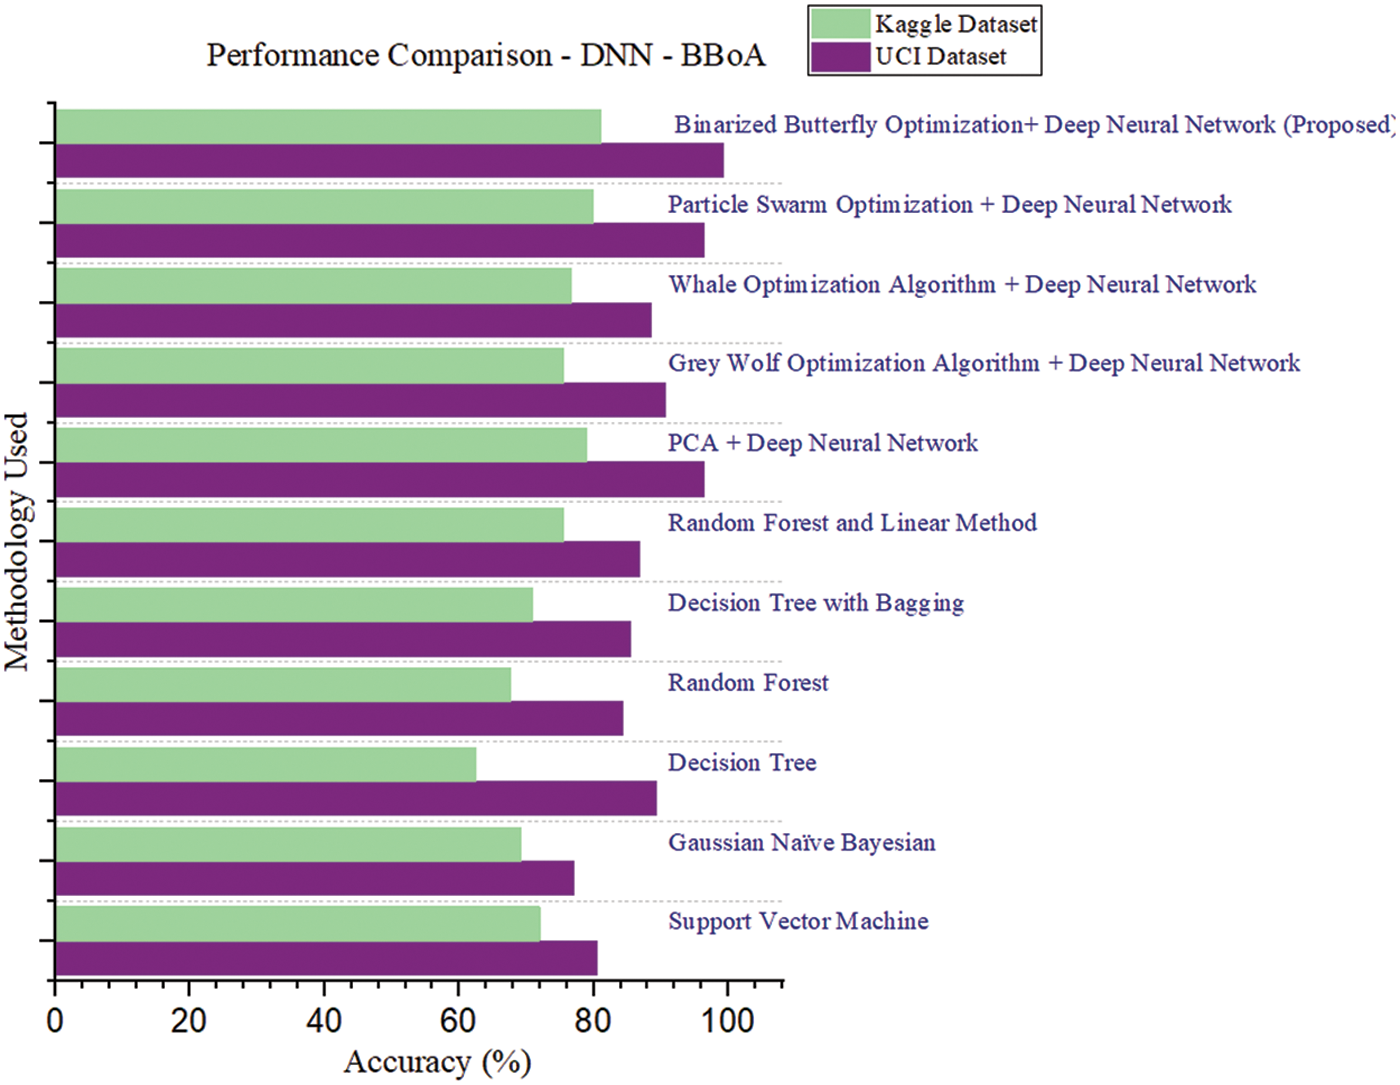
Figure 6: Performance comparison–DNN–BBoA
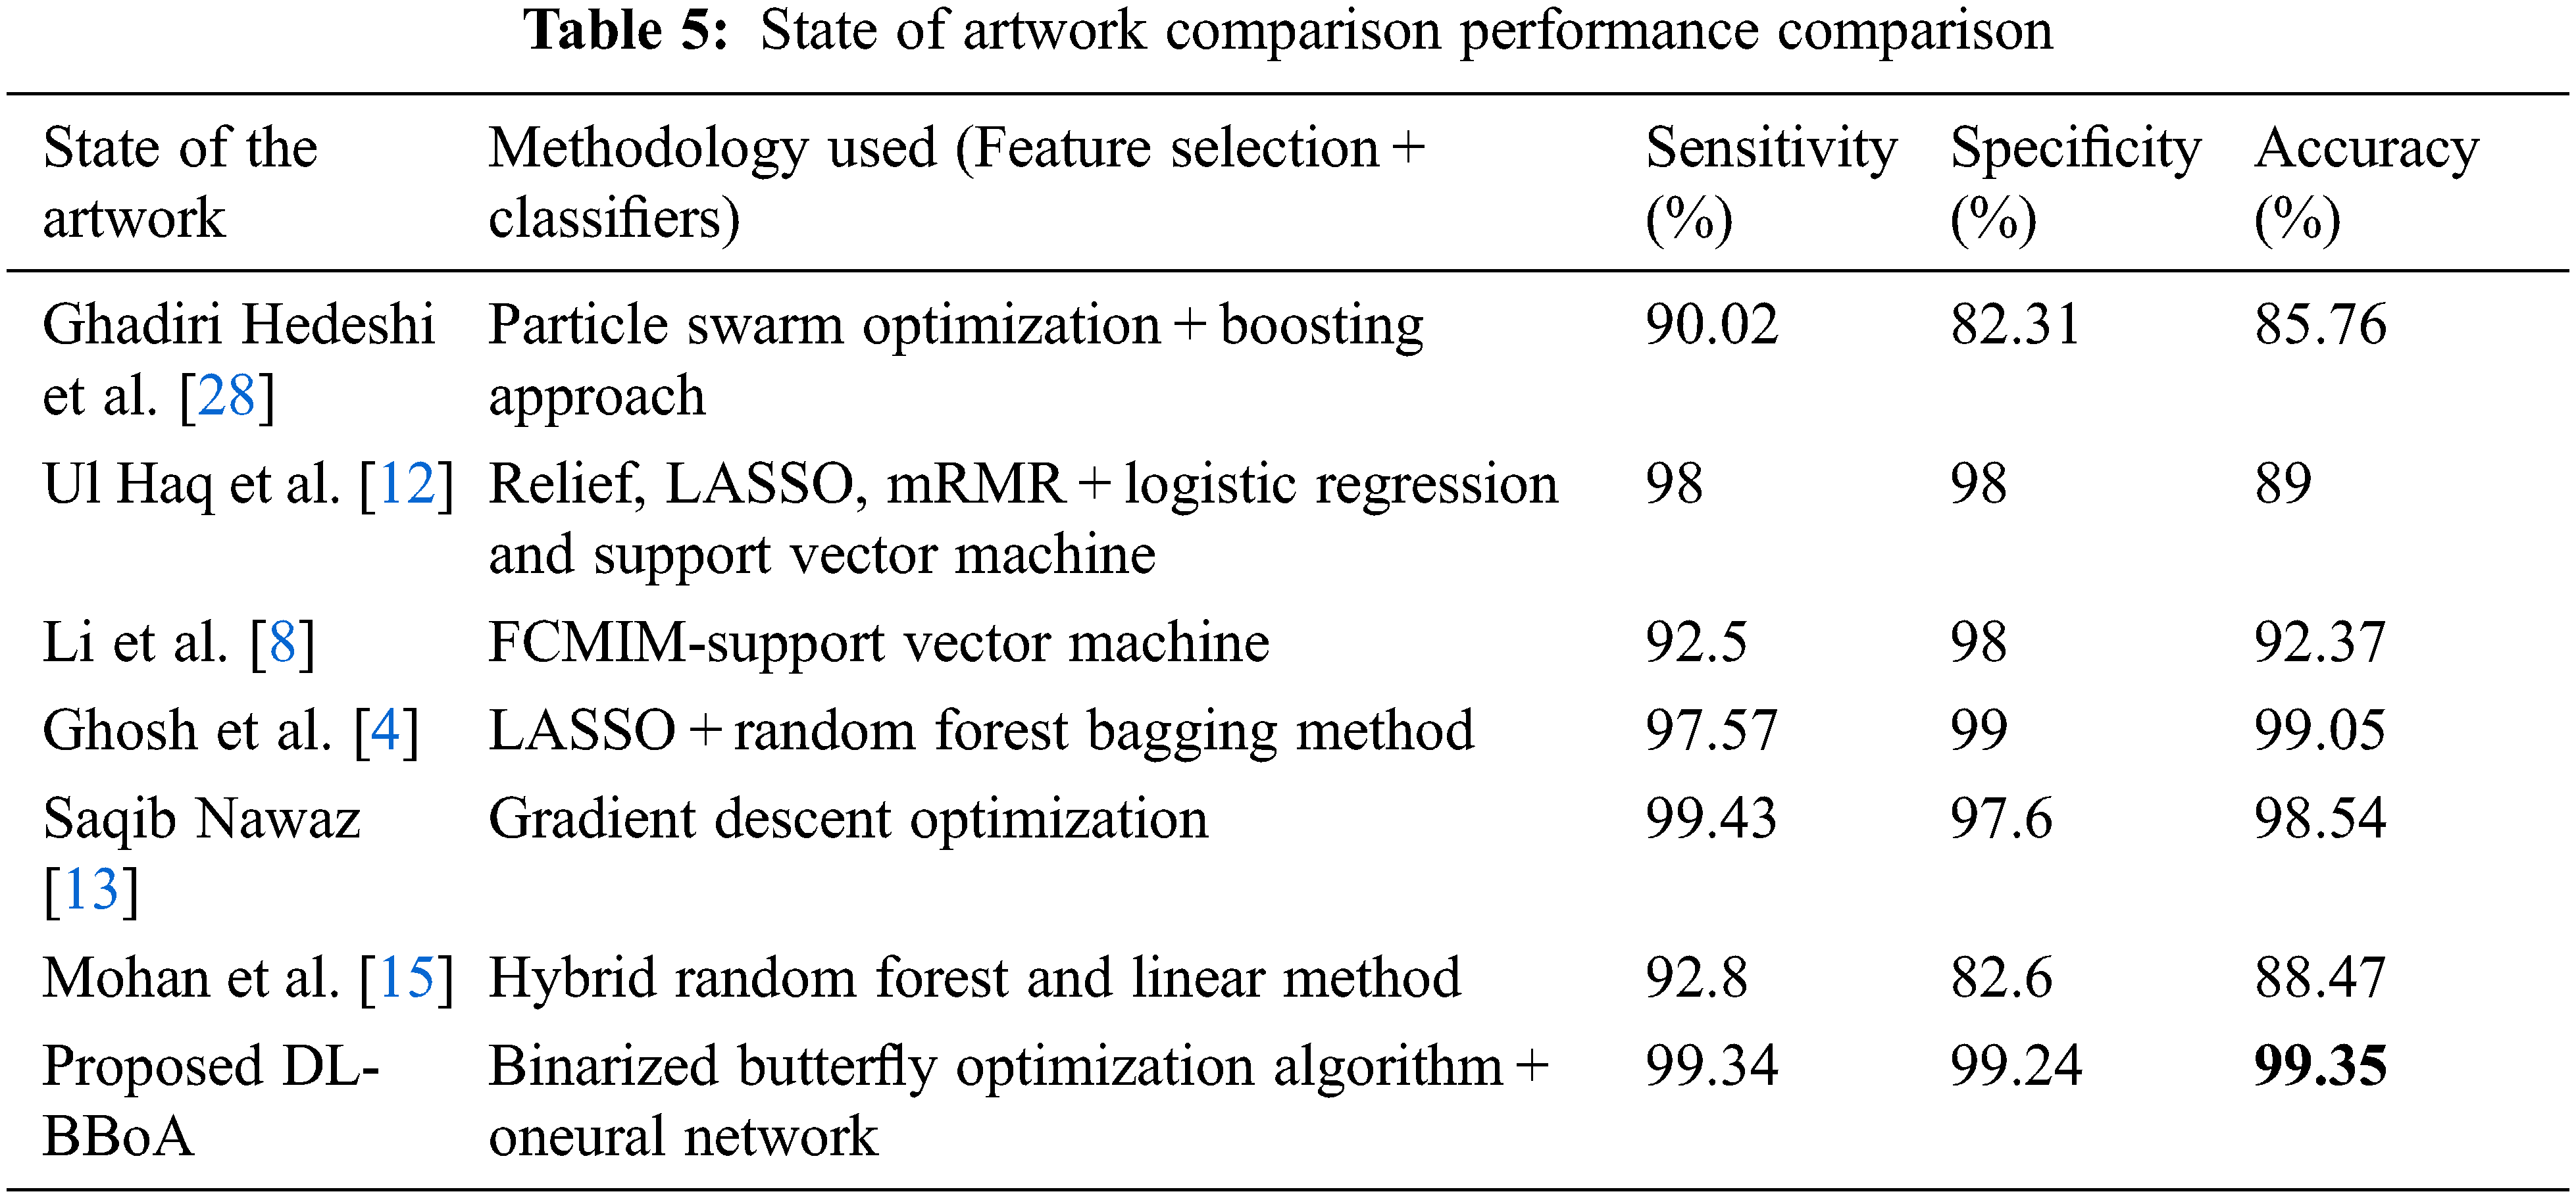
Tab. 5 indicates the performance comparison of state of artworks. The proposed approach DNN–BBoA is exercised on two different data sets. The feature selection algorithms such as Chi-Square and Principal Component Analysis are also tested for comparison. The different optimization algorithms were exploited for optimal feature extraction like Whale Optimization, Grey Wolf optimization, and binarized butterfly optimization algorithms. The binarized butterfly optimization algorithm is used for the proposed work. The proposed Binarized Butterfly Optimization Algorithm (BBoA) yields better results when compared to other algorithms. The proposed system performs well on both data sets. The machine learning classifiers such as support vector machine, Random Forest, Naïve Bayes, and Decision Tree are applied to the data sets. The deep neural network improves the results of the CVD prediction. The results are optimized with the help of a binarized butterfly optimization algorithm. The results produced by the system are due to the combined approach along with the tuned parameters like the threshold for binarization, stimulus intensity, power exponent, and sensory modality. The system will assist the physician in cardiovascular disease diagnosis in an effective manner. The optimal feature selection by BBoA increased the speed of prediction. The system can be further enhanced to make a correlation of other supplementary diseases and navigate through the causes and risk factors.
Acknowledgement: We show gratitude to anonymous referees for their useful ideas.
Funding Statement: The authors received no specific funding for this study.
Conflicts of Interest: The authors declare that they have no conflicts of interest to report regarding the present study.
References
1. S. S. Virani, A. Alonso, H. J. Aparicio, E. J. Benjamin, M. S. Bittencourt et al., “American heart association council on epidemiology and prevention statistics committee and stroke statistics subcommittee,” Heart Disease and Stroke Statistics—2021 Update: A Report from the American Heart Association. Circulation, vol. 143, no. 8, pp. e254–e743, 2021. [Google Scholar]
2. M. S. Amin, Y. K. Chiam and K. D. Varathan, “Identification of significant features and data mining techniques in predicting heart disease,” Elsevier Telematics and Informatics, vol. 36, pp. 82–93, 2018. [Google Scholar]
3. C. B. C. Latha and S. C. Jeeva, “Improving the accuracy of prediction of heart disease risk based on ensemble classification techniques,” Informatics in Medicine Unlocked, vol. 16, no. 7, pp. 1–9, 2019. [Google Scholar]
4. P. Ghosh, S. Azam, M. Jonkman, A. Karim, F. J. M. Shamrat et al., “Efficient prediction of cardiovascular disease using machine learning algorithms with relief and lasso feature selection techniques,” IEEE Access, vol. 9, no. 1, pp. 19304–19326, 2021. [Google Scholar]
5. S. J. Pasha and E. S. Mohamed, “Novel feature reduction (nfr) model with machine learning and data mining algorithms for effective disease risk prediction,” IEEE Access Journal of Multidisciplimary, vol. 8, no. 10, pp. 184087–184108, 2020. [Google Scholar]
6. A. K. Garate-Escamila, A. H. El Hassani and E. Andres, “Classification models for heart disease prediction using feature selection and PCA,” Elsevier Journal Informatics in Medicine, vol. 19, no. 4, pp. 1–11, 2020. [Google Scholar]
7. J. P. Rajan, S. E. Rajan, M. R. J. Martis and B. K. Panigrahi, “Fog computing employed computer-aided cancer classification system using deep neural network in internet of things based healthcare system,” Springer Journal of Medical Systems, vol. 44, no. 2, pp. 1–10, 2019. [Google Scholar]
8. J. P. Li, A. UlHaq, S. U. Din, J. Khan, A. Khan et al., “Heart disease identification method using machine learning classification in e-healthcare,” IEEE Access, vol. 8, no. 6, pp. 107562–107582, 2020. [Google Scholar]
9. K. K. Devi, J. Rajasekar and J. S. Kumar, “Development of ensemble based deep learning architecture for breast cancer classification and its performance comparison of other classification methods utilizing electronic health record data,” International Journal of Pure and Applied Mathematics, vol. 120, no. 6, pp. 11097–11113, 2018. [Google Scholar]
10. J. Kurek, B. Swiderski, S. Osowski, M. Kruk and W. Barhoumi, “Deep learning versus classical neural approach to mammogram recognition,” Bulletin of the Polish Academy of Sciences, vol. 66, no. 6, pp. 1–11, 2018. [Google Scholar]
11. R. Priyatharshini and S. Chitrakala, “A Self-learning fuzzy rule-based system for risk-level assessment of coronary heart disease,” IETE Journal of Research, vol. 65, no. 3, pp. 288–297, 2018. [Google Scholar]
12. A. Ul Haq, J. P. Li, M. H. Memon, S. Nazir and R. Sun, “A hybrid intelligent system framework for the prediction of heart disease using machine learning algorithms,” Hindawi Mobile Information Systems, vol. 2018, no. 10, pp. 1–10, 2018. [Google Scholar]
13. M. S. Nawaz, B. Shoaib and M. A. Ashraf, “Intelligent cardiovascular disease prediction empowered with gradient descent optimization,” Heliyon, vol. 7, no. 5, pp. e06948, 2021. [Google Scholar]
14. M. Kozielski, J. Henzel, J. Tobiasz, A. Gruca and P. Foszner, “Enhancement of covid-19 symptom-based screening with quality-based classifier optimisation,” Bulletin of the Polish Academy of Sciences, vol. 69, no. 4, pp. e137349–e137349, 2021. [Google Scholar]
15. S. Mohan, S. Thirumalai and G. Srivastava, “Effective heart disease prediction using hybrid machine learning techniques,” IEEE Access, vol. 7, no. 6, pp. 81542–81554, 2019. [Google Scholar]
16. E. Majda-Zdancewicz, A. Potulska-Chromik, J. Jakubowski, M. Nojszewska and A. Kostera-Pruszczyk, “Deep learning vs feature engineering in the assessment of voice signals for diagnosis in Parkinson’s disease,” Bulletin of the Polish Academy of Sciences Technical Sciences, vol. 69, no. 3, pp. 1–10, 2021. [Google Scholar]
17. L. Ali, A. Rahman, A. Khan, M. Zhou, A. Javeed et al., “An automated diagnostic system for heart disease prediction based on χ2 statistical model and optimally configured deep neural network”, IEEE Access, no. 7, pp. 34938–34945, 2019. [Google Scholar]
18. D. Zhang, Y. Chen, Y. Chen, S. Ye, W. Cai, J. Jiang et al., “Heart disease prediction based on the embedded feature selection method and deep neural network”, Hindawi Journal of Healthcare Engineering, no. 29, 2021. [Google Scholar]
19. M. VijayMohan and G. Indumathi Ganesan, “A Nature-inspired meta-heuristic paradigm for person identification using multimodal biometrics,” Concurrency and Computation: Practice and Experience, vol. 33, no. 21, pp. e6420, 2021. [Google Scholar]
20. S. Arora and S. Singh, “Butterfly optimization algorithm: A novel approach for global optimization,” Springer Soft Computing, vol. 23, no. 3, pp. 715–734, 2018. [Google Scholar]
21. M. Tubishat, M. Alswaitti, S. Mirjalili, M. A. Al-Garadi and T. A. Rana, “Dynamic butterfly optimization algorithm for feature selection,” IEEE Access, vol. 8, no. 10, pp. 194303–194314, 2020. [Google Scholar]
22. A. Tlija, K. Węgrzyn-Wolska and D. Istrate, “Missing-data imputation using wearable sensors in heart rate variability,” Bulletin of the Polish Academy of Sciences, vol. 68, no. 2, pp. 255–261, 2020. [Google Scholar]
23. S. P. Patro, G. S. Nayak and N. Padhy, “Heart disease prediction by using novel optimization algorithm: A supervised learning prospective,” Elsevier Journal of Informatics in Medicine Unlocked, vol. 26, no. 8, pp. 2352–9148, 2021. [Google Scholar]
24. www.webmd.com. [Google Scholar]
25. N. Balaganeshand and K. Muneeswaran, “Aspect-based sentiment classification model employing whale-optimized adaptive neural network,” Bulletin of the Polish Academy of Sciences, vol. 69, no. 3, pp. 1–8, 2021. [Google Scholar]
26. archive.ics.uci.edu/ml/datasets/heart+disease. [Google Scholar]
27. www.kaggle.com/sulianova/eda-cardiovascular-data. [Google Scholar]
28. N. Ghadiri Hedeshi and M. Saniee Abadeh, “Coronary artery disease detection using a fuzzy-boosting PSO approach,” Hindawi Computational Intelligence and Neuroscience, vol. 2014, pp. 1–12, 2014. [Google Scholar]
Cite This Article
 Copyright © 2023 The Author(s). Published by Tech Science Press.
This work is licensed under a Creative Commons Attribution 4.0 International License , which permits unrestricted use, distribution, and reproduction in any medium, provided the original work is properly cited.
 Downloads
 Citation Tools