
 Submit a Paper
 Propose a Special lssue
 Open Access
ARTICLE
Investigation of Single and Multiple Mutations Prediction Using Binary Classification Approach
1 Department of Computer Applications, Noorul Islam Centre for Higher Education, Kumaracoil, 629180, India
2 Department of Software Engineering, Noorul Islam Centre for Higher Education, Kumaracoil, 629180, India
* Corresponding Author: T. Edwin Ponraj. Email:
Intelligent Automation & Soft Computing 2023, 36(1), 1189-1203. https://doi.org/10.32604/iasc.2023.033383
Received 15 June 2022; Accepted 26 July 2022; Issue published 29 September 2022
 View Full Text
 Download PDF
Abstract
The mutation is a critical element in determining the proteins’ stability, becoming a core element in portraying the effects of a drug in the pharmaceutical industry. Doing wet laboratory tests to provide a better perspective on protein mutations is expensive and time-intensive since there are so many potential mutations, computational approaches that can reliably anticipate the consequences of amino acid mutations are critical. This work presents a robust methodology to analyze and identify the effects of mutation on a single protein structure. Initially, the context in a collection of words is determined using a knowledge graph for feature selection purposes. The proposed prediction is based on an easier and simpler logistic regression inferred binary classification technique. This approach can able to obtain a classification accuracy (AUC) Area Under the Curve of 87% when randomly validated against experimental energy changes. Moreover, for each cross-fold validation, the precision, recall, and F-Score are presented. These results support the validity of our strategy since it performs the vast majority of prior studies in this domain.Keywords
The adverse drug reactions are generally the undesired reactions of prescribed medicines, which are intended to resolve a medical condition. According to a recent survey, adverse drug reactions level up to nearly 22 percent of trial errors and hence lead to failures [1]. Modern drug discovery processes may not be successful, provided that they have proven to be resulting in adverse reactions. The problems have been classified from mild effects to severe weaknesses, and ultimately death. Statistics from Europe say that nearly 4 percent [2] of the admissions in medical institutions are affected by adverse drug reactions. The cases in the United States [3] are worse than the European Nation as they account for nearly 1 million fatality rates. It is estimated that the cost spent on drug-related morbidity ranges from USD 500 billion to USD 530 billion [4]. These were the statistics of the year 2016 and it is almost equal to 16% of total expenditure in the whole of the United States. Before testing on human beings, every drug undergoes a series of tests over animals, selected volunteers, and selective human cohorts. Any possible adverse drug reaction will be captured during these tests and hence concluded to be released in the market. If the drug is showing inadequate or improper outcomes, further research and deployment of the drug are prohibited. Yet, this series of tests cannot determine the nature of the drug, as the intention of the drug manufacturer is more inclined toward releasing it and earning money [5]. The number of human volunteers tested, as an individual or cohort, varies from time to time and is based on the dependency on the drug. The trials must be conducted over heterogeneous subjects, and in some cases, the time taken for showing adverse reactions or side effects can take a longer span. Another important case to be considered is, how a drug would react when combined with other medications. Adverse drug reactions can humans become a potential danger to mankind and cause irreversible health conditions [6].
These deficiencies and hurdles in the industry demand better models to predict the outcome of drugs and their side effects. This has opened up a new domain in research where different methods are introduced to visualize the effects of individual and different combinations of drugs that may eventually lead to potential and permanent outcomes which are unpredictable [7]. Different computer-aided technologies are brought together with different models such as data science and machine learning for quicker and more reliable predictions. There are various methods in data science and machine learning models respectively, to clean, prepare, repair, and hence deliver a proper data set for the machine learning models for accurate prediction. This study concentrates on developing a knowledge base based on neighboring parameters and values obtained from real-life clinical trials registered for events of adverse drug reactions [8]. Since the information is collected from various sources, all such data will be in an independent format, and thus it needs to be aligned to a single format.
The information collected from the testing laboratories may not be complete as they will not be having the possible combinations of different medications. In this case, huge volumes of assisting information are retired from real-time scenarios where medical institutions, experts, and external laboratories would provide registered events of adverse drug reactions. Machine learning models [9,10] help understand the potential side effect when a drug is administered. All side effects may not be predicted during the first run itself, but different conditions, scenarios, and different sources will have refined the machine learning model to produce meaningful insights. Since this domain is about a lifesaving application, numerous models have been proposed and tested. Economical correlation analysis was presented to project the different physical-chemical properties and how they are related to the target proteins. The structure of a protein is registered before the administration of a drug [11], and after the drug has started its effects. The correlation and difference noted between the initial and eventual changes of protein property helped us to visualize the effects of the drug.
Predominant methods in machine learning and data science models have included convolutional neural networks to monitor the characteristics of proteins and their changes over time for different drugs and combinations. The drugs were later categorized based on varying substructures, encoded in the form of feature matrices or vectors and a Logistic regression model was introduced for training and predictions. The communication happening between different proteins, different drugs, proteins, and drugs was analyzed by a deep learning model [12,13], carefully segmented into an encoder and decoder. This network was built as a heterogeneous network under a deep learning framework. The encoder will be responsible for delivering a feature matrix that exhibits the relationship [14] between drugs and proteins. This encoded matrix was processed as an input in the next layer for embedding purposes. Various studies also integrated newly defined classifiers into unconventional machine learning models. The method employed was a classification purposed model and these models included a different approach for vectorizing the input characteristics of drugs and proteins. The relationship between drugs and proteins was not considered during the feature matrix construction like the previous approaches [15]. The shortcoming of these models was the elimination of potential information which was important for classification purposes. From the above information, no one has done this work using the proposed method of classification. Hence the work focuses on the prediction of single and multiple mutations using the efficient Logistic regression technique implied with the binary classification.
The contribution of this work is to construct a knowledge graph, as a significant model in data science applications, along with the embedding methodology has proven to be a notable model for finding out the association between drugs, proteins, and their combinations. The relationships of drug-drug, protein-protein, and drug-protein can easily be computed into two vector forms in this model of knowledge graphs [16]. The four primary parameters of knowledge graphs were considered to be drug, indication, reaction and target protein. The process of neighboring matrix construction defined the processes of a classifier which almost resembled a Logistic regression classifier and hence was implemented for predictions of adverse drug reactions. A multi-label classification model was proposed as an extension of the knowledge graph and to accommodate data from different data sources. When the number of iterations is increased, the AUC improves. During the knowledge graph creation, the maximum area under the curve was discovered at 2500 iterations. The proposed model’s ideal parameters would be about 2500 to 3000 iterations with a vector size of approximately 1000. The proposed knowledge graph with different strategies for cleaning and preparing the data, and processes them in a predictive model for delivering meaningful insights.
The following is an overview of the work. Section 1 explains a brief introduction to the work, Section 2 explains an exhaustive review of the work and its current technique, Section 3 illustrates the proposed work and its methodology, Section 4 provides findings and discusses related work, and Section 5 discusses the conclusion of work.
The effects of drugs are usually measured by variations in protein stability and how they are mutated after the drug is administered [17]. These effects are monitored during the wet lab experimentations, and they are deemed to be the best source of detecting adverse drug reactions. To build a model for predictions of adverse drug reactions, various machine learning techniques have to be incorporated into a particular object, in this case, the object is considered to be a protein [18]. Various unique features are present in a drug and proteins, which will be varied according to the drug’s action. It is the responsibility of any data science or machine learning model to discriminate different features suitable for the research. Proper feature engineering applied through data science approaches can help us yield better categories and classes of data and features. Hence applying relevant methods for reducing a regression problem.
The process of feature engineering is responsible for the overall accuracy of the model. The general strategies of identifying adverse drug reactions can be classified into one of three types which have their unique way of measuring the adverse drug reaction [19]. In the first category, the chemical structure of drugs is more concentrated than the protein structure. The second method of operations deals with the vitro characteristic of proteins and drugs and how they bind with each other are taken as important parameters. The third approach composes different data sets together, obtained from chemical, biological and phenotype characteristics, and hence combine them for better efficiency and accuracy. Based on individual characteristics of proteins and drugs, adverse drug reactions can be predicted in some cases and cannot be predicted in certain cases. There are various classifiers involved in different machine learning models to extract relevant features and changes observed in the molecular structure of proteins and drugs. Side Effect Resource (SIDER) and PubMed [20–22] are furnished with necessary data sets for the studies and in some cases, they are collected directly from medical institutions.
As far as data science models are concerned, feature extraction and representation are the core functionalities expected from the machine learning models used for predictions. The different characteristics of adverse drug reactions are listed with relevance to the methodology used in the data science model. When the drugs are considered, their biological characteristics will affect the target proteins, enzymes in the body and transporters which are used to carry the drugs to two different organs. Various researches have been proposed to analyze the interactions between different proteins, how the networks of gene ontology are structured and annotated [23], and finally how a drug acts upon a particular protein in a body. Different gene ontology has been combined to who composed common expressways of networks for transferring drugs inside the body.
The biological features were also computed into epilepsy-based networks and the neuron architecture was analyzed based on activities. Observed activities are later converted into Wave formats [24] and a two-dimensional image. A method named antithesis chemical protein interaction was proposed to overcome the difficulties of previous biological-based prediction models in data science. Various other studies in adverse drug reaction prediction models concentrate on the chemical feature specifically. The drug, its molecules, and its relevant chemical properties are investigated in a chemical space known as a preclinical safety Pharmacology laboratory for predicting adverse drug reactions. Different systems analyze the structure, their respective activities over the proteins and how they are related to the central nervous system, kidneys, liver and other significant organs inside our body [25,26]. Various side effects were measured based on this relationship and similarity between one drug and another. The drugs are broken down into their sub-molecular levels for a detailed analysis of the relationship between drugs and adverse drug reactions. This methodology enabled the researches to provide a detailed set of drugs along with their side effects. In the next course of action, the phenotypic characteristics of similar drugs resulted in similar adverse reactions in different patients and for different diseases.
Later, convolutional neural networks were implemented to extract the phenotypic and chemical properties of drugs and proteins where the models were concentrated on the interactions between distributed drugs. For every individual drug, a specific encoder [27] has been designed and deployed followed by stitching of all the encoders together to understand how a deeply stacked heterogeneous network contributes towards identifying the semantic type. The different layers are connected to produce an overall Network and are finally used for adverse drug reaction prediction. Auto Dock [28] is one of the standard software along with SAS used for preparing the data sets and analyzing the information and structures. A Logistic regression classifier was used in the data science model to predict the adverse reaction based on substructures and vectorized drugs.
The conventional machine learning models have suitably classified the drug reactions based on these vectors. The performance of the model can usually be affected when the number of characteristics considered in an application is changed. Association between different drugs when combined shows a huge variance in terms of the reactions and the target proteins. Knowledge graph models are proven to be a suitable model for displaying different entities and their relationships [29], irrespective of the complexity. Having formulated the drugs and proteins as different nodes in a network, it is significant to identify the characteristics of drugs and proteins when a knowledge graph is implemented. There are four potential elements in a knowledge graph the drug, its indication, the target protein and the adverse drug reaction.
These characteristics are analyzed based on the neighboring matrix followed by the factorization process [30]. A Logistic regression classifier is found to be a suitable classifier from the reviewed articles [31–33], despite the number of combinations of drugs, data sets and any other modalities. A predictive model used the knowledge graph approach word combined to deliver a unified approach to adverse drug reaction prediction [34–36]. From the reviewed articles, it is evident that a knowledge graph model is fruitful in deriving probable Side Effects for different drugs. Using a neighboring characteristic model, the proposed approach annotates four potential characteristics and their relationships [37–40]. The complex characteristics and relationships are further embedded into a knowledge graph based on drugs, results, target proteins and side effects. This knowledge graph is later converted into a multidimensional vector for predicting the adverse drug reaction.
2.1 Machine Learning Techniques
Support vector regression, random forests, and deep neural networks are the three primary machine learning algorithms used in this study for comparison with the proposed method.
2.1.1 Support Vector Regression
Support Vector Machines (SVMs) are machine learning techniques that work well in situations with a lot of features and few training sets. SVMs are commonly utilized for classification, but it is also used for regression. Support Vector Regression (SVR) is a term used to describe this [41]. The SVM is trained to reduce normalized empirical risk to compromise between predicting data trends while avoiding overfitting noise. SVR is a linear approach by default, however, non-linear relationships may be described using a kernel, which indirectly non-linearly translates the characteristics into a feature space. SVMs are commonly employed in machine learning for classification issues. Reference [42] Grid search and 10-fold cross-evaluation on the combination of the learning and development sets were used to fine-tune SVR parameters.
Random Forests (RFs) group models that aggregate the findings of several decision trees into a single model. A decision tree is a basic machine learning model that uses a tree structure to translate inputs to predictions, with each node asking a question about a feature. It is used for regression or classification. For each node, splitting criteria such as information gain or the Gini impurity index is used to train the trees. A random forest ensemble uses averaging to increase prediction accuracy and minimize model variance by combining various decision trees that have been several samples associated with the training dataset used to train [43]. On the combination of the learning and development datasets, a random forest structure was used with 10-fold cross-validation over a set of hyper-parameters. Here, utilized bagging as a resampling approach. Whenever the trees are adjusted to 500 as well as the number of parameters examined for each division is fixed to 22, then the best optimum model is obtained.
A Deep Neural Network (DNN) provides efficiency in a variety of machine learning and artificial intelligence scenarios. DNNs offer substantial benefits in feature extraction at multiple levels of complexity, hence learning process is more complicated as compared to conventional machine learning methods. To efficiently retrieve data input aspects, DNNs calculate their system parameters in the forward phase and then continuously modify them through back propagation [44] DNNs perform alternative approaches in applications including machine vision, computational linguistics, translation software, voice recognition, genomics, statistical trading, and auto-driving cars because of these benefits. A multilayer perceptron network comprises just two parametric layers: a hidden layer and an output layer. It is also known as an artificial neural network. The hidden layers ranged from 1 to 4, the number of hidden units per layer ranged from 10 to 100, the training error used in training ranged from 0.001 to 0.1, the range about which weight values were uniformly derived, and the number of information points used for each gradient calculation is among the hyper-parameters [45].
3 Proposed Prediction of Single and Multiple Mutation Methodology
Fig. 1 show the workflow of the proposed work. Each block explains elaborately in the following sections.
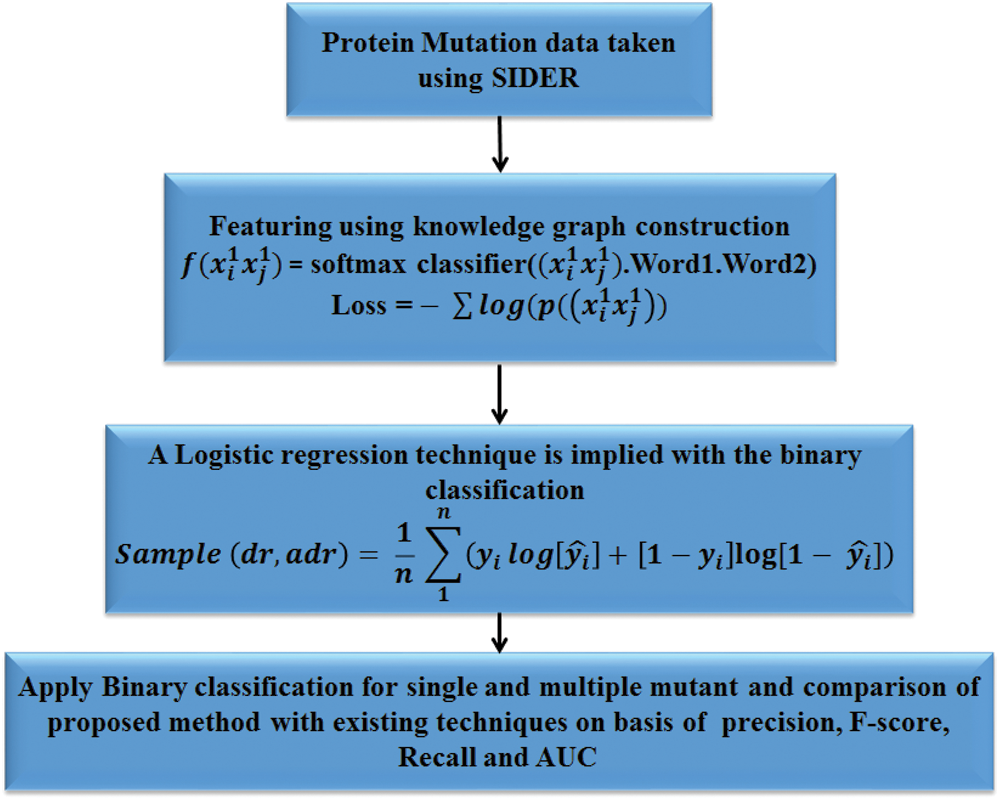
Figure 1: Workflow of the proposed method to predict the single and multiple mutant proteins
From the data sets taken, the data has been classified into one of four types name drug chemical, target protein, side effects and symptoms. Every drug will have three types of actions, either being the side effect or changes in the target protein, or an indication. The characteristics of the drug are validated by the effects of indications, structural changes over the protein or the resultant side effects. The standard data set is retrieved from the Drug Bank which has stored the target proteins and Anatomical characteristics [35,36] of the chemicals used in the drug combinations. This data set is an open-source and readily available database for drugs with the required information such as pharmacology, toxicology and overall chemical properties. There are around 13450 drugs that are approved in form of proteins, peptides, allergenic medications, and vaccines, where almost half of it is experimental. All these drugs are assigned with a unique ID and their equivalent parameters are identified with their unique IDs respectively. Another database was included to extract the information about their indications and side effects respectively. SIDER is another standard and open data set where different drug manuals are encoded to adhere to the medical dictionary of regulatory affairs [37]. This is a standard Dictionary for all medical-related drugs and also holds information about adverse drug reactions. It is estimated that nearly 5800 drugs are formed to have adverse drug reactions and nearly 14000 drugs were found to have side effects when combined with other drugs [38].
A standard method used for natural Language Processing is known as Word2Vec where different bags of words are brought into a common context to eliminate the dependency on sparseness problems. Details of the words found in different sentences are grouped based on context and word vectors are derived from the bags of words [39]. Skip-gram architectures and a continuous bag of words are the common algorithms that are used for deriving the context in a group of words. The context words are identified based on the relationship between one word and another and this can be used in a small data set without any dependencies and problems. On the other hand, when two or more data sets are combined, a matrix of words is formed and hence the skip-gram architecture for a bag of words would find it difficult for training the model built-in data science applications [40]. The word vectors are formed from different sentences based on context information and considering a neighborhood factor. It is understood that some words cannot be present in a specific combination with other words. This understanding can further be elaborated into concepts for syntactical and semantic analysis. In terms of a knowledge graph, every sentence can be classified into subject-predicate and object based on the presence of specific words. Based on this, the adverse drug reaction can be derived by a triple word syntax namely drug1, drug2, side effect, or drug1, side effect 1 and side effect 2. These three syntactical analyze will deliver how a drug may result in different Side Effects for how different combinations of drugs will result in one side effect. The model depicted in Figs. 2 and 3 illustrates the approaches in the proposed model. In feature extraction which is translating primary data into numerical elements that may be handled while keeping the information in the original data set. By using preprocessing, before using machine learning or data mining methods, make sure the original data is of good quality. These quality data are then sent into a classifier, which is a machine-learning system that assigns a class label to information. Finally, feature selection is used for limiting the input parameter into useful data and eliminating noise. The following functions (Eqs. (1) and (2)) illustrate the relationship between the knowledge graph construction methods.
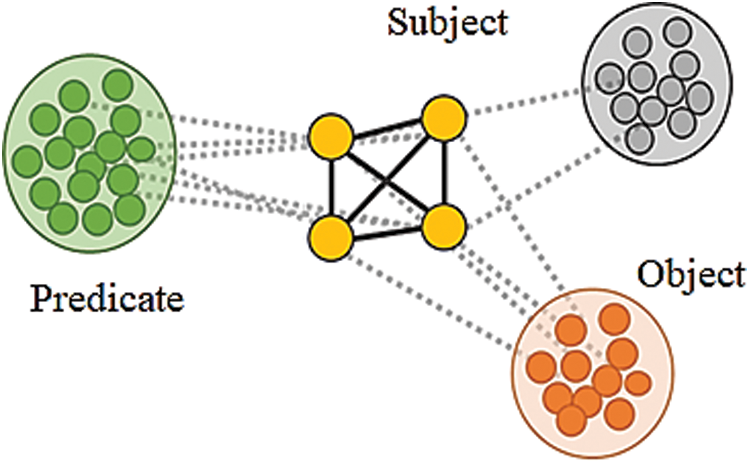
Figure 2: Context of words based on neighborhood values
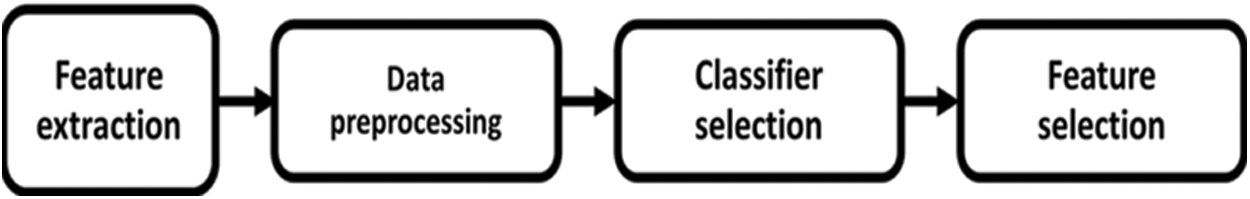
Figure 3: Model of the proposed architecture
From the derived functions, the terms

Figure 4: Layers of the proposed model for the formation of bags of words based on context
Based on the combinations of different drugs, corresponding chemical properties and protein structures, predicting an adverse reaction is furnished based on the relationship between drugs and side effects. This relationship is defined as an entity-to-entity association.
The entire model is derived into a prediction-based approach using a binary classification technique. Every drug will be evaluated based on 0 or 1, 0 indicating has no side effects and 1 indicating a side effect. This is the outcome of the binary classification technique. A Logistic regression technique is implied with the binary classification according to Fig. 3. From the survey of the literature, it is evident that Logistic regression is the most fundamental and core technique for any classification approach. This is comparatively easier and simpler to estimate the relationship between one entity and another. Every drug {i1,i2,…in} is evaluated for its association between corresponding adverse drug reaction ADR {i1,i2,…in}. The outcome of the Logistic regression model will deliver 0 or 1 based on the relationship between a drug and adverse drug reaction. Another loss function is introduced for reducing the model parameters when the data set is fed into the training model. In this Eq. (3), x indicates the sample of the drug and y indicates the classifier output where x is also the difference between drug vector and adverse drug reaction in its corresponding combination. The total number of samples is indicated by n.
Since the proposed model implements the classic approach of Word2Vec, there are two important parameters namely the number of iterations and the size of the entity vector dimensions. Every model will be trained for some iterations based on the given size of entity vectors. When the number of iterations increases, the performance and accuracy of the model are significantly increased. Various combinations of drugs and their side effects can easily be identified when the number of iterations is increased with different modalities. The feature extraction processes contemplated the model of neighborhood parameters based on the subject, predicate and object analysis for encoding the information of different entities. The minimum count of nodes to be manipulated was set to 1 when the Word2Vec model was applied, to highlight the requirement of at least one drug to find out adverse drug reactions. To understand the logic behind neighborhood characteristics, we should understand that the length of the sentence is set to a maximum of three. Gensim, a package in Python, is the package implemented for achieving the embedding essentials of knowledge graph construction. As previously said, a Logistic regression with a binary classifier is implemented for L2 regularization and the loss function is implemented to analyze the stochastic gradients. The minimum number of iterations was set to 6000 and the maximum was to 12000 iterations. The data analysis was performed using SAS tools which are considered to be a sophisticated tool for data science and Analytics. Various libraries of python sci-kit learn were implemented for portraying the results of logistic regression.
The proposed model is evaluated based on the latest data set and this is compared against the performance of other related models discussed in the literature survey. From the obtained database, nearly 3600 drugs and 4200 targets were obtained and matched with the indications available in SIDER in the data set. The classifier has been modeled to legal the indication of every drug since the indication cannot be deemed as a side effect. Every drug will be matched to its respective indication, otherwise to a side effect. When two different drugs are combined, two resultant indications will be sensed or 1 side effect may be realized. This can be considered as a negative sample of the given binary classifier, and from the overall results, it is observed that nearly 12% of a total number of drugs can be deemed to be a negative classifier. The entire data set is split into random segments with an equal number of side effects causing drugs and negative classifying drugs. The divided segments of the data set are used for testing the model and for training the classifier and knowledge graph construction, different segments of the data sets are being used.
Any data science or machine learning model has to be evaluated based on the prediction accuracy, time is taken for predictions, and overall performance. The area under the receiver operating characteristic curve commonly known as AUC (Area Under the Curve) is the standard parameter for illustrating the performance of classification accuracy. Receiver operating characteristic, known as ROC, is derived by the ratio of false-positive rates over the true positive rates, under different scenarios, input conditions, cross-fold validations and different classifications. False positives are considered to be the number of wrong predictions over the total number of positive samples. True positive (TP) is a measure of the right prediction of the right samples and both true positive and False positive (FP) will derive the overall performance of the prediction model. The standard equations of precision, recall and f score are measured using the following Eqs. (4)–(6).
The split data set has been considered as training and testing data set with 80% and 20% respectively. The adverse drug reaction prediction model based on neighborhood and binary classifier is implemented for constructing the knowledge graph. Different entities available in the two data sets are combined and derive an enhanced version of encoded information about drugs, indications, target proteins, and side effects shown in Tab. 1. Since these two data sets already consisted of the side effects, the binary classifier can be directly implemented to predict if there is a side effect or not. Different sizes of entity vectors are considered and the area under the curve for the proposed model is shown in Fig. 5.


Figure 5: Knowledge graphs embedding process
The dataset consisted of 1600 training data and 1600 testing data respectively, from the results shown above, it is evident that the proposed model has achieved an 87 percentage and the overall mean was 87%. The precision, recall and F-Score obtained for different cross-fold validations are displayed in Tab. 2 and from those results, it is clear that the proposed technique has delivered standard performance across different combinations of training and testing datasets. Fig. 6 depicts how the AUC has improved when the number of iterations has increased. General practice in machine learning and data science applications is that every model will be trained before it is deployed into its actual situation. In this case, the proposed model has been trained sequentially while the drug and side effect information was encoded into its proper standards after being retrieved from the data sets. Once this vectorized information has been passed on into the model, the Logistic regression model will start acting to determine the association between one drug, two drugs, and its corresponding side effects. Unlike other models, the proposed model has included various adverse drug reactions and the chemical properties of different rocks are considered an important parameter for this proposed methodology.
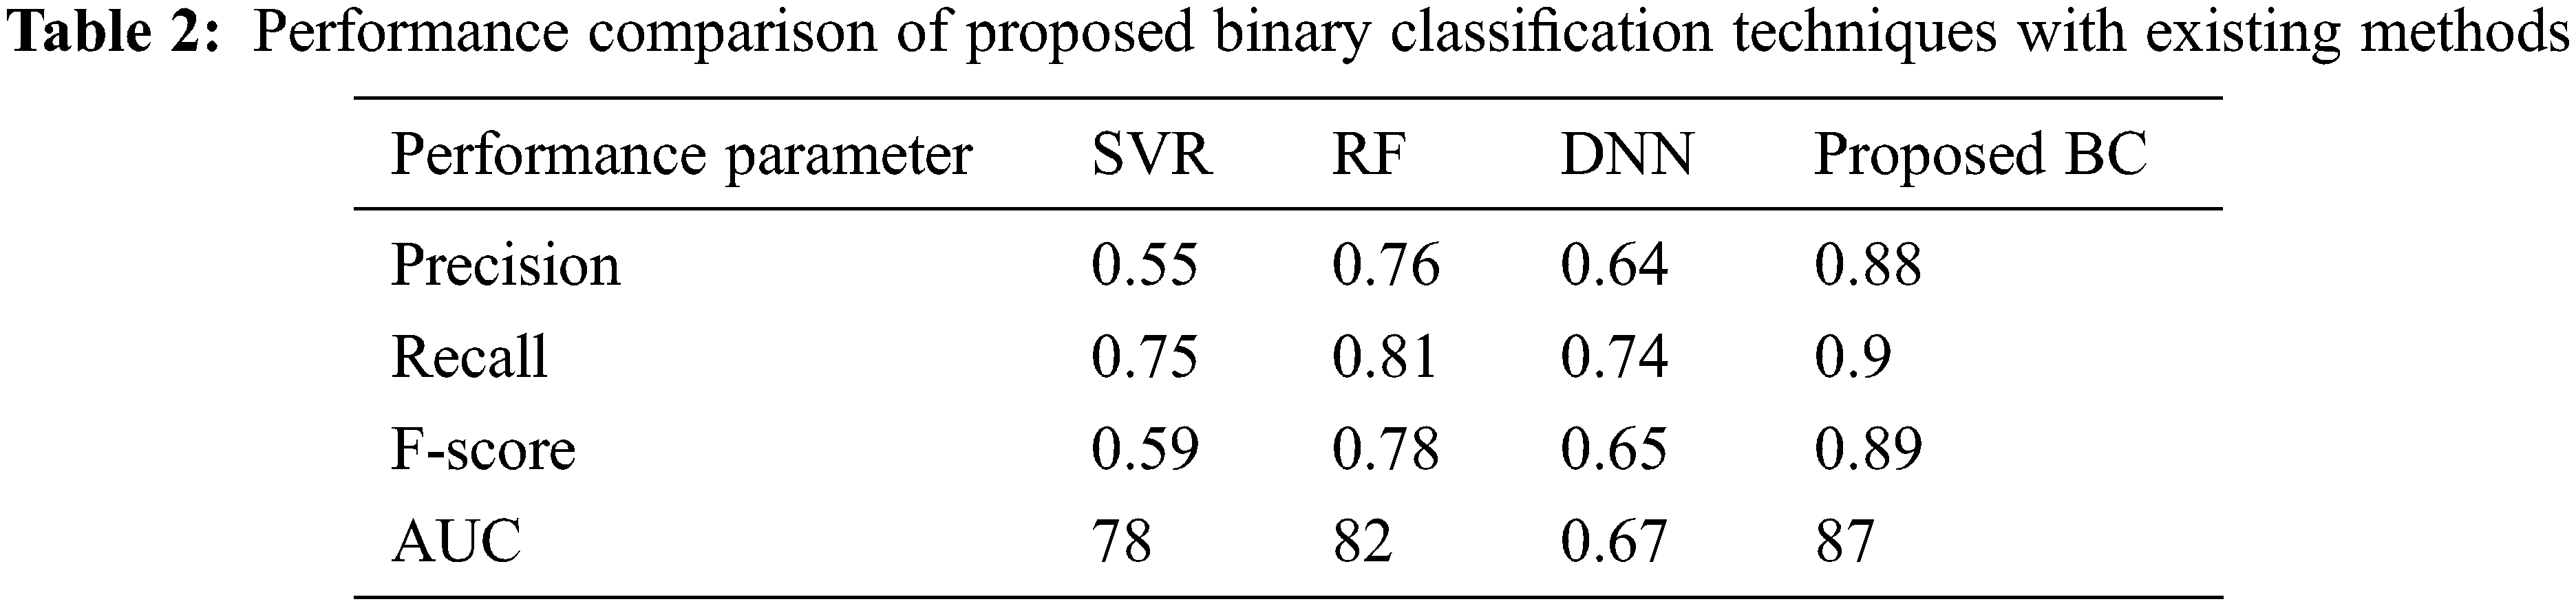

Figure 6: Different vector dimensions and iterations
The different sizes of the entity vectors impacted the performance of AUC. The proposed prediction model has shown remarkable variations based on the number of iterations, with increased iterations the performance of the model has increased as well. This gradual steep in the production quality is found to slow down after some 80 iterations. This demonstrates that the knowledge graph construction based on the information cannot be dependent on the factorization of entities and nodes. From these results, graphing of the knowledge, and embedding the information based on the association between drugs, proteins, indications and side effects are proven to be successful. From the demonstrated results it is also evident that the performance of the classifier, binary classifier, in this case, has shown significant accuracy to changes in the vector size. The area under the curve was found to be the maximum at 2500 iterations during the knowledge graph construction. The optimal parameters for the proposed model would be around 2500 to 3000 iterations and the size of vectors should be around 1000.
SVR-Support Vector Regression, RF-Random Forest, DNN-Deep Neural Network, and BC-Binary Classification as demonstrated in Tab. 2, the BC technique produced the best results, resulting in a higher AUC value, which improved the model’s performance. Furthermore, Precision, Recall, and F-score are calculated separately and compared to current approaches. The DNN is the least effective of the approaches. DNNs are best suited to issues that need a large number of training sets. Tab. 3 compares set performance to help understand the DNN’s weak generalization. The BC, on the other hand, can suit the training set very closely while still generalizing effectively to the test set. Fig. 7 shown the performance analysis of the proposed method with existing techniques.
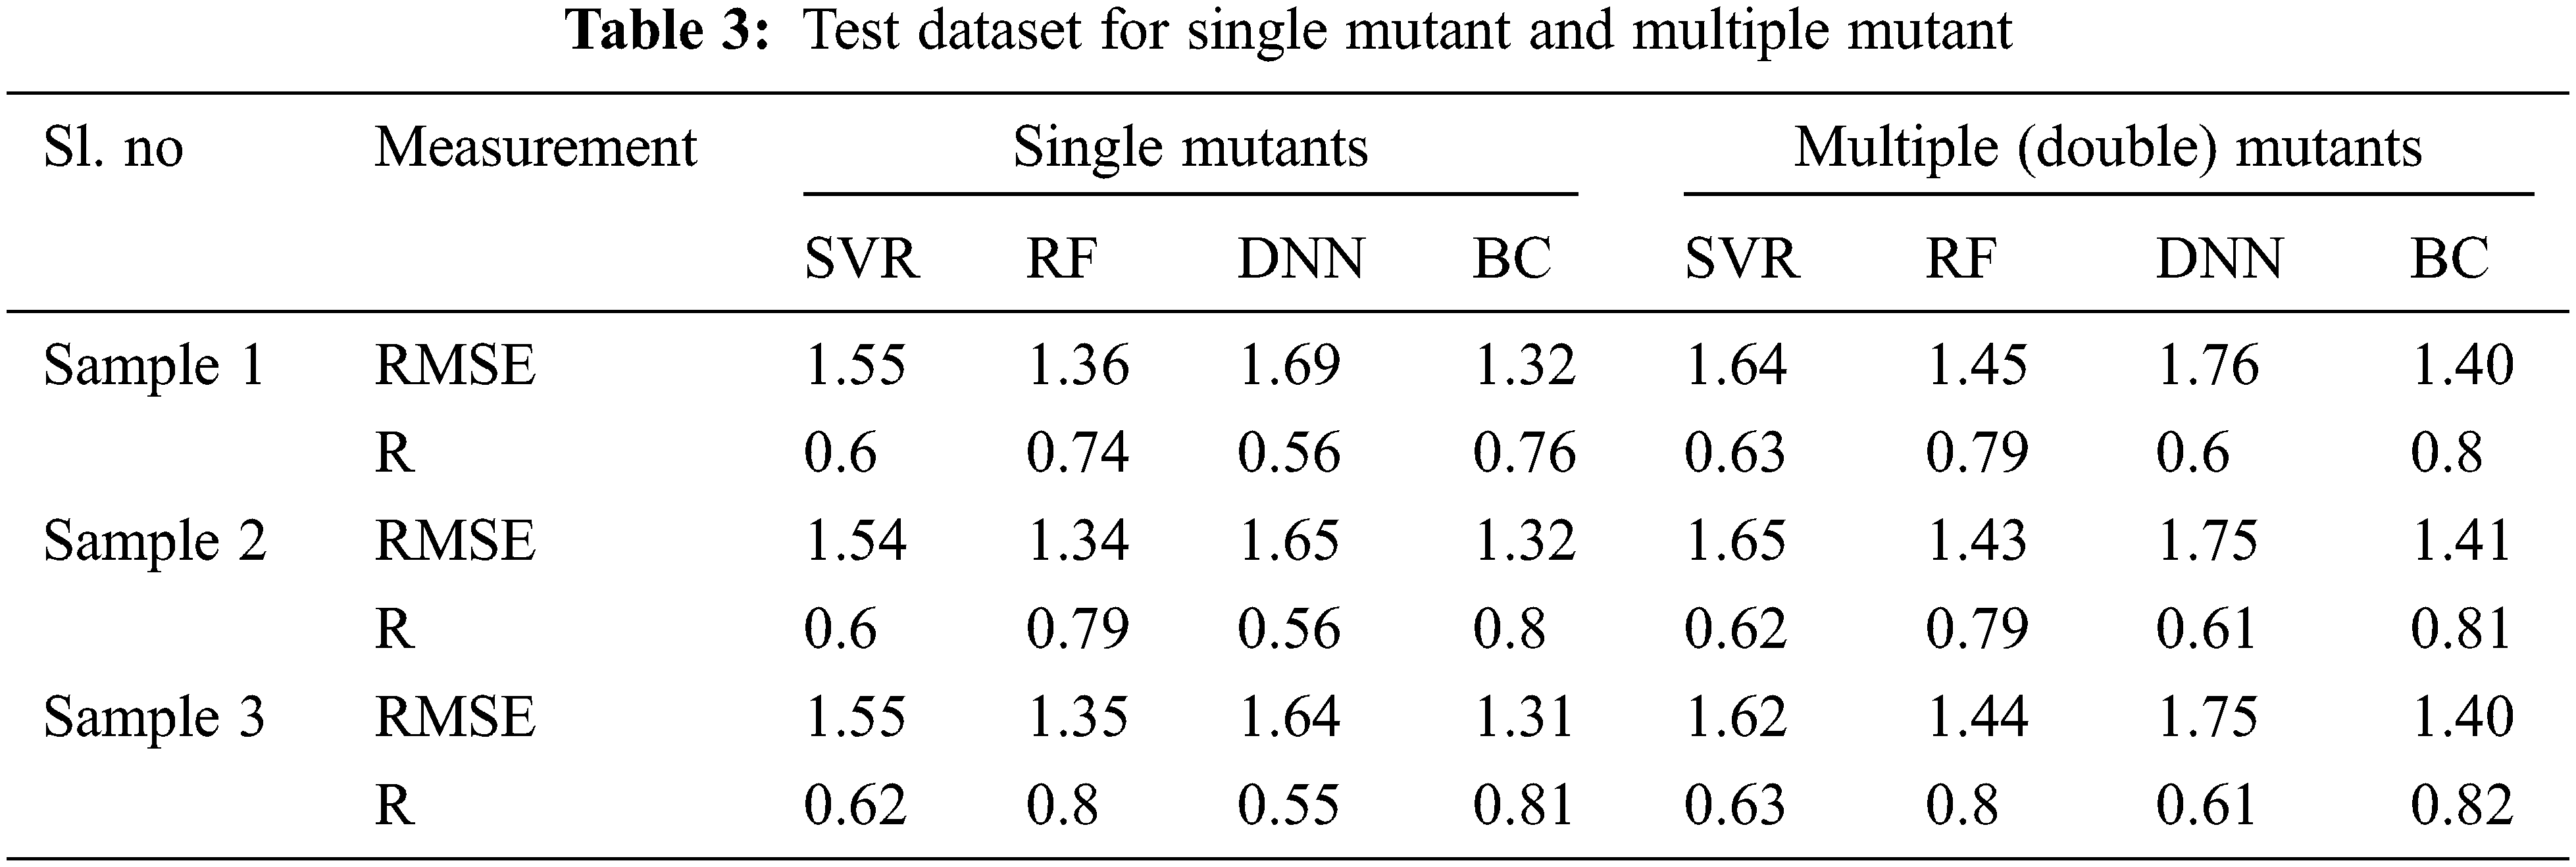

Figure 7: Performance analysis of proposed method with existing techniques
Two metrics were used to assess the prediction accuracy of the test dataset: the Root Mean Square Error (RMSE) and the Pearson correlation coefficient (R). By creating lower RMSE and a greater correlation, the BC technique produced the best results. Overall, the multiple (double) mutant data outperforms the single mutant data shown in Figs. 8a and 8b. The single mutation has the strongest correlation (0.81). Finally, when sample 3 was utilized, BC produced the greatest correlation (0.82) for double mutations.
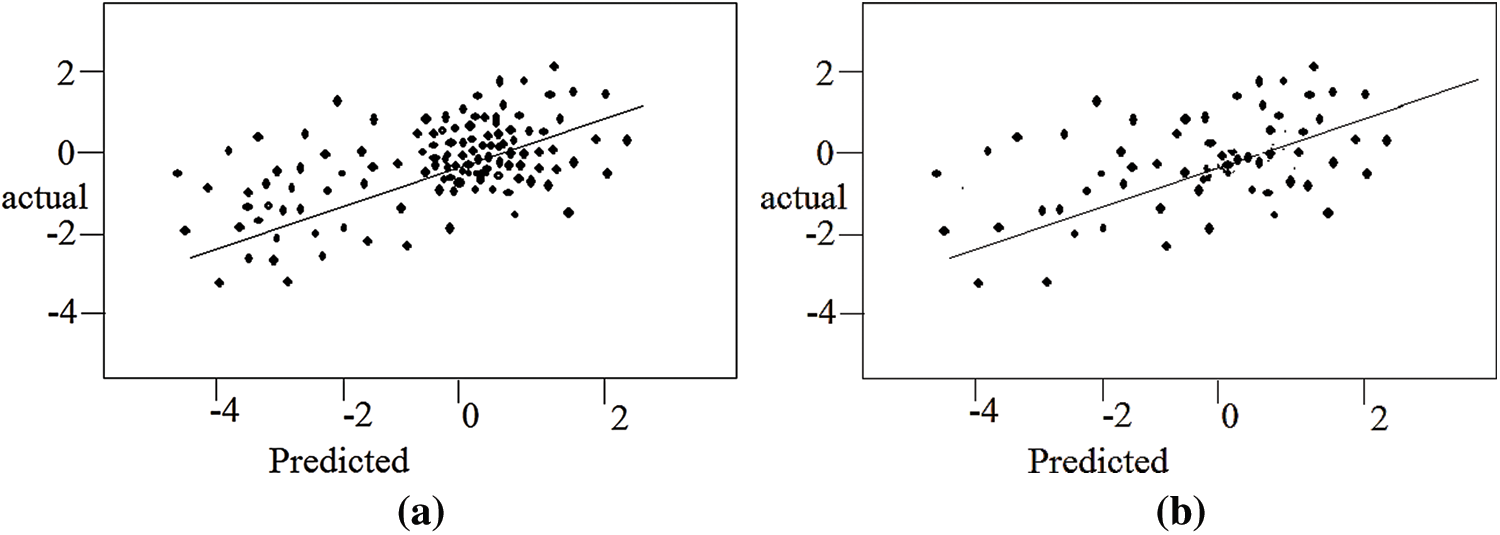
Figure 8: Test data set predicted vs. change to the free energy of unfolding actual for single and multiple mutants
This work contemplates a new method of encoding information obtained from different data sets such as Drug Bank and SIDER, transforming them into entities and nodes. The knowledge graph is then built to represent various drugs and their drug reactions. A binary classifier was used to determine the benefits of each drug’s adverse responses under various scenarios. This model was applied with a Logistic regression and a binary classification technique to identify whether the drugs are composed in terms of chemical composition, combination with different drugs, variations shown on protein structures and finally whether the drug is showing positive indication for a negative adverse drug reaction. The causal relationship between drugs and proteins is carefully depicted with the help of encoded information and knowledge embedding techniques. The proposed adverse drug reaction prediction model has proven to show significant results when compared to other similar data science and machine learning applications. The work demonstrates that the proposed approach is accurate and has a low root mean squared error (RMSE). This method may be expanded to include a variety of medicines and target proteins, resulting in a unified ADR prediction model.
Acknowledgement: The authors with a deep sense of gratitude would thank the supervisor for his guidance and constant support rendered during this research.
Funding Statement: The authors received no specific funding for this study.
Conflicts of Interest: The authors declare that they have no conflicts of interest to report regarding the present study.
References
1. J. J. Coleman and S. K. Pontefract, “Adverse drug reactions,” Clinical Medicine, vol. 16, no. 5, pp. 481, 2016. [Google Scholar]
2. R. Mulchandani and A. K. Kakkar, “Reporting of adverse drug reactions in India: A review of the current scenario, obstacles and possible solutions,” International Journal of Risk & Safety in Medicine, vol. 30, no. 1, pp. 33–44, 2019. [Google Scholar]
3. Y. Zheng, H. Peng, X. Zhang, Z. Zhao, J. Yin et al., “Predicting adverse drug reactions of combined medication from heterogeneous pharmacologic databases,” BMC Bioinformatics, vol. 19, no. 19, pp. 49–59, 2018. [Google Scholar]
4. J. J. Eaton-Rye and R. Sobotka, “Assembly of the photosystem II membrane-protein complex of oxygenic photosynthesis,” Frontiers in Plant Science, vol. 8, pp. 884, 2017. [Google Scholar]
5. M. Kulmanov, M. A. Khan and R. Hoehndorf, “Deep GO: Predicting protein functions from sequence and interactions using a deep ontology-aware classifier,” Bioinformatics, vol. 34, no. 4, pp. 660–668, 2018. [Google Scholar]
6. J. H. Watanabe, T. McInnis and J. D. Hirsch, “Cost of prescription drug-related morbidity and mortality,” Annals of Pharmacotherapy, vol. 52, no. 9, pp. 829–837, 2018. [Google Scholar]
7. S. Dey, H. Luo, A. Fokoue, J. Hu and P. Zhang, “Predicting adverse drug reactions through interpretable deep learning framework,” BMC Bioinformatics, vol. 19, no. 21, pp. 1–13, 2018. [Google Scholar]
8. E. Andersson and F. Jagodzinski, “ProMuteHT: A high throughput compute pipeline for generating protein mutants in silico,” in Proc. 8th ACM Int. Conf. on Bioinformatics, Computational Biology, and Health Informatics, Massachusetts, Boston, USA, pp. 655–660, 2017. [Google Scholar]
9. R. Farhoodi, M. Shelbourne, R. Hsieh, N. Haspel, B. Hutchinson et al., “Predicting the effect of point mutations on protein structural stability,” in Proc. 8th ACM Int. Conf. on Bioinformatics, Computational Biology, and Health Informatics, Massachusetts, Boston, USA, pp. 247–252, 2017. [Google Scholar]
10. M. Zitnik, M. Agrawal and J. Leskovec, “Modeling polypharmacy side effects with graph convolutional networks,” Bioinformatics, vol. 34, no. 13, pp. i457–i466, 2018. [Google Scholar]
11. R. Zallot, K. J. Harrison, B. Kolaczkowski and D. Crécy-Lagard, “Functional annotations of paralogs: A blessing and a curse,” Life, vol. 6, no. 3, pp. 39, 2016. [Google Scholar]
12. G. Chuai, H. Ma, J. Yan, M. Chen, N. Hong et al., “Deep CRISPR: Optimized CRISPR guide RNA design by deep learning,” Genome Biology, vol. 19, no. 1, pp. 1–18, 2018. [Google Scholar]
13. P. Dhamija, S. Kalra, P. K. Sharma, V. Kalaiselvan, A. Muruganathan et al., “Indian college of physicians (ICP) position statement on pharmacovigilance,” Journal of the Association of Physicians of India, vol. 65, pp. 63–66, 2017. [Google Scholar]
14. L. Zhu, S. P. Deng, Z. H. You and D. S. Huang, “Identifying spurious interactions in the protein-protein interaction networks using local similarity preserving embedding,” IEEE/ACM Transactions on Computational Biology and Bioinformatics, vol. 14, no. 2, pp. 345–352, 2015. [Google Scholar]
15. B. Liu, K. Li, D. S. Huang and K. C. Chou, “iEnhancer-EL: Identifying enhancers and their strength with ensemble learning approach,” Bioinformatics, vol. 34, no. 22, pp. 3835–3842, 2018. [Google Scholar]
16. S. Alexander, B. T. Fisher, A. H. Gaur, C. C. Dvorak, D. V. Luna et al., “Effect of levofloxacin prophylaxis on bacteremia in children with acute leukemia or undergoing hematopoietic stem cell transplantation: A randomized clinical trial,” JAMA, vol. 320, no. 10, pp. 995–1004, 2018. [Google Scholar]
17. L. F. Iannone, L. Bennardo, C. Palleria, R. Roberti, C. De Sarro et al., “Safety profile of biologic drugs for psoriasis in clinical practice: An Italian prospective pharmacovigilance study,” PLoS One, vol. 15, no. 11, pp. e0241575, 2020. [Google Scholar]
18. J. Lindsay, M. K. Yong, M. Greenwood, D. C. Kong, S. C. Chen et al., “Epstein-Barr virus related post-transplant lymphoproliferative disorder prevention strategies in allogeneic hematopoietic stem cell transplantation,” Reviews in Medical Virology, vol. 30, no. 4, pp. e2108, 2020. [Google Scholar]
19. A. Makis, Z. Kanta, D. Kalogeropoulos and N. Chaliasos, “Anti-CD20 treatment of autoimmune hemolytic anemia refractory to corticosteroids and azathioprine: A pediatric case report and mini review,” Case Reports in Hematology, vol. 2018, no. 1, pp. 1–7, 2018. [Google Scholar]
20. M. Y. Ho, F. Gan, G. Shen and D. A. Bryant, “Far-red light photo acclimation (FaRLiP) in Synechococcus sp. PCC 7335. II. Characterization of phycobiliproteins produced during acclimation to far-red light,” Photosynthesis Research, vol. 131, no. 2, pp. 187–202, 2017. [Google Scholar]
21. A. Mascolo, C. Scavone, M. Bertini, S. Brusco, F. Punzo et al., “Safety of anticancer agents used in children: A focus on their off-label use through data from the spontaneous reporting system,” Frontiers in Pharmacology, vol. 11, pp. 621, 2020. [Google Scholar]
22. E. Jeong, N. Park, Y. Choi, R. W. Park and D. Yoon, “Correction: Machine learning model combining features from algorithms with different analytical methodologies to detect laboratory-event-related adverse drug reaction signals,” PLoS One, vol. 14, no. 4, pp. e0215344, 2019. [Google Scholar]
23. B. Hu, H. Wang, L. Wang and W. Yuan, “Adverse drug reaction predictions using stacking deep heterogeneous information network embedding approach,” Molecules, vol. 23, no. 12, pp. 3193, 2018. [Google Scholar]
24. Z. Zhao, J. Shen, C. Shen, B. Zhu, J. Sun et al., “An investigation of pharmacovigilance and reporting of adverse drug reactions in hospitals: A cross-sectional study in China,” Current Medical Research and Opinion, vol. 37, no. 11, pp. 2001–2006, 2021. [Google Scholar]
25. D. Formica, J. Sultana, P. M. Cutroneo, S. Lucchesi, R. Angelica et al., “The economic burden of preventable adverse drug reactions: A systematic review of observational studies,” Expert Opinion on Drug Safety, vol. 17, no. 7, pp. 681–695, 2018. [Google Scholar]
26. T. T. Le, T. T. H. Nguyen, C. Nguyen, N. H. Tran, L. A. Tran et al., “Factors associated with spontaneous adverse drug reaction reporting among healthcare professionals in Vietnam,” Journal of Clinical Pharmacy and Therapeutics, vol. 45, no. 1, pp. 122–127, 2020. [Google Scholar]
27. A. Zimmermann, A. Flis, A. Gaworska-Krzemińska and M. N. Cohen, “Drug-safety reporting in polish nursing practice—Cross sectional surveys,” PLoS One, vol. 15, no. 10, pp. e0241377, 2020. [Google Scholar]
28. M. Alomar, A. M. Tawfiq, N. Hassan and S. Palaian, “Post marketing surveillance of suspected adverse drug reactions through spontaneous reporting: Current status, challenges and the future,” Therapeutic Advances in Drug Safety, vol. 11, pp. 1–11, 2020. [Google Scholar]
29. M. Stanislav, “Predicting protein stability and solubility changes upon mutations: Data perspective,” ChemCatChem, vol. 12, no. 22, pp. 5590–5598, 2020. [Google Scholar]
30. H. Abu-Sbeih, C. N. Tran, S. G. Phillip, M. S. Bhutani, M. Alasadi et al., “Case series of cancer patients who developed cholecystitis related to immune checkpoint inhibitor treatment,” Journal for Immunotherapy of Cancer, vol. 7, no. 1, pp. 1–8, 2019. [Google Scholar]
31. S. Liu, B. Tang, Q. Chen and X. Wang, “Effects of semantic features on machine learning-based drug name recognition systems: Word embeddings vs. manually constructed dictionaries,” Information, vol. 6, no. 4, pp. 848–865, 2015. [Google Scholar]
32. T. Chen and C. Guestrin, “Xgboost: A scalable tree boosting system,” in Proc. 22nd ACM Sigkdd Int. Conf. on Knowledge Discovery and Data Mining, California, San Francisco, USA, pp. 785–794, 2016. [Google Scholar]
33. D. Hand and P. Christen, “A note on using the F-measure for evaluating record linkage algorithms,” Statistics and Computing, vol. 28, no. 3, pp. 539–547, 2018. [Google Scholar]
34. G. Workalemahu, O. A. Abdela and M. K. Yenit, “Chemotherapy-related adverse drug reaction and associated factors among hospitalized paediatric cancer patients at hospitals in north-west ethiopia,” Drug Healthcare and Patient Safety, vol. 12, pp. 195, 2020. [Google Scholar]
35. Y. Zhao, Z. S. Y. Wong and K. L. Tsui, “A framework of rebalancing imbalanced healthcare data for rare events’ classification: A case of look-alike sound-alike mix-up incident detection,” Journal of Healthcare Engineering, vol. 2018, pp. 1–11, 2018. [Google Scholar]
36. G. Ke, Q. Meng, T. Finley, T. Wang, W. Chen et al., “Lightgbm: A highly efficient gradient boosting decision tree,” in Proc. 31st Int. Conf. on Neural Information Processing Systems, Long Beach, CA, USA, pp. 3149–3157, 2017. [Google Scholar]
37. J. Portanova, N. Murray, J. Mower, D. Subramanian and T. Cohen, “Aer2vec: Distributed representations of adverse event reporting system data as a means to identify drug/side-effect associations,” in Proc. AMIA Annual Symp., Washington, DC, pp. 717–726, 2019. [Google Scholar]
38. R. Ietswaart, B. M. Gyori, J. A. Bachman, P. K. Sorger and L. S. Churchman, “GeneWalk identifies relevant gene functions for a biological context using network representation learning,” Genome Biology, vol. 22, no. 1, pp. 1–35, 2021. [Google Scholar]
39. Y. Y. Zhang, Q. S. Yang, X. Qing, B. R. Li, J. Qian et al., “Peg-asparaginase-associated pancreatitis in chemotherapy-treated pediatric patients: A 5-year retrospective study,” Frontiers in Oncology, vol. 10, pp. 74, 2020. [Google Scholar]
40. S. Farahmand, T. Riley and K. Zarringhalam, “ModEx: A text mining system for extracting mode of regulation of transcription factor-gene regulatory interaction,” Journal of Biomedical Informatics, vol. 102, no. 1, pp. 103353, 2020. [Google Scholar]
41. S. Romero-Molina, Y. B. Ruiz-Blanco, M. Harms, J. Münch and E. Sanchez-Garcia, “PPI-detect: A support vector machine model for sequence based prediction of protein-protein interactions,” Journal of Computational Chemistry, vol. 40, no. 11, pp. 1233–1242, 2019. [Google Scholar]
42. C. C. Chang, “LIBSVM: A library for support vector machines,” ACM Transactions on Intelligent Systems and Technology, vol. 2, no. 27, pp. 1–27, 2011. [Google Scholar]
43. A. Liaw and M. Wiener, “Classification and regression by random forest,” R News, vol. 2, no. 3, pp. 18–22, 2002. [Google Scholar]
44. D. P. Kingma and J. Ba, “Adam: A method for stochastic optimization,” arXiv preprint arXiv:1412.6980, 2014. [Google Scholar]
45. K. Arulkumaran, M. P. Deisenroth, M. Brundage and A. A. Bharath, “Deep reinforcement learning: A brief survey,” IEEE Signal Processing Magazine, vol. 34, no. 6, pp. 26–38, 2017. [Google Scholar]
Cite This Article
 Copyright © 2023 The Author(s). Published by Tech Science Press.
This work is licensed under a Creative Commons Attribution 4.0 International License , which permits unrestricted use, distribution, and reproduction in any medium, provided the original work is properly cited.
 Downloads
 Citation Tools