
 Submit a Paper
 Propose a Special lssue
 Open Access
ARTICLE
Machine Learning-Based Models for Magnetic Resonance Imaging (MRI)-Based Brain Tumor Classification
1 Department of Radiological Sciences, College of Applied Medical Sciences, Najran University, Najran, Saudi Arabia
2 Department of Computer Science, City University of Science and Information Technology, Peshawar, Pakistan
3 Department of Electrical Engineering, University of Engineering and Technology, Mardan, 23200, Pakistan
4 Department of Computer Science Engineering, University of Engineering and Technology, Mardan, 23200, Pakistan
5 Electrical Engineering Department, College of Engineering, Najran University Saudi Arabia, Najran, 61441, Saudi Arabia
* Corresponding Author: Fazal Muhammad. Email:
Intelligent Automation & Soft Computing 2023, 36(1), 299-312. https://doi.org/10.32604/iasc.2023.032426
Received 17 May 2022; Accepted 22 June 2022; Issue published 29 September 2022
 View Full Text
 Download PDF
Abstract
In the medical profession, recent technological advancements play an essential role in the early detection and categorization of many diseases that cause mortality. The technique rising on daily basis for detecting illness in magnetic resonance through pictures is the inspection of humans. Automatic (computerized) illness detection in medical imaging has found you the emergent region in several medical diagnostic applications. Various diseases that cause death need to be identified through such techniques and technologies to overcome the mortality ratio. The brain tumor is one of the most common causes of death. Researchers have already proposed various models for the classification and detection of tumors, each with its strengths and weaknesses, but there is still a need to improve the classification process with improved efficiency. However, in this study, we give an in-depth analysis of six distinct machine learning (ML) algorithms, including Random Forest (RF), Naïve Bayes (NB), Neural Networks (NN), CN2 Rule Induction (CN2), Support Vector Machine (SVM), and Decision Tree (Tree), to address this gap in improving accuracy. On the Kaggle dataset, these strategies are tested using classification accuracy, the area under the Receiver Operating Characteristic (ROC) curve, precision, recall, and F1 Score (F1). The training and testing process is strengthened by using a 10-fold cross-validation technique. The results show that SVM outperforms other algorithms, with 95.3% accuracy.Keywords
The death rate is increasing daily for various reasons, and brain tumors are one of the most common causes of death. The 10th biggest cause of mortality is brain tumors and other nervous system cancers. According to the World Health Organization (WHO), around 4 million individuals worldwide are affected by brain tumors, with 1.2 million deaths resulting from them in the previous few years [1]. Brian's tumor causes due to the excessive growth of cells in the human brain. It is different between the gender and age groups [2,3]. Brain Tumor is categorized into two main types Benign and Malignant [4]. Benign is a mass of cells that grows slowly in the brain while malignant grow faster and destructively assaults the surrounding tissues [5]. Brain tumor detection is a very difficult and complicated task due to the shape, size, type, and location of the tumor in the brain [6]. However, it is very important to detect the brain tumor in its early stage, which can be done through various methods such as biopsies Magnetic Resonance Imaging (MRI), etc. MRI is mostly used for brain tumor detection [5]. The tumor is detected by MRI by measuring the contrast of white and black intensity. The white block or pattern with a bright white in the images shows the tumor. There is also some part of the brain that may have the same intensity as tumor cells. Here, misdiagnosis may occur in classifying the MRI as benign or malignant, which led to a situation that depends in their procedure on the surgical methods and biopsies. Therefore, it is very important to differentiate the tumor from the other part of the brain [1,5]. Fig. 1 Show the two MRI taken from healthy brain and tumor effected brain.
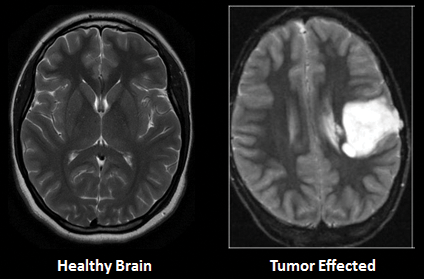
Figure 1: MRI of healthy and tumor affected brain
However, this study focuses on the classification of MRI as benign and malignant. Researchers have praised the efficiency of MRI and machine learning (ML) in the diagnosis and classification of various diseases in previous studies. To this end, we explore the efficiency of different ML techniques for the detection of brain tumors. In this study, we analyze six ML techniques namely, CN2 Rule Induction (CN2), Neural Network (NN), Naïve Bayes (NB), Random Forest (RF), Support Vector Machine (SVM), and Tree to find out the best technique for accurate detection of a brain tumor on the dataset taken from Kaggle repository. These techniques were evaluated using different assessment measures including Area Under receiver operating characteristic Curve (AUC), Classification Accuracy (CA), F1 Score (F1), precision, and recall.
The rest of the paper is organized as follows. Section 2 critically reviews eminent classification techniques. Section 3 details the experimental setup, while Section 4 includes results and discussion. Finally, Section 5 concluded this study and provides recommendations for the most effective technique.
Various research on brain tumor detection and classification have been undertaken. In all these studies, researchers have used different techniques and datasets. Some have used the data from healthcare organizations, while some have collected the data from online repositories. Some related work is briefly discussed in the following:
The researchers in [7] have utilized the K-mean algorithm for color-based segmentation for brain tumor detection. They converted the grayscale images into color-space images. While [8] used MRI for brain tumor detection. They mentioned the complexity of classifying images based on the variation in tumor shapes. Abbas et al. [3] also used K-mean for automatic brain tumor detection. They have used a 3d brain tumor dataset [9]. They evaluated the proposed model using different assessment criteria including AUC, Dice Score (DS), precision, and Jaccard Score (JS). According to the author’s analysis, the proposed model has achieved 89 percent outcomes for AUC and 0.95 for DS. Rama Raju et al. [5] proposed Convolution Neural Network (CNN) for brain tumor detection. They have utilized the Brain Tumor Segmentation (BRATS) dataset containing binary classes one of brain tumor affected and one of non-tumor affected. In this dataset, there are 187 MRI images of patients containing brain tumors and 30 MRI images that have no brain tumor. The authors have compared the outcome of CNN with SVM, K-nearest Neighbor (KNN), Multilayer Perceptron (MLP), Linear Regression (LR), NB, and RF. The outcomes were evaluated using sensitivity, precision, specificity, and accuracy. According to their analysis, CNN achieved better accuracy of 97.87 percent. Another study has been conducted using Deep Neural Network by [6]. They collected the MRI images from 153 patients including normal patients and brain tumor patients. The collected MRI images contained 80 images of healthy patients including 1321 images in which they used 56 images for testing and 515 images for training. Moreover, the rest of the 73 are brain tumor patients where they have collected 571 images of which 170 are used for testing and 1151 images used for training. Amin et al. [2] used statistical and ML methods for brain tumor detection. In their study they have used SVM, Decision Tree (DT), KNN, RF, and Ensemble classifiers on two different datasets BRATS 2013 and BRATS 2015. For performance evaluation, Peak Single to Noise Ratio (PSNR), Mean Squared Error (MSE), Structured Similarity Indexed (SSIM), specificity, sensitivity, AUC, DS, and accuracy are used. The concluded outcome shows the better performance of CNN with an accuracy of 91 percent. G. Hemanth et, al. utilized various ML algorithms namely CNN, Genetic Algorithm (GA), SVM, and Conditional Random Field (CRF) on the UCI dataset for brain tumor detection. The outcome achieved via each technique was evaluated using recall, sensitivity, precision, F1, specificity, Probability of the Misclassification Error (PME), and accuracy. They have recommended CNN with an outcome accuracy of 91%. Another study by [6] also proposed CNN for brain tumor detection. They have achieved an accuracy of 96.08 percent using the proposed model. However, Irsheidat et al. [8] proposed Artificial Convolution Neural Network (ACNN). They have done their experiments on the Kaggle dataset containing 253 MRI images. Of these 253 images, 155 patients have brain tumors while the rest 98 of those patients do not have brain tumors. According to their analysis, ACNN achieved an accuracy of 96.7 percent on invalidation data and up to 88.25 percent on test data. Brain tumor detection using a fusion of hand-crafted and deep learning features is done by [1]. They have used two datasets including BRATS 2015 and BRATS 2017 on six ML techniques namely DT, LR, KNN, Linear Discriminant Analysis (LDA), SVM, and ensemble classifier. All the employed techniques were evaluated using accuracy, sensitivity, specificity, Dice Similarity Coefficient (DSC), and Jaccard. Various techniques and datasets have been used by many researchers in the past studies with multiple evaluation measures. The summary each technique and evaluating criteria are shown in Figs. 2 and 3 respectively. Fig. 2 presents the count of each technique discussed in the related work while Fig. 3 presents the count of each evaluation criteria.
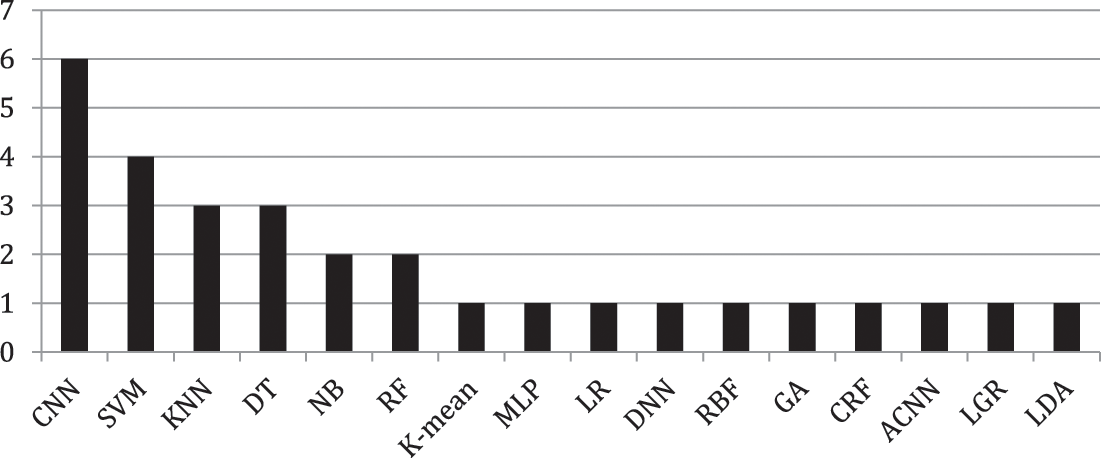
Figure 2: Count of each technique discussed in literature
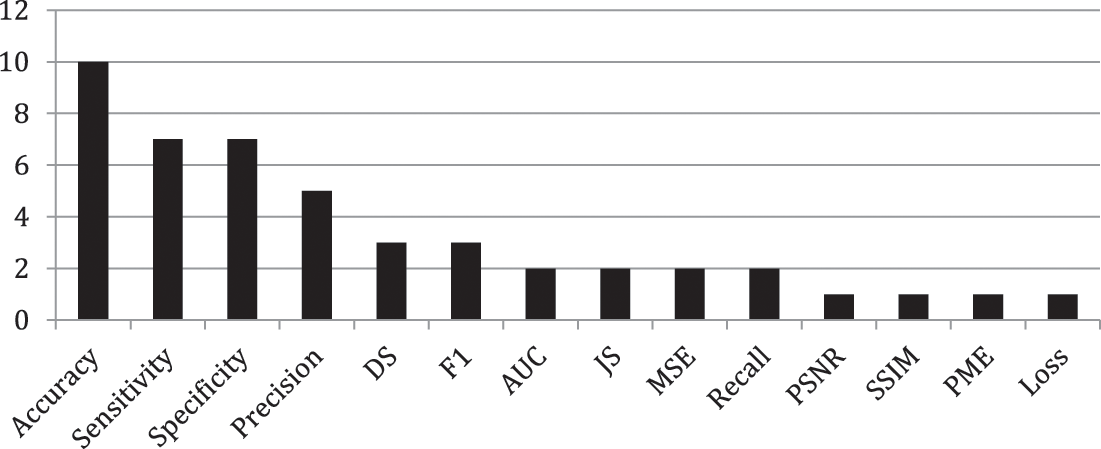
Figure 3: Count of each assessment measure
The main focus of this research is to propose a better model for brain tumor classification as compared with the aforementioned model discussed in the literature. All the experiments are performed on Orange3-3.27.1-Miniconda-x86_64, Window 10 operating with 64bit, and a machine with core i5 processor and 12 GB random access memory. The detailed setup for this research is shown in Fig. 4 which is further explained in the subsequent.
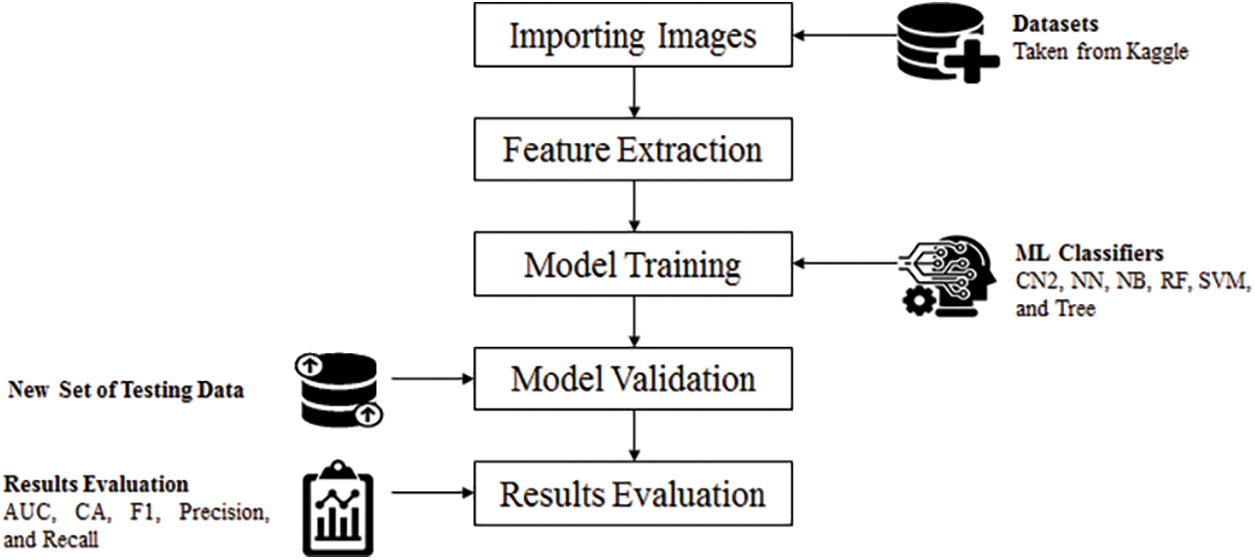
Figure 4: Experimental setup
The dataset used in this research was taken from Kaggle1. There are a total of 253 MRI images in the dataset, with 98 of them being from healthy patients and the remaining 155 being from patients with brain tumors. A sample of healthy and brain tumor-affected MRI images is shown in Fig. 5. From 253 MRI images, a total of 2048 feature were extracted while the total numbers of variables used are 2054. The extra six features are category, image name, image path, size, width, and height. These six features do not play an important role in detection but provide information about each MRI image.
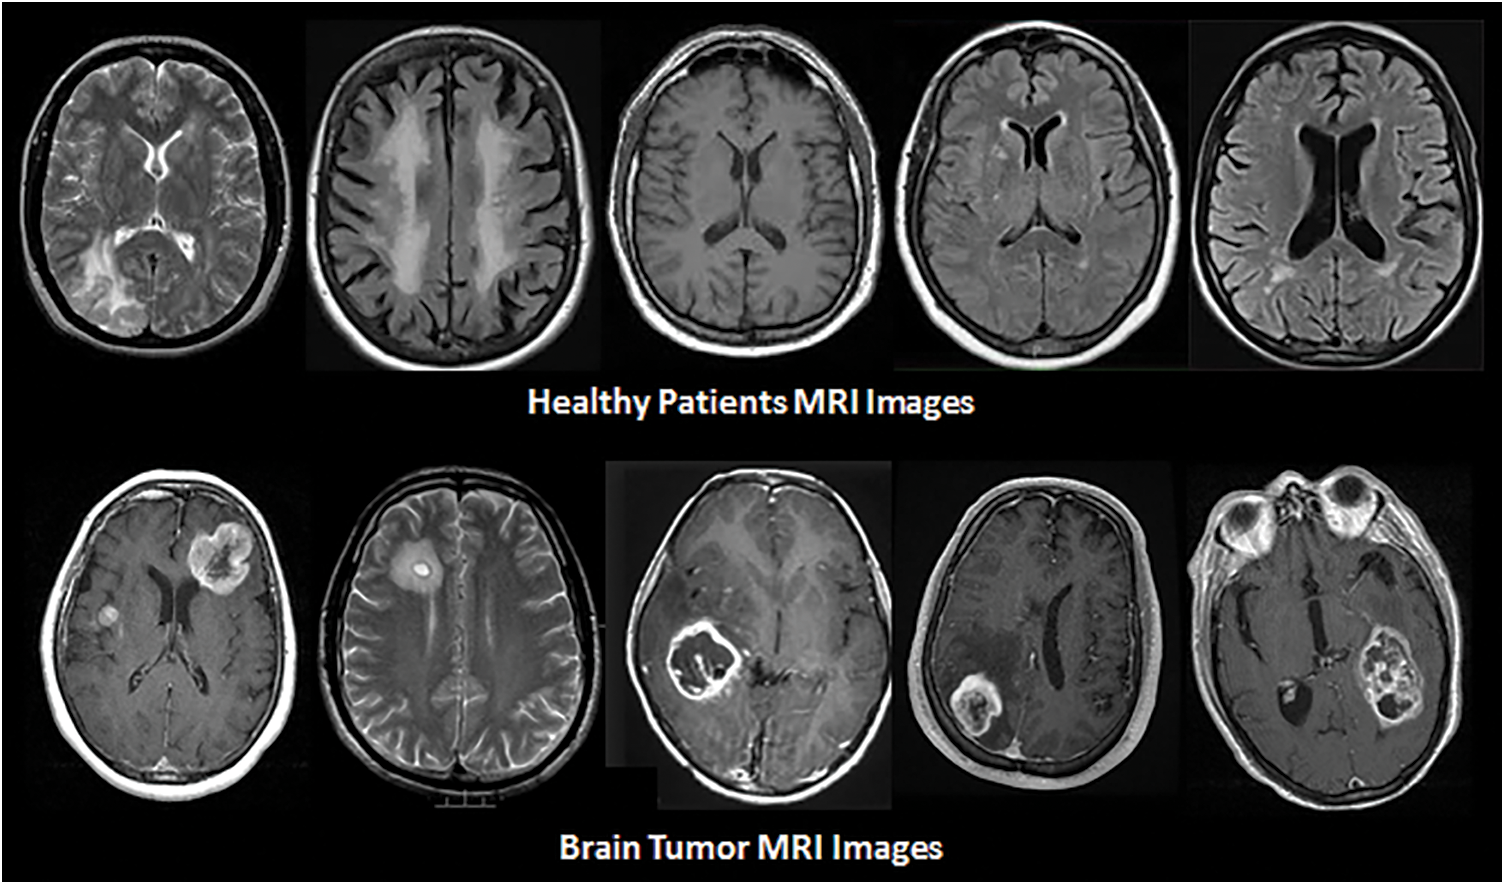
Figure 5: Samples of MRI images in dataset
We perform a 10-fold cross-validation to assess the efficiency of each of the aforementioned techniques, where the dataset is split into 10 equal subsets. Nine subsets are used as training sets, whereas on left are used for testing [10,11].
This subsection provides information related to the performance assessment measures used in this work. The assessment measures included are AUC, CA, precision, recall, and F1.
AUC provides an aggregate measure of performance across all possible classification thresholds, while CA points to that how much the forecast is accurate [12] and can be calculated as:
where TP represents the true positive, FP represents the false positive, TN represents the true negative, and FN represents the false negative.
Precision and Recall are useful for measuring the success of a predictor in unbalanced classes. Precision is the measure of relevancy in the results and recall is the measure of truly relevant returned results [13],
F1 computes the predictor accuracy by taking a weighted harmonic mean of precision and recall as [14],
This study focuses on six different ML techniques that are briefly discussed in subsequent.
A. CN2 Rule Induction
CN2 is a learning algorithm essentially designed to work when the training data is inadequate. CN2 is based on the idea from ID3 and algorithm quasi-optimal (AQ) that creates rules set like AQ and handles noisy data like ID3 [15]. The parameters for CN2 used are evaluation measure that is entropy, the beam width is 5. Rule filtering is used as minimum rule coverage is 1 while maximum rule length used is 5.
B. Neural Networks
ANNs are a data processing system that simulates and resembles the way natural neural networks do to humans or an organism. These elements relate to each other through a network of balanced links. The artificial neural network is an adaptive system, changing its structure based on the information through which it passes through the so-called learning stage [16,17]. The total number of neurons used in the hidden layer was 100. The activation function used is ReLu, regularization (α) is 0.0001, and the maximum number of iterations used is 200.
C. Naïve Bayes
NB is a probabilistic model mostly used for the identification and classification of different diseases [18]. It works based on the Bayes theorem with eccentricity possibilities among the prognosticators. NB methods are particularly modest to hypothesis and can be executed for large data sets [10,12].
D. Random Forest
RF is an easy and flexible algorithm that produces better results utmost of the time, even without hyper-parameter tuning. It is always a widely used algorithm due to its diversity and simplicity [19,20]. The basic properties include the number of trees that is 10, the number of attributes considered at each depth is 5, and if the number of the subset is smaller than 5, then do not split the subset furthermore.
E. Support Vector Machine
It is a supervised ML model used for both regression and classification. It is a leading edge that best separates the binary classes using hyperplane [21,22]. The cost value for SVM is 1.00 while the regression loss epsilon is 0.10. The Kernel function used is the radial basis function (RBF). Optimization parameters include numerical tolerance that is 0.0010 and the number of iterations that is 100.
F. Decision Tree ID3 (Tree)
A Decision Tree is a supervised ML algorithm that is used for both regression and classification problems [23,24]. Here, the minimum number of instances in leaves is 2, while the maximum limit in the depth is 100. The smaller number of subsets after that splitting is not allowed is 5.
This section presents the simulation results obtained using the aforementioned techniques discussed in Subsection 3.4. Tab. 1 detail the confusion matrix (CM) achieved via each technique. CM presents that there is a binary classification for the brain tumor that is “Yes” or “No”. CA, precision, recall, and F1 are obtained from CM where the columns represent the predicted classes and rows presents the actual classes. However, Tab. 2 shows the results achieved through F1, precision, and recall. The analysis shows the better performance of SVM as compared with the rest of the employed techniques achieving the outcome of 0.906 for F1, 0.907 for precision, and 0.907 for recall as well. Fig. 6 depicts the performance analysis obtained using recall, F1, and precision.
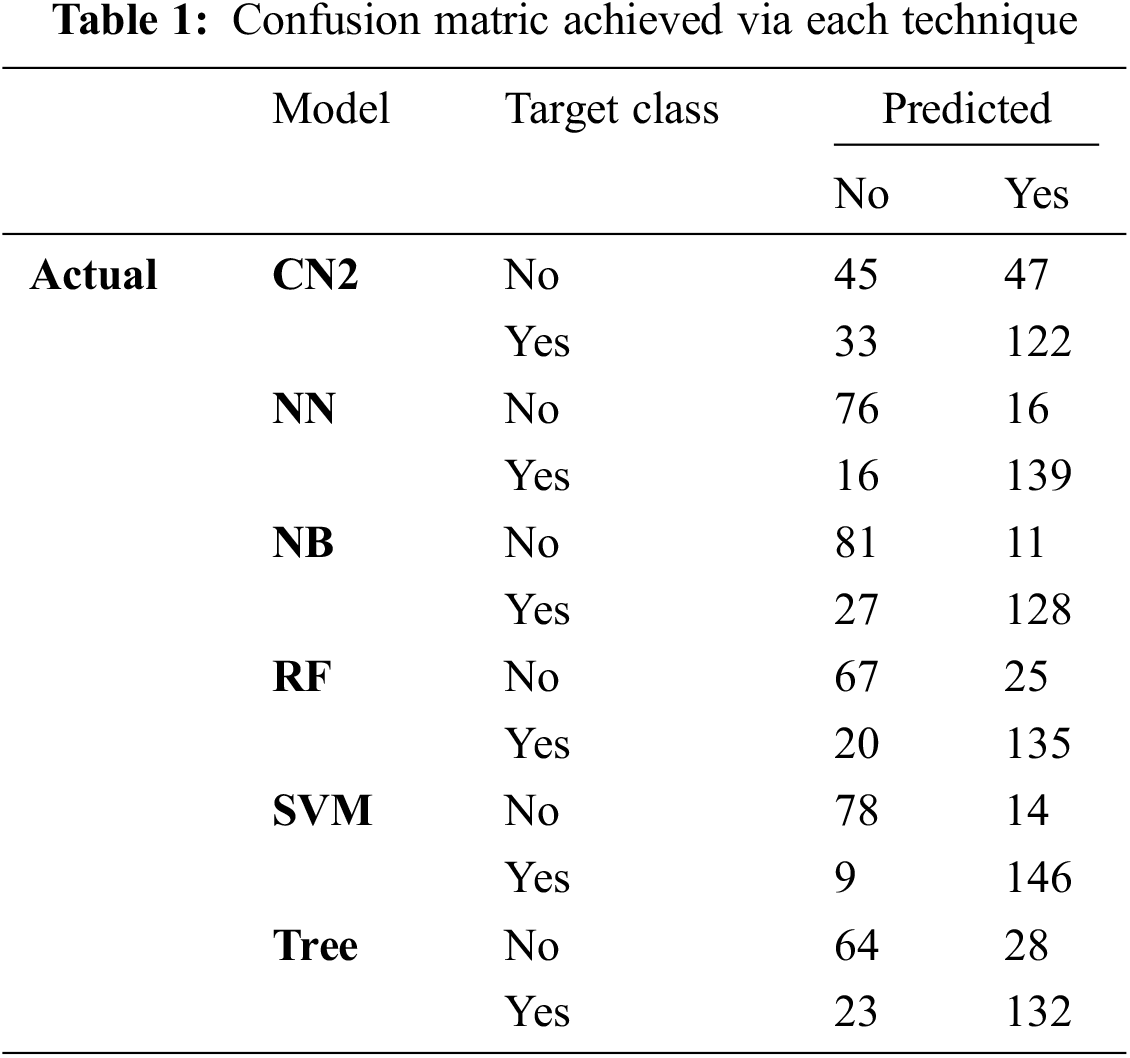
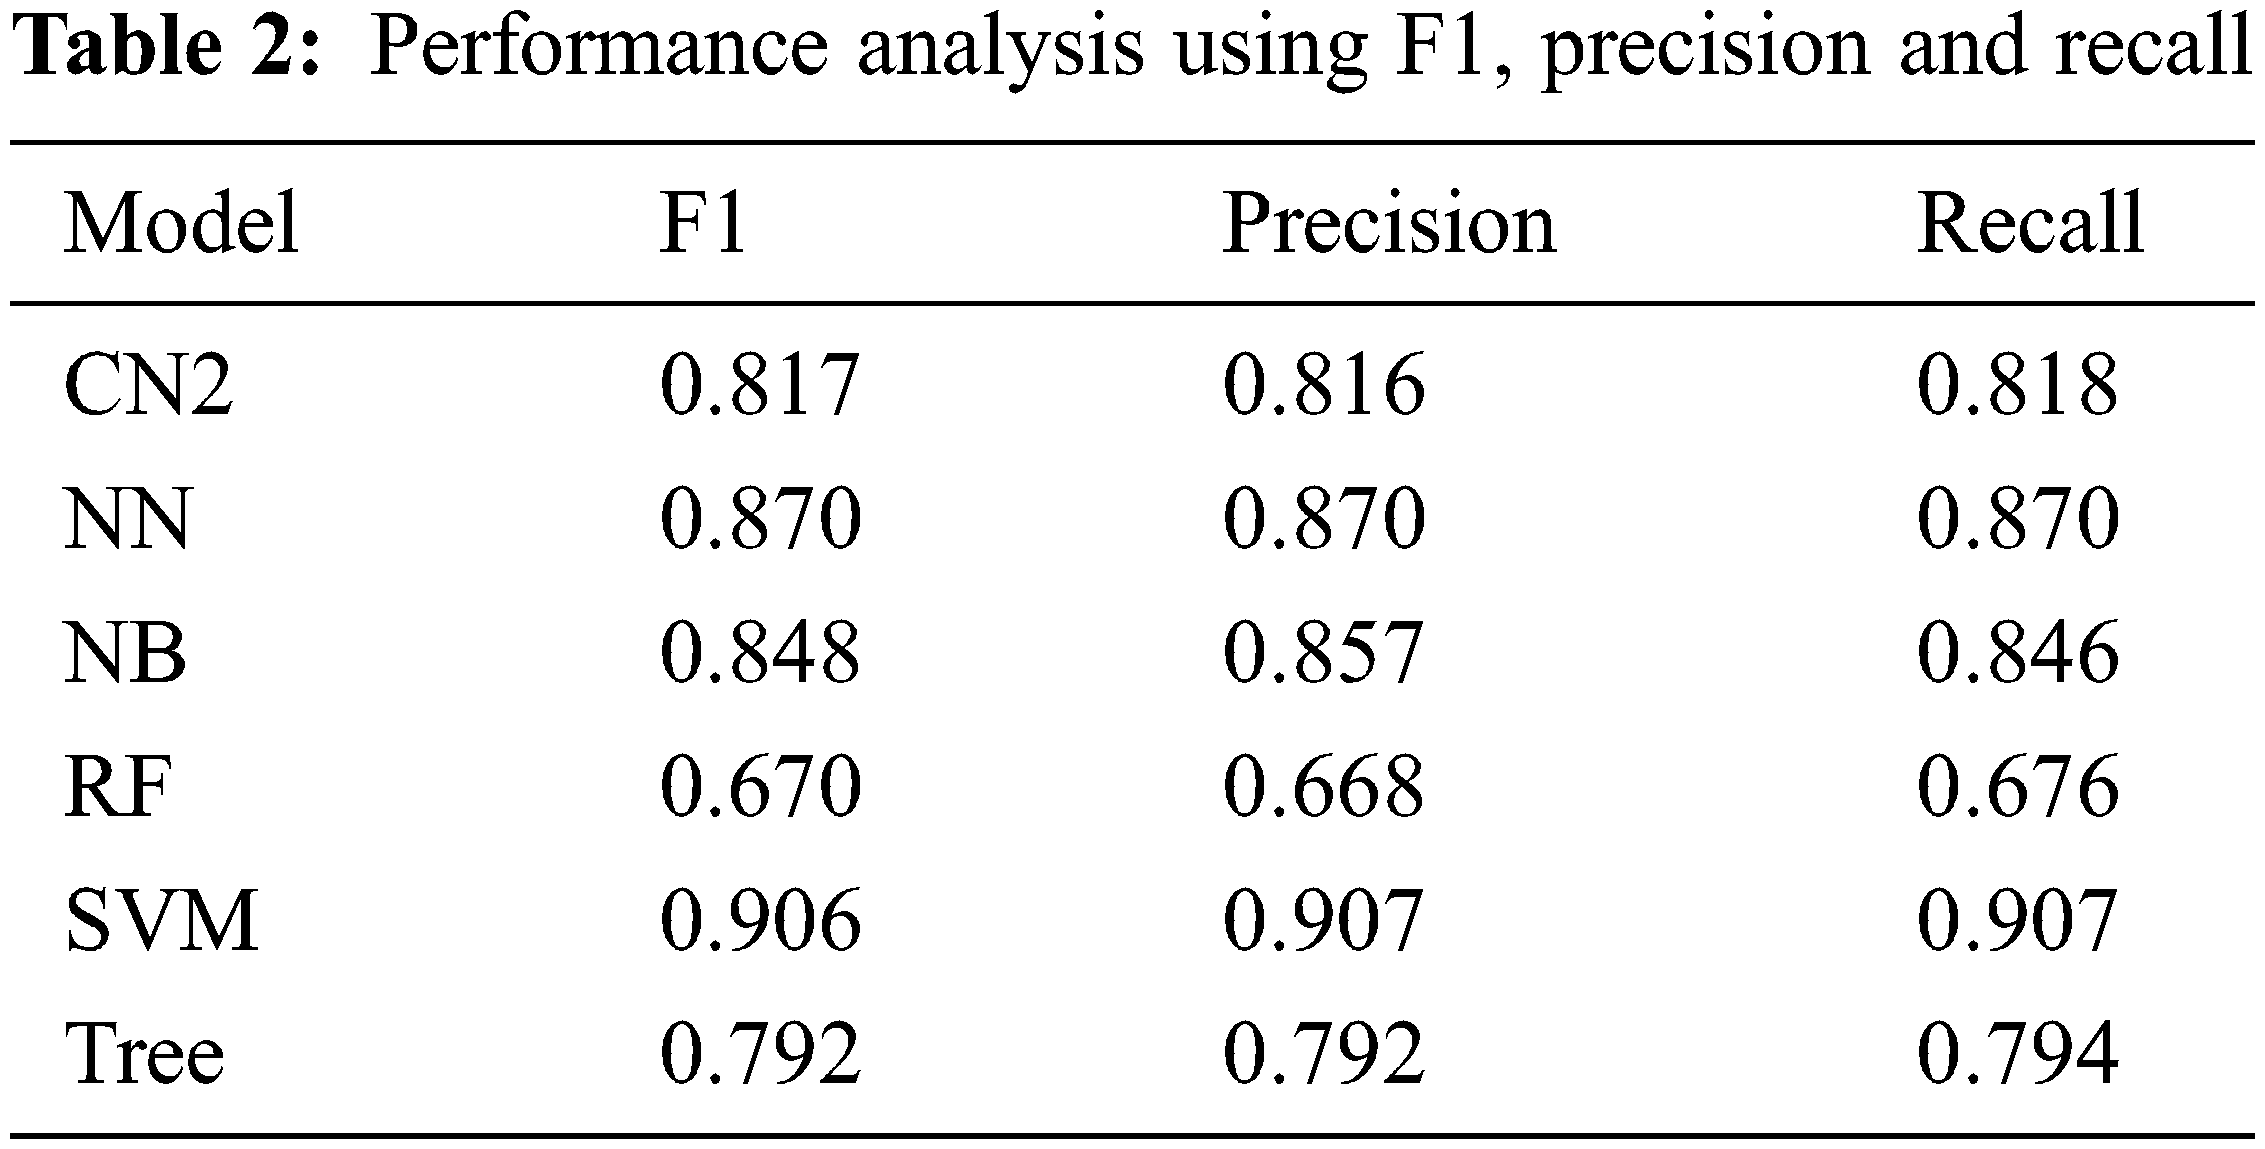
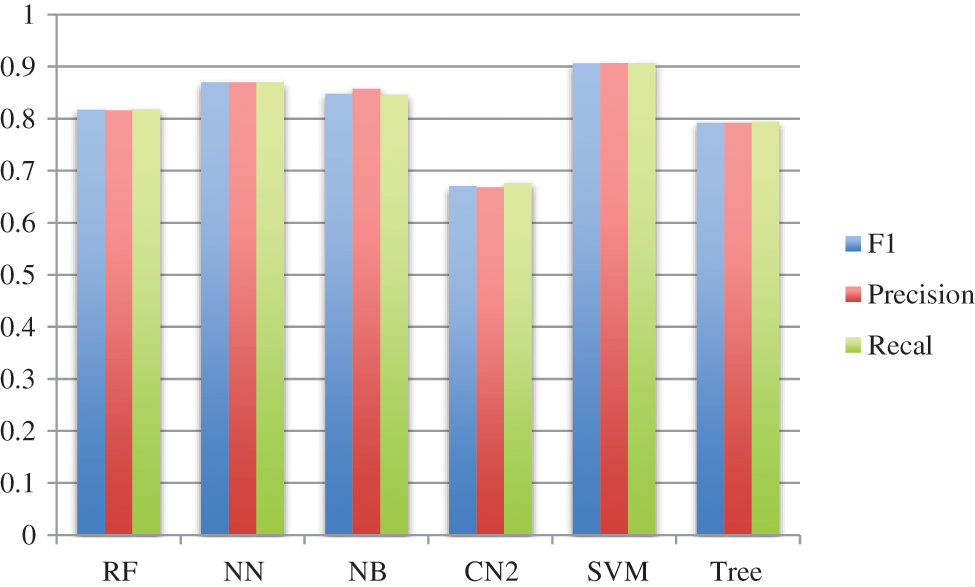
Figure 6: Performance via F1, precision, and recall
Moreover, the percentage of CA and AUC are presented in Tab. 3. It can be seen in the table that SVM outperforms other employed techniques by achieving a better CA of 90.7 percent and AUC of 95.3 percent. Fig. 7 shows the percentage difference (PD) of CA between SVM compared with the rest of the aforementioned models, while Fig. 8 presents the PD of AUC between them. It can be observed from both Figs. 7 and 8 that there is very little difference between SVM and NN which is 4.17% in CA and 0.84% in AUC. PD is calculated as:
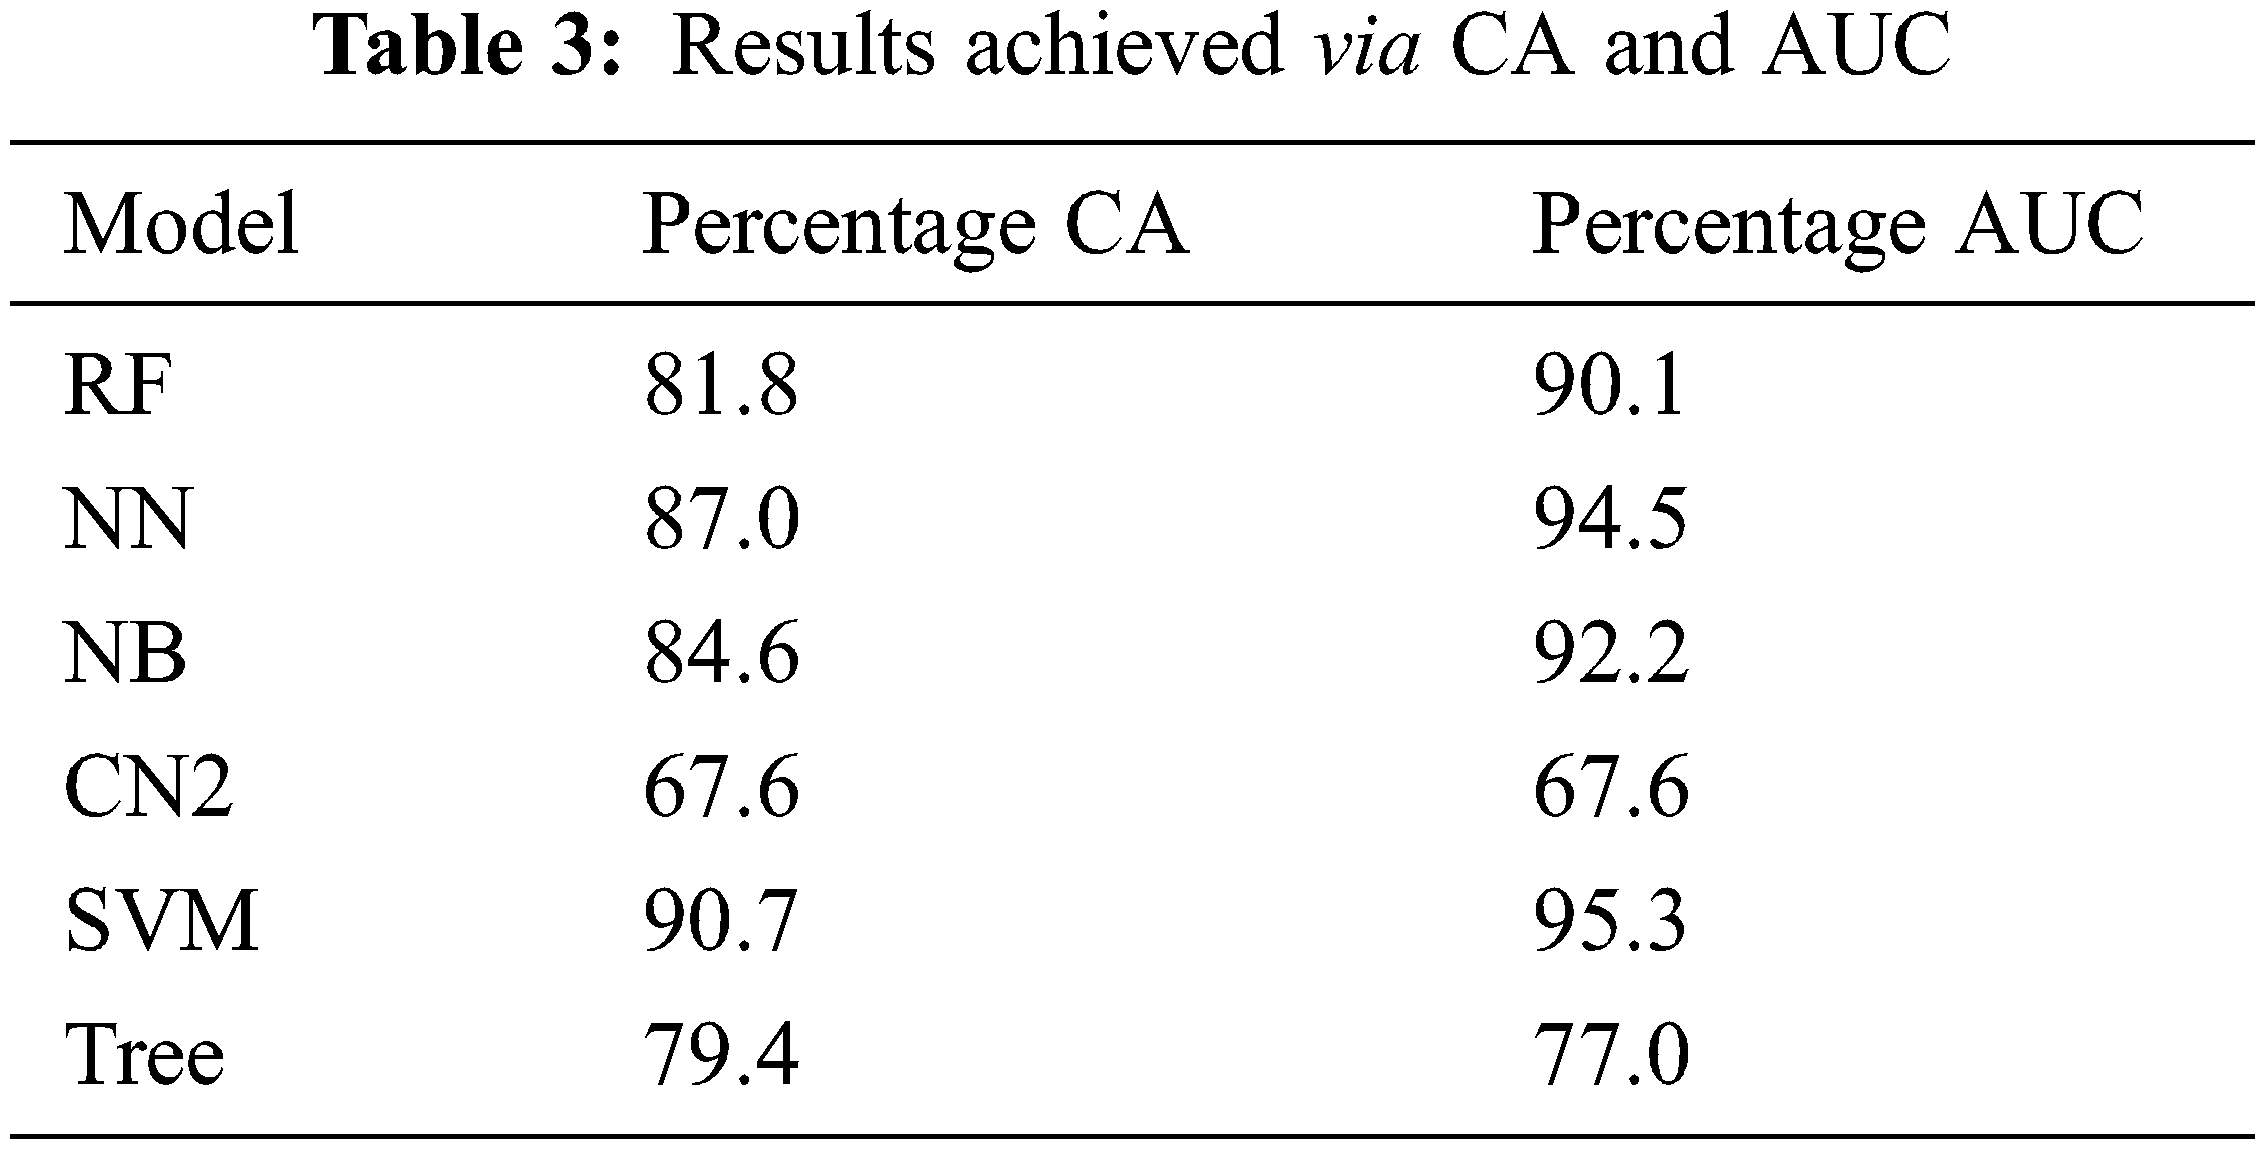
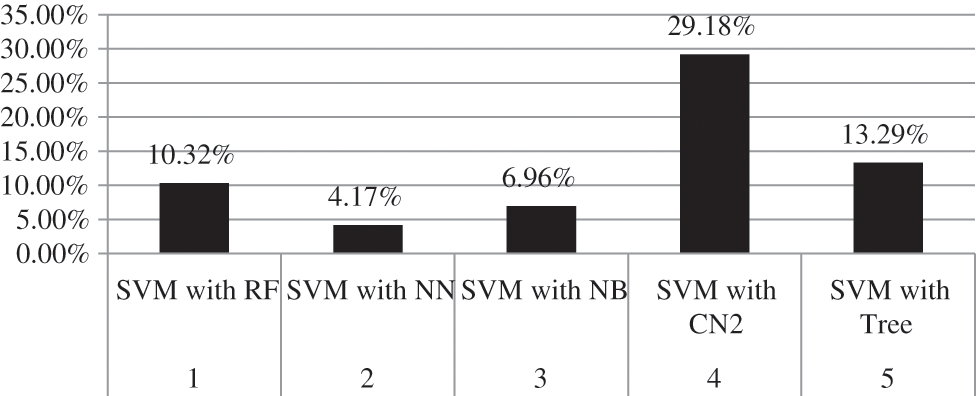
Figure 7: Percentage difference of CA between SVM and rest of employed models
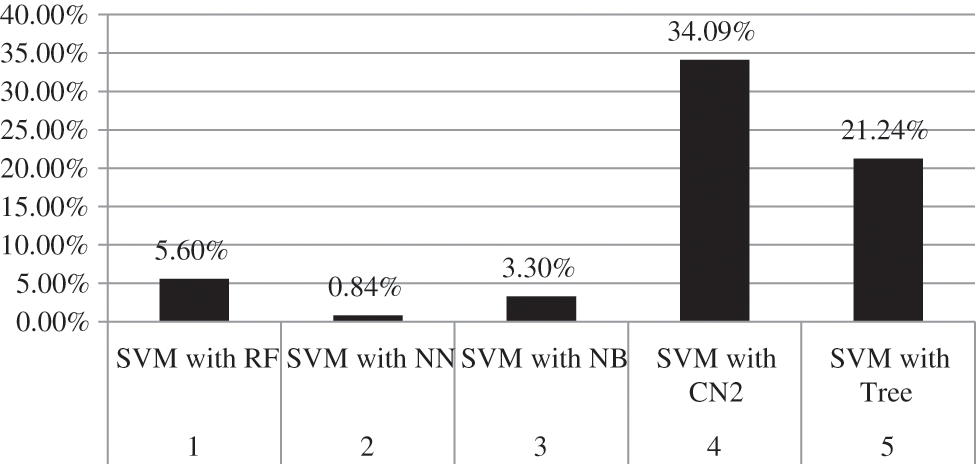
Figure 8: Percentage difference of AUC between SVM and rest of employed models
here, v1 represents the value of SVM while v2 represents the value of other techniques compared with SVM.
Furthermore, the analysis is validated through the receiver operating characteristic (ROC) curve and Left curve (LC) for endorsed verification. ROC curve is used to present the performance of the classification model at all classification thresholds. There are two parameters plotted by the ROC curve which are true positive rate (TPR) and false-positive rate (FPR) [25,26]. A typical ROC curve is presented in Fig. 9. The ROC curve achieved via each class model “No”, meaning that the patient without a brain tumor is shown in Fig. 10 while the same for class “Yes” means the patient with a brain tumor is presented in Fig. 11. The default threshold for each model is 0.5, whereas the prior probability is 37% for the patient without a brain tumor and 63% for the brain tumor-positive patients.
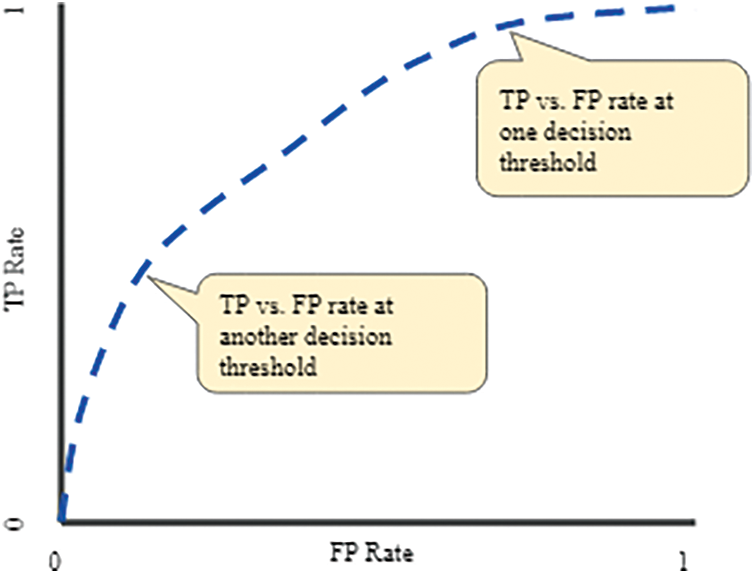
Figure 9: A typical ROC curve
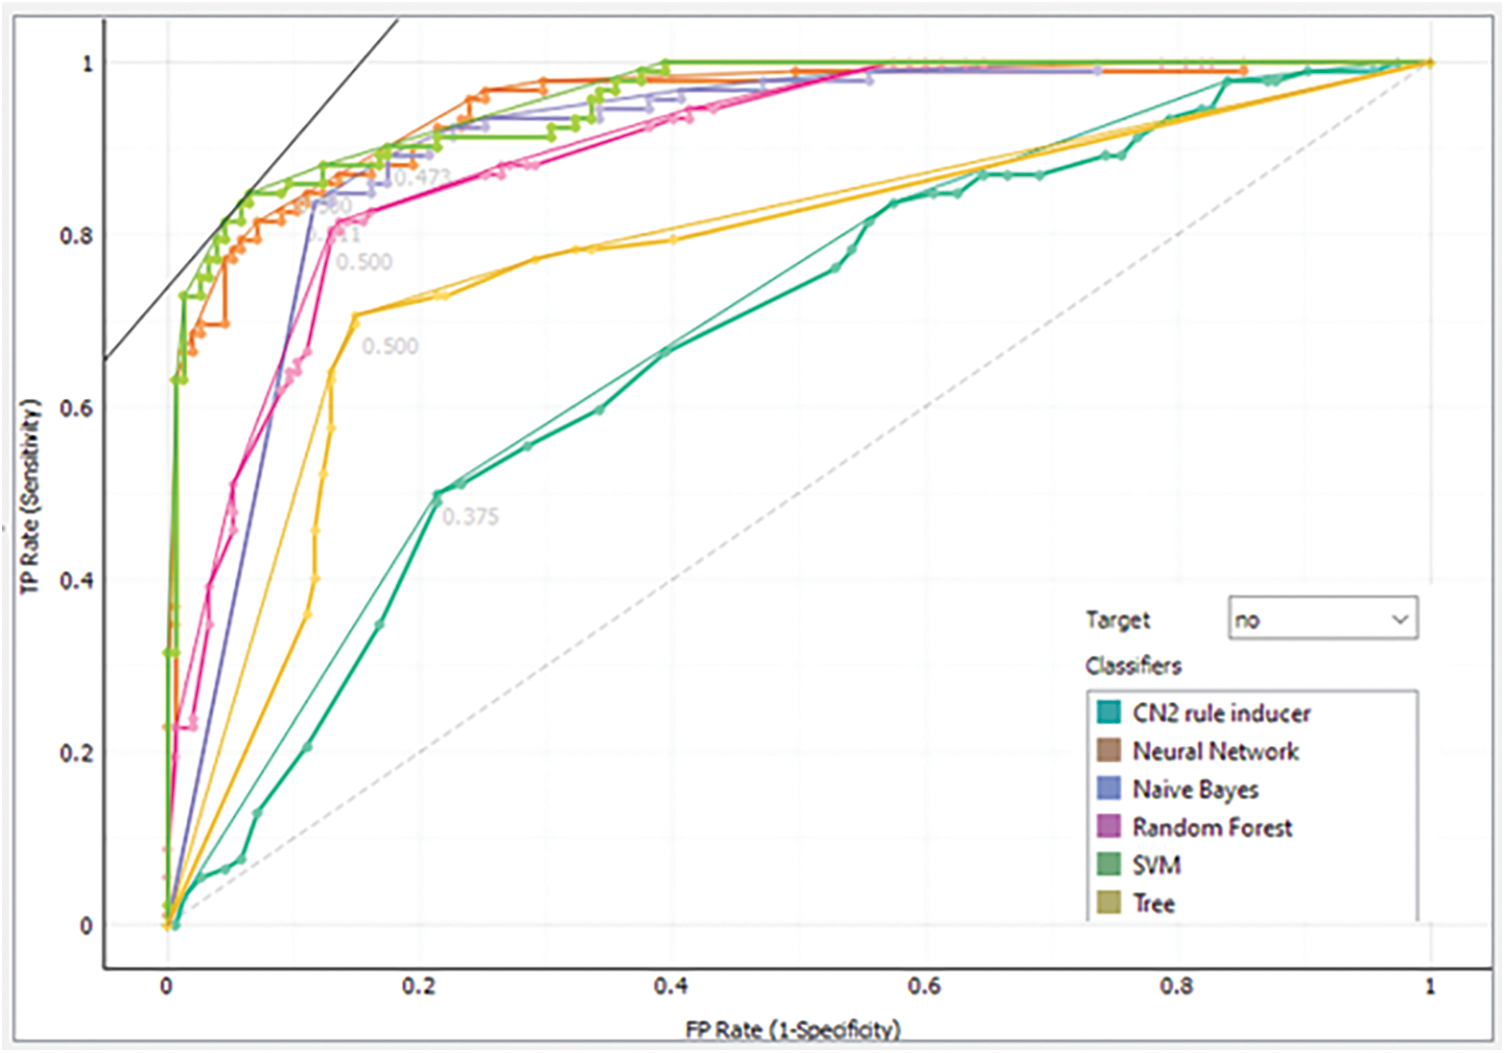
Figure 10: Analysis of each model via ROC for class “No”
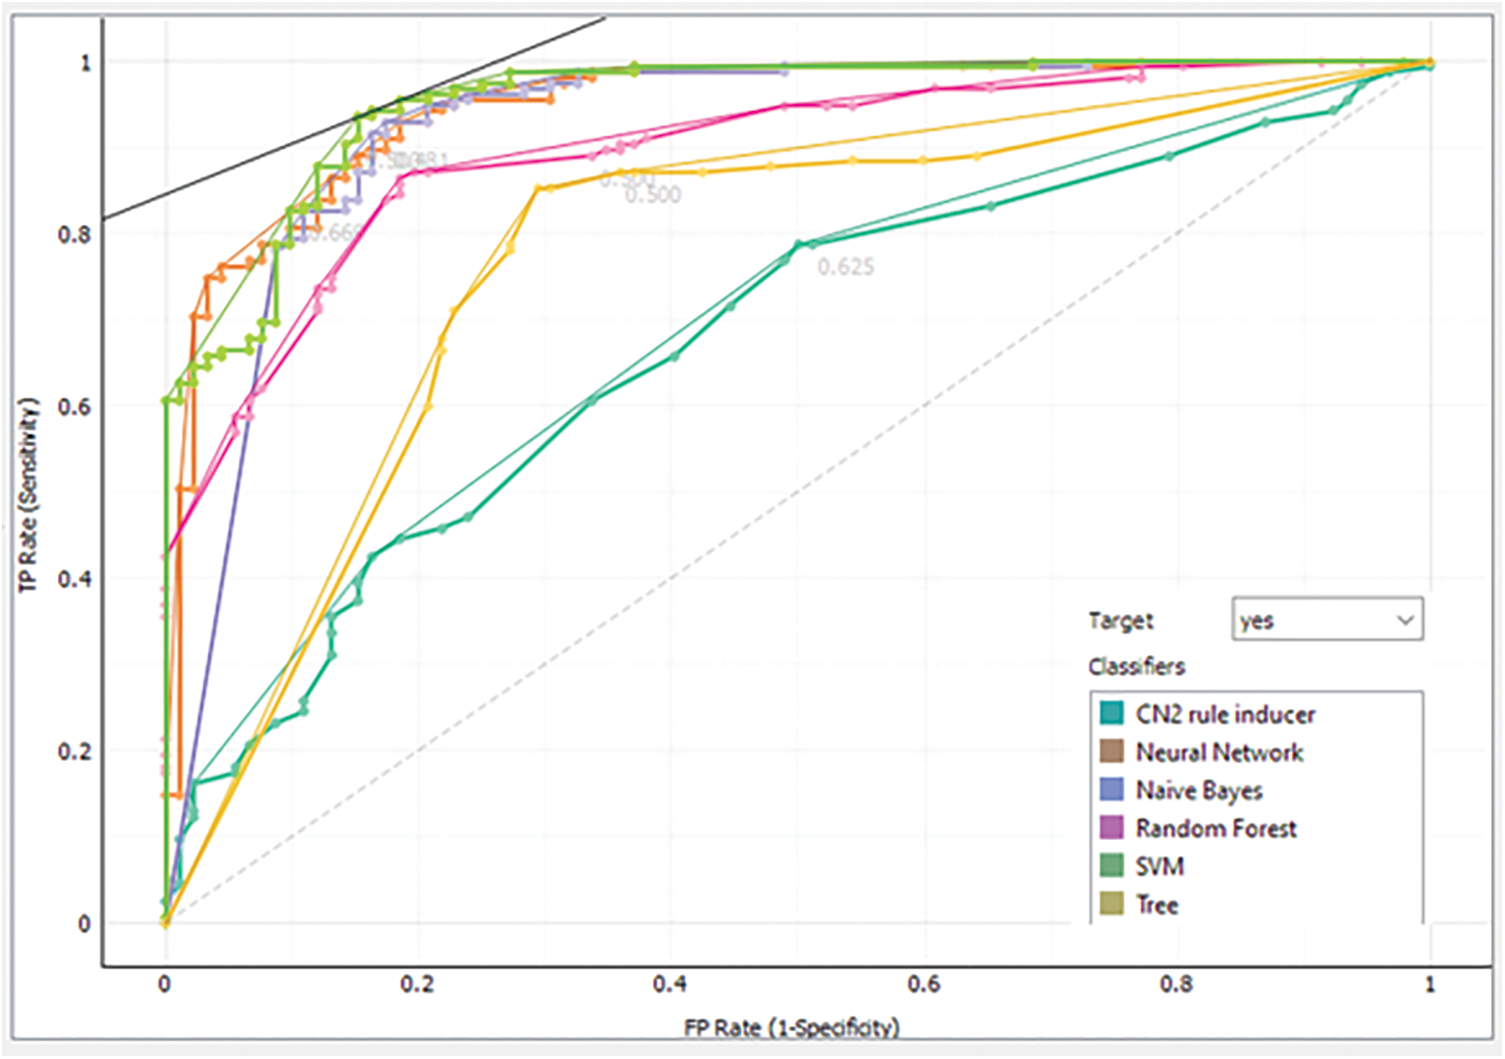
Figure 11: Analysis of each model via ROC for class “Yes”
LC is an approach to envisioning the performance of a classification model. The LC practices the returned probability to measure how our model is carried out to identify the negative and positive patients. Analysis of each model via LC for class negative patients is presented in Fig. 12 while the same for the positive class is shown in Fig. 13.
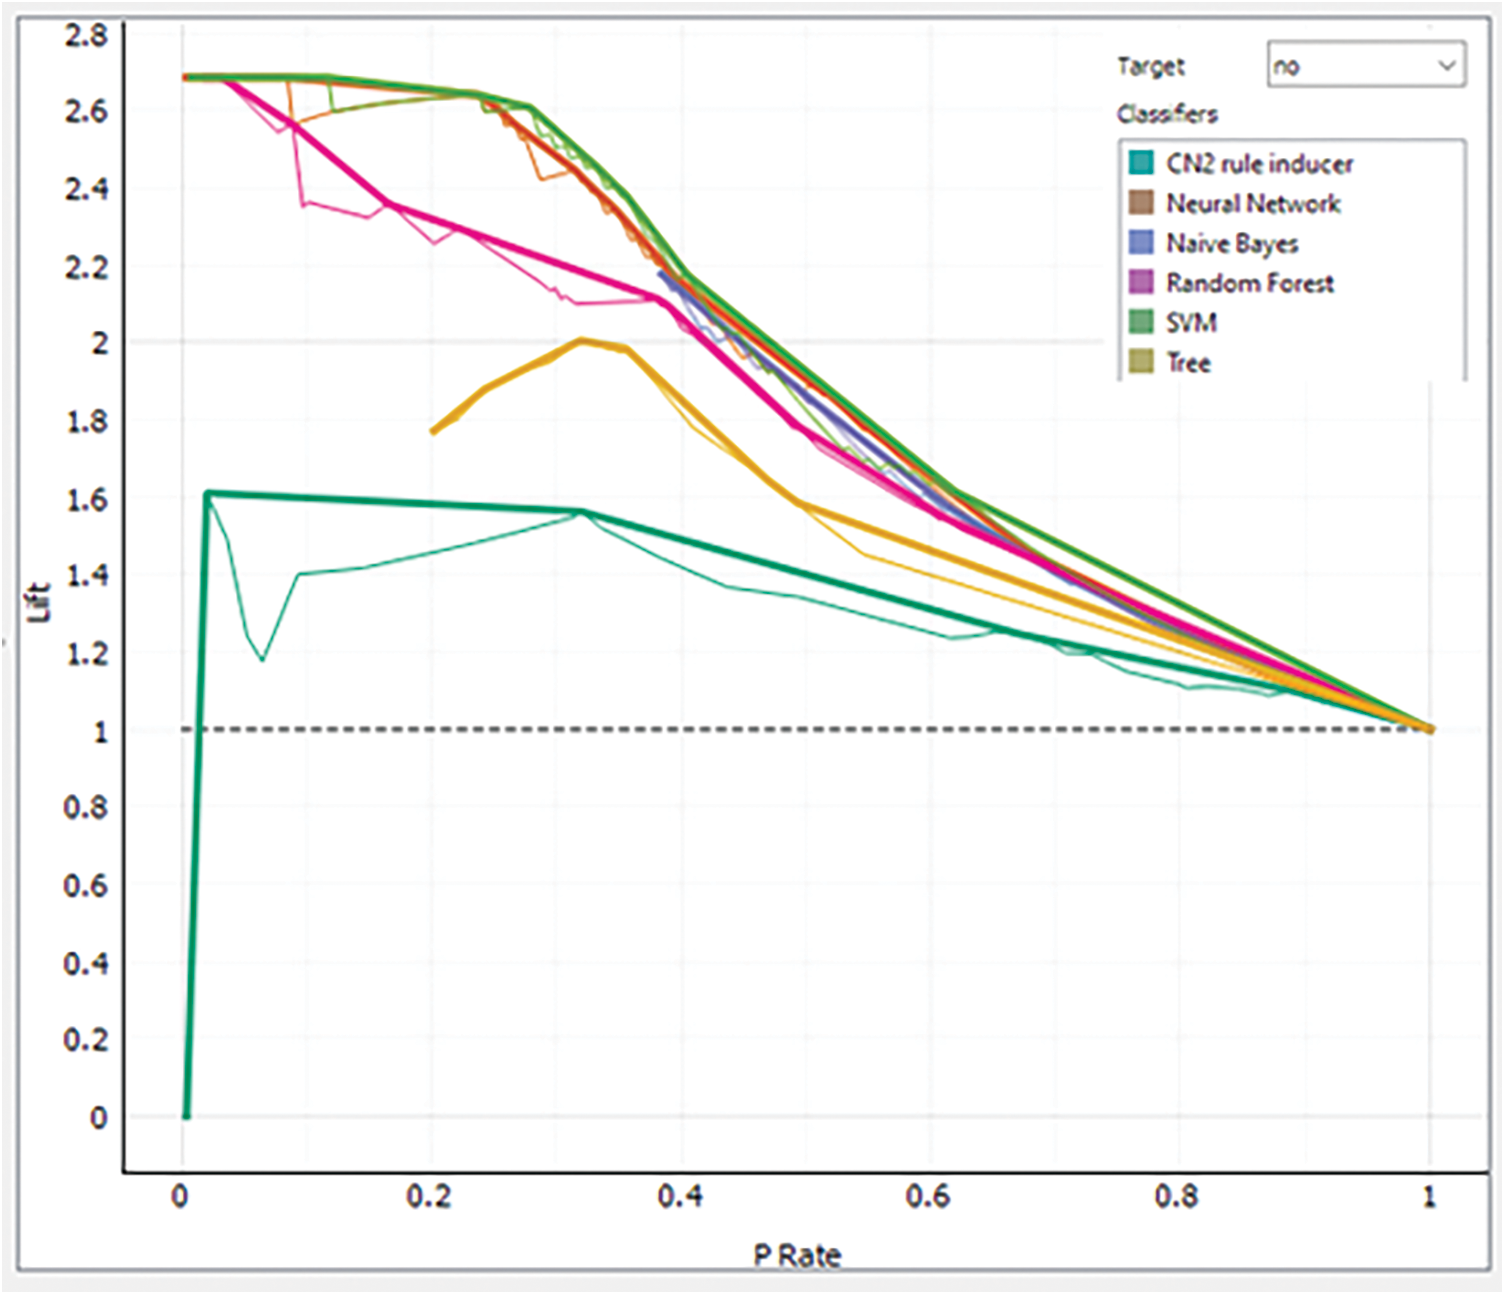
Figure 12: Analysis of each model via LC for class “No”
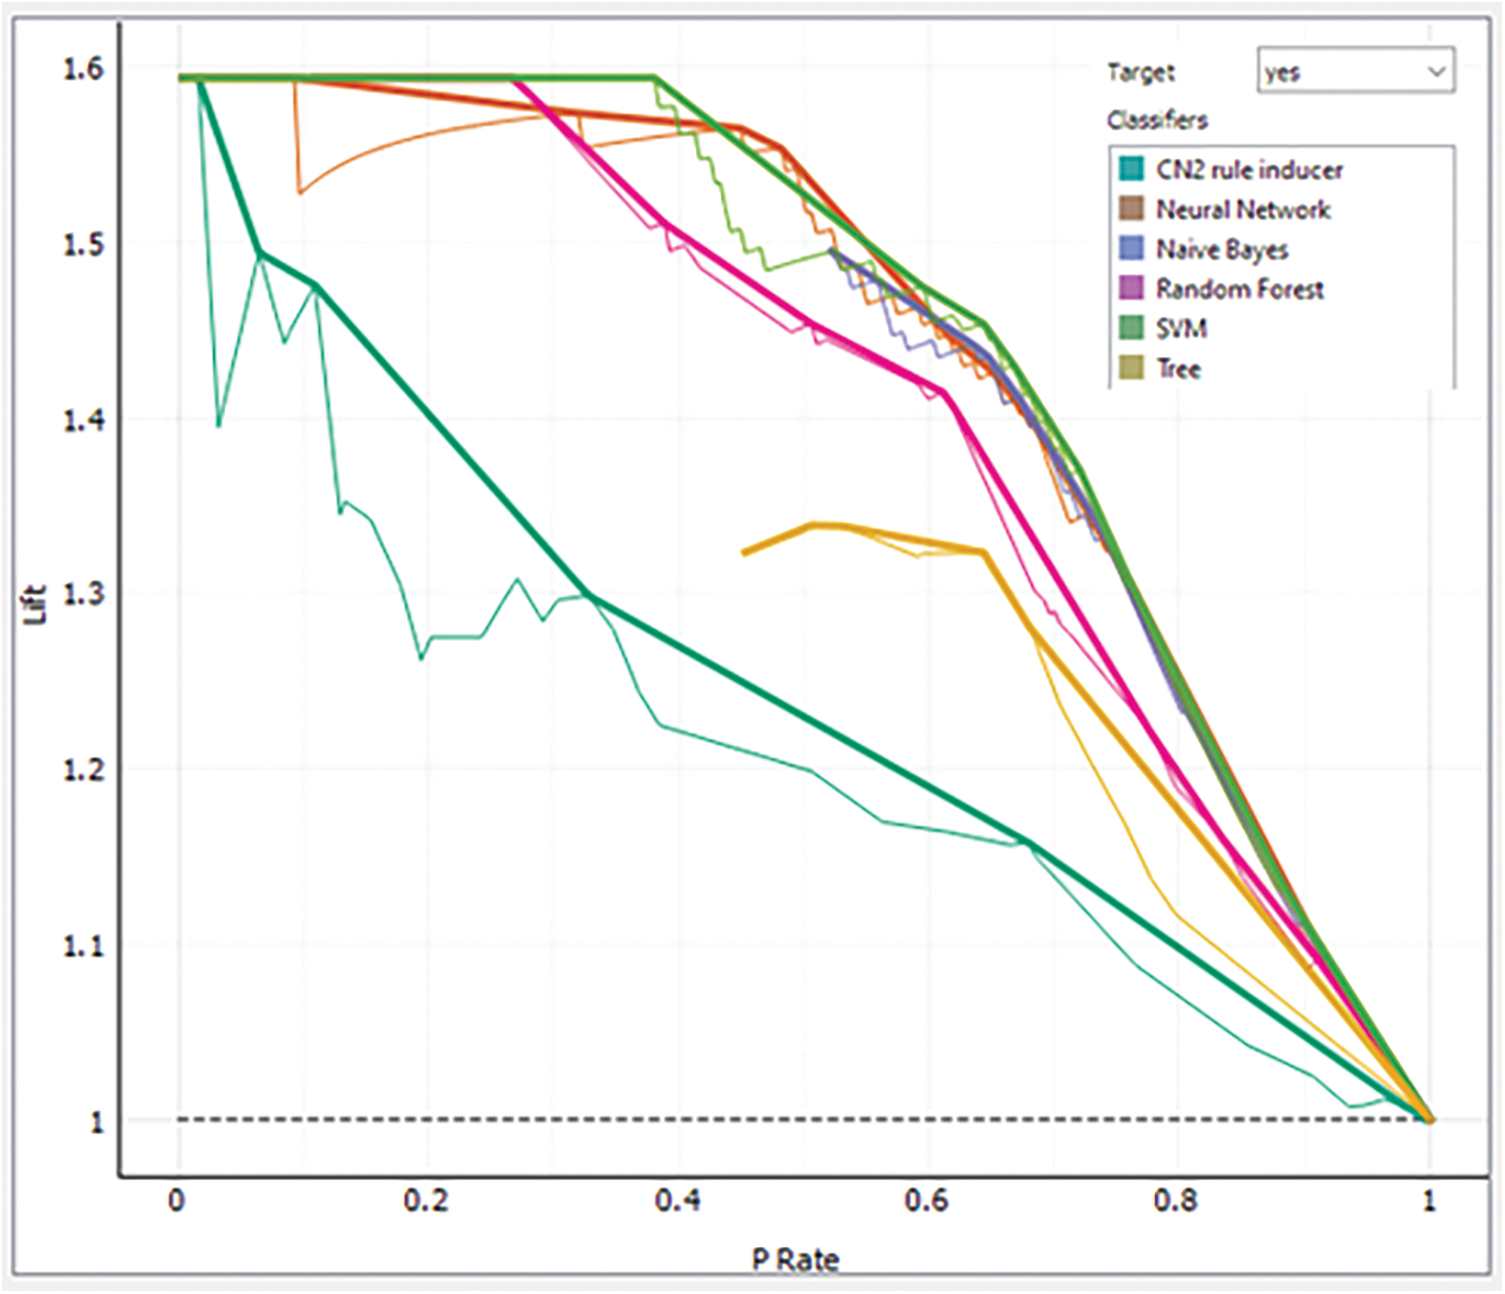
Figure 13: Analysis of each model via LC for class “Yes”
Discussion
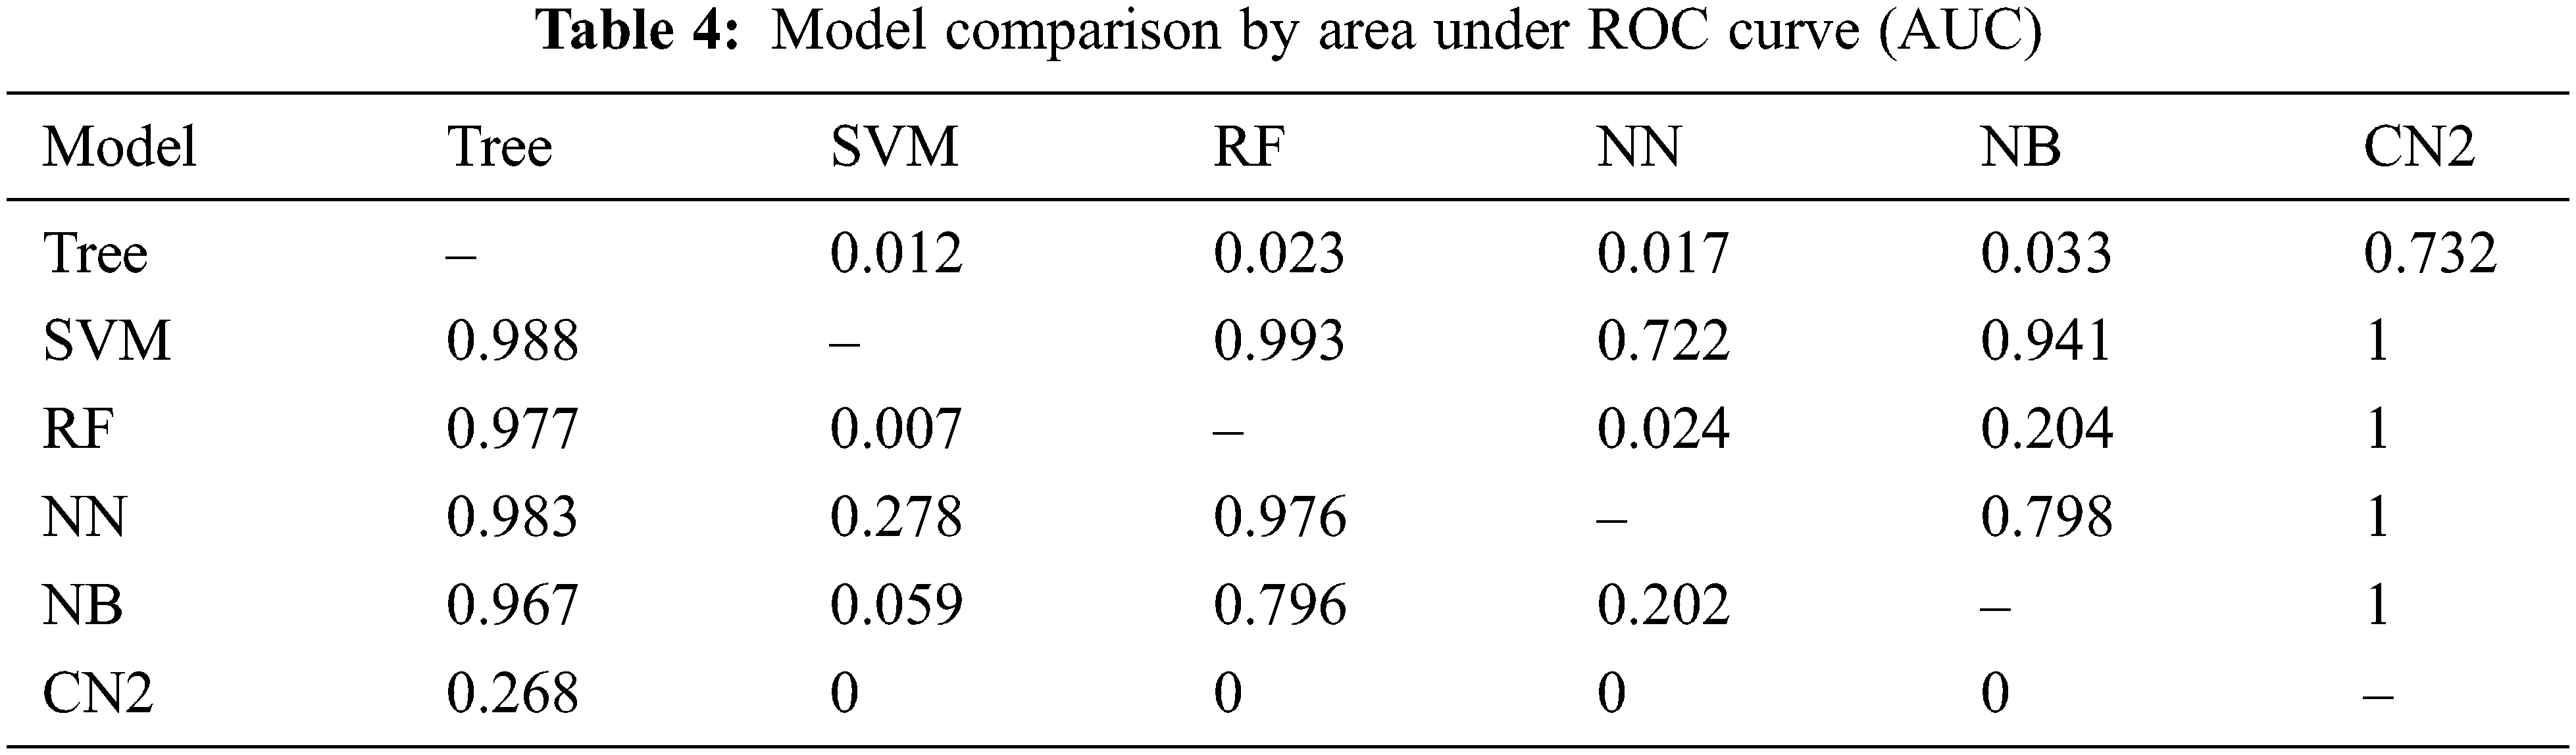
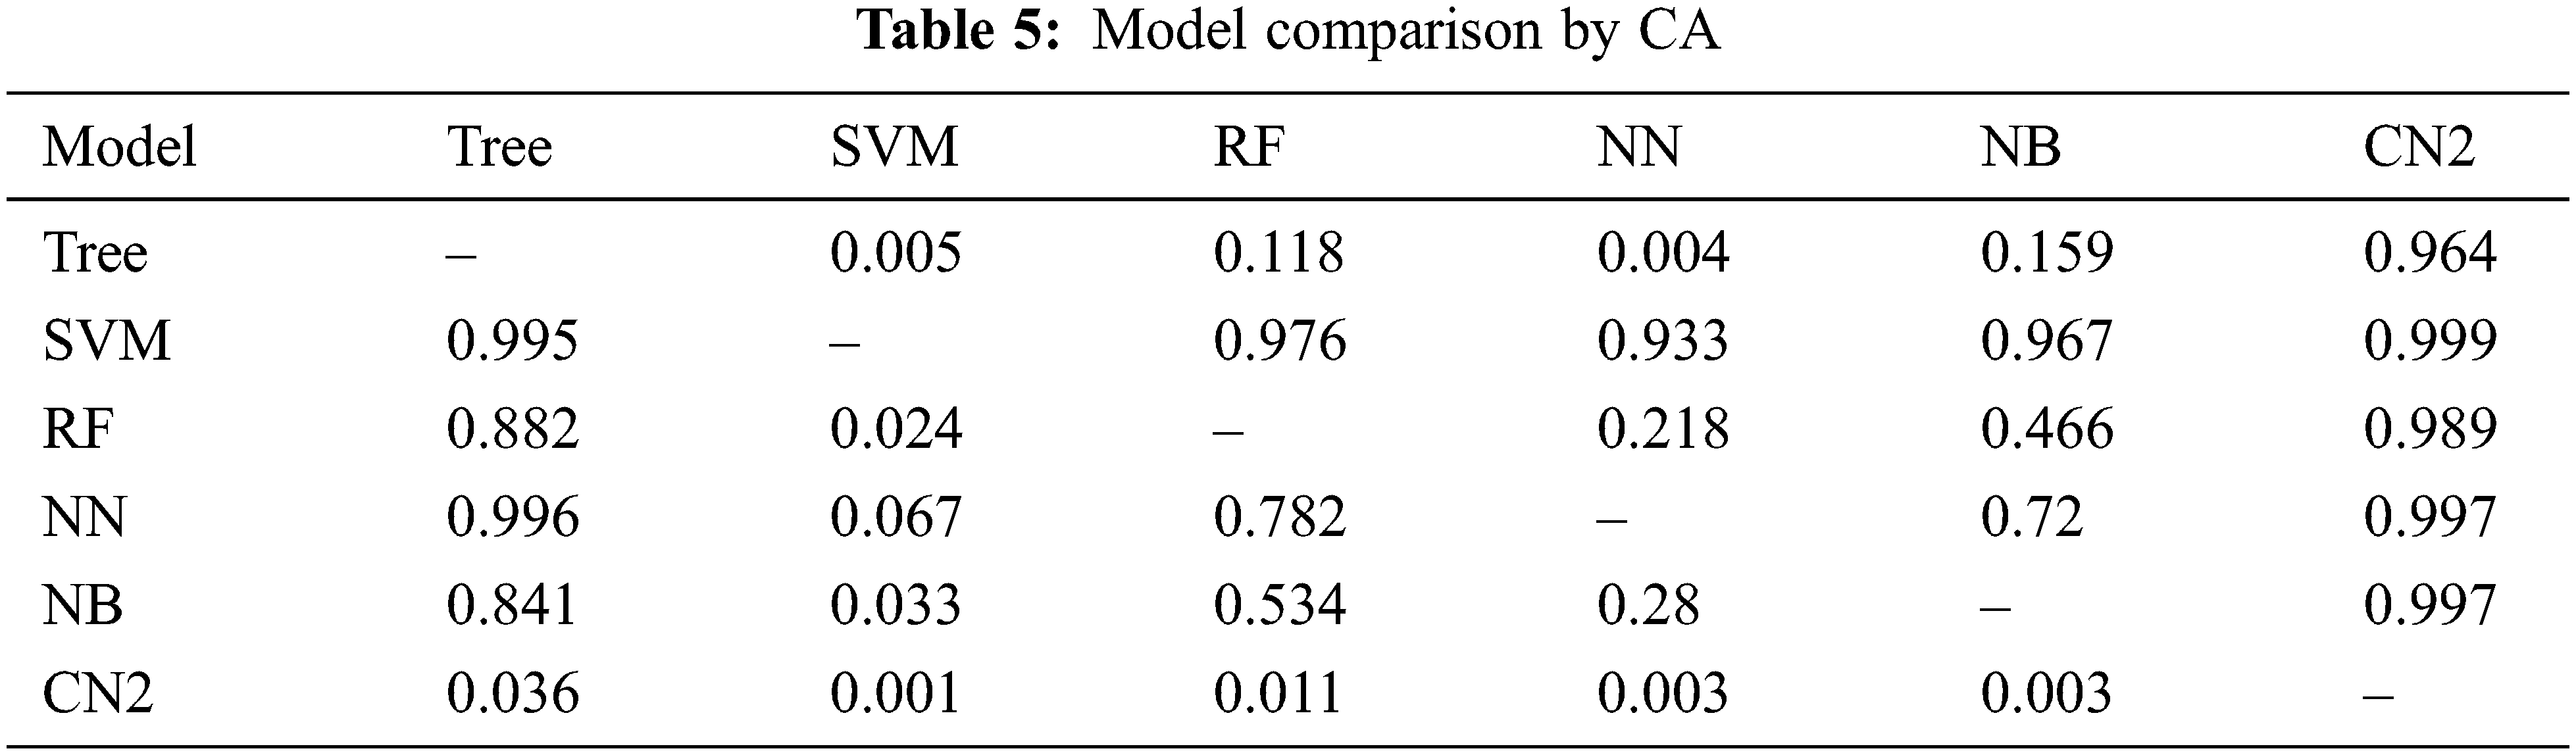
The previous section presents the results for the given set of models. It is found that SVM outperforms the rest of the models in all aspects as mentioned in Tab. 1 through Tab. 3 and Fig. 6 through Fig. 13. Moreover, CN2 has shown the weakest performance in the classification of brain tumors as malignant or benign. However, the hierarchy does not remain the same for the rest of the aforementioned models. Tab. 4 presents the comparison of each model through AUC, while Tab. 5 presents the model's comparison through CA. these Tables show probabilities that the score of the model in the row is higher than that of the model in the column. Small numbers show the probability that the difference is negligible.
However, this study recommends SVM for the classification of a brain tumor on the aforementioned dataset. There can be a threat to validity of the outcomes that is any change in the dataset may increase or decrease the achieved outcome. Furthermore, the use of another advanced model may improve the accuracy of the evaluation, or the use of a new and advanced evaluation measure may alter the results stated.
In the modern world, the use of technology has become a commodity that, beyond providing several facilities makes us vulnerable to classifying the medical data for the prediction of various diseases. In this regard, brain tumor is one of the pivotal diseases and needs to identify in the early stages. Various models have been used by researchers in this regard, and each has its strengths and weaknesses. However, this work has presented an in-depth analysis of six ML techniques for brain tumor classification. This includes RF, NN, NB, CN2, SVM, and Tree. Furthermore, we employed the Kaggle dataset to increase diversity and perform 10-fold cross-validation that strengthens the analysis process. The results demonstrate the superior performance of SVM with an accuracy of 95.3 percent whereas, CN2 remains the weakest identifier bearing accuracy of 67.6 percent. Future extension of this work may include meta-analysis for classification and identification of key features of brain tumors.
Data Availability Statement: All the data used in this study is taken from the Kaggle repository and available at https://www.kaggle.com/navoneel/brain-mri-images-for-brain-tumor-detection.
Funding Statement: Authors would like to acknowledge the support of the Deputy for Research and Innovation- Ministry of Education, Kingdom of Saudi Arabia for this research through a grant (NU/IFC/ENT/01/014) under the institutional Funding Committee at Najran University, Kingdom of Saudi Arabia.
Conflicts of Interest: The authors state that there is no conflict of interest concerning the publication of this paper.
References
1. T. Saba, A. Sameh Mohamed, M. El-Affendi, J. Amin and M. Sharif, “Brain tumor detection using fusion of hand crafted and deep learning features,” Cognitive Systems Research, vol. 59, no. 1, pp. 221–230, 2020. [Google Scholar]
2. J. Amin, M. Sharif, M. Raza, T. Saba and M. A. Anjum, “Brain tumor detection using statistical and machine learning method,” Computer Methods and Programs in Biomedicine, vol. 177, no. 1, pp. 69–79, 2019. [Google Scholar]
3. K. Abbas, P. W. Khan, K. T. Ahmed and W. C. Song, “Automatic brain tumor detection in medical imaging using machine learning,” in Int. Conf. on Information and Communication Technology Convergence, Jeju Island, South Korea, pp. 531–536, 2019. [Google Scholar]
4. M. Toğaçar, B. Ergen and Z. Cömert, “BrainMRNet: Brain tumor detection using magnetic resonance images with a novel convolutional neural network model,” Medical Hypotheses, vol. 134, no. 1, pp. 109531, 2020. [Google Scholar]
5. P. V. Rama Raju, G. Bharga Manjari and G. Nagaraju, “Brain tumour detection using convolutional neural network,” International Journal of Recent Technology and Engineering, vol. 8, no. 1, pp. 73–76, 2019. [Google Scholar]
6. M. Siar and M. Teshnehlab, “Brain tumor detection using deep neural network and machine learning algorithm,” in 9th Int. Conf. on Computer and Knowledge Engineering, Mashhad, Iran, pp. 363–368, 2019. [Google Scholar]
7. M. Wu and C. Lin, “Brain tumor detection using adaptive K-means clustering segmentation,” International Journal of Advance Engineering and Research Development, vol. 4, no. 7, pp. 3–6, 2017. [Google Scholar]
8. S. Irsheidat and R. Duwairi, “Brain tumor detection using artificial convolutional neural networks,” in 11th Int. Conf. on Information and Communication Systems, Irbid, Jordan, pp. 197–203, 2020. [Google Scholar]
9. B. H. Menze, A. Jakab, S. Bauer, J. Kalpathy-Cramer, K. Farahani et al., “The multimodal brain tumor image segmentation benchmark (BRATS),” IEEE Transactions on Medical Imaging, vol. 34, no. 10, pp. 1993–2024, 2015. [Google Scholar]
10. B. Khan, R. Naseem, F. Muhammad, G. Abbas and S. Kim, “An empirical evaluation of machine learning techniques for chronic kidney disease prophecy,” IEEE Access, vol. 8, no. 1, pp. 55012–55022, 2020. [Google Scholar]
11. R. Naseem, B. Khan, A. Ahmad, A. Almogren, S. Jabeen et al., “Investigating tree family machine learning techniques for a predictive system to unveil software defects,” Complexity, vol. 2020, no. 1, pp. 1–21, 2020. [Google Scholar]
12. B. Khan, R. Naseem, M. A. Shah, K. Wakil, A. Khan et al., “Software defect prediction for healthcare big data: An empirical evaluation of machine learning techniques,” Journal of Healthcare Engineering, vol. 2021, no. 1, pp. 1–16, 2021. [Google Scholar]
13. R. Naseem, B. Khan, M. A. Shah, K. Wakil, A. Khan et al., “Performance assessment of classification algorithms on early detection of liver syndrome,” Journal of Healthcare Engineering, vol. 2020, no. 4, pp. 1–13, 2020. [Google Scholar]
14. A. Subasi and E. Kremic, “Leveraging AI and machine learning for societal challenges, cas 2019 comparison of adaboost with multiboosting for phishing website detection,” Procedia Computer Science, vol. 168, no. 2019, pp. 272–278, 2020. [Google Scholar]
15. P. Clark and T. Niblett, “The CN2 induction algorithm,” Machine Learning, vol. 3, no. 4, pp. 261–283, 1989. [Google Scholar]
16. R. M. Ahmed and O. Q. Alshebly, “Prediction and factors affecting of chronic kidney disease diagnosis using artificial neural networks model and logistic regression model,” Iraqi Journal of Statistical Science, vol. 16, no. 28, pp. 140–159, 2019. [Google Scholar]
17. K. Balasaravanan and M. Prakash, “Detection of dengue disease using artificial neural network based classification techniquetion,” International Journal of Engineering & Technology, vol. 7, no. 1, pp. 13–15, 2018. [Google Scholar]
18. N. Mary, B. Khan, Q. Ishfaq and M. z. Khan, “Empirical study of intelligence techniques for cardio vascular disease,” University of Swabi Journal, vol. 3, no. 1, pp. 16–26, 2019. [Google Scholar]
19. A. Zamir, H. U. Khan, T. Iqbal, N. Yousaf, F. Aslam et al., “Phishing web site detection using diverse machine learning algorithms,” Electronic Library, vol. 38, no. 1, pp. 65–80, 2020. [Google Scholar]
20. N. Nahar and F. Ara, “Liver disease prediction by using different decision tree techniques,” International Journal of Data Mining & Knowledge Management Process, vol. 8, no. 2, pp. 01–09, 2018. [Google Scholar]
21. E. H. A. Rady and A. S. Anwar, “Prediction of kidney disease stages using data mining algorithms,” Informatics in Medicine Unlocked, vol. 15, no. December 2018, pp. 100178, 2019. [Google Scholar]
22. A. Iqbal, S. Aftab, U. Ali, Z. Nawaz, L. Sana et al., “Performance analysis of machine learning techniques on software defect prediction using NASA datasets,” International Journal of Advanced Computer Science and Applications, vol. 10, no. 5, pp. 300–308, 2019. [Google Scholar]
23. H. Jin, S. Kim and J. Kim, “Decision factors on effective liver patient data prediction,” International Journal of Bio-Science and Bio-Technology, vol. 6, no. 4, pp. 167–178, 2014. [Google Scholar]
24. B. Khan, R. Naseem, M. Ali, M. Arshad and N. Jan, “Machine learning approaches for liver disease diagnosing,” International Journal of Data Science and Advanced Analytics, vol. 1, no. 1, pp. 27–31, 2019. [Google Scholar]
25. T. Saito and M. Rehmsmeier, “The precision-recall plot is more informative than the ROC plot when evaluating binary classifiers on imbalanced datasets,” PLoS One, vol. 10, no. 3, pp. 1–21, 2015. [Google Scholar]
26. S. M. M. Hasan, M. A. Mamun, M. P. Uddin and M. A. Hossain, “Comparative analysis of classification approaches for heart disease prediction,” in Int. Conf. on Computer, Communication, Chemical, Material and Electronic Engineering, Rajshahi, Bangladesh, pp. 1–4, 2018. [Google Scholar]
Cite This Article
 Copyright © 2023 The Author(s). Published by Tech Science Press.
This work is licensed under a Creative Commons Attribution 4.0 International License , which permits unrestricted use, distribution, and reproduction in any medium, provided the original work is properly cited.
 Downloads
 Citation Tools