
 Submit a Paper
 Propose a Special lssue
 Open Access
ARTICLE
Automatic Detection of Outliers in Multi-Channel EMG Signals Using MFCC and SVM
1 Electrical Engineering Department, College of Engineering, Najran University Saudi Arabia, Najran, 61441, Saudi Arabia
2 Department of Software Engineering, University of Malakand, Dir Lower, Pakistan
3 Department of Electrical Engineering, University of Engineering and Technology, Mardan, 23200, Pakistan
4 Faculty of Maritime Studies, King Abdulaziz University, Jeddah, 21589, Saudi Arabia
5 Department of Computer Science, University of Engineering and Technology, Mardan, 23200, Pakistan
* Corresponding Author: Fazal Muhammad. Email:
Intelligent Automation & Soft Computing 2023, 36(1), 169-181. https://doi.org/10.32604/iasc.2023.032337
Received 14 May 2022; Accepted 15 June 2022; Issue published 29 September 2022
 View Full Text
 Download PDF
Abstract
The automatic detection of noisy channels in surface Electromyogram (sEMG) signals, at the time of recording, is very critical in making a noise-free EMG dataset. If an EMG signal contaminated by high-level noise is recorded, then it will be useless and can’t be used for any healthcare application. In this research work, a new machine learning-based paradigm is proposed to automate the detection of low-level and high-level noises occurring in different channels of high density and multi-channel sEMG signals. A modified version of mel frequency cepstral coefficients (mMFCC) is proposed for the extraction of features from sEMG channels along with other statistical parameters i-e complexity coefficient, hurst exponent, and root mean square. Several state-of-the-art classifiers such as Support Vector Machine (SVM), Ensemble Bagged Trees, Ensemble Subspace Discriminant, and Logistic Regression are used to automatically identify an EMG channel either bad or good based on these extracted features. Comparison-based analyses of these classifiers have also been considered based on total classification accuracy, prediction speed (observations/sec), and processing time. The proposed method is tested on 320 simulated EMG channels as well as 640 experimental EMG channels. SVM is used as our main classifier for the detection of noisy channels which gives a total classification accuracy of 99.4% for simulated EMG channels whereas accuracy of 98.9% is achieved for experimental EMG channels.Keywords
EMG signals are usually acquired with a grid or array of electrodes. These signals are named multi-channel and high-density EMG. In these multi-channels or high-density sEMG signals, there is always chances of contaminated noisy EMG channels due to several noise sources. Low-intensity noise can be filtered out and neglected but a high degree of noise can degrade the usefulness of any psychological signal from physiological and non-physiological sources. At times, these noises emerge from the acquisition of the EMG itself such as the vibration of the body parts, power line interference (PLI), stimulation of devices, baseline wander, bad skin-electrode contact, heartbeats (ECG), artifactual spikes, movement of the skin under electrode and so on [1]. Most of the signal acquisition systems inherit these noises which lead to the recording of low-quality signals which affect the performance of the digital signal processing algorithms for studying and examining muscle anatomy and physiology on basis of these signals as most of these algorithms work well on good quality signals with low noises. Thus, it is a very important pre-processing step to check the quality of sEMG signals in terms of their signal-to-noise ratio to provide rational signals to the algorithms defined.
A bad channel present in multi-channel sEMG signals is inconsistent and is viewed as an outlier that affects the statistical estimation of the signal. In the case where multiple outliers are present, they may skew the scale estimators towards themselves, pointing that they are good cases (false negative) and vice versa (false positive). Multiple outliers present in a data can cause misclassification at a higher rate while the common approach to removing any such outliers is by visualizing scatter plots and removing them manually [2]. An extensive literature on the detection of outliers in univariate data is present. Rousseeuw et al. [3], Hodge et al. [4], and Hawkins [5] provide a substantial review in this regard. The outlier i.e., bad channel detection can be classified into different types such as depth-based [6], distance-based [7,8], distribution-based [9] or density-based is a local-outlier factor [10], probability-based local outlier factor [11] and local distance-based-outlier factor [12]. Methods such as Boxplot and its variations [13] were also used to identify univariate outliers in data. Bivariate outliers were detected using Bivariate generalization from the univariate bBoxplot [14], Quarter Elliptic Plot, and Robust Elliptic Plot [15].
Marateb et al. [16] used the Local distance-based Outlier Factor for each channel by calculating the correlation median of a good and bad channel based upon Maha-lanobis Distance rather than its mean since it is more robust in nature and can adapt to various thresholds depending upon the input set of EMG signals. They further improved this work in [17] by opting for squared Euclidean distance instead for distance measuring of good and bad channels and using k-nearest neighbor as their classifier. Although dynamic statistical thresholding has been proposed by Marateb et al, their method fails to adopt to classify a single bad channel in a bulk of good channels and hence can cause higher false negatives. In a recent work in [18], we used statistical thresholding of the features for detecting bad channels. This method only works for the simulated EMG signals. Also, the accuracy of the proposed method is based on the value of the threshold whose proper selection is difficult. Also, this method did not use any classifier to find the threshold/boundary condition between the bad and good channels.
In our proposed method, mMFCC features and statistical parameters such as hurst exponent, complexity coefficient and root mean square are computed for each channel of the multi-channel EMG signals. Our proposed method calculates and checks these EMG features for each channel in the high-density and multi-channel system. An EMG channel from an array are grid having any of the mentioned artifacts with a high amplitude such that the signal to noise ratio is less than 20 dB and is labeled as a Bad EMG Channel. A classical classifier SVM is then trained using these features to automatically identify a channel as either a “good one” or “bad one”. This framework is also compared with several established other classifiers too. The results obtained from the simulated as well as experimental signals show that the proposed method detected the bad (noisy) channels with great accuracy and can be implemented in real-time situations since it requires minimum computational power. The selection of these parameters used as features as well as classifiers is discussed in the following section.
This paper is organized into four sections. Section 1 is about introduction of the proposed work, Section 2 provides an insight into the methodology followed in the development of the proposed framework. Section 3 is all about the results on simulated and experimental EMG signals. Finally Section 4 provides the conclusions, limitations and future directions of the research work.
Two groups of EMG signals are examined and studied in this research. The first group of EMG signals consists of simulated signals generated based on an imaginary muscle with a 3 mm thick fat layer, 1 mm thick skin layer, and 105 motor units (MU), each consisting of a random number of muscle fibers (50–200 with uniform distribution). MU’s fibers were randomly distributed in a circular MU territory distributed uniformly throughout the muscle. Each signal is a 20 channels single differential EMG signal sampled at 2048 samples/s with a detection system consisting of an array of electrodes (point-like) with an inter-electrode distance of 5 mm and two innervation zones (IZ) in most the cases. One such computer-generated sEMG signal is plotted in Fig. 1.
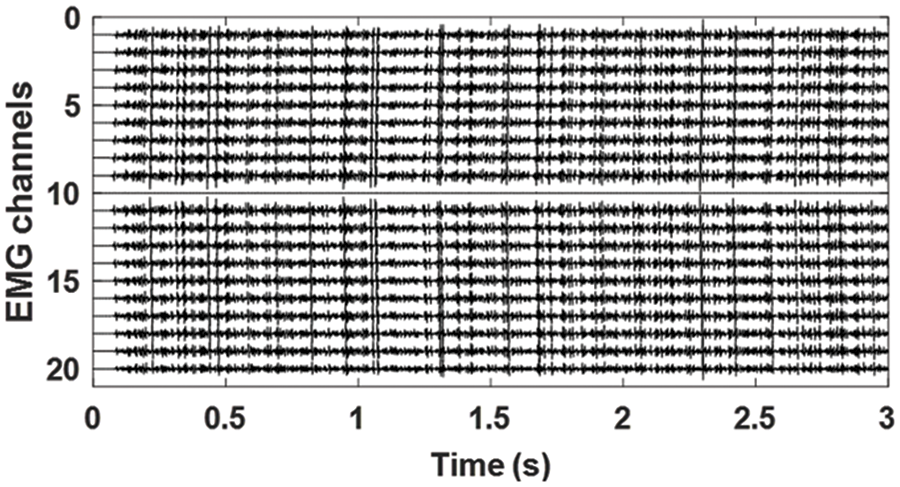
Figure 1: Simulated EMG signals. 20 channels single differential EMG signals simulated with the EMG model explained in [19]
Set 2 consists of experimental EMG signals, we recorded from short head Bicep Brachii muscle using an array of 12 equally spaced electrodes with 10 mm inter-electrode distances (see Fig. 2), using the W-EMG acquisition system [19], to detect a shift in the location of IZ with respect to the joint angle. The subjects who participated in this study were asked to make isometric contractions against a brace with the constant force for 5 s. The sEMG was recorded for three different joint angles between arm and forearm (75°, 105°, and 135°).
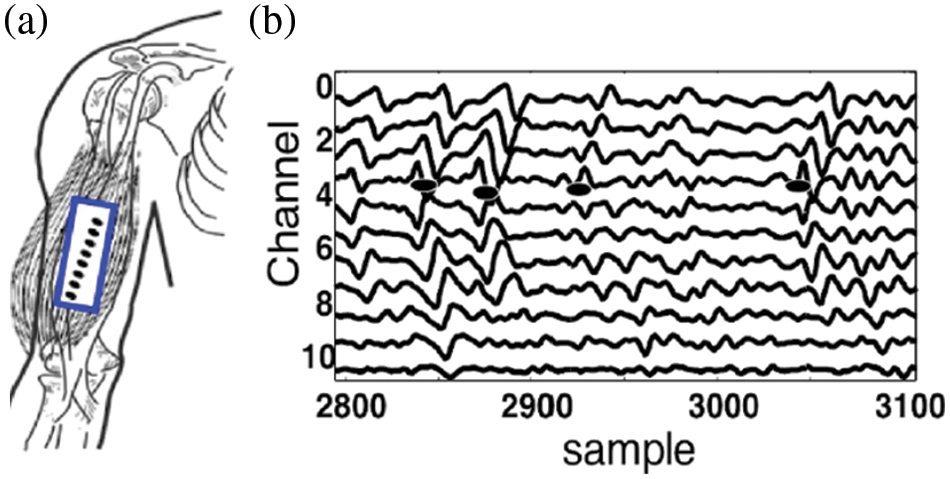
Figure 2: Experimental sEMG signals, recorded from short head Bicep Brachii muscle (a) using an array of 12 equally spaced electrodes with 10 mm inter-electrode distances, Isometric, 5 s, 50% maximal voluntary contraction measured for angles 75° (b) the 11 channels single differential EMG signal recorded from the Bicep muscle
2.2 Modified Mel Frequency Cepstral Coefficients (mMFCC)
MFCC are widely used as a popular tool in speech processing systems for the extraction of features of mel frequency from the vocal tract of the speaker [20]. Various modifications have been made to it due to its wide range of usability and adaptability such as the inclusion of delta-delta energies as features. In our work, we have modified MFCC in order to adjust its filter banks and frequency limiters to that of an EMG signal. By doing so, the filter banks are able to adapt to the frequencies of both clean and noisy channels and hence can distinguish between them. The parameters used for the proposed method mMFCC are shown in Tab. 1. Fig. 3 shows the mMFCC features extracted for a good as well as a bad channel. The diagonal covariance of the cepstral coefficients obtained is computed in order to reduce computational power in the training phase as well as increase the accuracy of the classification.
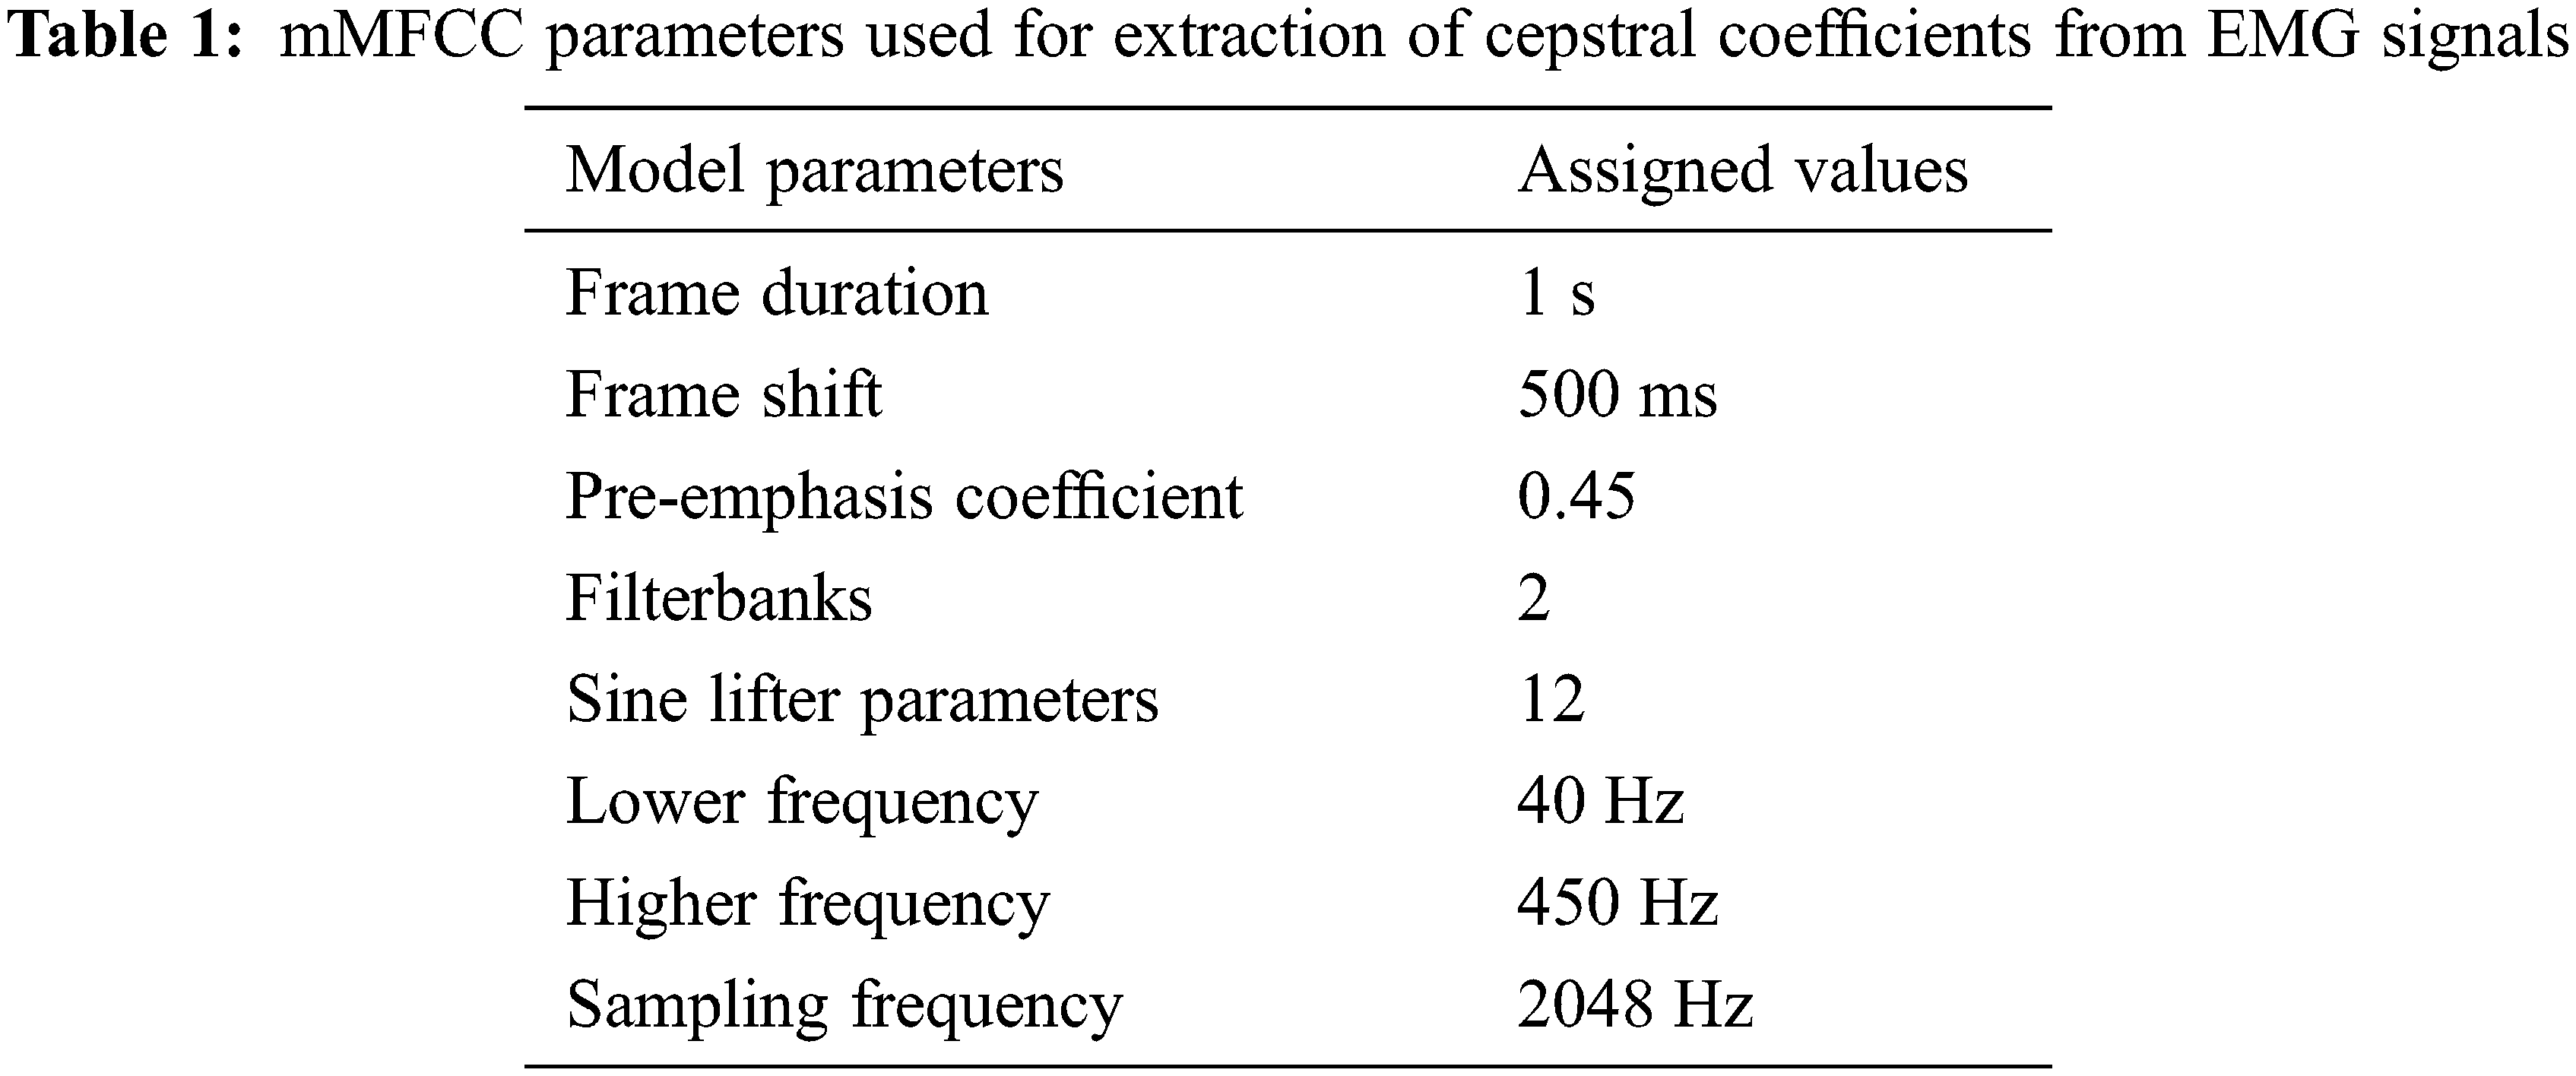
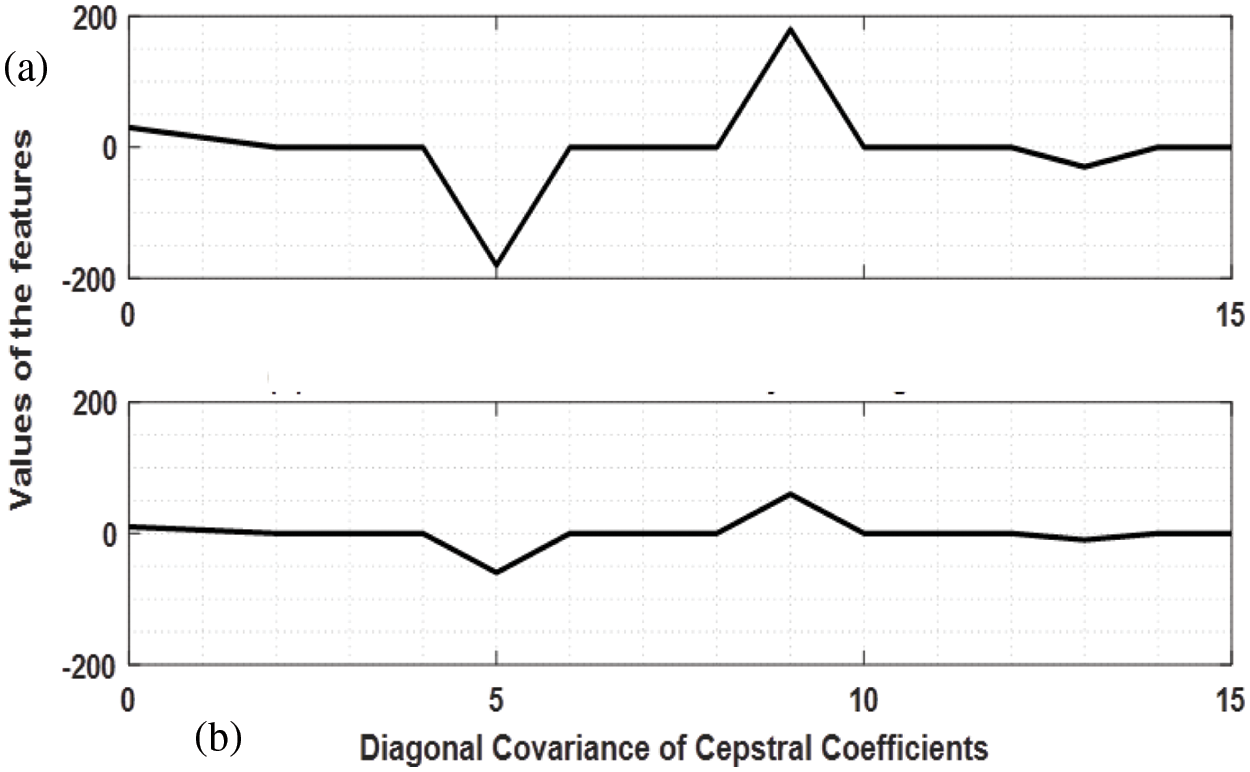
Figure 3: Modified MFCC features of a single-channel simulated EMG signal, a) mMFCC features for clean EMG, b) mFCC features for noisy EMG
The MFFC is modified by adding the following statistical features in each band. The features are discussed in detail as follows.
2.3.1 Root Mean Square (RMS) Value
Root Mean Square (RMS) is an amplitude indicator commonly used in the field of EMG, either in time or space. EMG RMS varies betwenn 0 to 1.6 mV [21]. Contaminated sEMG signals may have a greater RMS value. In case of movement artifact added to the EMG signal the RMS value significantly increases. For a simulated multi-channel EMG some of the channels like channels 2, channel 4, channel 8, and channel 13 are polluted with an electrocardiogram (ECG), electrode-movement artifact, power line interference, and a mixture of these noises with signal to noise ratio of 5 dB (see Fig. 4a), the corresponding RMS of the EMG channels is shown in Fig. 4b. It is evident from the results that noisy channels have RMS values higher than other channels. The Histogram of the RMS values is shown in Fig. 4c. The RMS value of the noisy channels is greater than the good channels as the noise is additive which increases the EMG amplitude thus increasing its RMS value.
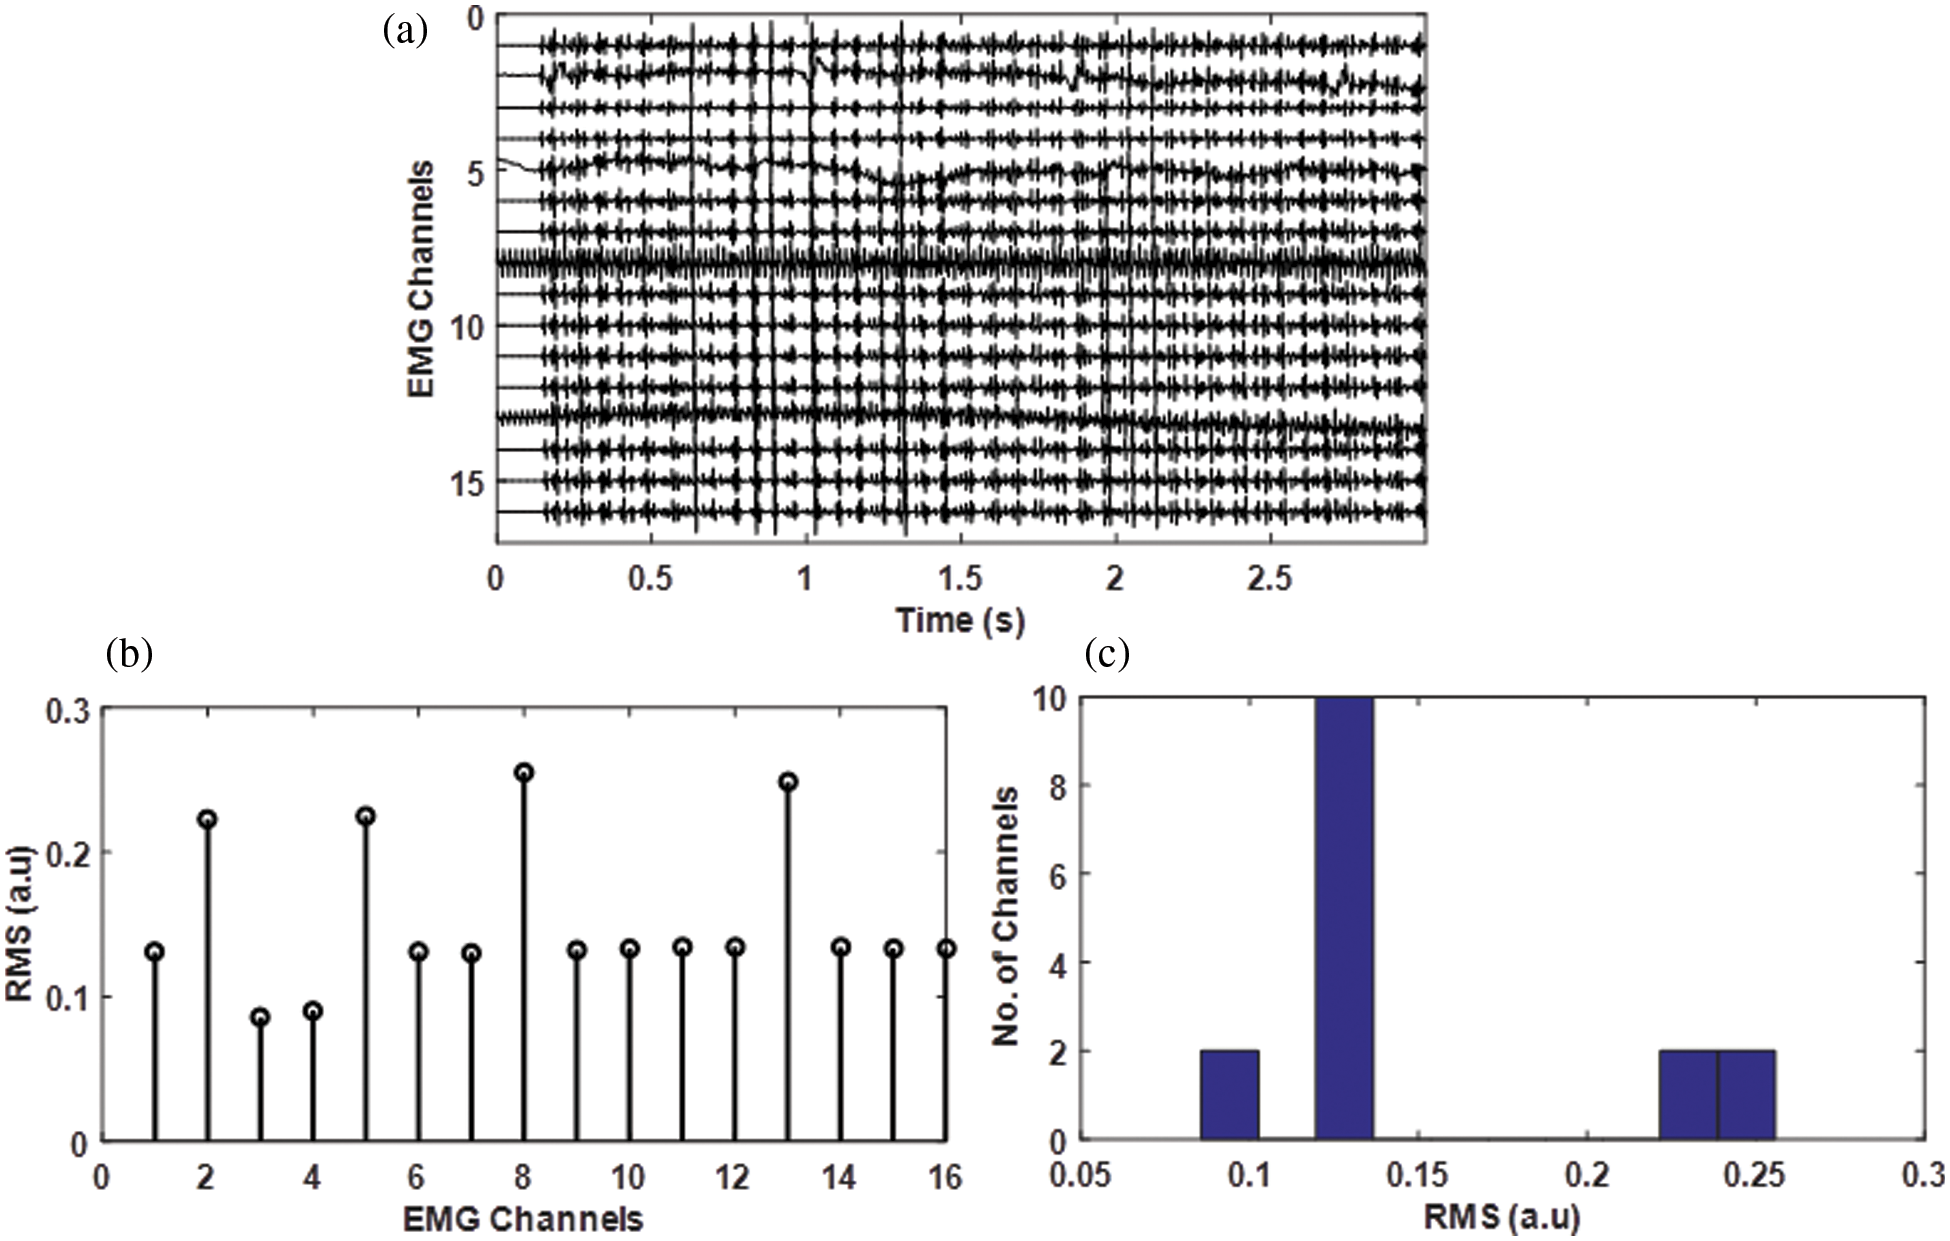
Figure 4: a) Simulated EMG signal having channel 2 contaminated by ECG artifact, channel 8 by Power liner interference, channel 13 by PLI, and wander wall artifact with a signal to noise ratio of 5 and 10 dB for all these channels, b) the corresponding RMS value of each channel, c) Histogram of the RMS values in (b)
HE is widely used for measuring the randomness of signals and is considered a degree of self-similarity. It indicates how the EMG signals are similar when its different segments are zoomed in or out in time [22,23]. HE can be estimated using a variety of algorithms available in the literature [24].
The HE, in this research study, is estimated using the absolute moment method described in [24]. The algorithm is also shown in Fig. 5. If X represents an EMG channel with a total of N samples, is decomposed in K subparts of length k with the total number of subparts K = N/k. For each subpart of the signal a collective series is calculated using Eqs. (1) and (2). Hurst Exponent for simulated EMG with noisy channels is shown in Fig. 6.
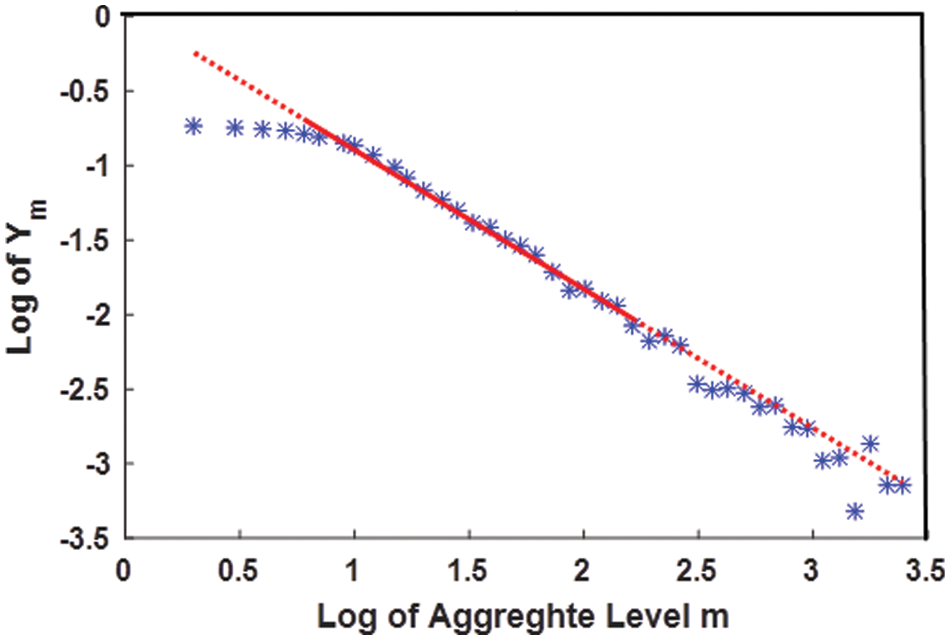
Figure 5: m vs. Ym logarithmic plot and the line linearly fitted to it. The HE is obtained from the slope of the line by adding one with it
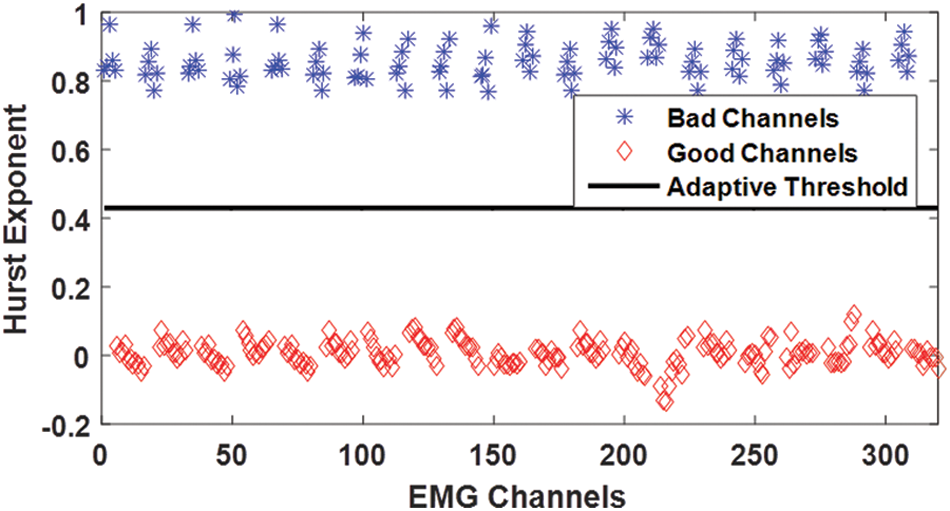
Figure 6: Hurst exponent for simulated EMG with noisy channels contaminated by power line and other noises having a signal to noise ratio of 5 dB
The Hurst Exponent is then approximated as,
Here,
To get a better insight into the value of HE for distinguishing between good and bad channels in the case of EMG signals, HE is computed for 20 sets of simulated signals, each consisting of 16 channel single differential EMG signal. The scatter plot shows that the values of the HE for good and bad channels have clearly distinct values and lie on the opposite sides of the mean value of HE and is a useful feature for detecting the noisy channels.
2.3.3 The Complexity Coefficient (CC)
Complexity coefficient (CC) is the ratio of the mobility coefficient (
For a sinusoid with peak amplitude A and frequency f given by
We also analyzed the CC for White Gaussian noise (WGN). It is independent of
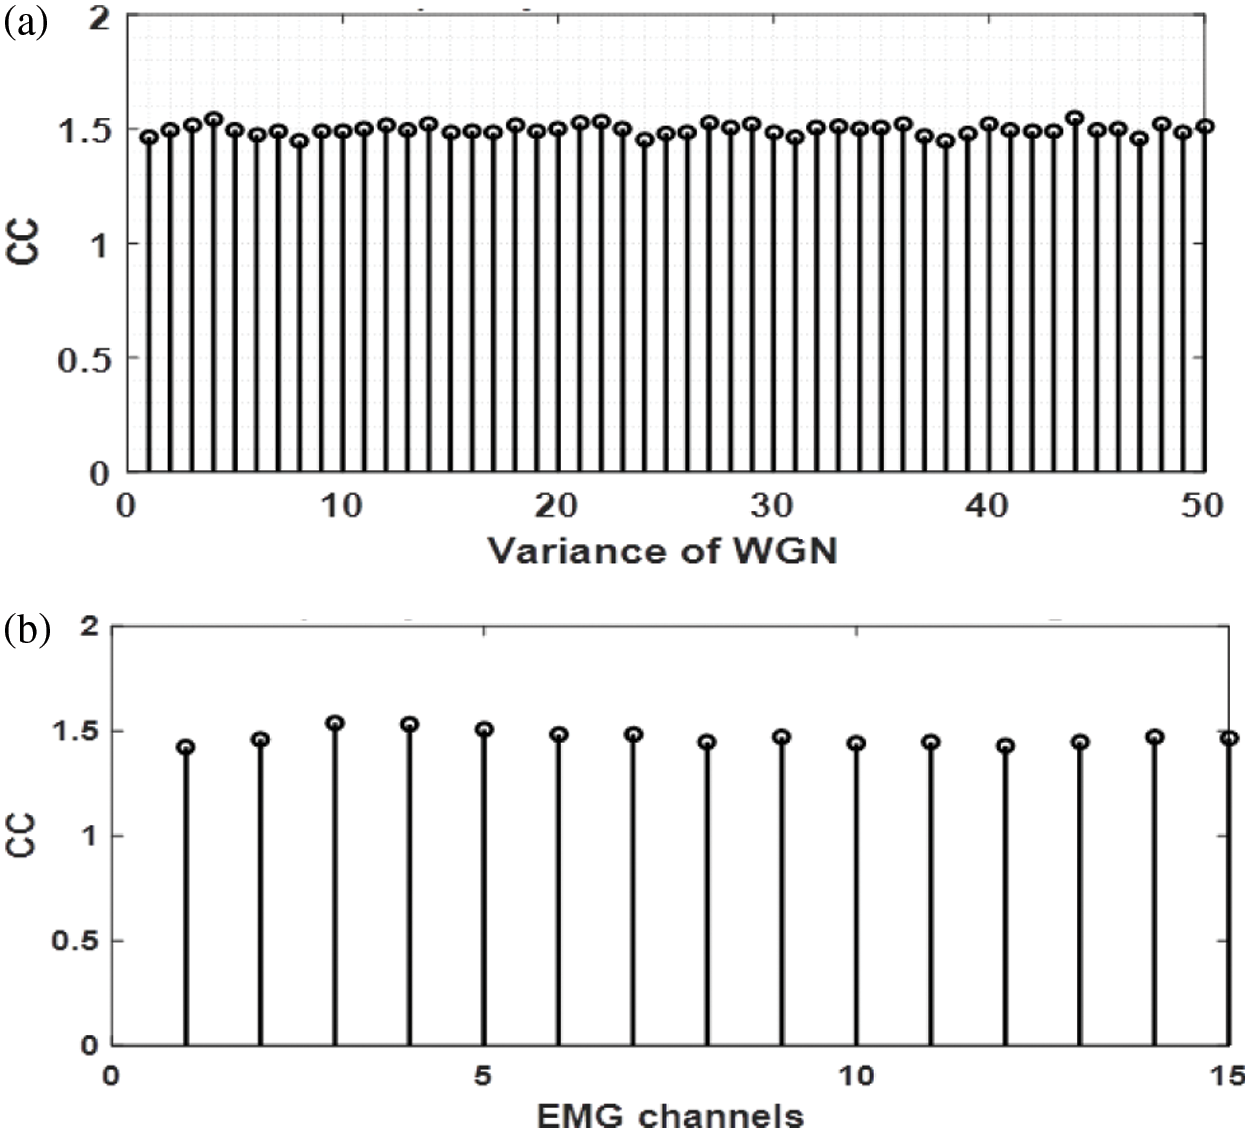
Figure 7: a) Values of CC computed for a multi-channel WGN, b) complexity coefficient of simulated EMG signal
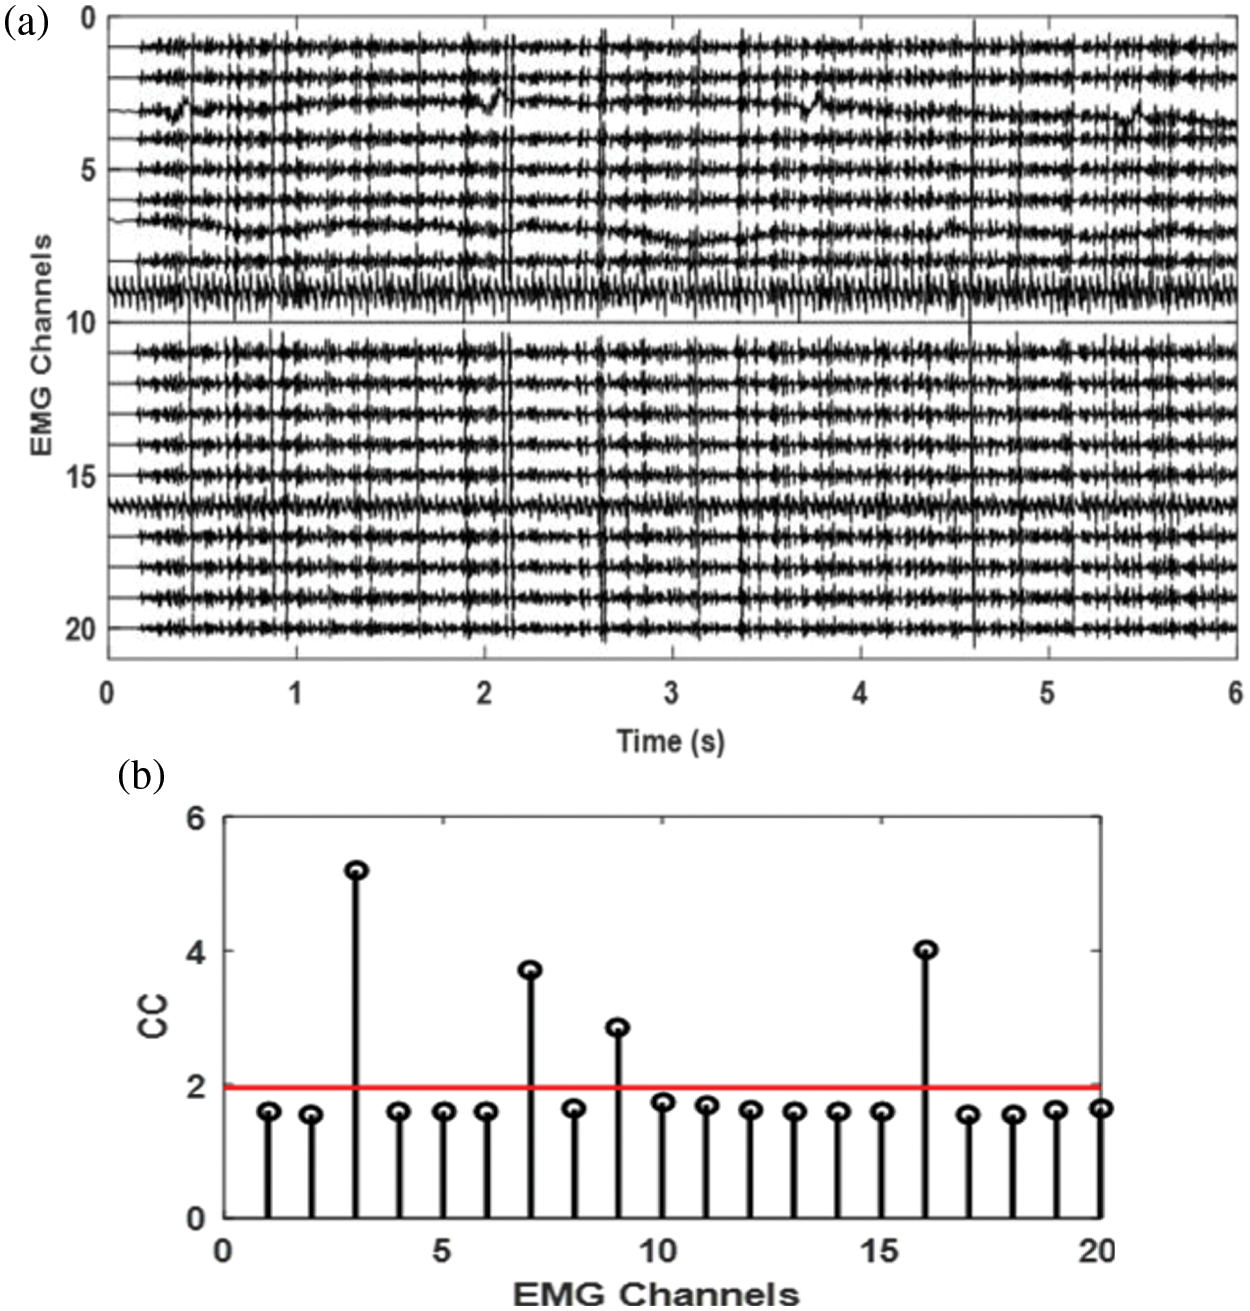
Figure 8: a) Simulated EMG signal with 4 channels contaminated with different noises, b) complexity coefficient of each channel
The Complexity Coefficient of a 15 channels experimental signal measured from Bicep Brachii with an interelectrode distance of 5 mm is also shown in Fig. 9. It can be seen from the values of the CC that these are like those of the CC values for simulated EMG. The CC values of the channels 7 and 8 deviate from the normal value of 1.8 as these two channels are contaminated by contact noise.
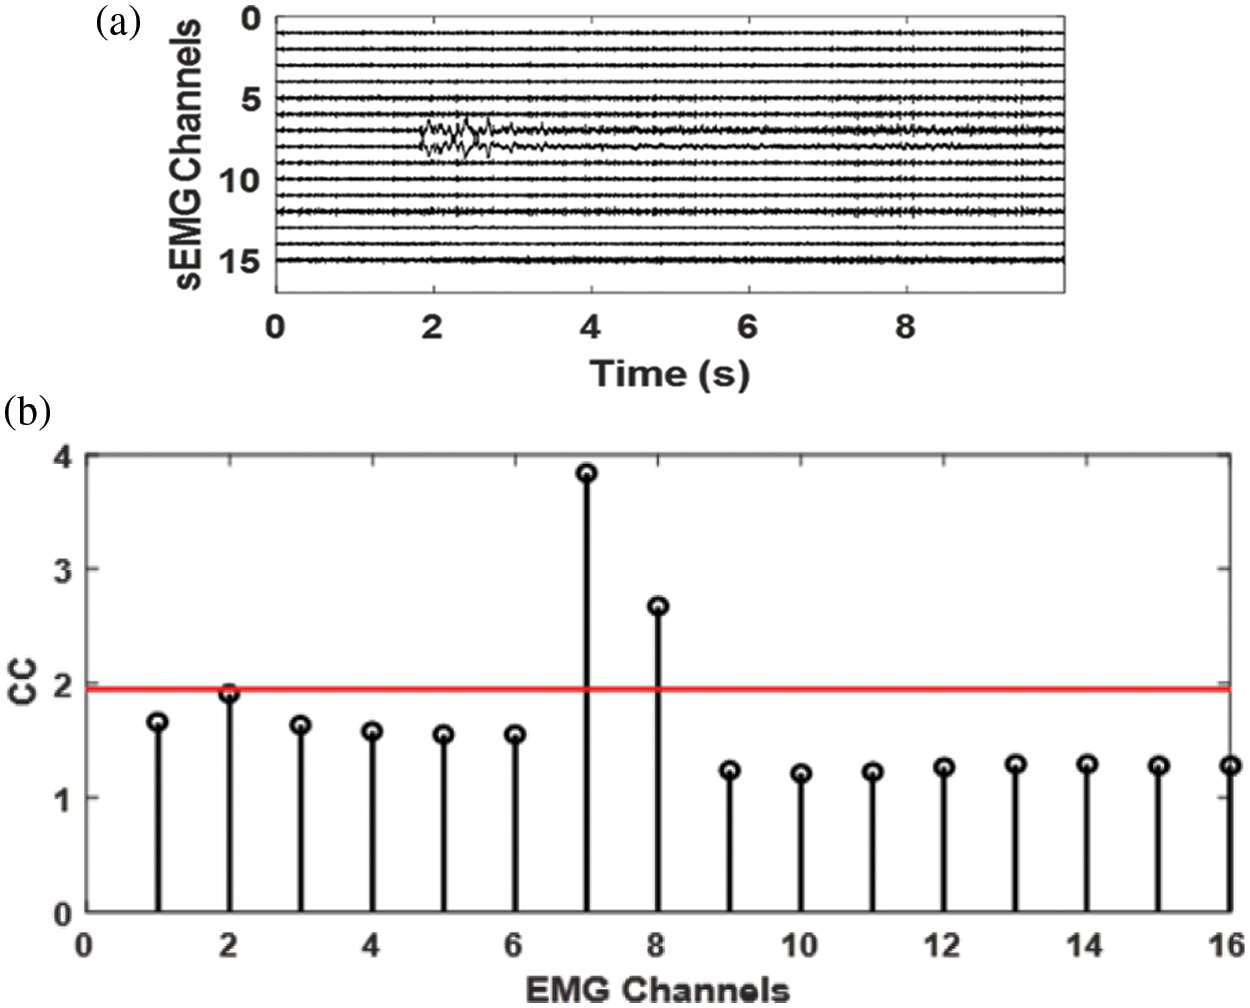
Figure 9: a) 15 channels SD EMG signal recorded from Bicep Brachii, b) the complexity coefficient of the signal in a, it is evident from the results that the noisy channels 7 and 8 have CC value totally different from the clean channels
We opt for the use of SVM based classifier because of its performance in real-time applications such as pattern recognition, image processing, data mining, etc [25]. Theoretically, SVM separates and distinguishes binary class data by using a separator known as a hyperplane in the feature space. Opposing to this, real-life signals are nonlinear in nature due to which, the classes are not linearly distributed, hence causing misclassifications. To overcome this, distinguishing features are selected by analyzing them in a scatter plot. In the case of extensive nonlinear data, the hyperplane can be modified with the help of a Lagrangian polynomial which acts as a kernel function to the hyperplane. By doing so, multiple hyperplanes can be introduced for data having classes greater than 2; drastically reducing the misclassification rate [26].
A novel method for automatic detection of outlier (noisy) EMG channels in multi-channel EMG acquisition system. To validate the performance of the automatic good-bad channels detection system, two sets of multi-channel EMG signal is used. For set 1, a total of 100 channels are randomly selected from 320 channels and are affected with random artifacts such as PLI, baseline drift, electrode movement, white noise, colored noise, etc. with varying SNRs from. Parameters including mMFCC, complexity coefficient, hurst exponent, and RMS are calculated for all 320 channels. These parameters are then arranged in the form of a dataset with dimensions of 320 ∗ 127 where 320 represents the total number of channels randomly arranged (both clean and noisy) and 127 represents the features extracted for each good and bad EMG channel.
SVM is used as our main classifier to which we fed this dataset of features extracted from 320 simulated single differential sEMG signals. We trained the SVM classifier using the quadratic kernel function with σ = 4 and cross-validation of 10. A total of 2 classes are defined in the dataset namely “Good” and “Bad”, referring to clean channel and noisy channel respectively. Our proposed algorithm achieved a training accuracy of 99.4% for the dataset described above. The confusion matrix of the predicted model is given in Fig. 10. A high degree of accuracy is achieved because of the well-placed features. From the confusion matrix it is also evident that the specificity and sensitivity of the proposed method are also very high.
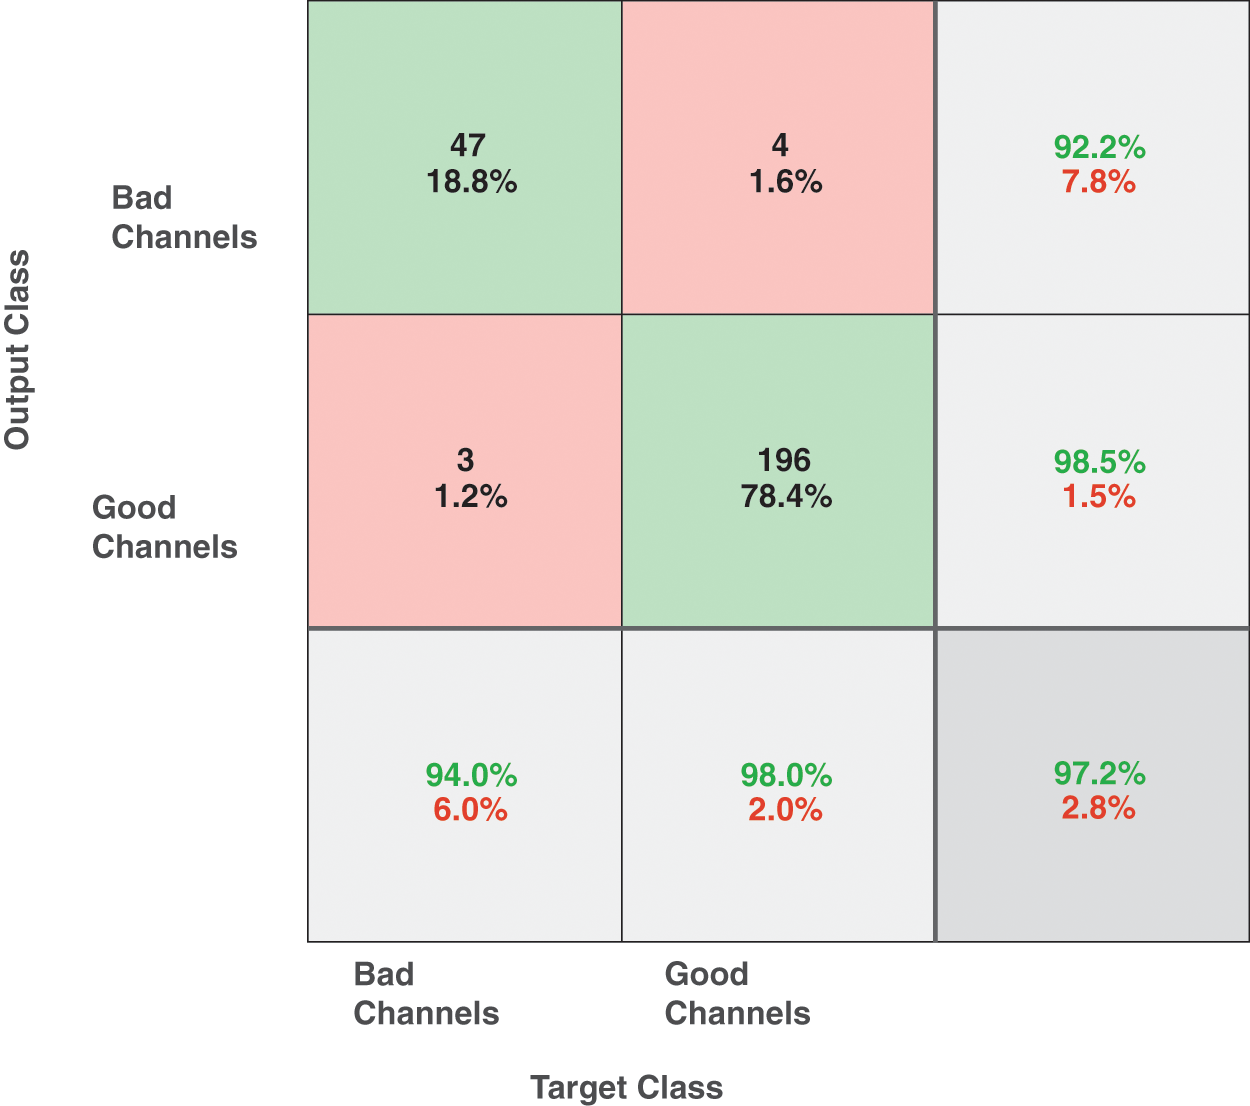
Figure 10: Confusion matrix of simulated sEMG signals using SVM. Confusion matrix of simulated EMG signals showing the actual and predicted classes using
For experimental signals as described in set 2, a total of 90 channels are randomly selected from 640 channels and the bad channels are identified by visual identification by experts having extensive experience of more than 10 years of analyzing the EMG signals. The dataset formed after feature extraction of these signals has dimensions 640 ∗ 127. For classification, SVM is used with a linear kernel function having cross-validation of 10. A total of 2 classes namely “Good” and “Bad” are defined. A training accuracy of 98.9% is achieved for the dataset composed of experimental signals from the Bicep Brachii muscle. The confusion matrix of the predicted model is given in Fig. 11.
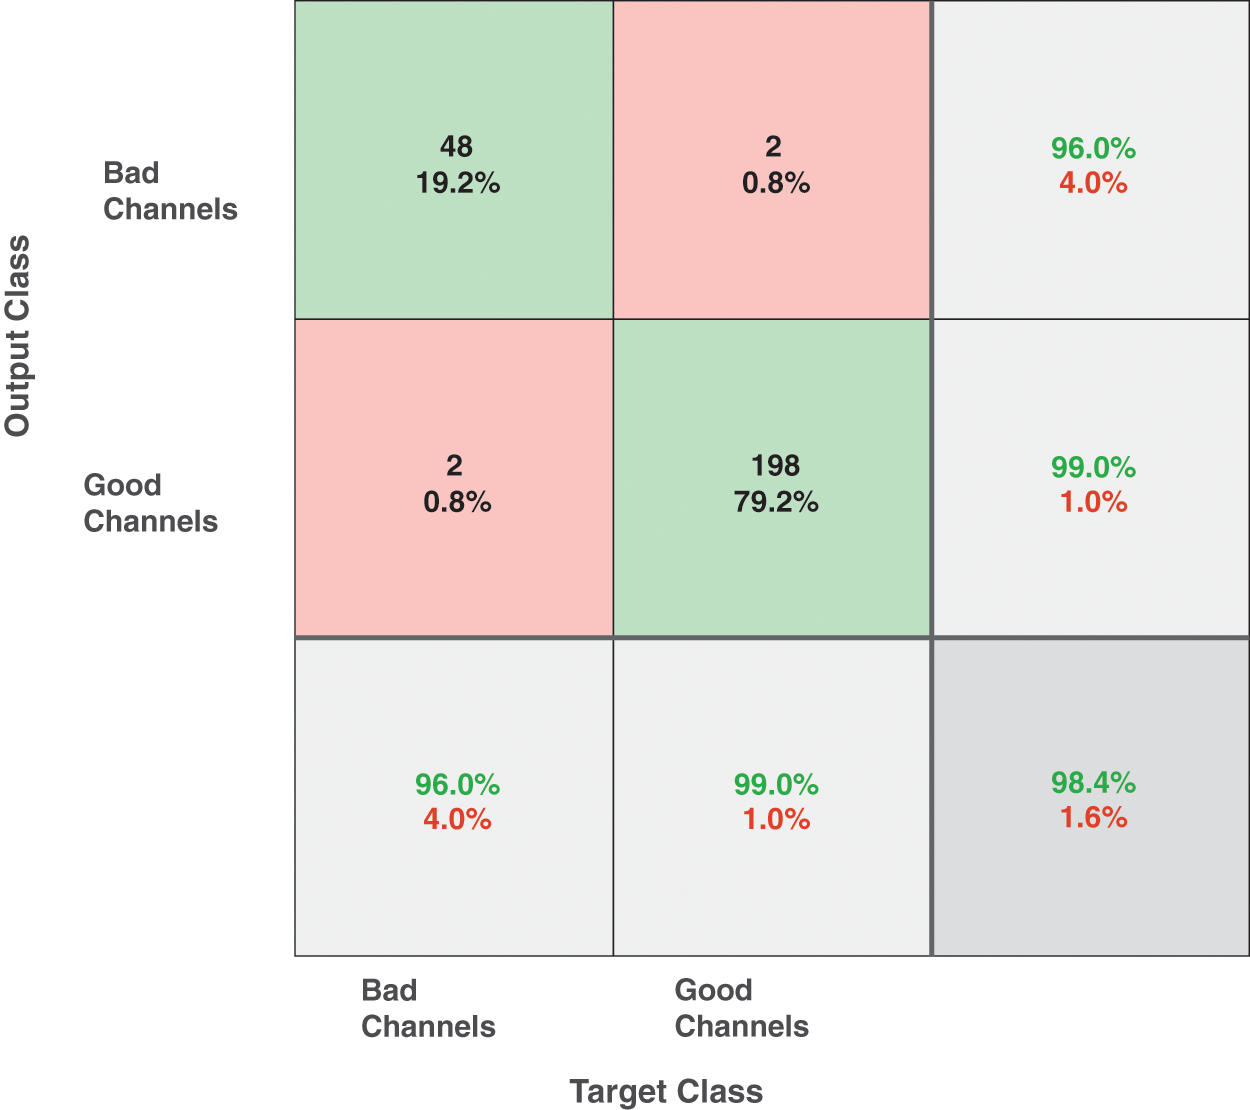
Figure 11: Confusion matrix of the proposed SVM classifier for automatic detection of good and bad channels in experimental sEMG signals
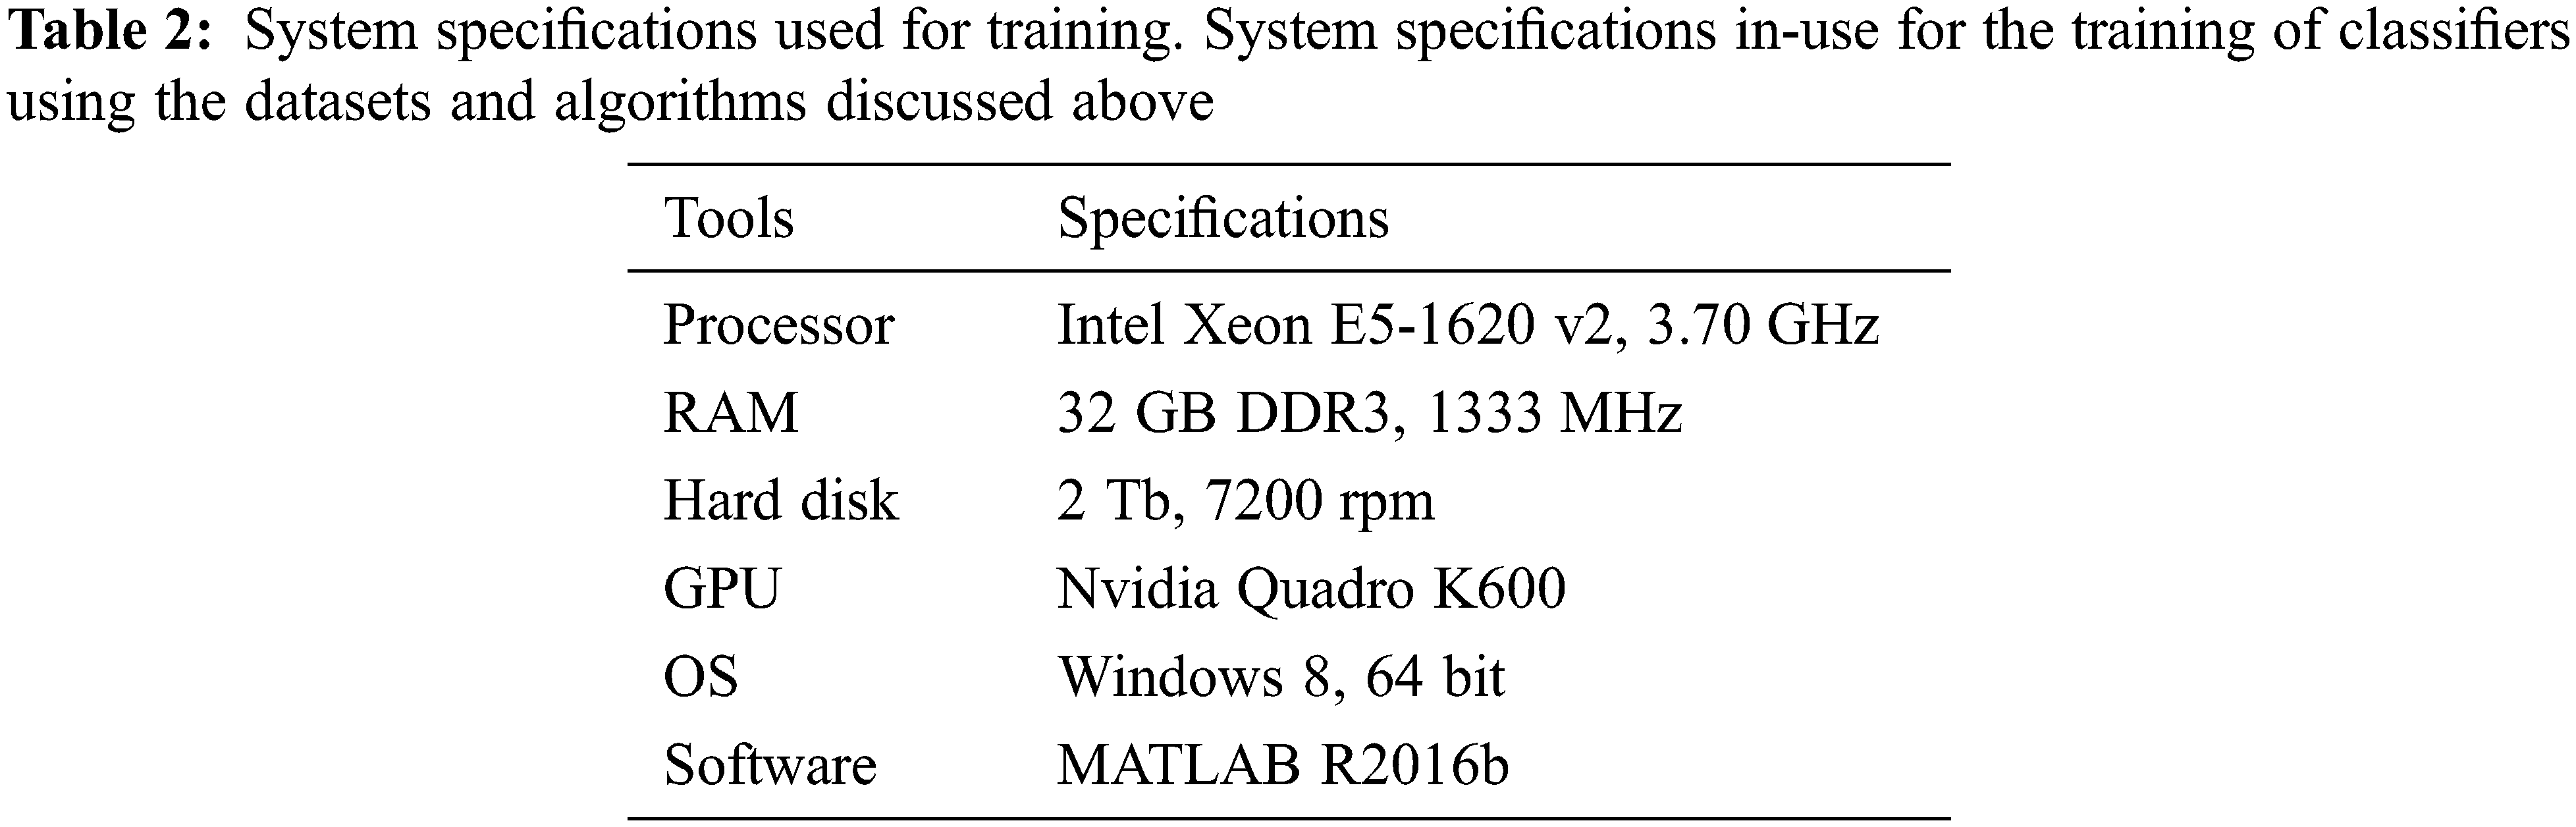
For comparative-based analysis, we put forth our datasets to various other classifiers such as a complex tree, logistic regression, subspace discriminant, and ensemble bagged trees (bootstrap aggregating). The specifications of the system as well as the tools used by which the training of these datasets was carried out for every classifier are given in Tab. 2. Our comparison results as shown in Tabs. 3 and 4, are based upon the accuracy achieved, the prediction speed as well as the training time of every classifier on the same set of data.
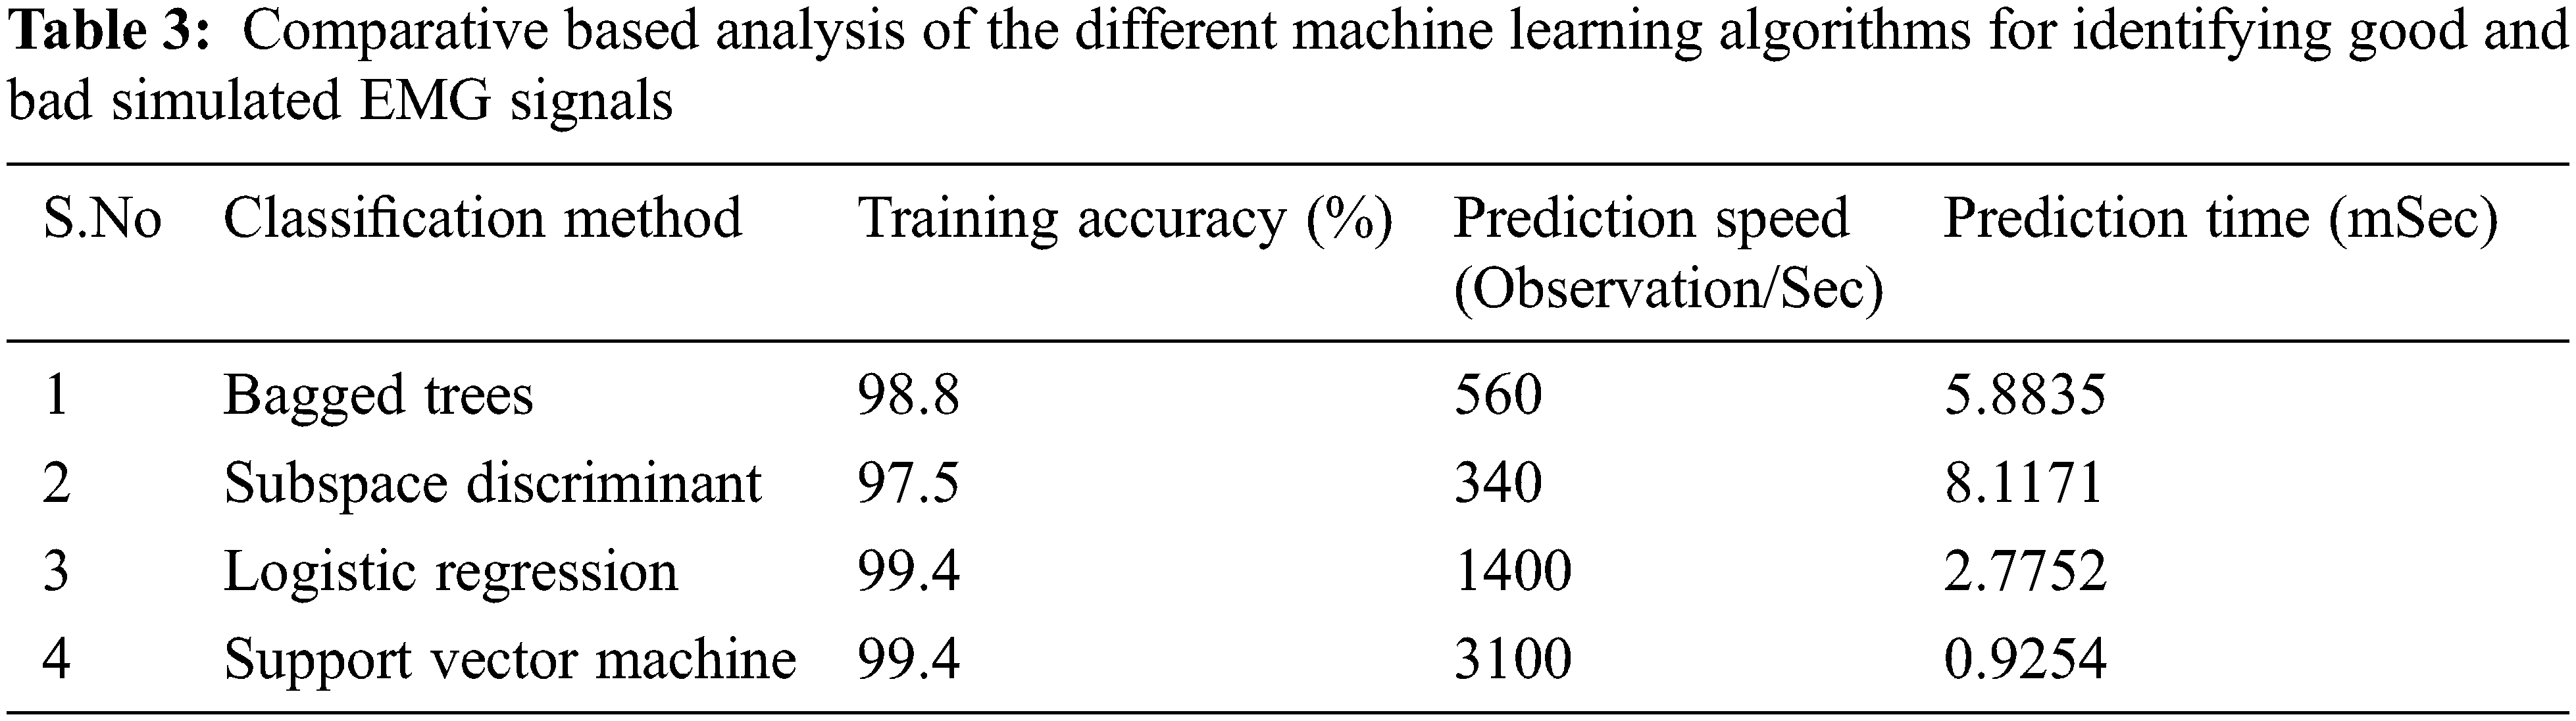
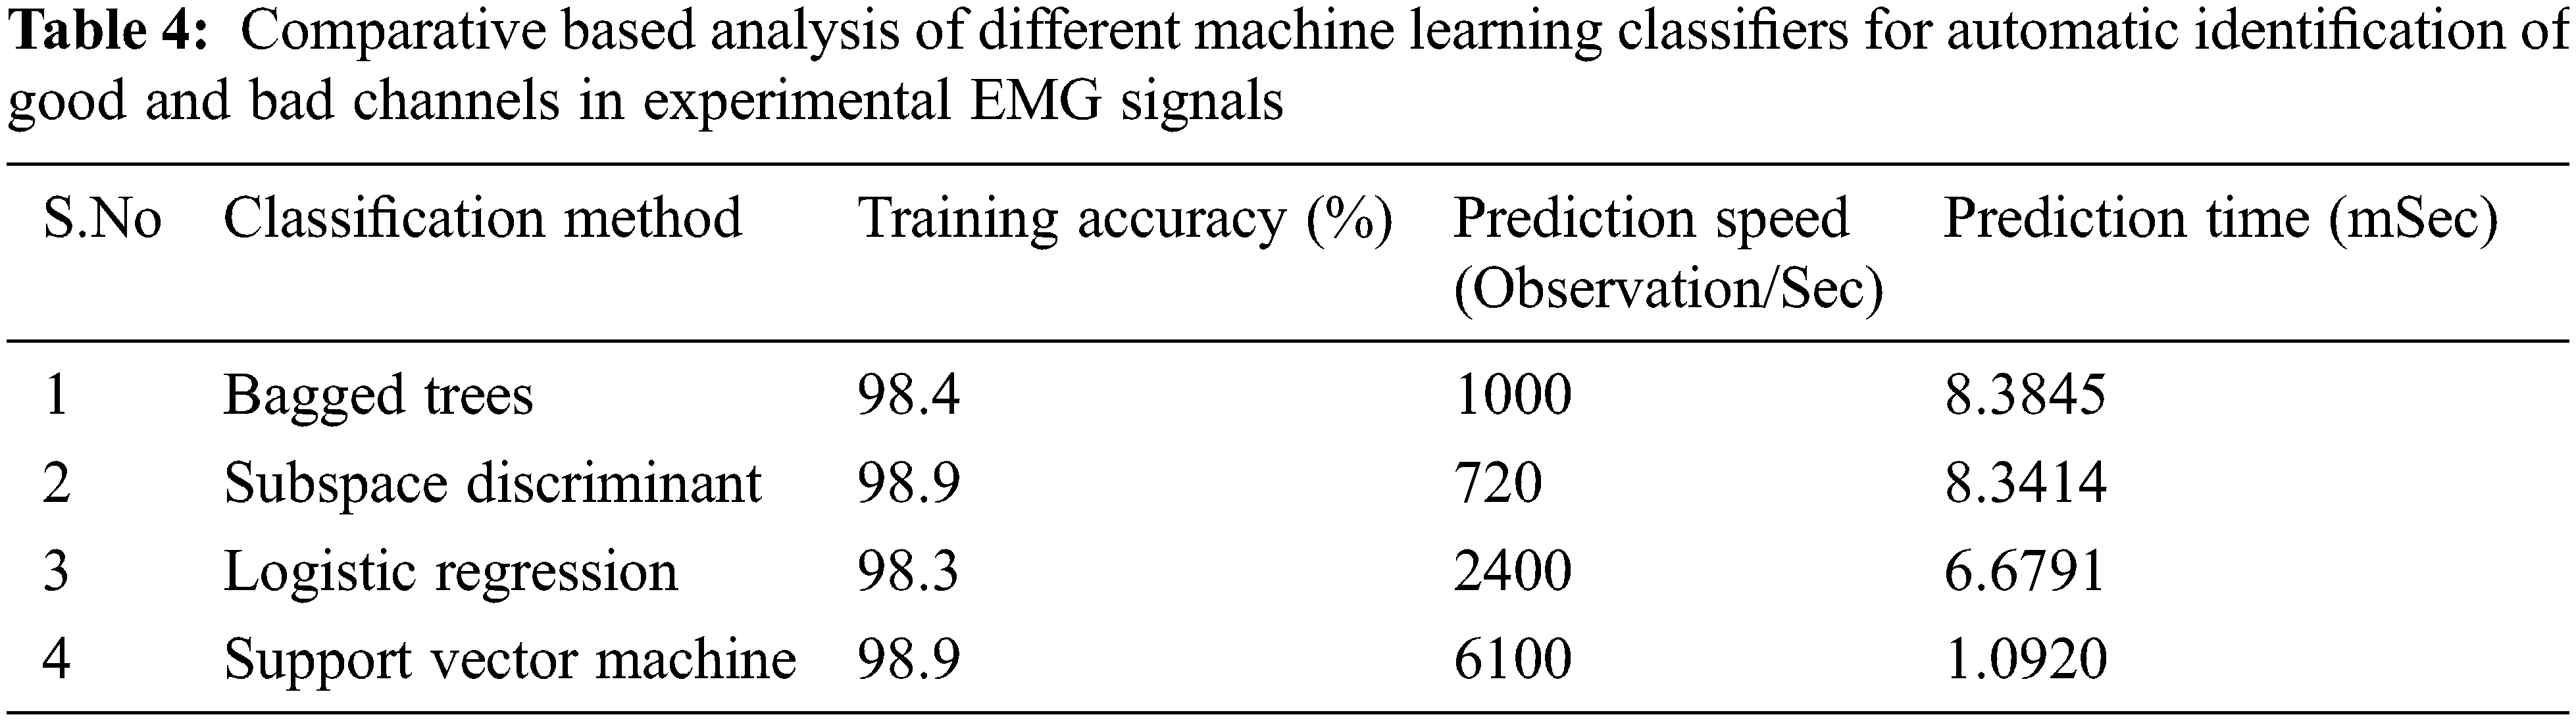
Clearly from Tabs. 3 and 4, SVM gives the overall best classification as compared to other classifiers. Also, it should be noted that the accuracy for every classifier is almost similar. This is because of the fact that the features extracted using our algorithm are very well placed and are hence easily distinguishable by all classifiers. Since SVM takes minimum time to train, it gives very high accuracy and makes the most observations/sec, we conclude that our proposed method is highly suitable to be used in real-time situations both for simulated as well as for experimental signals.
In this paper a new method is proposed for the automatic detection of noisy channels. The new method based on MFCC and SVM outperformed both computer-generated and experimental EMG signals by detecting both the clean and the noisy channels. To make sure proper acquisition of EMG signals for later use in different applications like healthcare, muscle anatomy, and physiology study, this algorithm will be helpful in assuring the quality of the acquired signals. In the future, we will use other traditional machine learning classifiers and deep learning frameworks like Convolutional Neural Networks and Recurrent Neural Networks for detecting the bad channels and also detect the type of noise present in the signals so an accurate attenuation method may be applied in real-time to clean the signals also.
Acknowledgement: The authors acknowledge the support from the Deanship of Scientific Research, Najran University. Kingdom of Saudi Arabia, for funding this work under the research groups funding program Grant Code Number (NU/RG/SERC/11/3).
Funding Statement: The authors acknowledge the support from the Deanship of Scientific Research, Najran University. Kingdom of Saudi Arabia, for funding this work under the research groups funding program Grant Code Number (NU/RG/SERC/11/3).
Conflicts of Interest: The authors declare that they have no conflicts of interest to report regarding the present study.
References
1. R. H. Chowdhury, M. B. Reaz, M. A. Ali, A. A. Bakar, K. Chellappan et al., “Surface electromyography signal processing and classification techniques,” Sensors, vol. 13, no. 9, pp. 12431–12466, 2013. [Google Scholar]
2. E. W. Minium and R. Clarke, Elements of Statistical Reasoning, 1st ed., vol. 1. New York, USA: John Wiley & Sons Incorporation, pp. 10158–10168, 1982. [Google Scholar]
3. P. J. Rousseeuw and A. M. Leroy, Robust Regression and Outlier Detection, 1st ed., vol. 589. New York, USA: John Wiley & Sons, pp. 1–10, 2005. [Google Scholar]
4. V. Hodge and J. Austin, “A survey of outlier detection methodologies,” Artificial Intelligence Review, vol. 22, no. 2, pp. 85–126, 2004. [Google Scholar]
5. D. M. Hawkins, Identification of Outliers, 1st ed., vol. 11. London, U.K: Chapman and Hall, pp. 25–45, 1980. [Google Scholar]
6. P. C. Mahalanobis, “On the generalized distance in statistics,” in Proc. of the National Institute of Sciences, Calcutta, India, pp. 49–55, 1936. [Google Scholar]
7. K. I. Penny and I. T. Jolliffe, “A comparison of multivariate outlier detection methods for clinical laboratory safety data,” Journal of the Royal Statistical Society: Series D (the Statistician), vol. 50, no. 3, pp. 295–307, 2001. [Google Scholar]
8. M. M. Breunig, H. P. Kriegel, R. T. Ng and J. Sander, “LOF: Identifying density-based local outliers,” Association for Computing Machinery Sigmod Record, vol. 29, no. 1, pp. 93–104, 2000. [Google Scholar]
9. H. P. Kriegel, P. Kroger, E. Schubert and A. Zimek, “LoOP: Local outlier probabilities,” in Proc. of the 18th Association for Computing Machinery Conf. on Information and Knowledge Management, New York, NY, United States, pp. 1649–1652, 2009. [Google Scholar]
10. K. Zhang, M. Hutter and H. Jin, “A new local distance-based outlier detection approach for scattered real-world data,” in Pacific-Asia Conf. on Knowledge Discovery and Data Mining, Springer, Berlin, Heidelberg, pp. 813–822, 2009. [Google Scholar]
11. M. S. Mabrouk and O. A. Kandil, “Surface multi-purposes low power wireless electromyography (EMG) system design,” International Journal of Computer Applications, vol. 41, no. 1, pp. 6–10, 2012. [Google Scholar]
12. R. McGill, J. W. Tukey and W. A. Larsen, “Variations of box plots,” The American Statistician, vol. 32, no. 1, pp. 12–16, 1978. [Google Scholar]
13. P. J. Rousseeuw, I. Ruts and J. W. Tukey, “The bagplot: A bivariate boxplot,” The American Statistician, vol. 53, no. 4, pp. 382–387, 1999. [Google Scholar]
14. K. M. Goldberg and B. Iglewicz, “Bivariate extensions of the boxplot,” Technometrics, vol. 34, no. 3, pp. 307–320, 1992. [Google Scholar]
15. H. R. Marateb, M. Rojas-Martınez, M. M. Villanueva and R. Merletti, “Robust outlier detection in high-density surface electromyographic signals,” in Engineering in Medicine and Biology Society (EMBCAnnual Int. Conf. of the IEEE, pp. 4850–4853, Buenos Aires, Argentina. 2010. [Google Scholar]
16. H. R. Marateb, M. Rojas-Martınez, M. Mansourian, R. Merletti and M. A. Villanueva, “Outlier detection in high-density surface electromyographic signals,” Medical & Biological Engineering & Computing, vol. 50, no. 1, pp. 79–89, 2012. [Google Scholar]
17. D. Farina and R. Merletti, “A novel approach for precise simulation of the EMG signal detected by surface electrodes,” IEEE Transactions on Biomedical Engineering, vol. 48, no. 6, pp. 637–646, 2001. [Google Scholar]
18. K. Ullah, S. khalid Shah, “Automatic detection of noisy signals in sEMG grids using statistical thresholding,” Proceedings of Pakistan Academy of Sciences, vol. 58, no. 1, pp. 61–70, 2021. [Google Scholar]
19. U. Barone and R. Merletti, “Design of a portable, intrinsically safe multichannel acquisition system for high-resolution, real-time processing HD-sEMG,” IEEE Transactions on Biomedical Engineering, vol. 60, no. 8, pp. 2242–2252, 2018. [Google Scholar]
20. W. Han, C. F. Chan, C. S. Choy and K. P. Pun, “An efficient MFCC extraction method in speech recognition,” In Circuits and Systems, ISCAS Proc. IEEE Int. Symp. on, IEEE, pp. 4–6, Kos International Convention Centre (KICCIsland of Kos, Greece, 2006. [Google Scholar]
21. E. Lukhanina, I. Karaban, and N. Berezetskaya, “Diagnosis of Parkinson’s disease by electrophysiological methods,” in Diagnostics and Rehabilitation of Parkinson’s Disease. London, United Kingdom: IntechOpen, 2011. [Online]. Available: https://www.intechopen.com/chapters/24451https://doi.org/10.5772/17761. [Google Scholar]
22. W. Willinger, V. Paxson and M. S. Taqqu, “Self-similarity and heavy tails: Structural modeling of network traffic,” A Practical Guide to Heavy Tails: Statistical Techniques and Applications, vol. 23, no. 1, pp. 27–53, 1998. [Google Scholar]
23. C. K. Peng, S. V. Buldyrev, S. Havlin, M. Simons, H. E. Stanley et al., “Mosaic organization of DNA nucleotides,” Physical Review, vol. 49, no. 2, pp. 1685–1696, 1994. [Google Scholar]
24. E. A. Clancy and N. Hogan, “Probability density of the surface electromyogram and its relation to amplitude detectors,” IEEE Transactions on Biomedical Engineering, vol. 46, no. 6, pp. 730–739, 1999. [Google Scholar]
25. M. M. Adankon and M. Cheriet, “Support vector machine,” in Encyclopedia of Biometrics. Boston, MA: Springer, 2015. [Online]. Available: https://doi.org/10.1007/978-1-4899-7488-4_299. [Google Scholar]
26. A. B. Chan, N. Vasconcelos and G. R. Lanckriet, “Direct convex relaxations of sparse SVM,” in Proc. of the 24th Int. Conf. on Machine Learning Association for Computing Machinery, New York, NY, United States, pp. 145–153, 2007. [Google Scholar]
Cite This Article
 Copyright © 2023 The Author(s). Published by Tech Science Press.
This work is licensed under a Creative Commons Attribution 4.0 International License , which permits unrestricted use, distribution, and reproduction in any medium, provided the original work is properly cited.
 Downloads
 Citation Tools