
 Submit a Paper
 Propose a Special lssue
 Open Access
ARTICLE
Improved Ant Colony Optimization and Machine Learning Based Ensemble Intrusion Detection Model
1 Anna University, Chennai, 600025, India
2 Department of Computer Science and Engineering, Kongu Engineering College, Erode, 638060, India
* Corresponding Author: S. Vanitha. Email:
Intelligent Automation & Soft Computing 2023, 36(1), 849-864. https://doi.org/10.32604/iasc.2023.032324
Received 14 May 2022; Accepted 06 July 2022; Issue published 29 September 2022
 View Full Text
 Download PDF
Abstract
Internet of things (IOT) possess cultural, commercial and social effect in life in the future. The nodes which are participating in IOT network are basically attracted by the cyber-attack targets. Attack and identification of anomalies in IoT infrastructure is a growing problem in the IoT domain. Machine Learning Based Ensemble Intrusion Detection (MLEID) method is applied in order to resolve the drawback by minimizing malicious actions in related botnet attacks on Message Queue Telemetry Transport (MQTT) and Hyper-Text Transfer Protocol (HTTP) protocols. The proposed work has two significant contributions which are a selection of features and detection of attacks. New features are chosen from Improved Ant Colony Optimization (IACO) in the feature selection, and then the detection of attacks is carried out based on a combination of their possible properties. The IACO approach is focused on defining the attacker’s important features against HTTP and MQTT. In the IACO algorithm, the constant factor is calculated against HTTP and MQTT based on the mean function for each element. Attack detection, the performance of several machine learning models are Distance Decision Tree (DDT), Adaptive Neuro-Fuzzy Inference System (ANFIS) and Mahalanobis Distance Support Vector Machine (MDSVM) were compared with predicting accurate attacks on the IoT network. The outcomes of these classifiers are combined into the ensemble model. The proposed MLEID strategy has effectively established malicious incidents. The UNSW-NB15 dataset is used to test the MLEID technique using data from simulated IoT sensors. Besides, the proposed MLEID technique has a greater detection rate and an inferior rate of false-positive compared to other conventional techniques.Keywords
In daily life, IoT is becoming increasingly common because it connects the objects with the Internet. Smart devices of the modern century not only includes wearable devices, cameras, smart lighting, but also house-hold appliances such as washers, refrigerators, house doors are associated to the internet that plays a major role in IoT ecosystem [1]. Over the last decade, the increase of sensor technology has allowed the stuff to expand exponentially and take on mass. By 2018, 11.8 billion objects are planned to be connected to the Internet [2]. Across fields such as intelligent transport, industrial automation [3], IoT provides tremendous commercial and industrial opportunities.
In the internet protocol model, network protocols such as HTTP, Domain name system (DNS) and MQTT are used by IOT services. Network systems are split into four layers which have dissimilar protocols and are communicated with the respective peers on another network [4]. The MQTT protocols is frequently used to bring out the messages received low bandwidth devices on unreliable networks [5]. The two basic services of IOT applications are DNS and HTTP protocol because the internet directly with user data. The aim of the DNS protocol is to avoid conflicts between assigned domain names and to facilitate user friendly computer services and devices. A structural Hypertext format involving hyperlinks to other hypertext document is swapped and carried by HTTP protocol, and one response mechanism which depends on the client server model is utilized by this HTTP protocol.
With this exponential growth in protocols, protecting those devices from cyber-attacks is becoming increasingly important. If not, the control of machines and aside from breaching privacy, sensitive stuff is easily to be taken by malicious users or attackers. Another issue is that IoT systems either have no or no device-level security features and is not feasible in shielding more heterogeneous IoT devices at the network level. IoT networks are vulnerable to various security threats, like Distributed Denial-of-Service (DDoS) threats and Worm, Reconnaissance, Backdoor attacks and Denial-of-Service (DoS).
Conventional security techniques can’t be tired directly to secure IoT systems due to intrinsic resource and computational limits [6]. A botnet is one of the main threats targeting various protocols especially networks such as MQTT, DNS, HTTP by expelling the targets hosts using previous exploitation techniques. The working principle of bot is a self-promotion malware that affect conceded customers after triggering, built to perform intrusive tasks. The methods of Intrusion Detection System (IDS) have been introduced for defending IoT cyber-attacks, which recognize malicious activities [7].
The Bro-IDS tool [8] is used to capture core flows and basic protocol information. Bro comes from the Orwellian origins of “Big Brother.” A new extractor module is also developed that functions concurrently using the tool called Bro-IDS to produce further transactional flow statistical features which can’t be produced using existing flow analysis tools. Nonetheless, all of these have a common drawback, as each can only combine one attribute at a time. It raises network overhead while running network analytics [9]. However the optimal selection features from the flow analysis also becomes major difficult task. Component selection enables screen space to be reduced, which is crucial in reducing the training time and improving the prediction accuracy. Ant Colony Optimization (ACO) [10] was contrasted with other well-known methods for selecting features in a sample.
The main contributions in the research are given as follows: Database is created for protocols using the proposed UNSW-NB15 features and sensor network traffic linked to the IoT hub to assess their properties on the classification of usual and suspect instances. The set of attributes from flow identities of the MQTT and HTTP is proposed to establish successful IDS to detect attacks that violate these protocols on the network application. To determine the impact of selected features from Improved Ant Colony Optimization (IACO) to effectively detect malicious events, a Machine Learning Based Ensemble Intrusion Detection (MLEID) is suggested. The experimental outcomes indicate that using the measure of precision, the selected features have the possible characteristics of natural and malicious behavior.
Chen et al. [11] designed one process for combining various techniques like 1) real-estimation and baseline security tests for anticipating and avoiding possible cyber-attacks 2) multi-optimization process for selecting best active solution to execute countermeasures while preserving device functions and 3) data analysis for identifying and differentiating attacks. Experimental results indicate that this theoretical solution successfully defends a Web-based program with little to no human interference against known and unknown attacks.
Within the IOT Gateway, Canedo et al. [12] suggested machine learning to protect the system. Investigate the use of an anomaly in the data transmitted from the edge systems within the gateway by the Artificial Neural Network (ANN). It is convinced that approach is capable of enhancing IoT device security. Hodo et al. [13] focused on categorizing the standard and threat methods of the IOT networks. The ANN procedure is validated against the network being simulated with IoT. A range of DDoS/DoS attacks can be successfully detected via this job. It can be adapted to lesser number of attacks detection.
In order to detect and avoid suspicious activities and attacks at the earliest possible date, Bhunia et al. [14] have developed a secure IoT architecture based on Software-Defined Networking (SDN). In the SDN controller, machine learning is used to monitor and enhance IoT system operation over time. The Mininet simulator tests in the IoT system are conducted. Increased time complexity of the classification system than the other methods.
For identifying malicious traffic, Thamilarasu et al. [15] have proposed a deep-learning algorithm in IoT networks. The detection solution gives security as a service and allows compatibility in the middle of the different network communication protocols that are applied in IoT. Experimental results show that intrusions in the real world are successfully identified by the experimental intrusion detection system. Doesn’t support the attacks like cloning of device ID, spoofing, and sybil attacks.
Bakhsh et al. [16] introduced an Integrated Intrusion Detection and Prohibition Program for the Internet of Things (IDPIoT) to improve protection and expand the range of devices connecting with the Internet. The main objective is to enforce one crucial aspect of defense, the IDP program. The proposed IDPIoT improves stability, including host-based and network-based capabilities, by analyzing current intrusion detection mechanisms. Proposed system, prevention agents drop the mistrustful packet and block the source through providing real-time mitigation of attacks and isolation of the servers.
Fu et al. [17] suggested, standard intrusion detection, before that he examined the intrusion detection of IOT networks. The IOT attacks is identified and announced by the suggested method with three types: automatic response-attack, Jam-attack, and false-attack. Plan a investigation to test the suggested solution to IDS and research the attack against the Remote Authentication Dial-In User Service (RADIUS).
Kasongo et al. [18] used the XGBoost algorithm to present a filter-based feature reduction approach. For classification, machine learning techniques such as Support Vector Machine (SVM), k-Nearest-Neighbor (kNN), Logistic Regression (LR), Artificial Neural Network (ANN), and Decision Tree (DT) have been developed. The results showed that using the XGBoost-based feature selection method, methods like the DT can improve their binary classification scheme test accuracy from 88.13% to 90.85%. Increases the detection rate of the minority classes in XGBoost algorithm.
Wang et al. [19] suggested a botnet identification (DBod)-based Domain Generation Algorithm (DGA) based on an interpretation of the DNS traffic request performance. The suggested plan exploit the reality, that the similar set of domain in thi domain list is asked by the host infected by the DGA-based malware, and only limited domains are currently affiliated with working command and control (C&C), due to this most of the queries failed. The findings demonstrate that DBod offers a reliable and efficiently identifies current and new DBod on real-world networks.
Moualla et al. [20] proposed a scalable multiclass machine learning-based network IDS. It starts with the Synthetic Minority Oversampling Technique (SMOTE) method and then selects the important features for each class existing in the dataset by the Gini Impurity criterion using the Extremely Randomized Trees Classifier (Extra Trees Classifier). Finally, the ELM classifier outputs become the inputs to a fully connected layer in order to learn from all their combinations, followed by a logistic regression layer to make soft decisions for all classes. Results show that proposed system performs better than related works in terms of accuracy, false alarm rate, Receiver Operating Characteristic (ROC), and Precision-Recall Curves (PRCs).
Azmoodeh et al. [21] proposed an artificial intelligence approach to find battlefield items (IoBT) virus in internet via operational code (OpCode) application chain. Converts OpCodes into vector space and apply deep self-space warning approach to spot harmful and harmless programs. It also shows the strength of the current OpCode solution to find virus and it’s durability against junk code intrusion attack. Finally afford a simple and GitHub virus which preferably will help future research efforts. This work will be extended to evaluate proposed approach against larger and broader datasets in IoT dataset.
Moustafa et al. [22] provided a range of intrusion prevention techniques, including botnet attacks on the DNS, HTTP, and MQTT protocols used in IoT networks to avoid destructive incidents. Based on the examination of the possible properties the new mathematical flow have been established. To efficiently assess the influence of these features and identify malicious events, the learning system of AdaBoost Ensemble is then growing three strategies of machine learning, Decision Tree (DT), Naive Bayes (NB) and the ANN. Although these trials use existing flow approaches and strategies and use algorithms to track their outcomes in machine learning, there is no additional flows are used for better classification of issues with botnet in their decision making. Higher detection rate and a lower false positive rate when compared to other methods.
The proposed architecture for ensemble-learning is implemented by studying the MQTT and HTTP protocols that reveal IoT networks via the TCP/IP protocols to detect botnet attacks. This proposed work consists of four main steps: dataset, preprocessing, selection of features and method of ensemble see Fig. 1. Initially UNSW-NB15 dataset is obtained from IXIA Perfect Storm platform in Australian Cyber Security Center (ACCS)’s Cyber Range Lab. Secondly, Z-score normalization conducts pre-processing of the results. Thirdly, Improved Ant Colony Optimization (IACO) performs the selection of features and finally, the identification of attacks is carried out based on an investigation of their possible properties. At the attack Detection level, MLEID technique is proposed to mitigate malicious events by incorporating these classifiers such as Distance Decision Tree (DDT), Adaptive Neuro-Fuzzy Inference System (ANFIS) and Mahalanobis Distance Support Vector Machine (MDSVM). In particular the IoT networks use botnet attacks against HTTP and MQTT protocols. Results of the classifiers such as DDT, ANFIS, and MDSVM are combined via weighted majority voting.
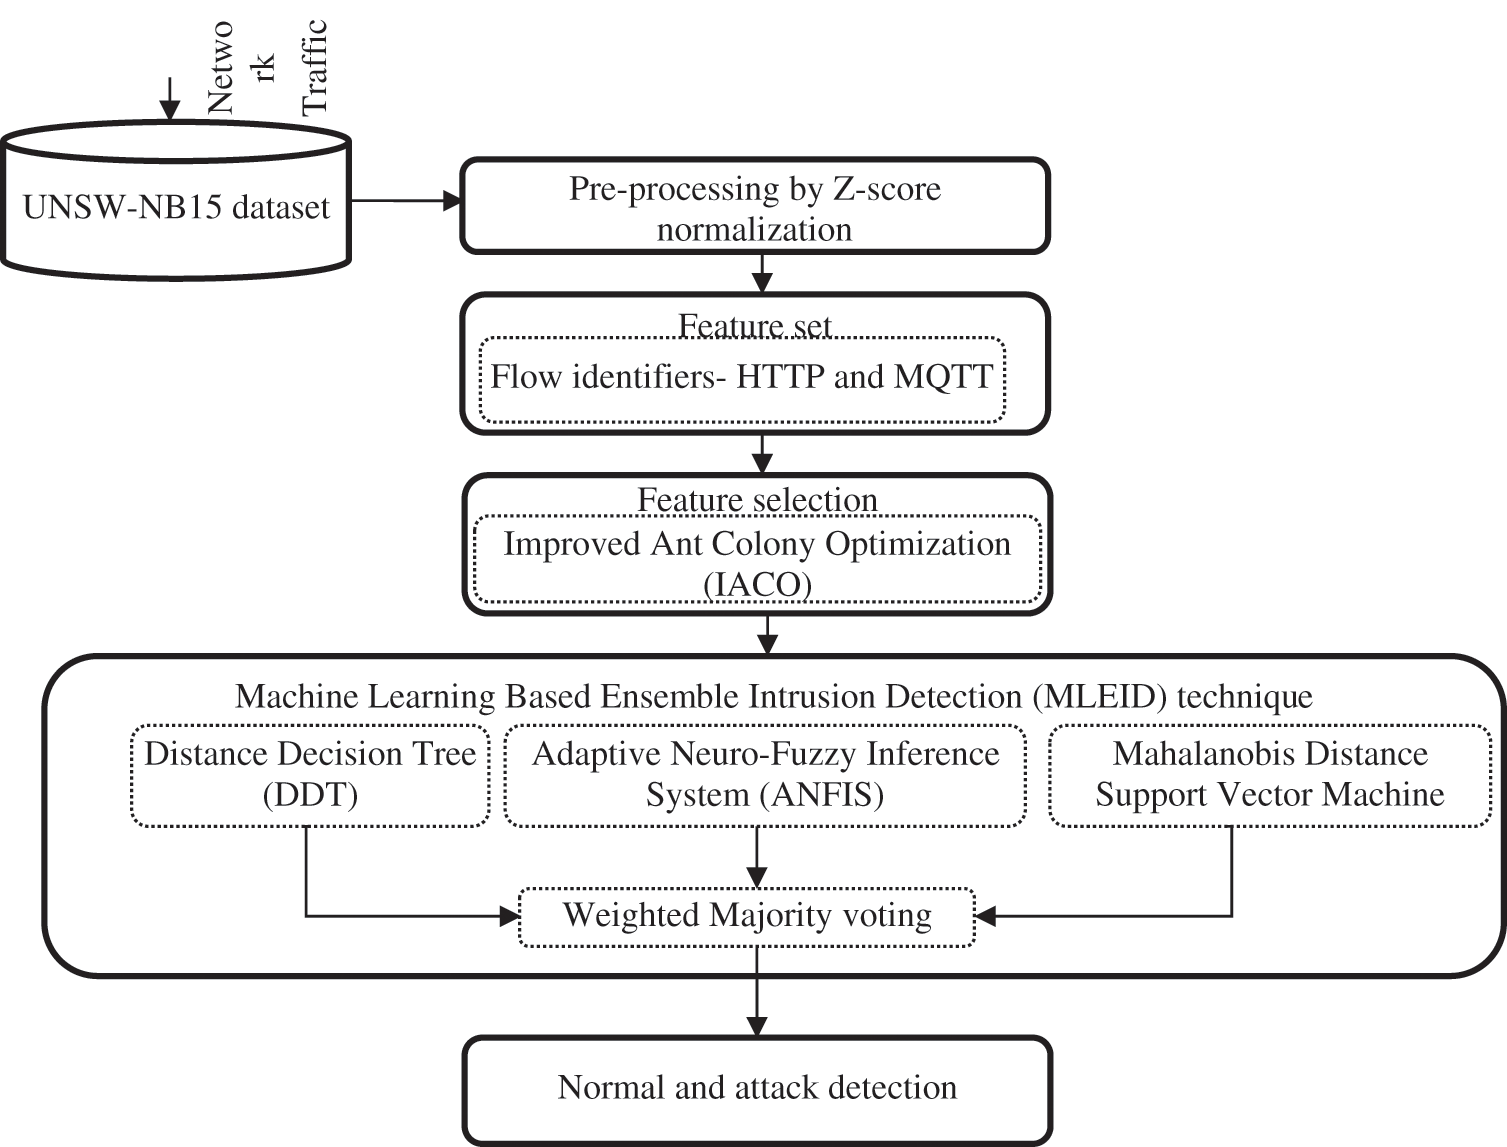
Figure 1: Proposed flow diagram for detecting attacks in IOT network
In the ACCS cyber range lab, the UNSN-NB15 dataset raw network packets were introduced by the IXIA perfect storm tool to produce a mixing of real modern normal activities and the attitude of attitude of attacking artificially at the same time. The training set consists of 175,341 records and the testing sets consists of 82,332 records which belong to either attack or normal. The nine types of attacks are Shellcode, Generic, Fuzzers, Worms, Reconnaissance, DoS, Analysis, Exploits and Backdoors. The features are: Sload, smeansz, Srcip, Dpkts, dmeansz, Sintpkt, dur, tcprtt, is_ftp_login, dstip, trans_depth, proto, sport, res_bdy_len, ct_src_dport_ltm, sbytes, Stime, Stime, synack, ct_ftp_cmd, state, swin, ackdat, ct_dst_src_ltm, dsport, ct_state_ttl, attack_cat, dtcpb, ct_srv_src, ct_dst_sport_ltm, dwin, dbytes, sloss, is_sm_ips_ports, Dload, ct_srv_dst, dloss, ct_src_ltm, Dintpkt, ct_dst_ltm, Label, Dintpkt, ct_dst_ltm, service, Sjit, Djit stcpb, and Spkts. For example, a collection of features includes the proposed task that is addressed in the recent work [22]. The UNSW-NB15 dataset data sources are 349, and 319 k respectively of DNS and HTTP information.
Z-score normalization [23] is also referred to as zero-mean normalization. The Z-score normalization technique normalizes the input values in the UNSW-NB15 dataset using mean and standard deviations. The mean and standard deviation for each feature vector is calculated across the UNSW-NB15 dataset. Z-Standardization technique determines whether an input value is below or above the average value. It will be very useful to normalize the UNSW-NB15 dataset when the maximum or minimum values of the attribute are unknown and the outliers dominate the input values. Z-score normalization technique transforms the v-to-v′ value into an Eq. (1).
where v′ refers to new value of feature value ‘F’, ‘v′ denotes old value of F,
The choice and removal of redundant characteristics that help distinguish between valid and malicious instances, and boost the overall efficiency of NIDSs is a key consideration for the collection of key NIDS apps. The aim of the selection is to lower computational costs of NIDS, reduce redundancies in information, increase NIDS precision and aid analysis normal network data. Improved Ant Colony Optimization (IACO) is the easiest solution in this analysis, and tests the sensitivity of certain functions. The minimal N bug-based characteristics are the best suited to the defined approach for classifying the DNS and HTTP abnormal behaviours.
IACO algorithm is used to pick relevant features and remove redundant features that may help discriminate between legitimate and malicious instances. ACO is conducted on the basis of the actual ants foraging behaviour [24]. They have optimum collection of NIDS features and set the shortest paths to the NIDS from their nests. ACO is a group of algorithms whose constructed solutions are based on problem data. Currently, the ants hunt for NIDS arbitrarily. They add it to their colony when an ant discovers an ideal NIDS feature. When they drive on the roads, they set down a chemical called pheromone. Therefore, shorter routes would provide a higher degree of detection of NIDS pheromones. Ant takes decisions by using pheromone pathways Eq. (2). The pheromone trace size on the ground depends on the accuracy of the solution (accuracy of detection) detected. In short paths of multiple ants, pheromones combine to establish a greater density relative to long paths (distance between data collection UNSW-NB15 characteristics), thereby enhancing their attraction. Eventually, all channels of pheromones are reduced by an evaporation rate. The flowchart of the proposed IACO is shown in the Fig. 2.
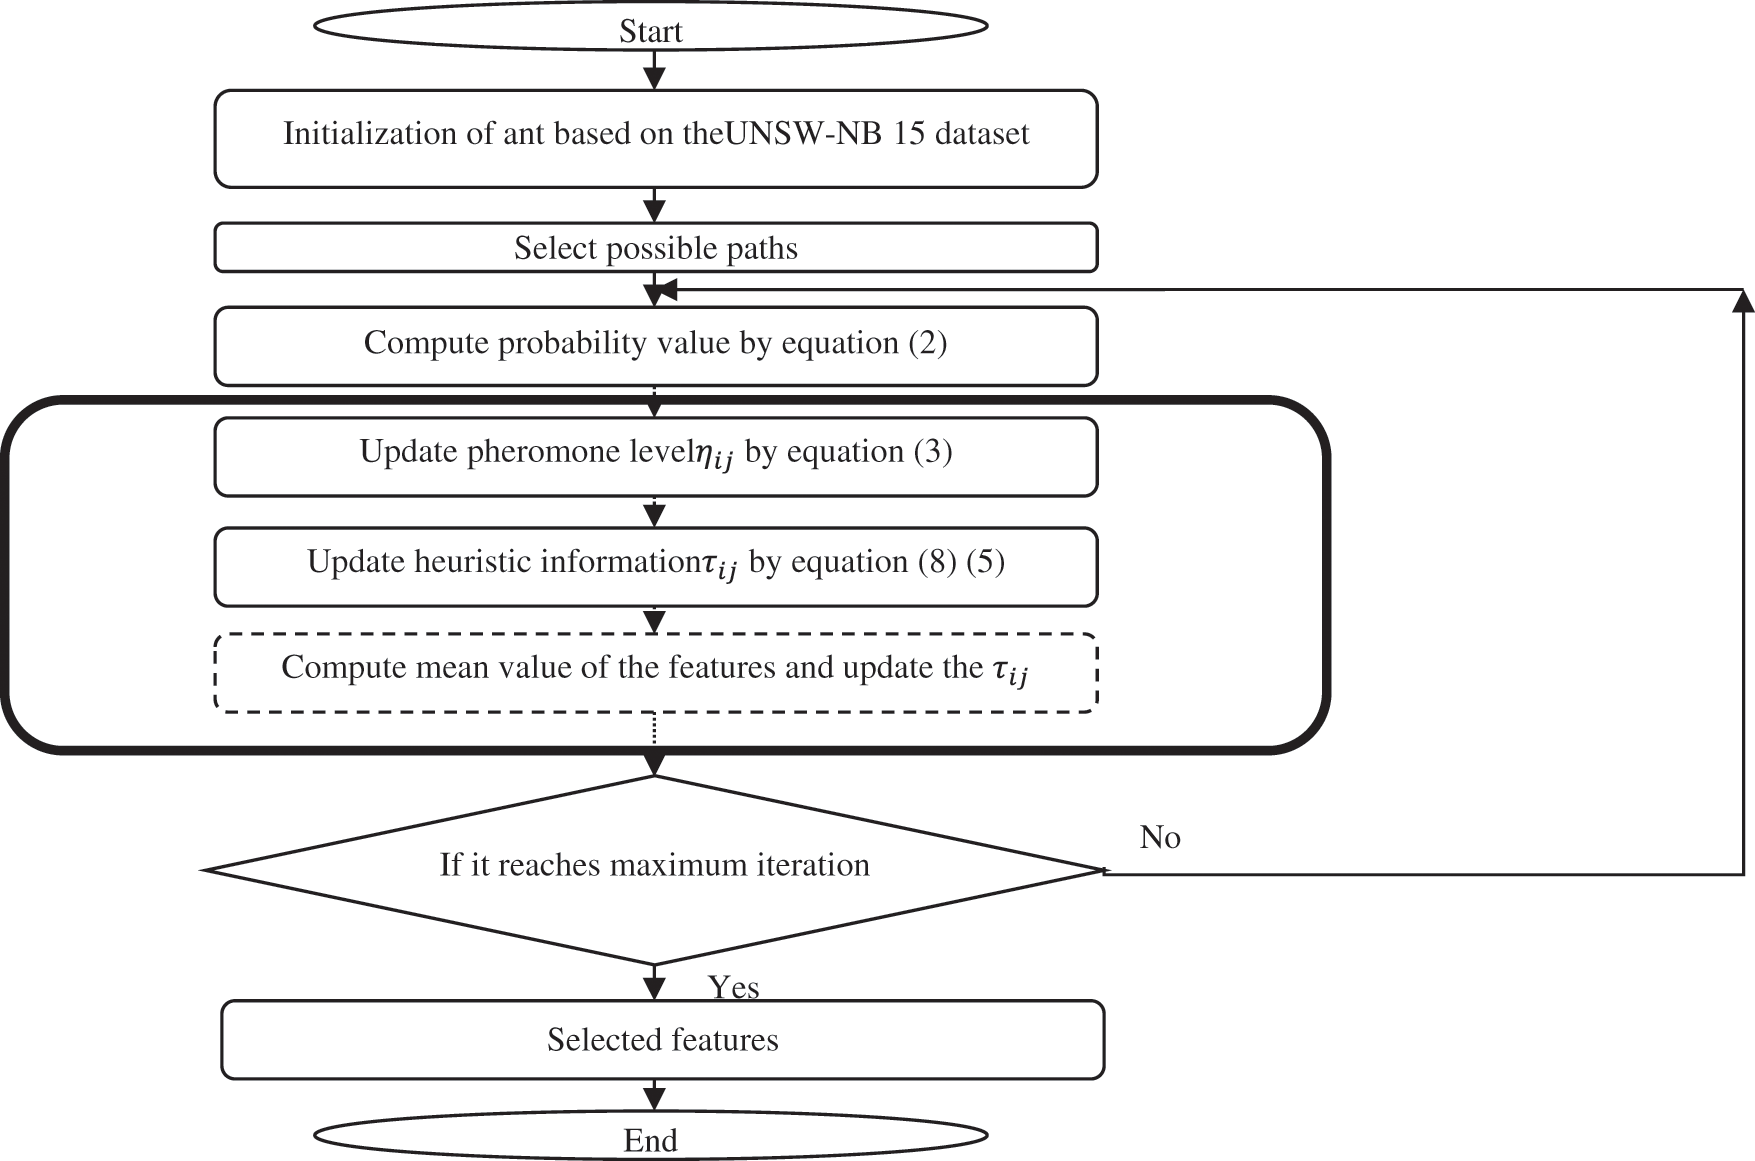
Figure 2: Flowchart of the proposed IACO approach
The evaporation method, on the other hand, presents the discovery (Highest Accuracy) and prevents a minimum of local stalling. However at the end of each iteration the pheromone values will be updated [24].
where
where S is the dataset covariance matrix. The pheromone update can be made as follows (Eqs. (5) and (6)):
The evaporation update is given by Eq. (7).
where ρ is the constant reduction factor of all pheromones,
If the mean value of the features are higher than the
3.4 Machine Learning Based Ensemble Intrusion Detection (MLEID)
Ensemble technique is a learning algorithm that builds a set of classifiers such as Distance Decision Tree (DDT), ANFIS and Enhanced SVM (ESVM) and then classifies new normal and attacking datasets by taking a weighted majority of their predictions.
3.4.1 Distance Decision Tree (DDT) Classifier
The data modeling approach called the Distance Decision Tree (DDT) model is used in this work, which is distinctive in that it considers the distance between attributes or variables. The model is derived from an integrated approach that combines distance and decision tree, where distance is used to detect the dependence of attributes by Eq. (4) and the DDT classifier is used to detect attacks. The DDT leaves reflect rules of classification while the branches symbolize features with a distance between attributes leading to classification of data. The rule of decision is based on if-then rules for categorizing data inputs. In particular, it is used to solve multi-type functions.
C4.5 technique is the easiest way of implementation. By using the information entropy principle, it creates the trees from the sample in training process. The concept of the Distance Decision Tree (DDT) classifier is divided in below: Consider the training sample ‘S’. The sample has n classes which is denoted as S = {s1,…,sn} it contains the distance values and their corresponding class label. For every tree node, the technique select its feature IACO and its distance value that most effectively divides Samples into sets of data using Information Gain (IG). The final decision of the function is created by the leading data gain at lower distance. Then, Eq. (12) will denote S entropy (IG):
In Eq. (12), pr_i indicates that the probability training UNSW-NB15 dataset belongs to class i. F is feature with V different subsets
where
This method aims to pick a branch node that has the most knowledge to gain from it. Internal nodes are characteristics of divisions, and the leaf nodes are groups. If the classifier for the decision tree is formed, the classification rules are formed to extract a combined paradigm from the root to the leaf nodes.
3.4.2 Adaptive Neuro-Fuzzy Inference System (ANFIS) Classifier
ANFIS has computed initial membership functions by testing itself with selected UNSW-NB15 dataset features. The Gaussian membership feature was considered to be having different characteristics depending on the trial and error method. It is used to reduce error rate for the NIDS system. Also, the number of epochs for training UNSW-NB15 dataset of the models is set to 10. In addition, 80% and 20% of the UNSW-NB15 dataset were used to train and test models, respectively. UNSW-NB15 dataset was checked for validating the range of the train set containing the test sample. To assess and enhance the performance of the best-constructed model, various values were evaluated on the basis of a trial and error analysis for significant parameters of the model. Eventually, the best-resulted attack rate was calculated with the minimum error dependent on the error value for each variable. The overall equation for the ANFIS model can be determined as follows Eqs. (16) and (19).
Rule 1: if a is X1 and b is Y1 then
Rule 2: if a is X1 and b is Y2 then
Rule 3: if a is X2 and b is Y1 then
Rule 4: if a is X2 and b is Y2 then
where a and b are inputs, and c is output (attacker or normal user), Xi and Yi (i = 1, 2, 3, 4) are the fuzzy sets, pi, qi and ri (i = 1, 2, 3, 4) are the parameters of design which are decided during the training phase. ANFIS architecture can be generally categorized as five layers composed of input nodes, rule nodes, average nodes, following nodes, and output node layers Fig. 3.
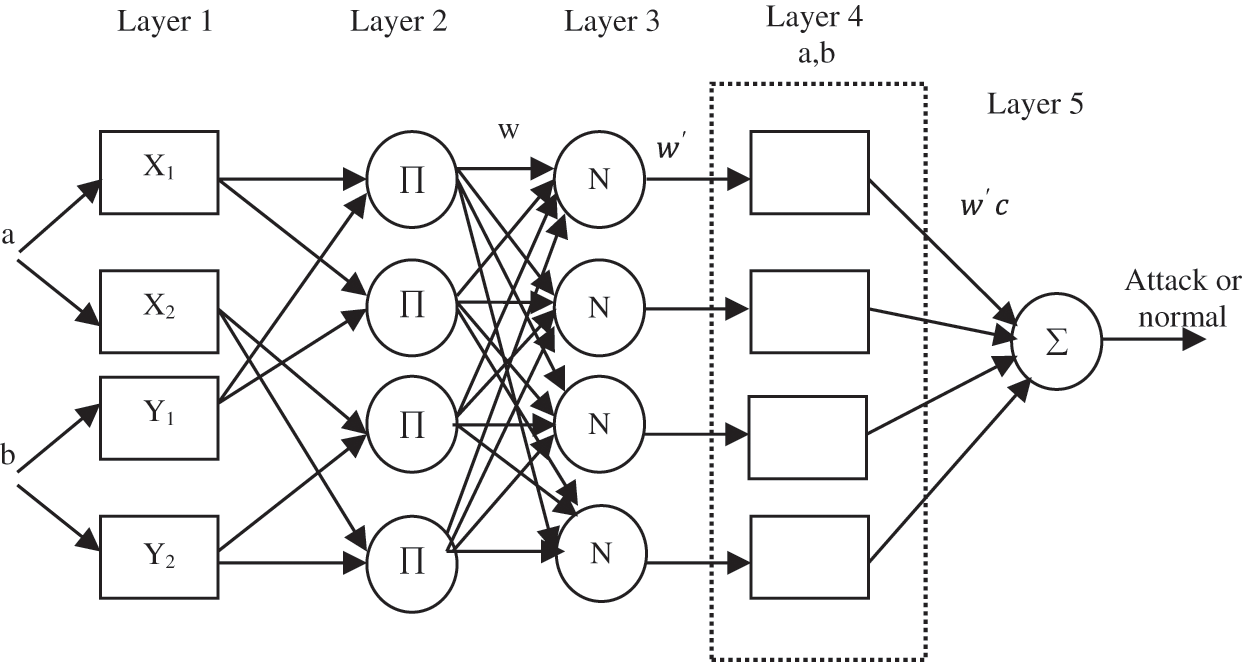
Figure 3: The working procedure of the proposed ANFIS classifier
The functions of each node layer such as input, output, and rule nodes are as follows:
Layer 1: Input Nodes Layer-The Eqs. (20) and (21) defines the outputs of Layer 1 of fuzzy membership grade for the applied inputs (UNSW-NB15 dataset) and given as
where
Layer 2: Rule Nodes Layer-The Layer 2 contains fixed nodes that are labeled as
Layer 3: Average Nodes Layer-In this layer 3, fixed node labeled as N are considered. The layer3 calculates the ratio of the ith rule’s firing strength obtained from the Layer 2. The layer 3 produces normalized firing strengths
Layer 4: Consequent nodes layer-The Layer 4 named as consequent nodes layer computes the total output (attack or normal) contributed by each ith rules. The output of the layer 4 is the multiplication of the normalized firing intensity and a Sugeno model of first order as shown in Eq. (24),
Layer 5: Layer of output node–This layer 5 contains an only one node named as S and function of this layer is to calculate the summation of all received inputs from previous layers. Hence, the Eq. (25) shows the final summed output of the ANFIS model.
Two types of parameters can be shown to have modified. The first collection deals with the input features called the hypothesis parameters. The second set consists of three conditions related to the Sugeno first order model which are the corresponding parameters. The least square method used to optimize the resulting parameters is used to adjust the back propagation algorithm not separately but also in mixture. A high degree of efficacy was seen in ANFIS training with the hybrid algorithm [29].
3.4.3 Mahalanobis Distance Support Vector Machine (ESVM) Classifier
The best classifier with high generality and long-time Structure Risk Minimization (SRM) is Support Vector Machine (SVM) classifier which is used in most of the machine learning algorithms [30]. The support vectors and decision limits of the SVM classification method are depicted in Fig. 4.
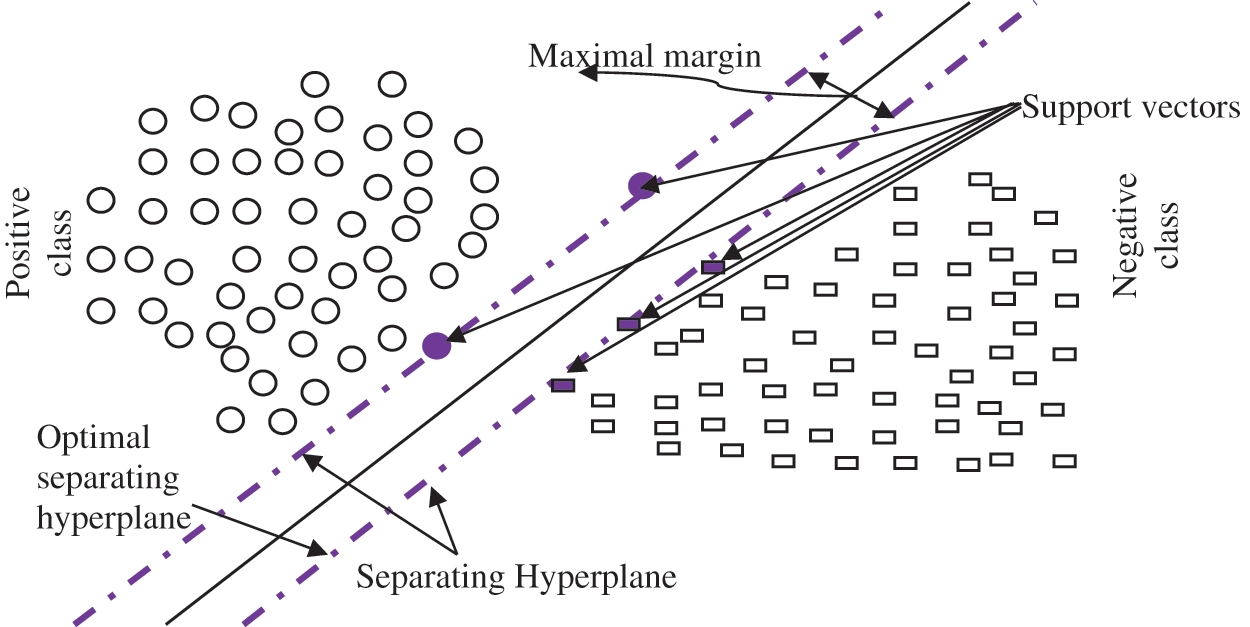
Figure 4: Support vectors and decision boundaries of a linear SVM
In this study, the differential misclassification costs of NIDS are taken into account and different penalty factors are added, respectively,
In this study, set attack and normal attack are considered as negative samples and positive samples respectively [30]. As presented in Eq. (28), fix the value of false-positive more higher than false-negative and rearrange the limits of
Convert inequality restraints into equality restraints, and the issue of attack-detection based on SVM can be transformed into solving the following function:
In the Eq. (30),
In the Eq. (31),
3.4.4 Weighted Majority Voting
Finally, the outcomes of all classifiers are joined over the use of a weighted majority vote. The AdaBoost model [31] is used for the distribution of network data. This allows us to set up a number of basic beginners by consecutively re-evaluating the interpretations in the training period. Each conclusion incorrectly identified by the former base learner would have a greater weight during the next phase of the training cycle. The central concept behind the technique of boosting is to encourage specific instructors, by different variations, to modify styles during the workout. The weight of the correctly categorized observations has reduced, while the wrong categorized observations have risen to spread the findings. The final structure of the boosting strategy is a linear composition, with a weighting of output, consisting of three classifications (DDT, ANFIS and MDSVM).
HTTP database as the MQTT features used in the transactional features of these sources are discussed in this section, and the evaluation metrics are used in the experiments. Classification strategies are built using MATLAB programming language on a Windows 7 operating system with RAM of 16 GB and the i7 core CPU. Experiments were conducted using a 10 times boundary validation model to test the same results for dynamic variations in data input.
A variety of data formats are present in the UNSW-NB15 data set; pcap files, Argus files, Bro files and CSV for NIDS. It provides a true set of new, regular and irregular network traffic. In addition to simulated sensor network activity, UNSW-NB15 [32,33] is used to test the proposed system.
Extreme studies have been carried out using data sources for the detection of suspicious incidents to determine the usefulness and efficiency of the proposed DT, SVM Ensemble Classifier.
To achieve this, the evaluation metrics of accuracy, Detection Rate (DR), False Positive Rate (FPR) are used. These metrics relies on the four terms of True Positive (TP), True Negative (TN), False Negative (FN) and False Positive (FP).
They are based on the following four parameters. TP is the number of actual anomaly records found as an attack. TN is the number of actual valid records found as usual. FN is the sum of actual anomaly records listed as standard. The metrics are described as follows,
Accuracy is the percentage of all legitimate and anomalous records that are correctly detected, that is,
Detection Rate (DR) is the percentage of correctly identified anomalous records, that is,
False Positive Rate (FPR) is the percentage of incorrectly identified anomalous records, that is,
The ROC curve is the association between the y-axis detection rate and the false positive x-axis number, which represents the total device performance. The overall performance assessment of the DT ensemble classifier and the proposed MLEID is measured in terms of accuracy (ACc), DR, FPR and processing time (Time) from UNSW-DNS and HTTP data sources shown in Tab. 1.
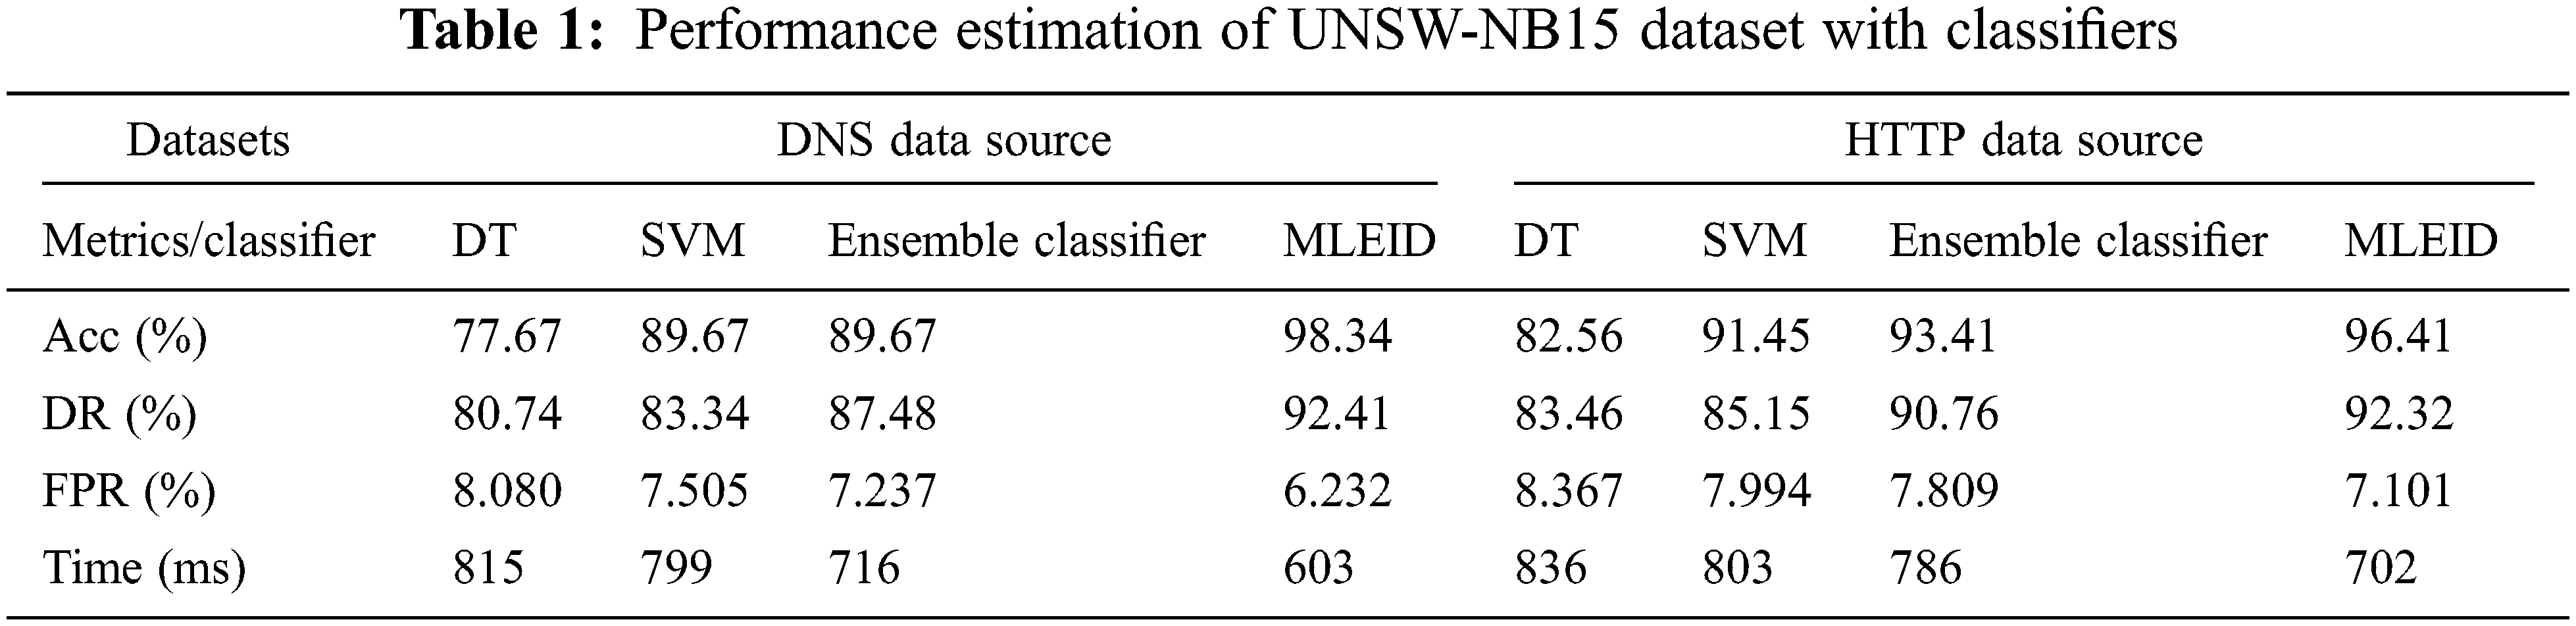
The suggested functionality and methods are two main reasons for considerably identifying malicious activities in the DNS and HTTP protocols which are attempts to crack network applications. First, on the basis of the IACO, the features planned for the function are chosen. The similitude and intensity of the characteristics was measured. The valid and questionable trends of the two protocols are substantially different. Furthermore, when using the Ensemble approach, each strategy used in the proposed MLEID structure has been tested more effectively. In this method, each instance is given an error value to decide the right classification of the instance by the simple category.
The results of four classifiers for the performance metric comparison are shown in Fig. 5. The classifier accuracy tests were used in two separate data sets, namely DNS and HTTP. The overall findings for DNS of the new MLEID classifier are 98.34%, while lower rates of precision are 77.67%, 89.67% and 94.34% for classifiers like DT, SVM and Ensemble. The proposed classification scheme provides greater precision than the other methods; essential features are chosen using the IACO algorithm. The second type of data often contributes in a better direction than the other strategies. By using the distance function of the classifier the efficiency of the system is substantially enhanced.
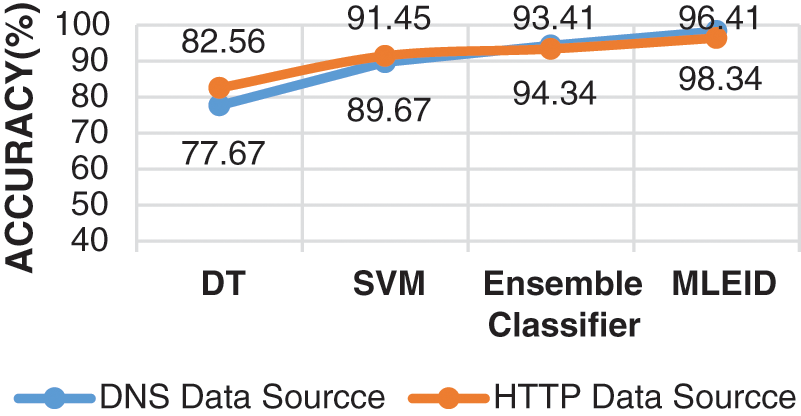
Figure 5: Accuracy results comparison vs. classifiers
Fig. 6 provides a contrast of the DR tests for four classifiers for two data points, for example DNS and HTTP. The suggested MLEID classifier has a higher DR of 92.41% for DNS and a lower DR of 80.74%, 83.34% and 87.48% for respect to other categorizations such as DT, SVM and Ensemble. The proposed classifier gives DR more than the other approaches as the proposed study is improved by applying Mahalanobis distance to each classifier, including DDT and MDSVM. With all classifiers, it specifically distinguishes classes effectively. Mahalanobis distance is applied to the DT classifier for evaluating the dependency between functions. Mahalanobis distance is applied to the SVM classifier to change the kernel parameter Radial Base Function (RBF).
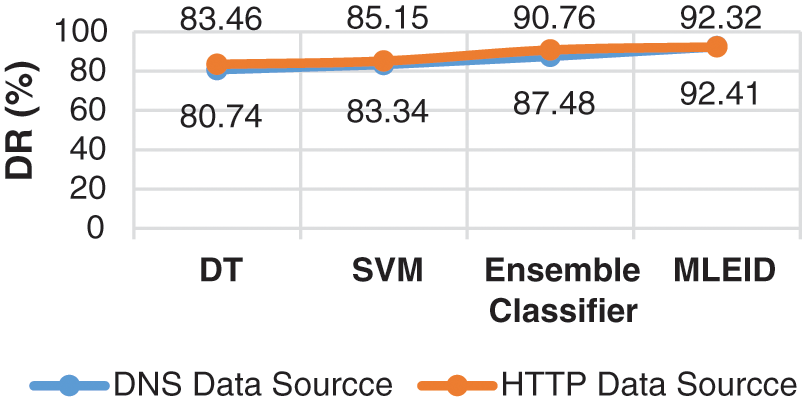
Figure 6: DR results comparison vs. classifiers
Fig. 7 displays FPR results for the DNS and HTTP data sets for the four classifiers. The estimated MLEID classification results for the DNS, 7.505% for DT, SVM and Ensemble respectively are less than 6.232%, while the remaining classifier offers better FPR results of 8.080% than the DDS, 7.55%. Although the recommended solution generates a very lower FPR rate, various sources of data are used for model training and validation.
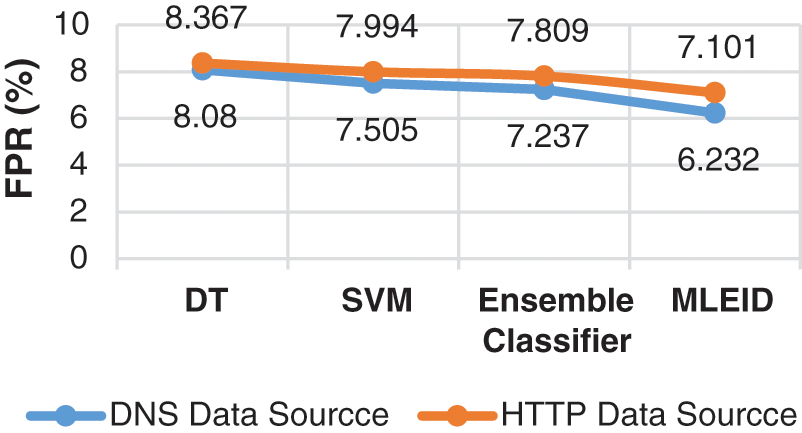
Figure 7: FPR results comparison vs. classifiers
The results of the time comparison of the two different data sources with four classifiers are shown in Fig. 8. The proposed MLEID classifier takes a higher time of 603 ms, while the other classifiers take a lower processing time of 815, 799, 716 ms for DT, SVM and ensemble classifier. The proposed classifier takes a higher processing time as the proposed work three classifier results are integrated and finally weighted majority voting is introduced in order to obtain overall results. It takes more time to perform the task of classification than the other methods.
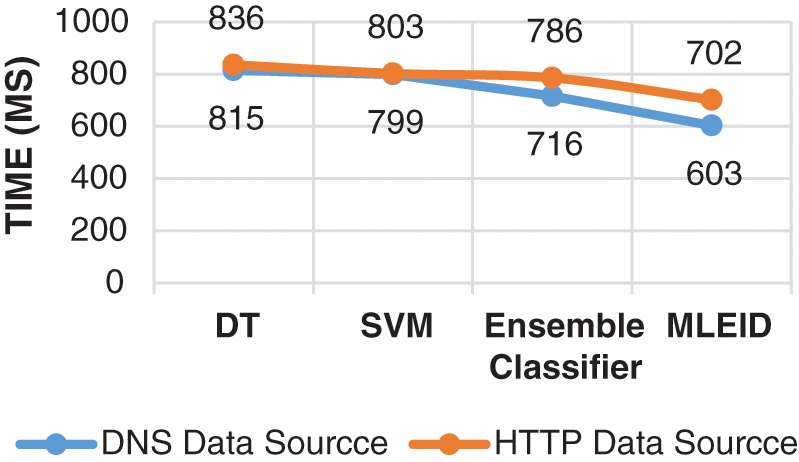
Figure 8: Time comparison vs. classifiers FPR
In this article, features based on the improved ant-colony optimization (IACO), are used to construct successful NIDS to detect attacks using IoT networks and to evaluate the IP model in detail, particularly the MQTT and HTTP Protocols. The IACO algorithm is used to pick appropriate characteristics and removal of irrelevant characteristics which can discriminate legitimately and maliciously. An IACO algorithm is used to adjust the pheromones based upon the measured mean value.
The result of chosen characters in estimated Machine Learning Based Ensemble Intrusion Detection (MLEID) technique for NIDS. An MLEID technique using three techniques of Distance Decision Tree (DDT), Adaptive Neuro-Fuzzy Inference System (ANFIS) and Mahalanobis Distance Support Vector Machine (MDSVM) was applied to NIDS. As a result of the introduction of Mahalanobis Length, the overall capability of the MLEID technique is increased. Differentiate with other conventional methods, the overall production of this new method with respect to DR, ACC and time analyses is improved. Different IoT protocols should be incorporated into the analysis in later, to create a comprehensive profile of mainstream patterns.
Acknowledgement: The authors with a deep sense of gratitude would thank the supervisor for his guidance and constant support rendered during this research.
Funding Statement: The authors received no specific funding for this study.
Conflicts of Interest: The authors declare that they have no conflicts of interest to report regarding the present study.
References
1. J. Gubbi, R. Buyya, S. Marusic and M. Palaniswami, “Internet of things (IoTA vision, architectural elements, and future directions,” Elsevier FGCS, vol. 29, no. 7, pp. 1645–1660, 2013. [Google Scholar]
2. J. Voas, “Demystifying the internet of things,” Computer, vol. 49, no. 6, pp. 80–83, 2016. [Google Scholar]
3. D. Minoli, K. Sohraby and B. Occhiogrosso, “IoT considerations, requirements, and architectures for smart buildings—energy optimization and next-generation building management systems,” IEEE Internet of Things Journal, vol. 4, no. 1, pp. 269–283, 2017. [Google Scholar]
4. W. Shang, Y. Yu, R. Droms and L. Zhang, “Challenges in IOT networking via TCP/IP architecture,” Technical Report NDN-0038, NDN Project, 2016. [Google Scholar]
5. S. K. Malladi, T. M. Ravi, M. K. Reddy and K. Raghavendra, “Edge intelligence platform, and internet of things sensor streams system,” US Patent App. 15/250,720, 2017. [Google Scholar]
6. C. Liu, “Securing networks in the internet of things era,” Computer Fraud & Security, vol. 4, no. 15, pp. 13–16, 2015. [Google Scholar]
7. Z. A. Khan and P. Herrmann, “Recent advancements in intrusion detection systems for the internet of things,” Security and Communication Networks, vol. 42, no. 4301409, pp. 1–19, 2019. [Google Scholar]
8. K. S. Arvind and R. Manimegalai, “Privacy preserving public auditing for cloud storage using elliptic curve digital signature,” Journal of Computational and Theoretical Nanoscience, vol. 15, no. 5, pp. 1568–1572, 2018. [Google Scholar]
9. N. Moustafa, G. Creech and J. Slay, “Flow aggregator module for analysing network traffic,” in Proc. ICCAN, Singapore, pp. 19–29, 2018. [Google Scholar]
10. M. Ghosh, R. Guha, R. Sarkar and A. Abraham, “A wrapper-filter feature selection technique based on ant colony optimization,” Neural Computing and Applications, vol. 32, no. 12, pp. 7839–7857, 2020. [Google Scholar]
11. Q. Chen, S. Abdelwahed and A. Erradi, “A model-based validated autonomic approach to self-protect computing systems,” IEEE Internet of Things Journal, vol. 1, no. 5, pp. 446–460, 2014. [Google Scholar]
12. J. Canedo and A. Skjellum, “Using machine learning to secure IoT systems,” in Proc. PST, Auckland, New Zealand, pp. 219–222, 2016. [Google Scholar]
13. E. Hodo, X. Bellekens, A. Hamilton, P. L. Dubouilh, E. Iorkyase et al., “Threat analysis of IoT networks using artificial neural network intrusion detection system,” in Proc. ISNCC, Yasmine Hammamet, Tunisia, pp. 1–6, 2016. [Google Scholar]
14. S. S. Bhunia and M. Gurusamy, “Dynamic attack detection and mitigation in IoT using SDN,” in Proc. ITNAC, Melbourne, Australia, pp. 1–6, 2017. [Google Scholar]
15. G. Thamilarasu and S. Chawla, “Towards deep-learning-driven intrusion detection for the internet of things,” Sensors, vol. 19, no. 9, pp. 1–19, 2019. [Google Scholar]
16. S. T. Bakhsh, S. Alghamdi, R. A. Alsemmeari and S. R. Hassan, “An adaptive intrusion detection and prevention system for internet of things,” International Journal of Distributed Sensor Networks, vol. 15, no. 11, pp. 1550147719888109, 2019. [Google Scholar]
17. Y. Fu, Z. Yan, J. Cao, O. Koné and X. Cao, “An automata based intrusion detection method for internet of things,” Mobile Information Systems, vol. 2017, no. 1750637, pp. 1–13, 2017. [Google Scholar]
18. S. M. Kasongo and Y. Sun, “Performance analysis of intrusion detection systems using a feature selection method on the UNSW-NB15 dataset,” Journal of Big Data, vol. 7, no. 1, pp. 1–20, 2020. [Google Scholar]
19. T. S. Wang, H. T. Lin, W. T. Cheng and C. Y. Chen, “Dbod: Clustering and detecting DGA-based botnets using DNS traffic analysis,” Computers & Security, vol. 64, no. 88, pp. 1–15, 2017. [Google Scholar]
20. S. Moualla, K. Khorzom and A. Jafar, “Improving the performance of machine learning-based network intrusion detection systems on the UNSW-NB15 dataset,” Computational Intelligence and Neuroscience, vol. 2021, no. 5557577, pp. 1–13, 2021. [Google Scholar]
21. A. Azmoodeh, A. Dehghantanha and K. K. R. Choo, “Robust malware detection for internet of (battlefield) things devices using deep eigenspace learning,” IEEE Transactions on Sustainable Computing, vol. 4, no. 1, pp. 88–95, 2018. [Google Scholar]
22. N. Moustafa, B. Turnbull and K. K. R. Choo, “An ensemble intrusion detection technique based on proposed statistical flow features for protecting network traffic of internet of things,” IEEE Internet of Things Journal, vol. 6, no. 3, pp. 4815–4830, 2018. [Google Scholar]
23. M. Dorigo and T. Stützle, “Ant colony optimization: Overview and recent advances,” in Handbook of Metaheuristics, Boston, MA: Springer, vol. 19, no. 14, pp. 311–351, 2019. [Google Scholar]
24. W. Deng, J. Xu and H. Zhao, “An improved ant colony optimization algorithm based on hybrid strategies for scheduling problem,” IEEE Access, vol. 7, no. 9, pp. 20281–20292, 2019. [Google Scholar]
25. G. Rivera, C. A. C. Coello, L. Cruz-Reyes, E. R. Fernandez, C. Gomez-Santillan et al., “Preference incorporation into many-objective optimization: An ant colony algorithm based on interval outranking,” Swarm and Evolutionary Computation, vol. 69, no. 10, pp. 101024, 2022. [Google Scholar]
26. M. Ali, R. C. Deo, Y. Xiang, R. Prasad, J. Li et al., “Coupled online sequential extreme learning machine model with ant colony optimization algorithm for wheat yield prediction,” Scientific Reports, vol. 12, no. 1, pp. 1–23, 2022. [Google Scholar]
27. S. F. Hussain, I. A. Butt, M. Hanif and S. Anwar, “Clustering uncertain graphs using ant colony optimization (ACO),” Neural Computing and Applications, vol. 34, no. 8, pp. 1–18, 2022. [Google Scholar]
28. W. Li, L. Xia, Y. Huang and S. Mahmoodi, “An ant colony optimization algorithm with adaptive greedy strategy to optimize path problems,” Journal of Ambient Intelligence and Humanized Computing, vol. 13, no. 3, pp. 1557–1571, 2022. [Google Scholar]
29. E. Cabana, R. E. Lillo and H. Laniado, “Multivariate outlier detection based on a robust mahalanobis distance with shrinkage estimators,” Statistical Papers, vol. 62, no. 4, pp. 1583–1609, 2021. [Google Scholar]
30. F. Y. Cheng, J. Zhou, J. Gao and S. Zheng, “Efficient optimization of f-measure with cost-sensitive SVM,” Mathematical Problems in Engineering, vol. 2016, no. 5873769, pp. 1–11, 2016. [Google Scholar]
31. G. J. Wang, J. Sun, K. Ma, K. Xu and J. Gu, “Sentiment classification: The contribution of ensemble learning,” Decision Support Systems, vol. 57, no. 14, pp. 77–93, 2014. [Google Scholar]
32. V. Manikandan, M. Sivaram, A. S. Mohammed and V. Porkodi, “Nature inspired improved firefly algorithm for node clustering in wsns,” Computers Materials & Continua, vol. 64, no. 2, pp. 753–776, 2020. [Google Scholar]
33. N. Moustafa and J. Slay, “UNSW-NB15: A comprehensive data set for network intrusion detection systems (unsw-nb15 network data set),” in Porc. MilCIS, Canberra, Australia, vol. 2015, pp. 1–6, 2015. [Google Scholar]
Cite This Article
 Copyright © 2023 The Author(s). Published by Tech Science Press.
This work is licensed under a Creative Commons Attribution 4.0 International License , which permits unrestricted use, distribution, and reproduction in any medium, provided the original work is properly cited.
 Downloads
 Citation Tools