
 Submit a Paper
 Propose a Special lssue
 Open Access
ARTICLE
Memory-Type Control Charts Through the Lens of Cost Parameters
1 Pusat Pengajian Sains Matematik, Fakulti Sains dan Teknologi, Universiti Kebangsaan Malaysia, UKM Bangi, Selangor, 43600, Malaysia
2 Pusat GENIUS@Pintar Negara, Universiti Kebangsaan Malaysia, UKM Bangi, Selangor, 43600, Malaysia
3 Shivaji University, Kolhapur, 416004, India
* Corresponding Author: You Huay Woon. Email:
Intelligent Automation & Soft Computing 2023, 36(1), 1-10. https://doi.org/10.32604/iasc.2023.032062
Received 05 May 2022; Accepted 10 June 2022; Issue published 29 September 2022
 View Full Text
 Download PDF
Abstract
A memory-type control chart utilizes previous information for chart construction. An example of a memory-type chart is an exponentially-weighted moving average (EWMA) control chart. The EWMA control chart is well-known and widely employed by practitioners for monitoring small and moderate process mean shifts. Meanwhile, the EWMA median chart is robust against outliers. In light of this, the economic model of the EWMA and EWMA median control charts are commonly considered. This study aims to investigate the effect of cost parameters on the out-of-control average run length in implementing EWMA and EWMA median control charts. The economic model was used to compute the parameter. The 14 input parameters were identified and the analysis was carried out based on the one-parameter-at-a-time basis. When the input parameters change based on a predetermined percentage, the is affected. According to the results of the EWMA chart, nine input parameters had an effect and five input parameters had no effect on the parameter. Further, only seven of the 14 input parameters had an effect on the ARL1 of the EWMA median chart. However, the effect of each input parameter on the was different. Moreover, the for the EWMA median chart was smaller than the EWMA chart. This analysis is crucial to observe and determine the input parameters that have a significant impact on the of the EMWA and EWMA median control charts. Hence, practitioners can obtain an overview of the influence of the input parameters on the when implementing the EWMA and EWMA median control charts.Keywords
Statistical Process Control (SPC) is a collection of analytical decision making tools that are effective in achieving process reliability and enhancing capability by reducing variability. A control chart is among the most efficient tools in SPC [1]. The first control chart was pioneered by Dr. Walter A. Shewhart to monitor and determine whether a process is in a desired state for producing high quality goods [2].
Since then, the control chart remains to be a valuable tool that has been prominently employed in SPC. This is because it can continuously monitor a process and ultimately improve its capability. It is simple to use, yet achieves a significant impact on the enhancement of overall quality [3]. The awareness and knowledge of using control charting techniques to monitor a process and deliver high-quality production has grown exponentially [4–6]. Hence, control charts are used extensively in the manufacturing and service sectors.
The Shewhart chart has been well-known for its ease of construction and implementation. Nevertheless, it is insensitive towards small and moderate process shifts. Consequently, extensive research has been conducted to develop new control charts to improve the sensitivity of the Shewhart chart, such as the memory-type control chart [7]. A memory-type control chart is constructed based on past and current information. A good example of the memory-type control chart is the exponentially-weighted moving average (EWMA) chart.
The EWMA chart has the ability to accurately detect small-to-moderate process mean shifts under normality assumption. According to Human et al. [8], this generally does not hold when the process contains contaminated normal data. In this case, the EWMA median chart is an ideal alternative. The main benefit of this chart is that it is resistant to outliers, as it monitors the process using the sample median.
The assessment of a control chart is necessary to reveal its overall effectiveness. This is vital, as it influences the decision to use the control chart. In practice, the performance of a control chart can be accurately evaluated [9]. The common criterion to measure the performance of a control chart is the average run length (ARL). The economic designs of the memory-type control chart have been studied by Hariba et al. [10] and Serel [11], among others. The effect of cost parameters on the ARL of the EWMA chart and EWMA median chart based on the economic model is not yet available in the existing literature.
In view of this, it is essential to investigate the impact of the input parameters on the out-of-control average run length
2 The Memory-Type Control Charts
The memory-type charts considered in this study are the EWMA chart and EWMA median chart. The EWMA chart was developed by Roberts [12], and is typically used to detect small process mean shifts due to the characteristics of using previous and current data in calculation of the statistic [13].
The statistic of the EWMA chart at sampling period, u, is computed as follows:
where
The EWMA median chart uses the sample median to monitor the process, as follows:
When calculating the sample median, it is common practice to assume that the sample size, n, is an odd number [15]. This simplifies the calculation of the sample median. The EWMA median chart’s statistic is
where
The economic model obtains optimal charting parameters that minimize cost [16]. Here, the economic model involves finding the
When an assignable cause occurs, the process is said to become out-of-control and the process mean becomes
The expected cost per unit time in hours is denoted as C and can be defined as follows:
where
and
The notations in Eq. (4) are defined as follows:
b Fixed cost per sample
c Cost per unit sampled
n Sample size
e Expected time to sample and interpret one unit
h Sampling interval
s Expected number of samples taken before an assignable cause occurs
Y Cost of false alarm
W Cost of finding and fixing an assignable cause
= 0 if production stops during search
= 0 if production stops during repair
4 The Analysis of the EWMA and EWMA Median Control Charts
Sensitivity analysis is crucial to identify the input parameter that has an impact on the performance measure, i.e.,
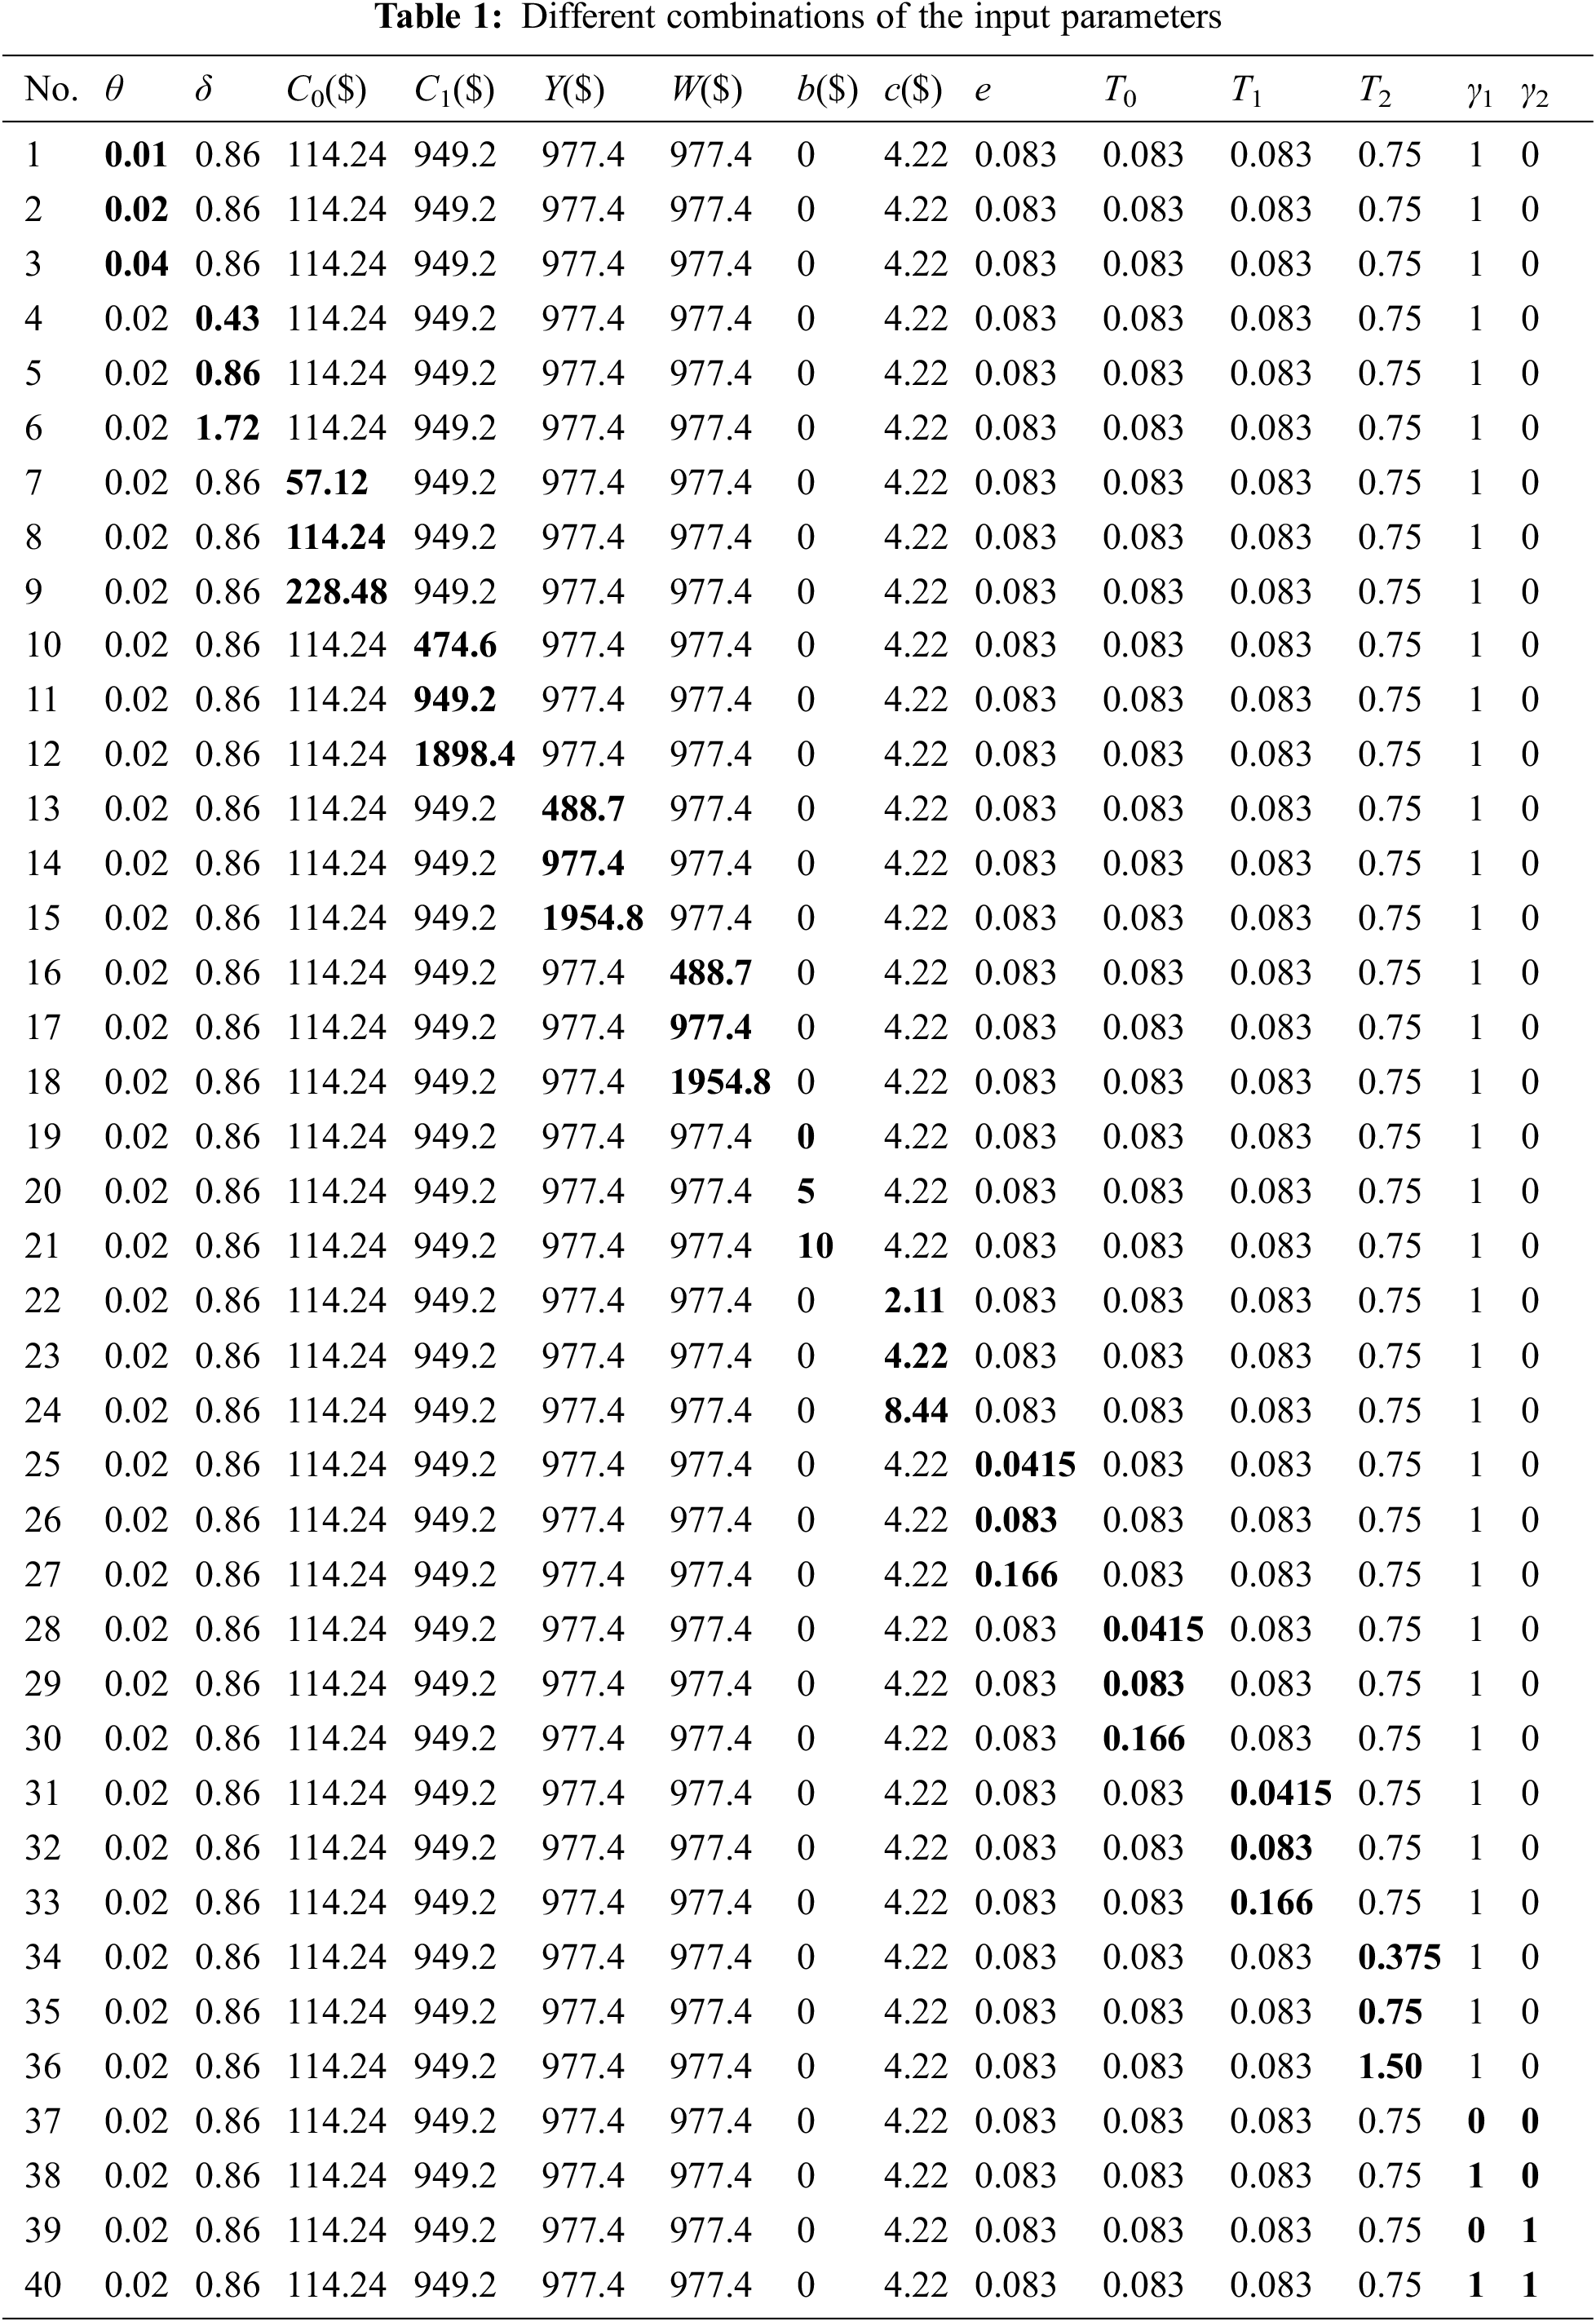
Tab. 2 demonstrates the corresponding
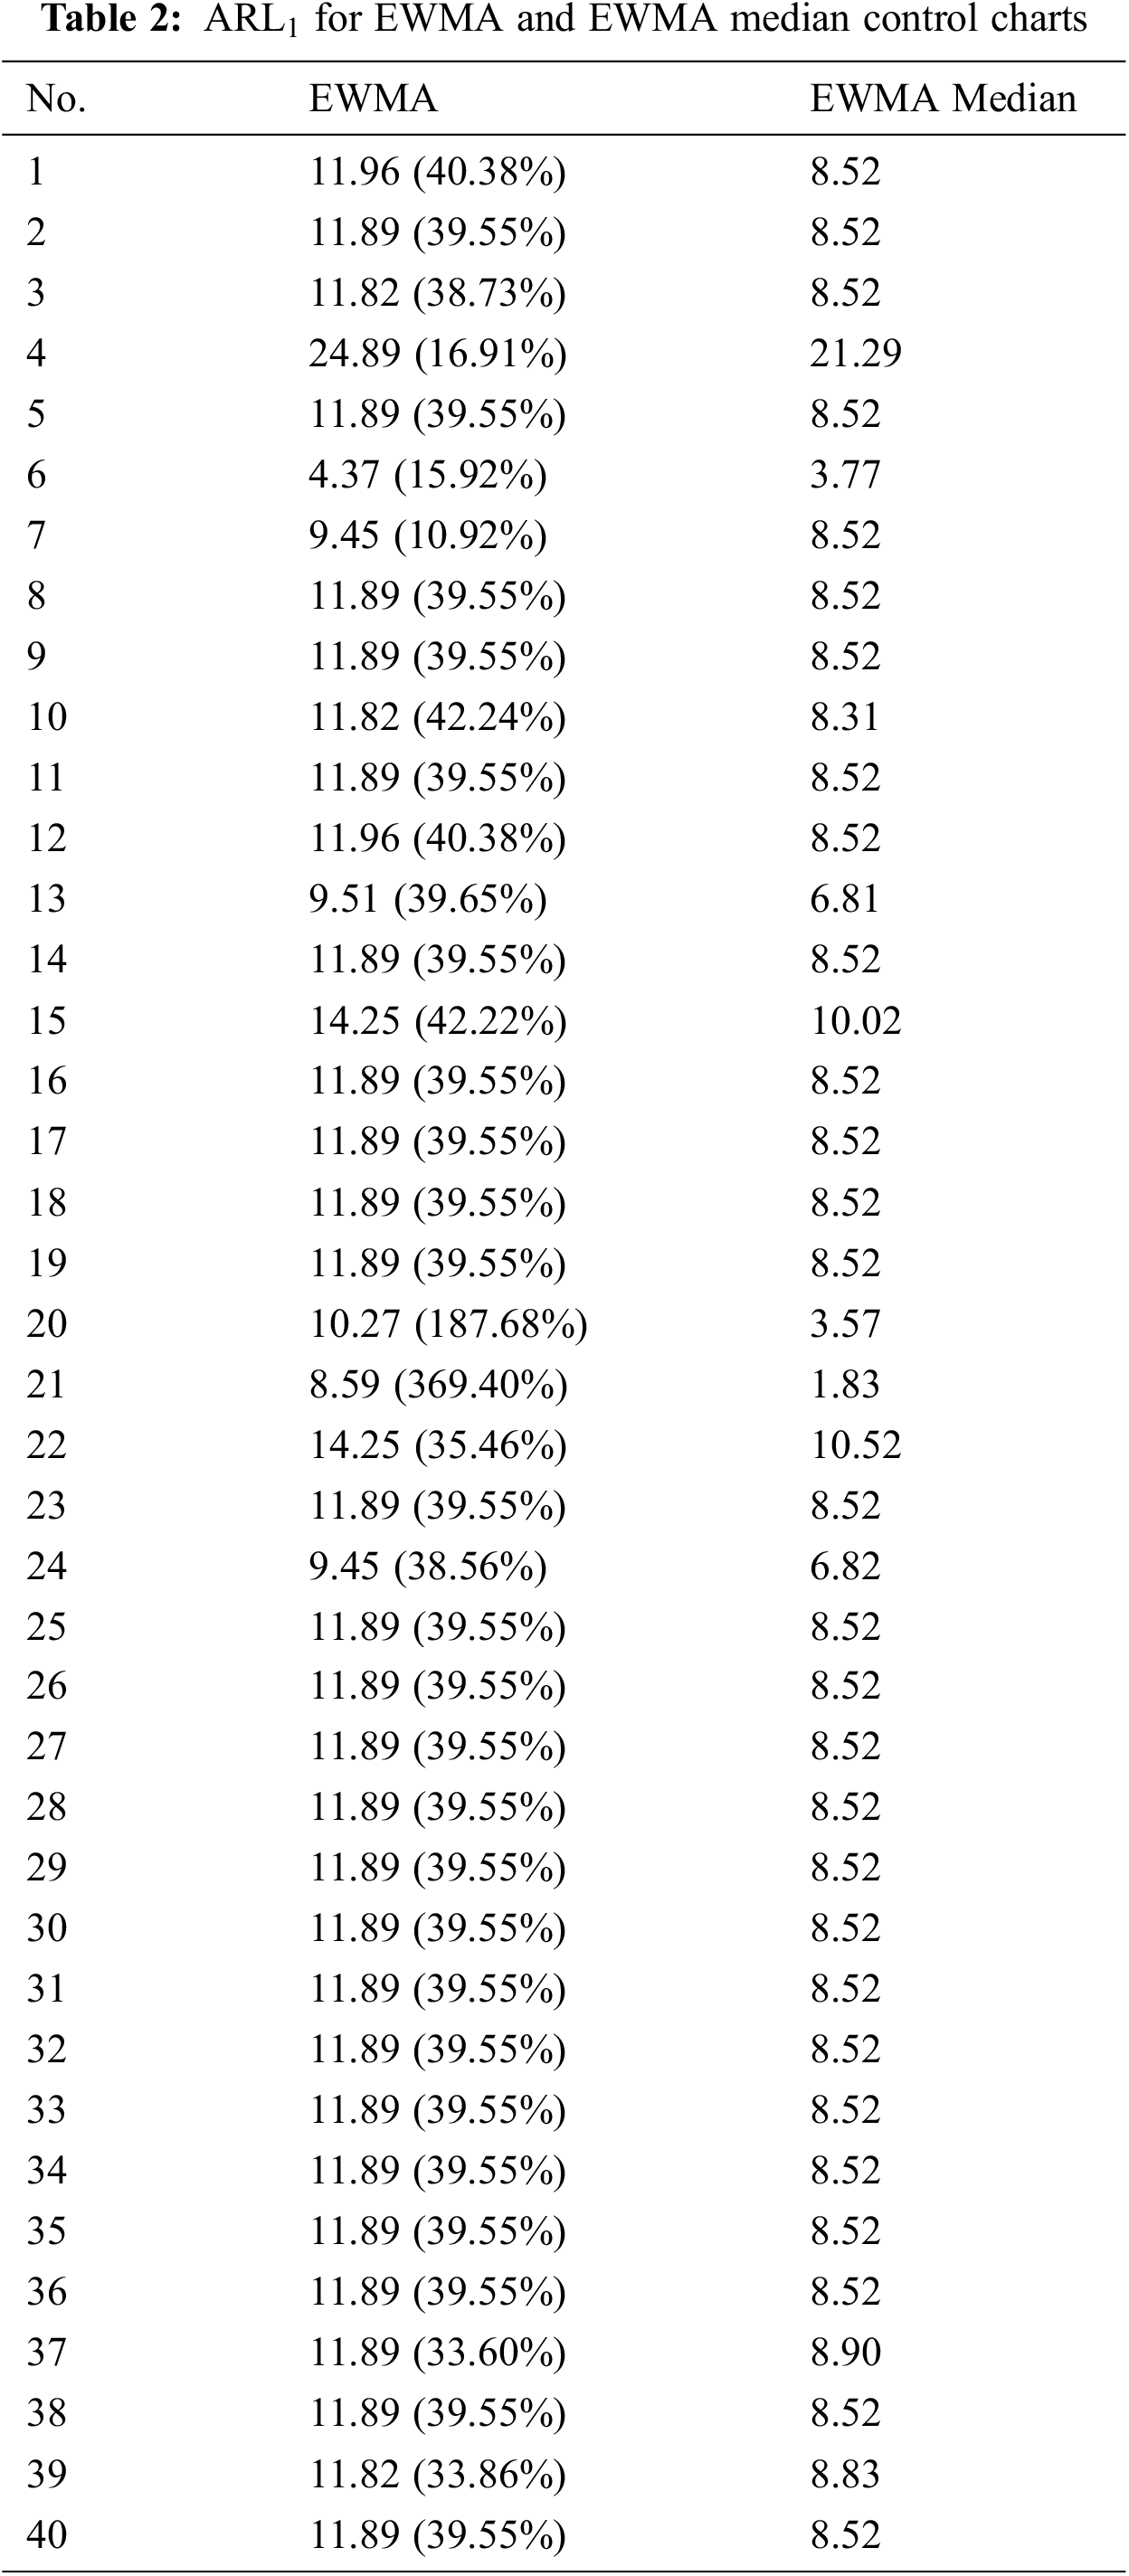
According to Tab. 2, the
When the process shift,
For the EWMA median chart, the input parameters,
Fig. 1 illustrates the
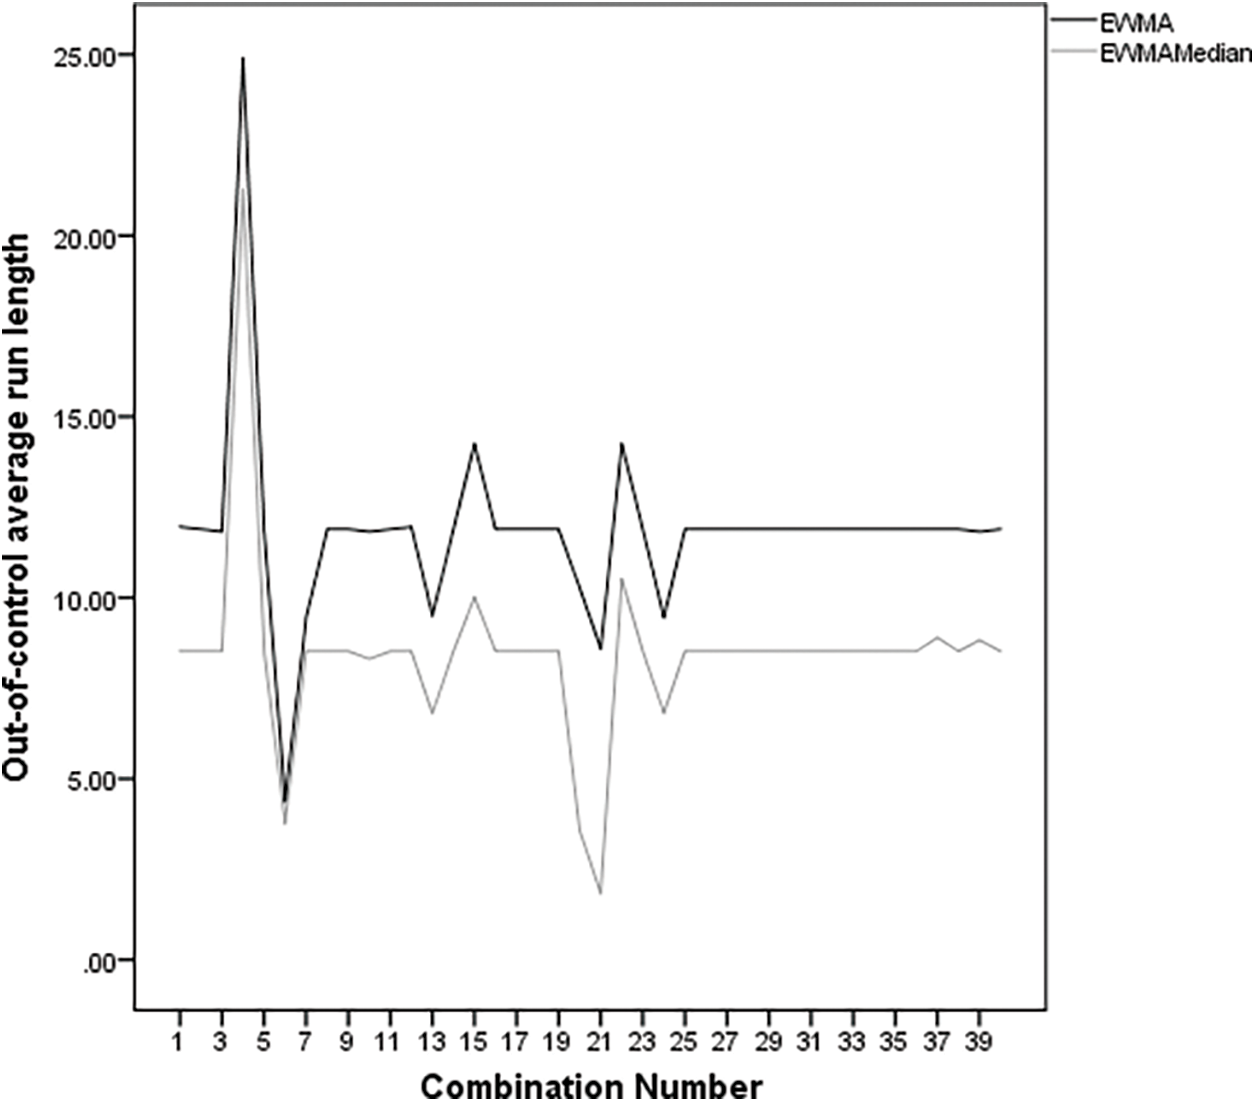
Figure 1:
The EWMA control chart has been well-known for its quick detection of small and moderate process mean shifts. Meanwhile, the EWMA median chart can be used to monitor processes containing outliers. In this study, sensitivity analysis was conducted to determine the effect of the input parameters on the
Acknowledgement: This research is supported by the Universiti Kebangsaan Malaysia, Geran Galakan Penyelidikan, GGP-2020-040.
Funding Statement: This research was funded by the Universiti Kebangsaan Malaysia, Geran Galakan Penyelidikan, GGP-2020-040.
Conflicts of Interest: The authors declare that they have no conflicts of interest to report regarding the present study.
References
1. D. C. Montgomery, Introduction to Statistical Quality Control, 8th (Eds.New York: John Wiley & Sons, Inc, 2019. [Google Scholar]
2. M. A. Abtew, S. Kropi, Y. Hong and L. PU, “Implementation of statistical process control (SPC) in the sewing section of garment industry for quality improvement,” AUTEX Research Journal, vol. 18, pp. 160–172, 2018. [Google Scholar]
3. H. W. You, M. B. C. Khoo, Z. L. Chong and W. L. Teoh, “The expected average run length of the EWMA median chart with estimated process parameters,” Austrian Journal of Statistics, vol. 49, no. 3, pp. 19–24, 2020. [Google Scholar]
4. N. G. Sengoz, “Control charts to enhance quality,” Quality Management Systems–A Selective Presentation of Case-Studies Showcasing Its Evolution, pp. 153–194, 2018. [Google Scholar]
5. K. Karoon, Y. Areepong and S. Sukparungsee, “Exact run length evaluation on extended EWMA control chart for autoregressive process,” Intelligent Automation & Soft Computing, vol. 33, no. 2, pp. 743–759, 2022. [Google Scholar]
6. N. Saengsura, S. Sukparungess and Y. Areepong, “Mixed moving average-cumulative sun control chart for monitoring parameter change,” Intelligent Automation & Soft Computing, vol. 31, no. 1, pp. 635–647, 2022. [Google Scholar]
7. N. Abbas, “Homogeneously weighted moving average control chart with an application in substrate manufacturing process,” Computers & Industrial Engineering, vol. 120, pp. 460–470, 2018. [Google Scholar]
8. S. Human, P. Kritzinger and S. Chakraborti, “Robustness of the EWMA control chart for individual observations,” Journal of Applied Statistics, vol. 38, no. 10, pp. 2071–2087, 2011. [Google Scholar]
9. Z. L. Chong, M. B. C. Khoo, W. L. Teoh, H. W. You and P. Castagliola, “Optimal design of the side-sensitive modified group runs (SSMGR)
10. P. S. Hariba and S. D. Tukaram, “Economic design of a nonparametric EWMA control chart for location,” Production Journal, vol. 26, pp. 698–706. 2016. [Google Scholar]
11. D. A., Serel, “Economic design of EWMA control charts based on loss function,” Mathematical and Computer Modelling, vol. 49, no. 3–4, pp. 745–759, 2009. [Google Scholar]
12. S. W. Roberts, “Control chart tests based on geometric moving averages,” Technometrics, vol. 1, no. 3, pp. 239–250, 1959. [Google Scholar]
13. S. Ramesh and B. A. Vasu, “Application of EWMA chart for monitoring process mean in paper industry,” Management Science Letter, vol. 9, no. 4, pp. 571–576, 2019. [Google Scholar]
14. A. K. Patel and J. Divecha, “Modified exponentially weighted moving average (EWMA) control chart for an analytical process data,” Journal of Chemical Engineering and Materials Science, vol. 2, no. 1, pp. 12–20, 2011. [Google Scholar]
15. P. Castagliola, “An X/R–EWMA control chart for monitoring the process sample median,” International Journal of Reliability, Quality and Safety Engineering, vol. 8, no. 2, pp. 123–135, 2001. [Google Scholar]
16. K. J. Chung, “A simplified procedure for the economic design of control charts: A unified approach,” Journal Engineering Optimization, vol. 4, pp. 313–320, 1991. [Google Scholar]
Cite This Article
 Copyright © 2023 The Author(s). Published by Tech Science Press.
This work is licensed under a Creative Commons Attribution 4.0 International License , which permits unrestricted use, distribution, and reproduction in any medium, provided the original work is properly cited.
 Downloads
 Citation Tools