
 Submit a Paper
 Propose a Special lssue
 Open Access
ARTICLE
A Novel Method for Heat Exchange Evaluation in EV
Mechanical Engineering Department, Faculty of Engineering, Mutah University, Karak, 61710, Jordan
* Corresponding Author: Mohammad Saraireh. Email:
Intelligent Automation & Soft Computing 2023, 36(1), 57-70. https://doi.org/10.32604/iasc.2023.032050
Received 05 May 2022; Accepted 08 June 2022; Issue published 29 September 2022
 View Full Text
 Download PDF
Abstract
With the growing global energy and environmental problems, electric vehicles that are both environmentally friendly and cost effective have seen rapid growth. An electrified vehicle’s effective thermal management must include all of the vehicle’s systems. However, optimizing the thermal behavior of each component is insufficient. A lithium-ion battery’s operating temperature has a significant impact on its performance. When working at low temperatures, the internal resistance of lithium-ion batteries increases, the available energy and power of the system decreases, and lithium precipitation caused by low-temperature charging may cause safety issues; high-temperature operation and temperature inconsistency between battery cells will cause accelerated ageing of the battery, which may result in safety issues such as thermal runaway. As a result, to keep the temperature of the battery module under control, electric cars require a strong thermal management system. Thermal management must be handled at the system level to maximize the vehicle’s overall performance. The integrated thermal management system for electric vehicles has the potential to significantly increase vehicle energy efficiency. However, it’s construction is complicated due to the thermal requirements of the battery and cabin. In this research, a multi-channel liquid cooling system with a serpentine wavy structure was used to conduct an experimental thermal investigation of a lithium-ion battery pack. The suggested cooling system’s capabilities was examined under various charge/discharge scenarios using varied coolant flow rates and pumping power. The findings revealed that the suggested cooling system was successful across a variety of charging and discharging settings, with most of the tested scenarios achieving a maximum temperature difference.Keywords
In recent years, driven by problems such as environmental pollution and energy shortage, the new energy vehicle industry represented by electric vehicles has developed rapidly [1], because it is more energy-saving and environmentally friendly than traditional internal combustion engine vehicles. Due to its superior qualities such as high energy density, high output voltage, low self-discharge rate, and no memory effect, lithium-ion batteries have become the main option for electric vehicle power batteries [2]. Studies have shown that the performance and safety of batteries are significantly affected by temperature [3]. Lithium-ion batteries will generate a certain amount of heat during the charging and discharging process. It is quite simple to cause the temperature of the battery pack to rise if the heat is not drained in a timely manner. Excessive temperature will not only promote the growth of the solid electrolyte interface layer, increase the battery’s internal resistance, and reduce energy conversion efficiency, but it will also melt the separator, causing an internal short circuit in the battery and then a temperature rises and runaway (i.e., thermal runaway) [4,5]. In addition, due to the close arrangement of the batteries in the module, the heat generated by the single battery is easy to accumulate, resulting in uneven temperature in the battery pack, reducing the consistency of the batteries in the module, and then causing different thermal effects in each battery, which further expands the temperature difference and a vicious circle is formed [6–12]. Therefore, in order to ensure that the power battery works within a safe temperature range and enhance the consistency of the cells in the battery pack, the power battery thermal management system plays an important role in electric vehicles.
Battery thermal management technology can be divided into air cooling [13–20], liquid cooling [21–28] and phase change material (PCM) cooling [29–35] according to different cooling media. Air cooling is one of the most common and widely used cooling methods. Air cooling can be divided into natural convection and forced convection according to the flow state. The heat transfer coefficient of forced convection is much higher than that of natural convection, but it requires extra work. At present, the research of air cooling system mainly focuses on the flow channel optimization of the stack [13,14], the arrangement method and the design of the air intake method [15,16], etc. Although some enhancement effects have been achieved, the air cooling system has low heat dissipation. Capability deficiencies still exist and need to be optimized in combination with other means, such as coupling air cooling with HVAC. This method has been applied in Toyota Prius, Ford, Honda and other products one after another, however, without sacrificing the thermal comfort of the cockpit, to ensure the thermal control requirements of the battery under complex operating conditions and to ensure the comprehensive requirements of the thermal performance of the battery, it is still an urgent problem to be overcome in the coupling of air-conditioning air cooling [17–20].
The PCM cooling utilizes the phase change latent heat of phase change materials to absorb and store the heat released by the battery, and then transfer it to the outside air to achieve battery cooling [21–23]. As a passive thermal management method, PCM cooling can save additional power consumption [11–26] and has broad application prospects. However, PCM cooling is still in the research stage [31], and there are still many problems in practical applications. For example, heat dissipation performance is considerably reduced once the PCM on the heat dissipation surface is entirely melted due to the poor thermal conductivity of the PCM in the molten state, yet it raises the problem of heat dissipation failure [33]. Reference [34] added high thermal conductivity materials to PCM, which can improve the thermal conductivity of PCM, but when using carbon materials to strengthen PCM, it is difficult to achieve a balance between latent heat and conduction heat. In addition, due to the volume expansion of the phase change, the use of PCM cooling has the problems of occupying system space and increasing the weight of the vehicle body, and there is still a certain distance from commercial popularization [35,36].
The liquid-cooled thermal management system uses an aqueous solution with ethylene glycol added for antifreeze treatment as the cooling medium. Compared with PCM, the liquid working medium has high thermal conductivity [4], and does not need to consider the problem of volume change. Compared with air cooling, liquid cooling has higher battery thermal management capability although it increases the system weight and structural complexity [26]. A report by the National Renewable Energy Laboratory (NREL) in the United States shows that liquid cooling can extend the life cycle of lithium-ion batteries more effectively than air cooling [37]. With the increasing demand for battery cooling, liquid cooling, as the most advantageous cooling method, is gaining more and more research attention and commercial applications. Commercial products represented by Tesla’s Model S, Model X, Ford’s Focus, Audi’s R8 e-tron, GM’s Chevrolet, etc. all use liquid-cooled battery thermal management systems, and more and more battery heat Management research also focuses on liquid-cooled systems [27]. Based on the conventional straight channel cold plate, reference [21] studied the influence of factors such as the number of channels, flow direction, flow rate and ambient temperature of the multi-channel structure, and the results showed that increasing the number or flow rate of the channels can significantly improve the liquid cooling plate. cooling performance, while flow direction has less effect on cooling performance. For example, because to the poor thermal conductivity of PCM in the molten state, heat dissipation performance is dramatically reduced after completely melting the PCM on the heat dissipation surface, resulting in heat dissipation failure [22], combined with a corrugated channel liquid cooling scheme to study different charge-discharge rates, coolant flow rates, battery contact surface and the effect of the cell and channel interface. Reference [23] developed a honeycomb thermal management system that surrounds the coolant in all directions, and used an electric heating scheme to simulate the heat production process of the battery under the 3 C discharge state. The battery cooling under high temperature conditions and the battery heating function under low temperature conditions were experimentally studied. Reference [28] adopted an indirect liquid cooling system to cool the cylindrical lithium-ion battery module, performed various single-rate charge-discharge cycles on the battery, and simulated the working conditions of the battery under actual driving conditions. A comprehensive thermal analysis was carried out on the maximum temperature, the maximum temperature difference, and the percentage of heat storage. During the driving of an electric vehicle, the power battery operates at various charge-discharge rates (C-rates) according to power regulation, resulting in changes in the thermal load of the battery thermal management system. For the liquid-cooled thermal management system, study the coolant flow rate, pump function consumption and thermal management benefits required by the battery under various charge and discharge rates, which can reduce excess energy consumption while ensuring the cooling effect, and provide guidance for engineering applications significance. Based on the multi-channel serpentine bellows liquid-cooled thermal management system, this paper takes the power battery module composed of 200 18650 lithium-ion batteries as the thermal management object. The thermal management scheme was experimentally investigated.
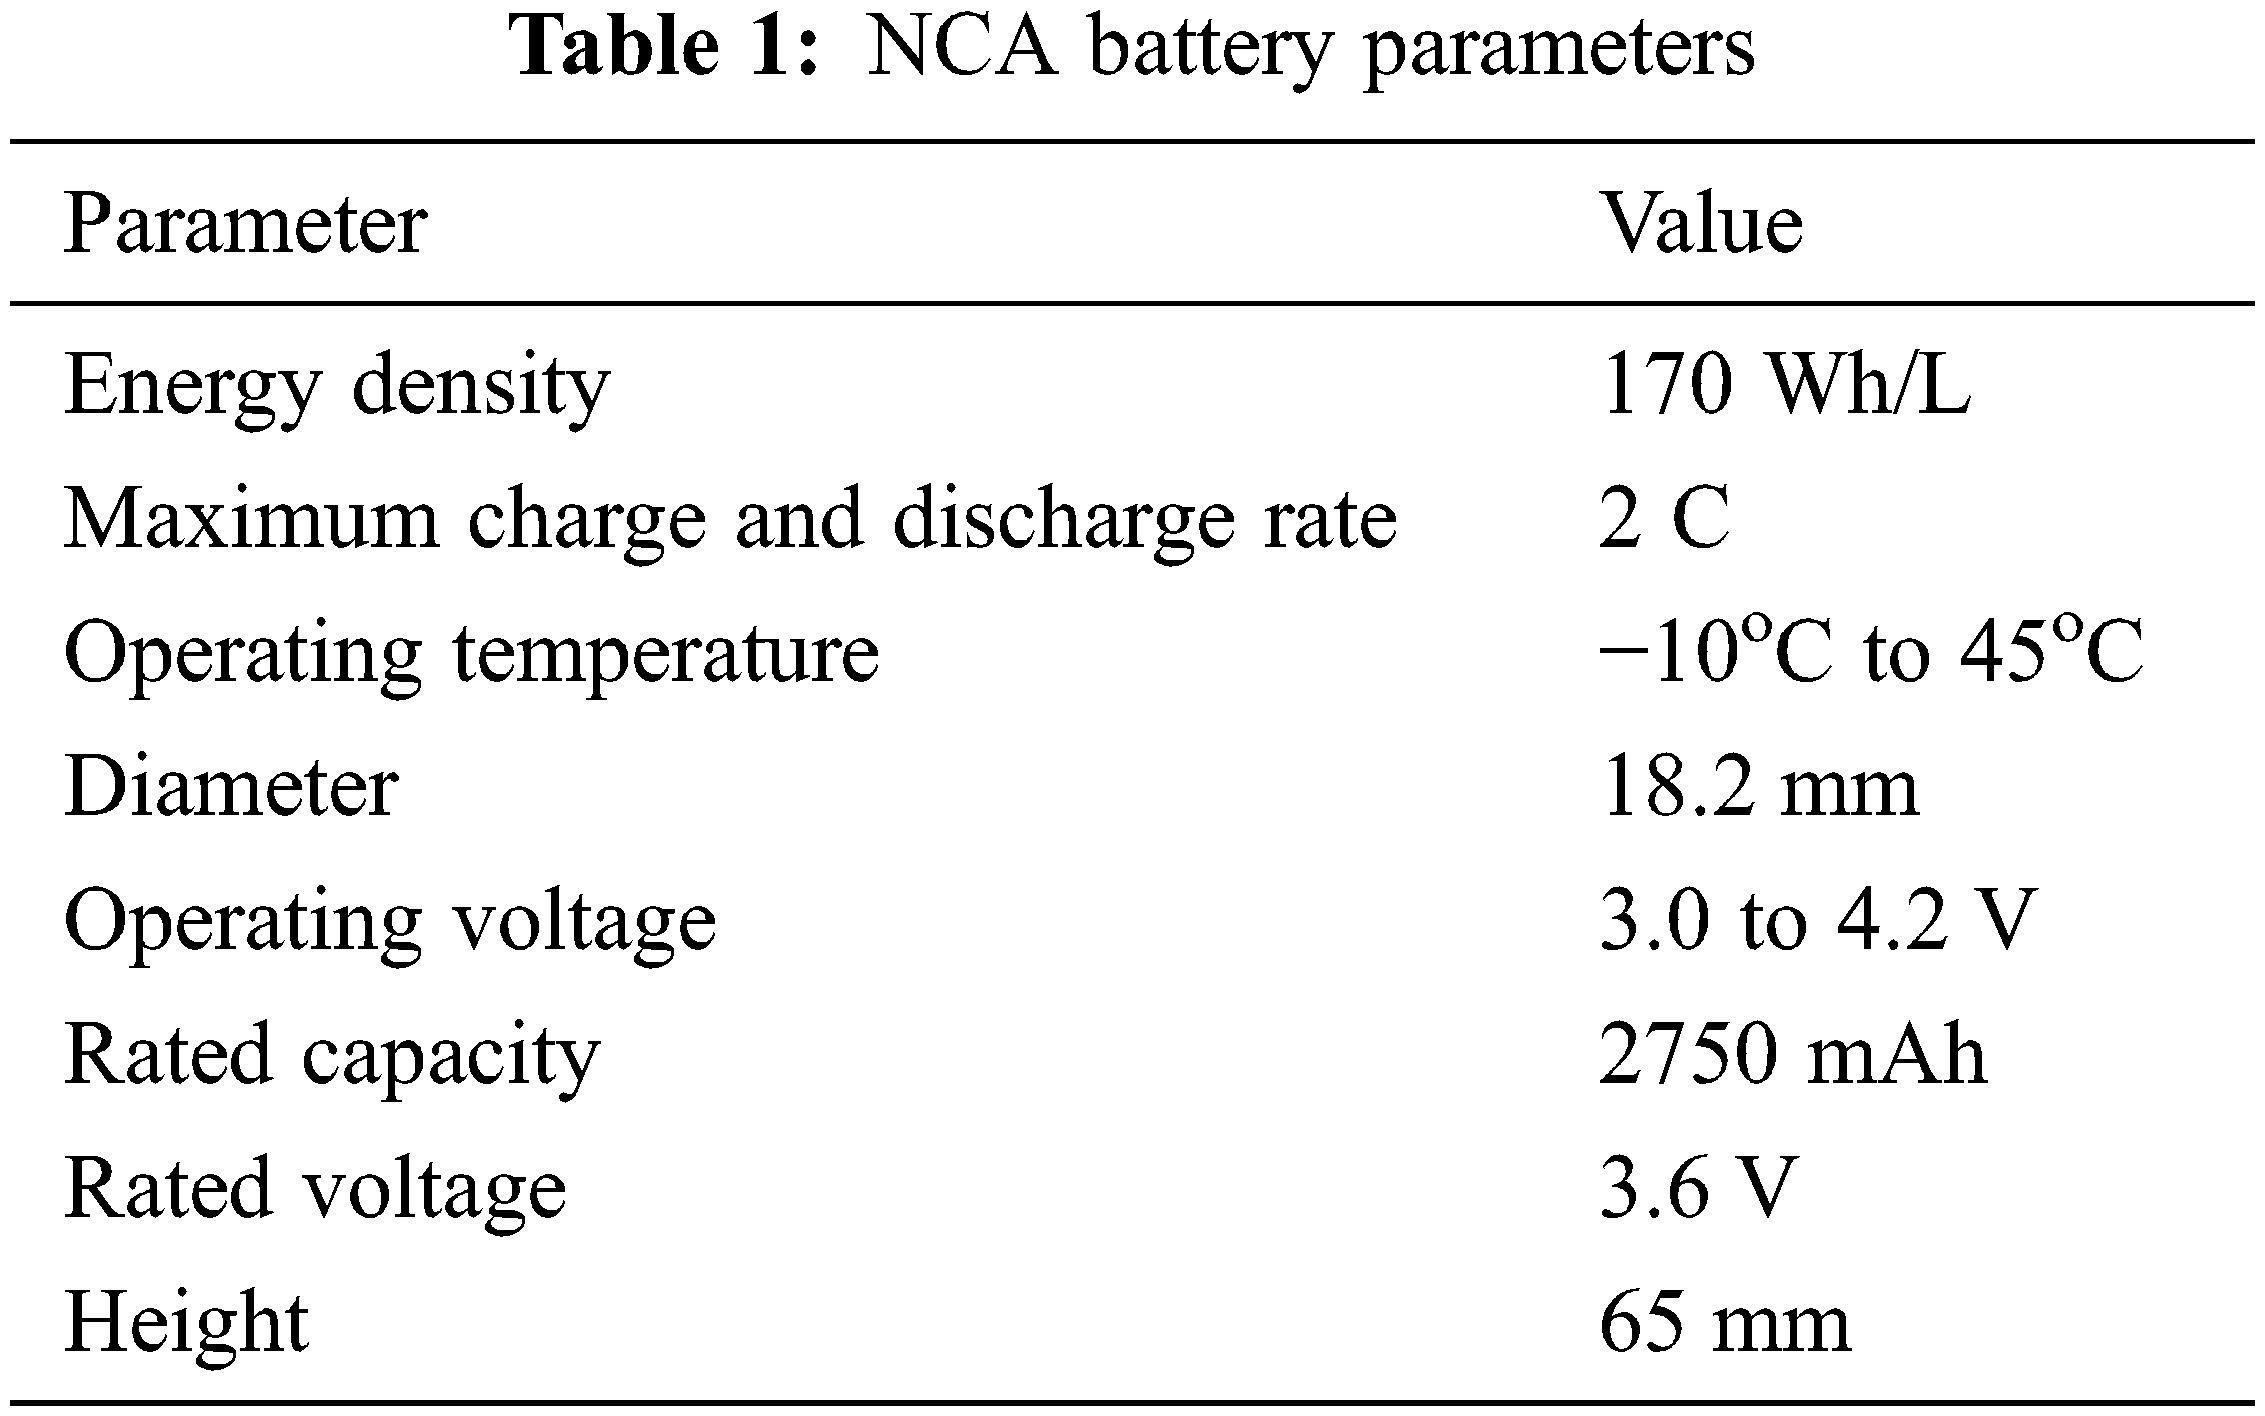
The performance parameters of the single battery used in the experiment are shown in Tab. 1. It is a commercial 18650 lithium-ion battery produced by BAK Company, with a nominal capacity of 2750 mAh, the anode material of the battery is graphite, and the cathode material is nickel-cobalt aluminate (NCA). The battery module is made by welding 200 single cylindrical lithium-ion batteries in 10 parallel and 20 series with metal nickel sheets. The selected batteries were repeatedly cycle tested with Hybrid Pulse Power (HPPC) to determine their open circuit voltage (OCV), capacity and internal resistance, and were screened according to the following criteria: 1) The capacity is 2 750 ± 50 mAh; 2) Internal resistance is 30 ∼ 40 mΩ [100% state of charge (SOC) and ambient temperature T0 = 25°C]; 3) Open circuit voltage is 4.18 ∼ 4.185 V (100% SOC and ambient temperature T0 = 25°C) [31].
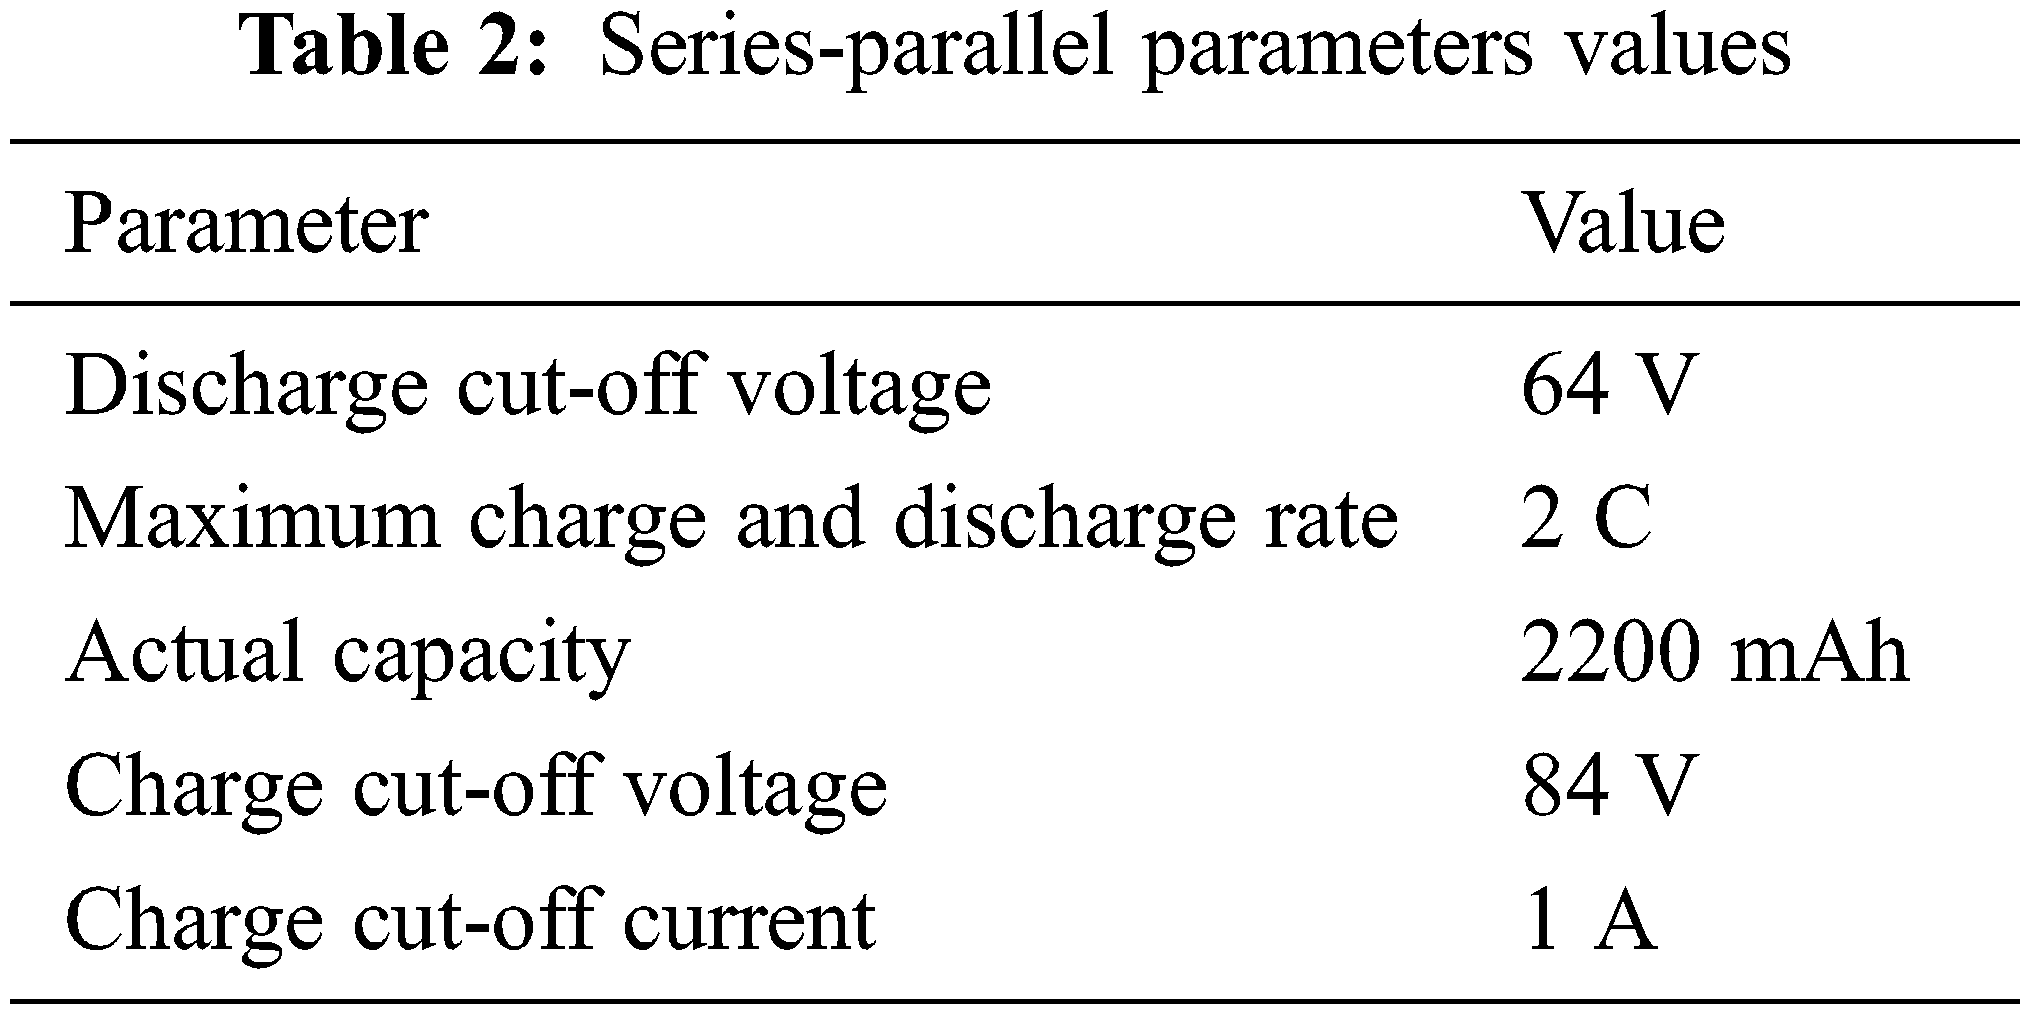
For the cylindrical battery used in the experiment, the contact area between the serpentine corrugated tube and the battery is larger than that of the ordinary tube. When the contact area between the cold tube and the battery is larger, the heat dissipation capacity is better. Therefore, the serpentine corrugated tube is selected. tube as cooling tube. Fig. 1 shows the battery pack liquid-cooled thermal management system based on serpentine bellows. The system consists of a heat exchanger, a water pump, a flowmeter, a differential pressure gauge and a battery module with a serpentine bellows cooling channel. Distilled water is used as the Coolant. The detailed structure of the battery module is shown in Fig. 2 and the performance parameters is shown in Tab. 2. The battery module is composed of a battery module and a serpentine corrugated cooling channel assembled. The serpentine bellows is 30.50 m long, 35 mm high, and 3 mm thick. There are four small flow channels in the tube, each of which is 5 mm long and 3 mm wide. A thermal pad is placed between the outer wall of each battery and the contact surface of the serpentine pipe, and thermal grease is applied to ensure that the two are closely attached to reduce the contact thermal resistance. The battery module is covered and wrapped with thermal insulation cotton to reduce the influence of air convection on the thermal load of the thermal management system.
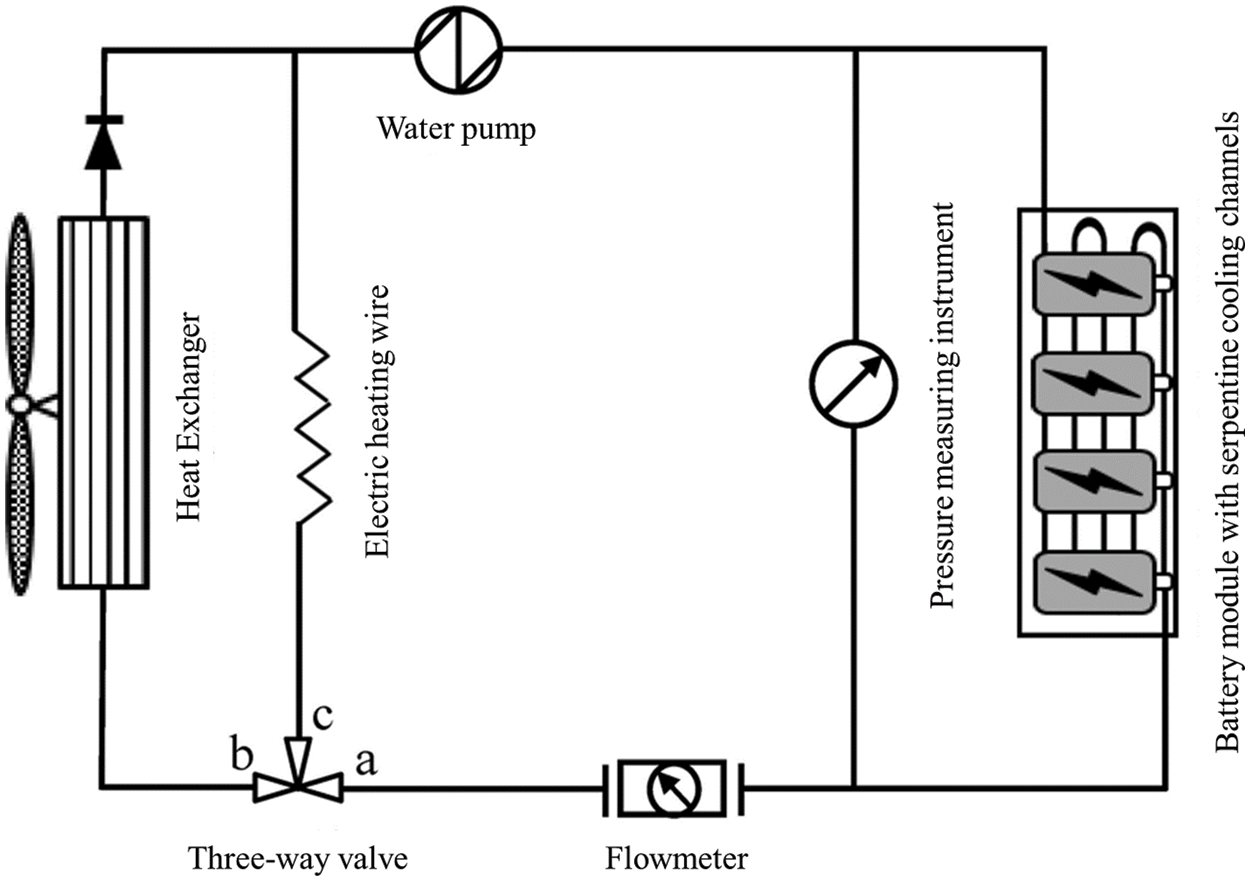
Figure 1: Proposed system model
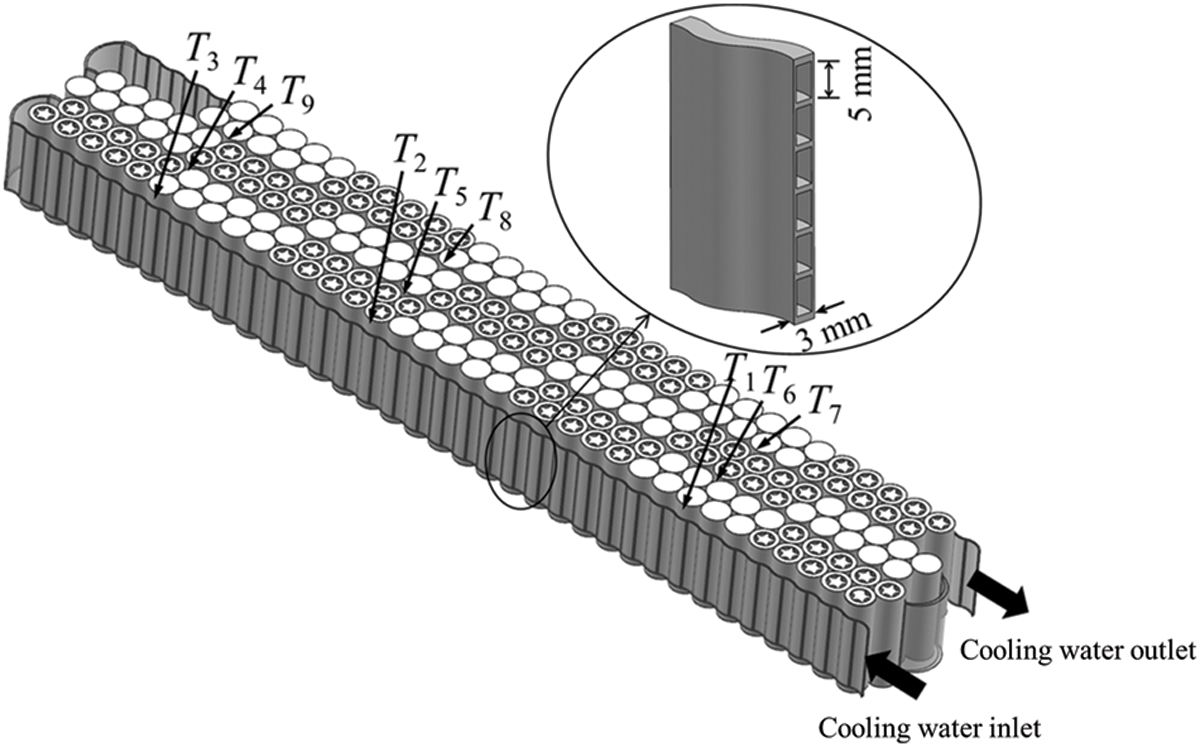
Figure 2: Illustration of measuring temperature of the module
During the experiment, the three-way valve ab is turned on, the ac is closed, the heat exchanger fan is started, and the water pump is operated to make the cooling water begin to circulate. After cooling the battery through the serpentine corrugated pipe, the heat is discharged to the outside air. The flowmeter used in this experiment has the function of flow adjustment, and the circulating flow of cooling water is set through the flowmeter.
The charging and discharging of the battery is controlled and realized by the sub-source BTS−650–300–2 battery cycle test device. The pressure drop at the inlet and outlet of the battery module coolant was measured with a Senex DP 1300-DP5E22M4B1 differential pressure sensor. Use K-type thermocouple to measure the battery surface and ambient temperature. The layout of the battery surface temperature test points is shown in Fig. 2. The thermocouple and differential pressure sensor were connected with Agilent 34970A data acquisition device, which was collected and stored every 10 s. The flowmeter is a DK−800–6F type liquid flowmeter with a minimum flow of 16 L/h and a resolution of 8 L/h. The battery module is also equipped with a battery protection circuit board, which is used to balance the current between the battery cells and prevent the battery from being overcharged and overdischarged.
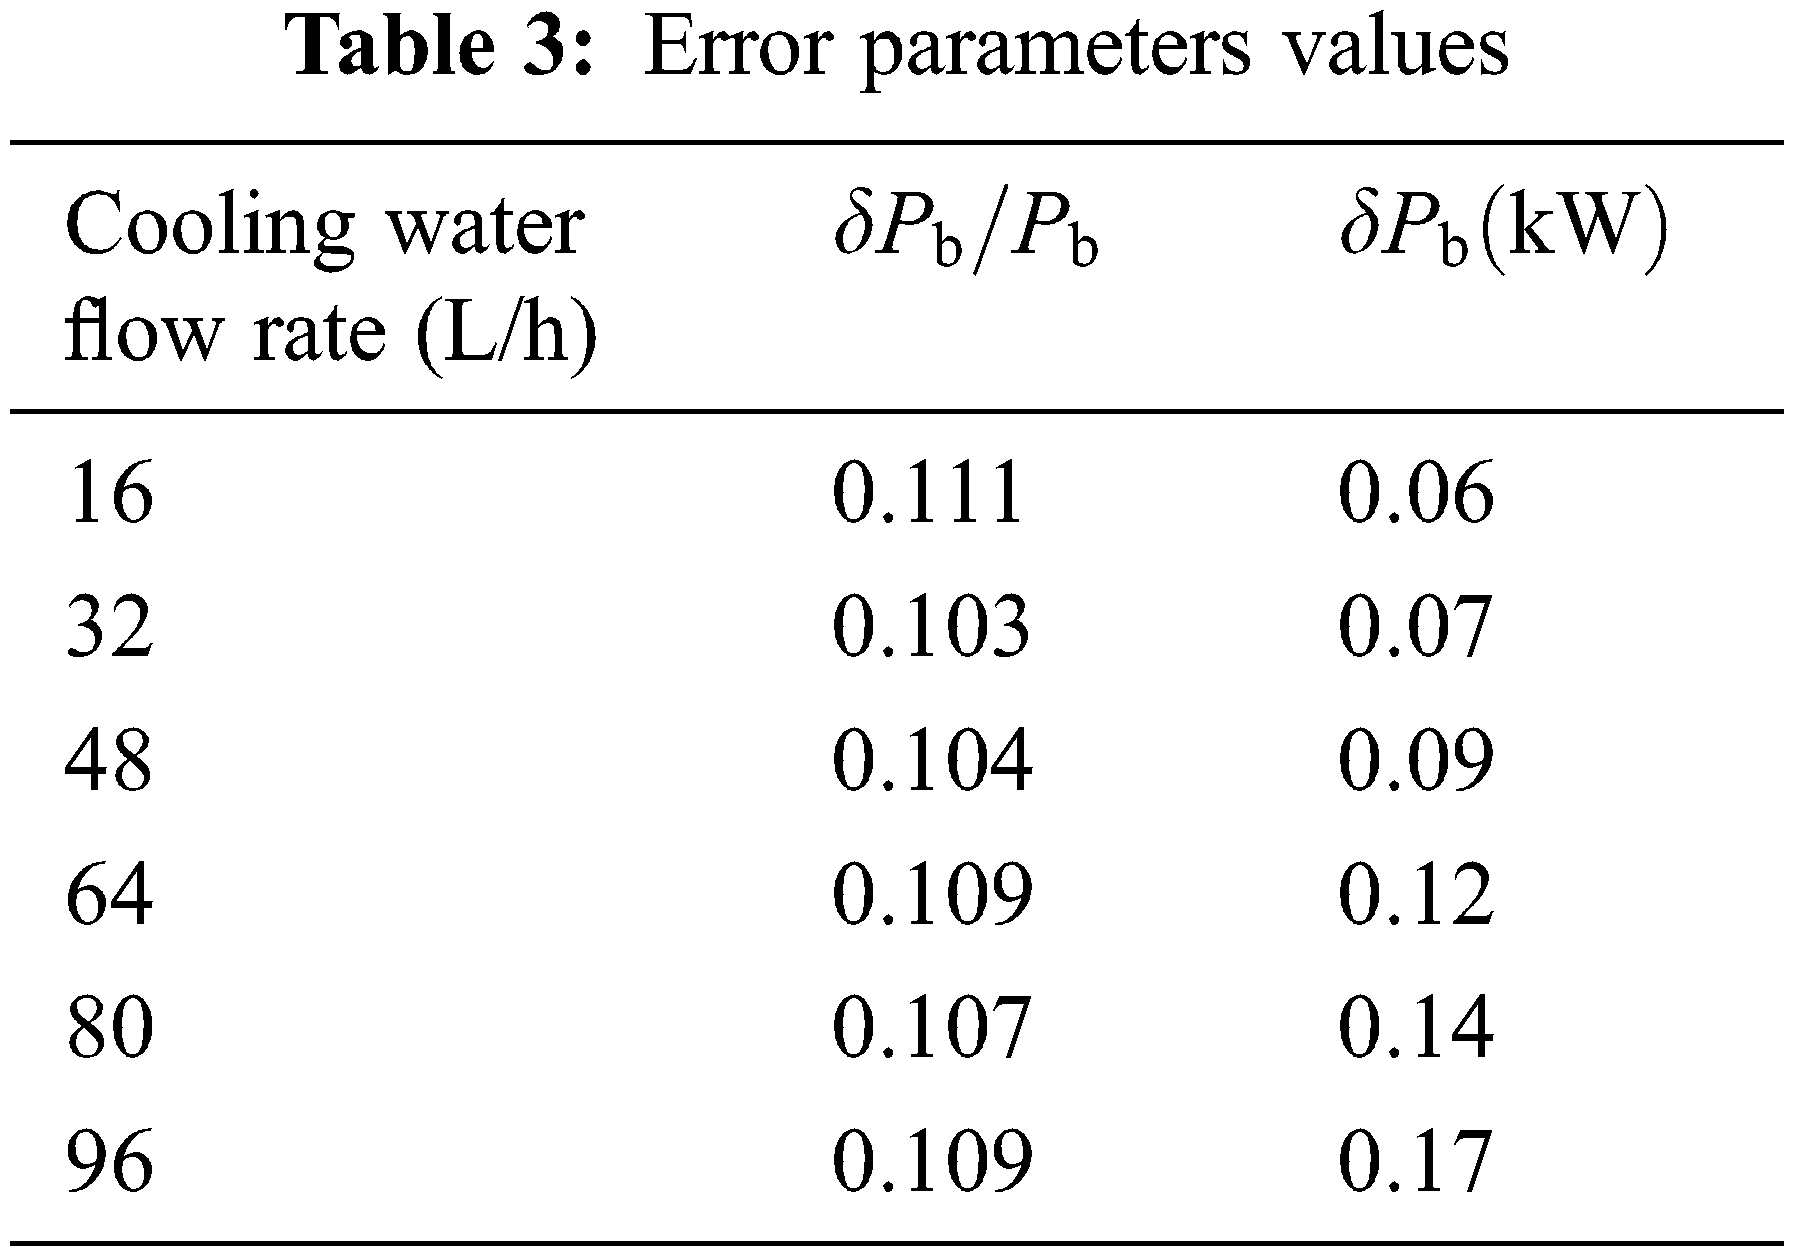
The main source of error in the experiment is the error caused by the thermocouple measuring temperature and the differential pressure sensor measuring pressure drop. The temperature measured by the K-type thermocouple is Ti (i represents the temperature measurement points 1 to 9 in Fig. 2), the absolute error ΔTi is ± 0.3°C, and the minimum temperature Tmin during the test is the ambient temperature of 25°C, then the relative error ΔTi/Ti is 1.2%. The pressure range measured by the differential pressure transmitter in this experiment is 0 ∼ 100 Pa, and it is converted into a 4 ∼ 20 mA direct current (DC) signal output. The relationship between the pressure signal and the current signal is shown in Eq. (1). Among them, the zero-point error is 0.039 mA, and the absolute error caused by the measurement reading is 0.025 mA. Combined with Eq. (1), the absolute error Δpi of the measured pressure drop can be obtained as ± 0.4 kPa. During the test, the minimum pressure drop pmin is 85 kPa, and the relative error Δpi/pi is 0.4%. The absolute error caused by the reading of the liquid flowmeter is ± 4 L/h. In order to avoid the overlap of flow velocity values caused by the existence of the absolute error, the experiment uses 16 L/h as the flow increment. Eq. (2) is the calculation formula of the pump power Pb consumed by the cooling channel of the battery module. According to the method of [38] and the ANSI/ASME [39] standard, when the parameter R is a function of the parameter Xi, that is, R = f(Xi), the calculation equations of the absolute and relative errors are Eqs. (3)–(4). Combined with Eq. (2), the absolute error and relative error of the pump work can be obtained at different flow rates shown in Tab. 3 [40].
In the formula:
The battery charging process adopts a constant current and constant voltage (CC-CV) scheme, first charging with constant current until the battery voltage reaches 4.2 V, then keeping the voltage constant, and continuing to charge until the current drops to 1/30 C. The discharge process adopts a constant current scheme, and the discharge is terminated when the battery voltage is 3 V.
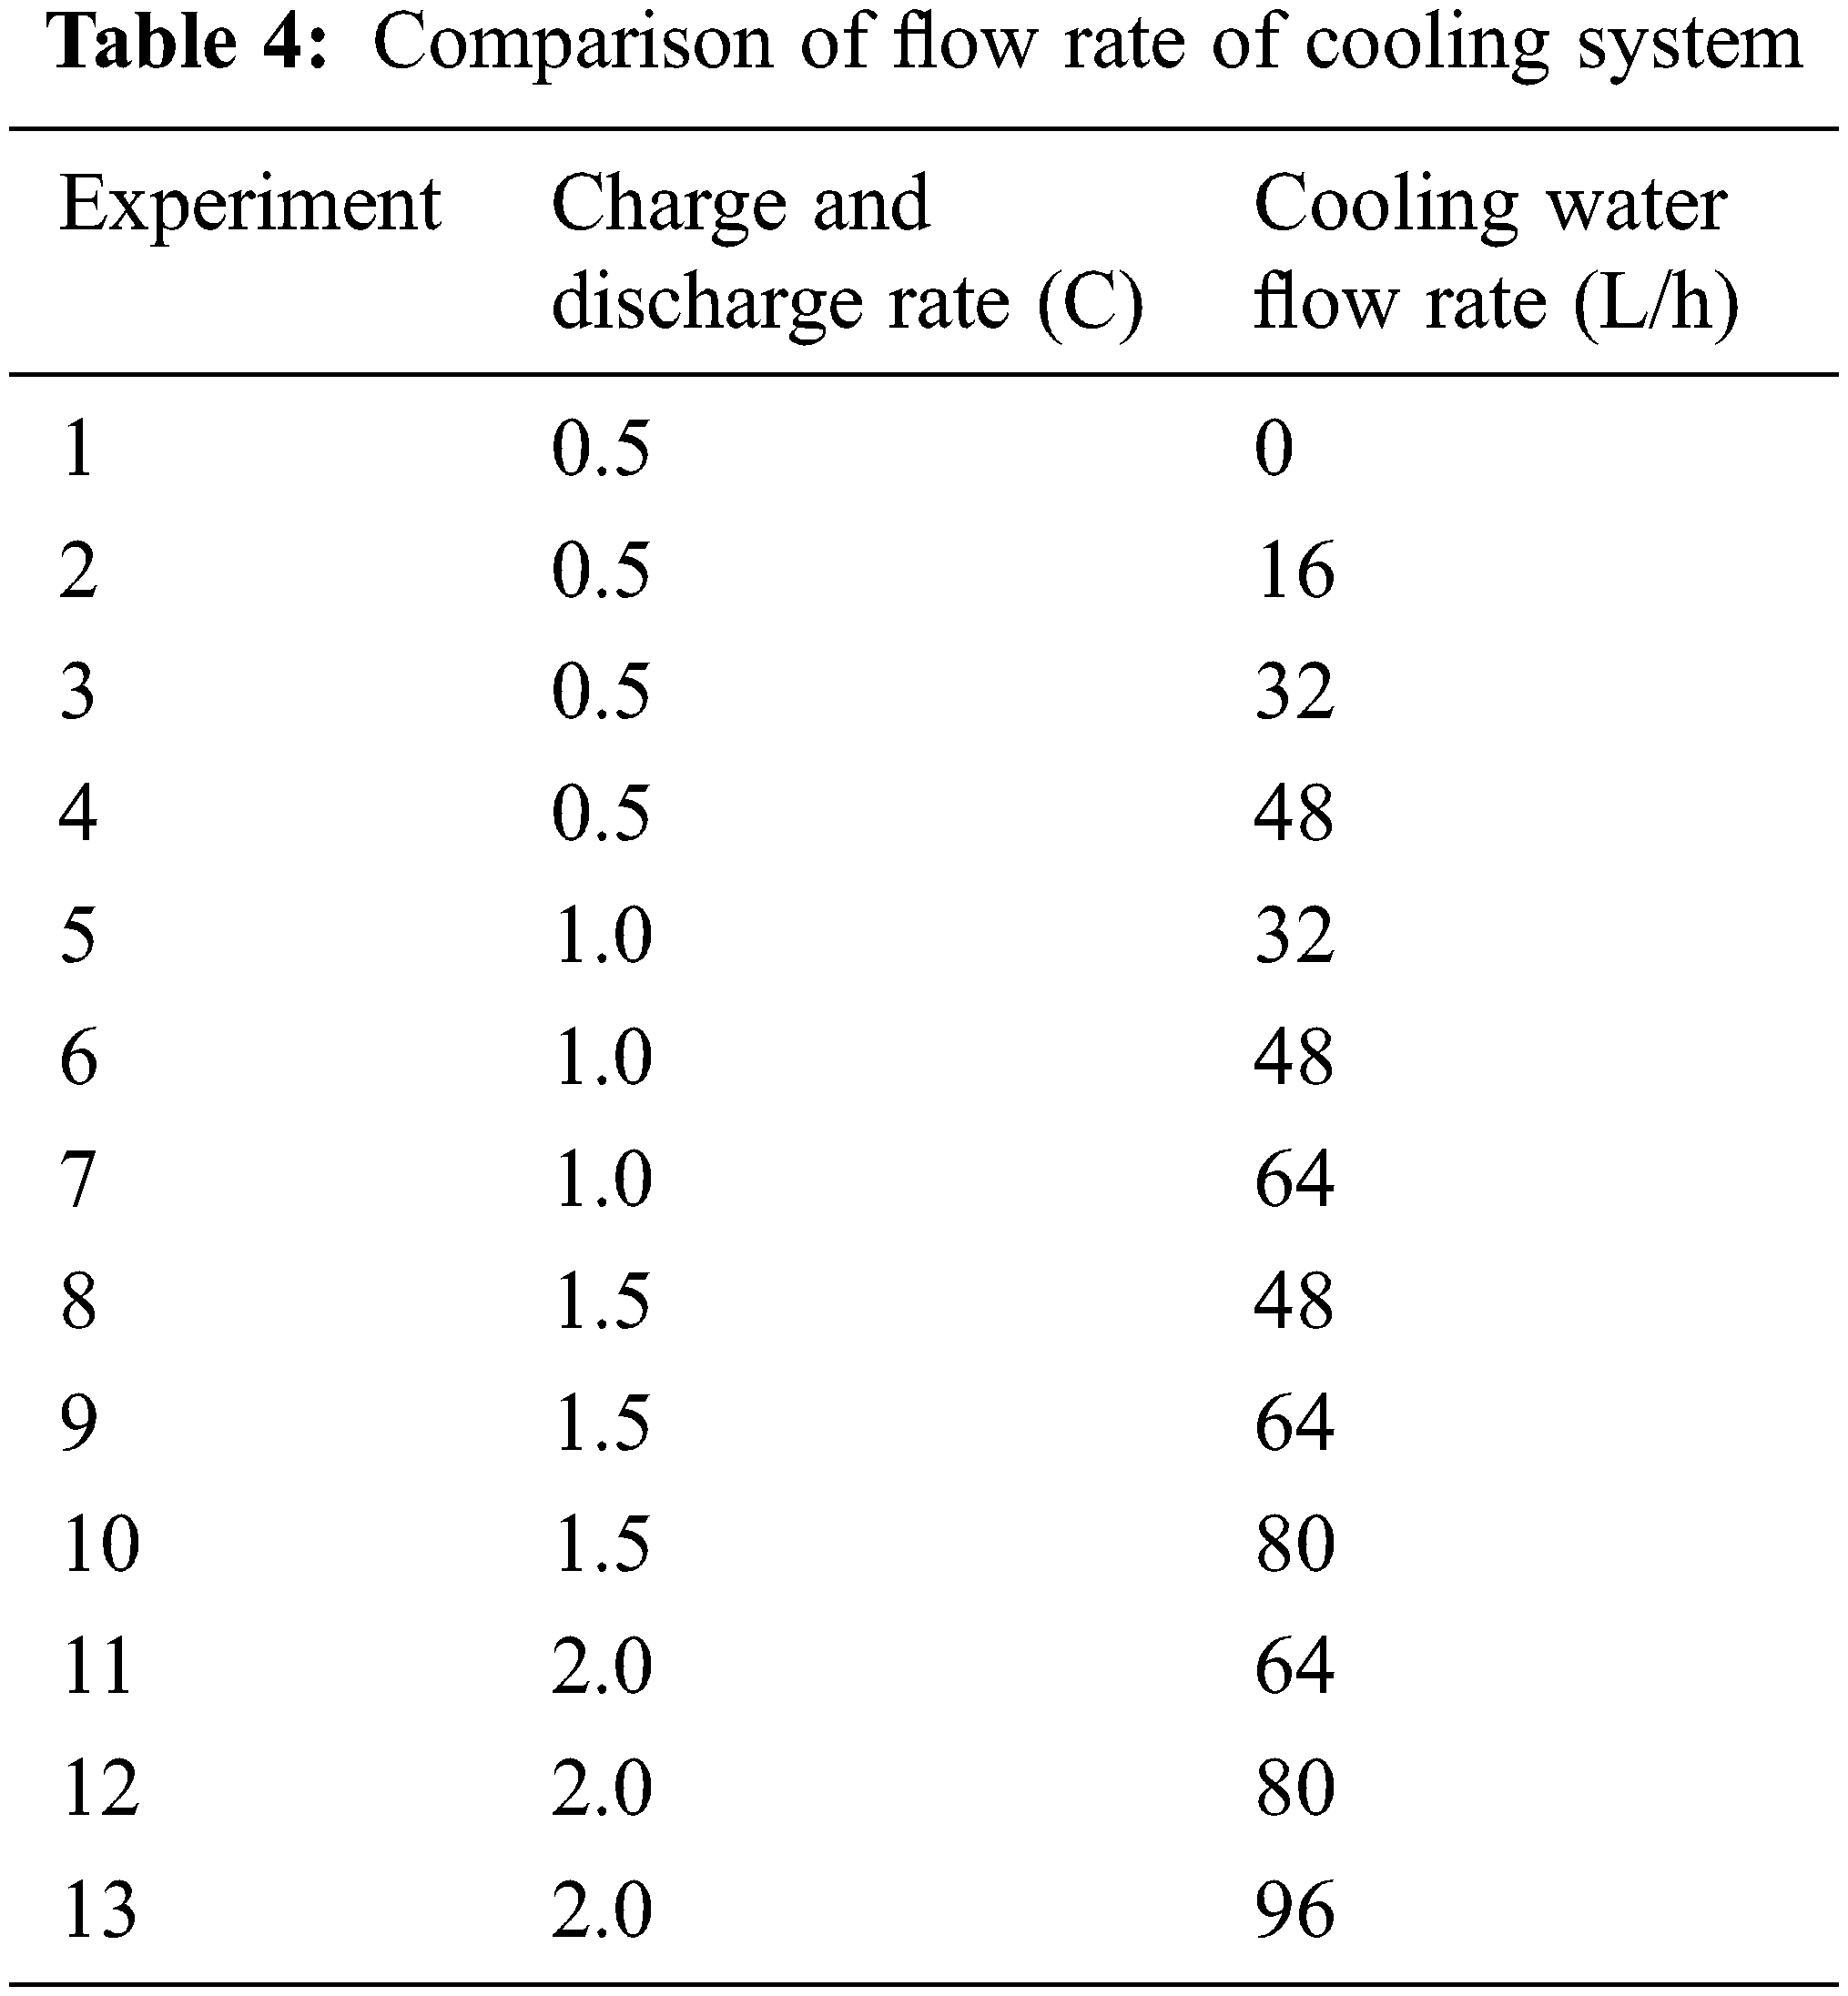
The experiment was carried out in an indoor environment of 25°C, and the ambient temperature was controlled by an air-conditioning unit. Before each set of tests, start the thermal management system and run it for a certain period of time. When the temperature of the battery pack is consistent with the ambient temperature, start the charging test. After the charging process, continue to fully cool the battery pack to the ambient temperature, and then start the discharge test. The battery pack was charged and discharged at 0.5 C, 1 C, 1.5 C, and 2 C rates, and the cooling water flow rate of the thermal management system increased sequentially at each charge and discharge rate, as shown in Tab. 4. A single charge and a single discharge under each flow rate and rate are one set of tests, and a total of 26 sets of tests are carried out, and repeatability verification is carried out.
Figs. 3 and 4 show the water-cooling cycle without starting (the cooling water flow rate is 0 L/h) and the starting water-cooling cycle (the cooling water flow rate is 16 L/h, 32 L/h and 48 L respectively) at 0.5 C charge and discharge/h) variation of battery module temperature value with SOC and depth of discharge (DOD). After starting the water-cooling cycle, the temperature of the battery is greatly reduced compared with that when the water-cooling cycle is not started at 39.7°C (Fig. 3b) decreased to T8 = 32.8°C (Fig. 4b). During the charging process, the temperature curve evolves in a trapezoidal shape. At the beginning of charging, the SOC of the battery module is low and the internal resistance is large. At this time, the heat generated by the battery is greater than the heat dissipation, and the temperature is on the rise. As the SOC increases, the difference between the working voltage and the open circuit voltage (E-E0) decreases, and the internal resistance and heat generation rate of the battery also decrease [41]. When the heat generation decreases to a balance with the heat dissipation, the battery temperature begins to show a steady and slightly decreasing trend. As the cooling water flow rate increases and the heat dissipation rate increases, the magnitude of the battery temperature drop also increases. When SOC = 0.76, the voltage of the battery reaches the set cut-off voltage, and the charging method is changed from constant current charging to constant voltage charging. During the discharge process at a rate of 0.5 C, the temperature range of different flow rates is almost the same. Due to the inconsistency of the batteries, the temperature rise of one battery is significantly higher than that of other batteries, but the temperature rise of this battery is also obvious with the increase of the flow rate. decreased, indicating that increasing the cooling water flow rate can significantly improve the cooling capacity of the system.
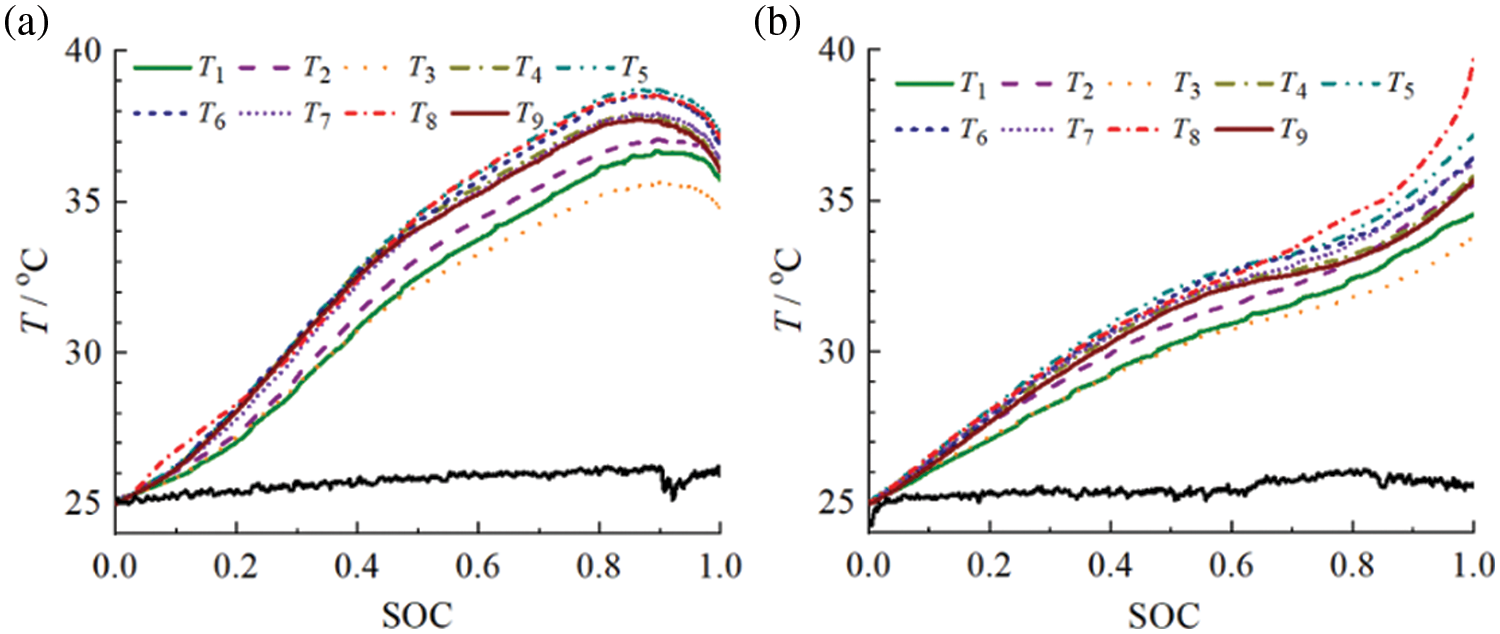
Figure 3: Comparison of the battery temperature with SOC and no water cooling and rate of 0.5 C. (a) charging; (b) discharging
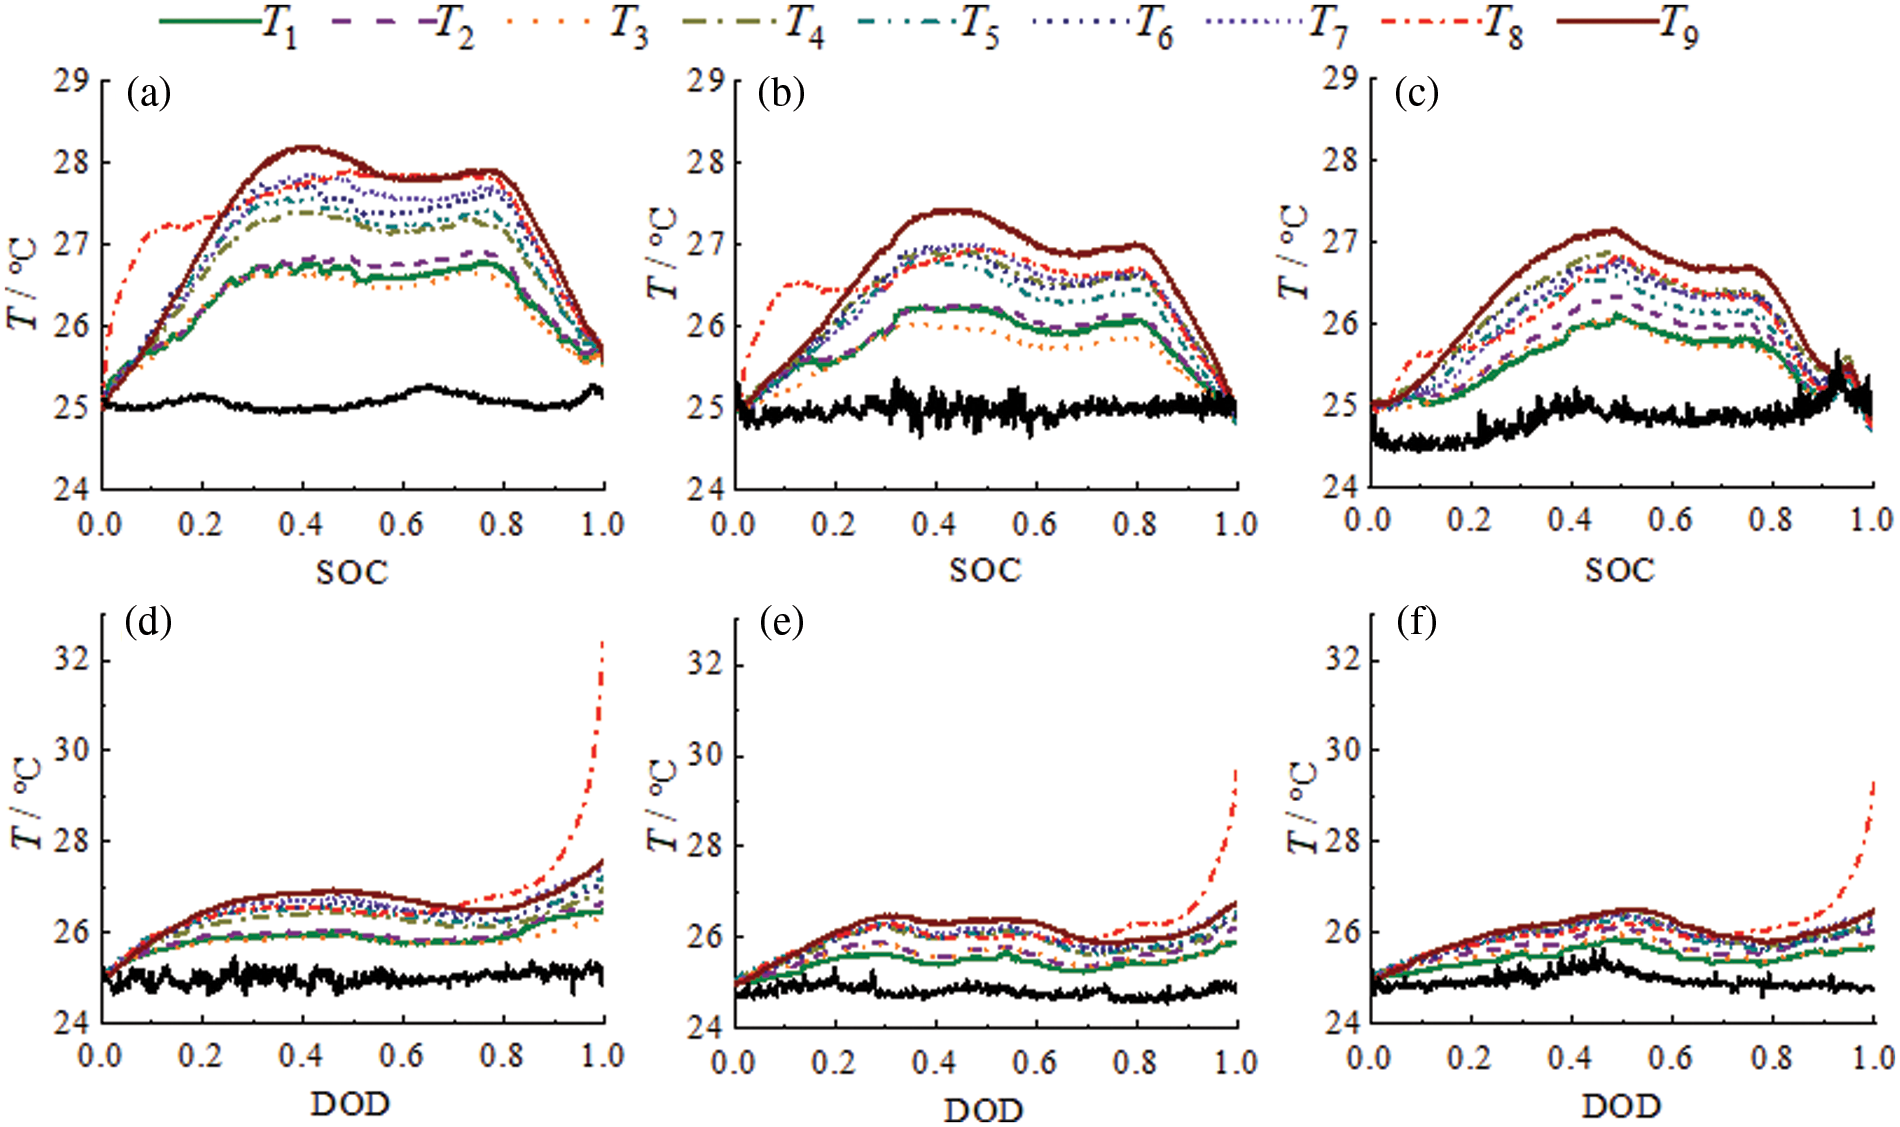
Figure 4: Comparison of the battery temperature with SOC and starting water cooling and rate of 0.5 C. (a) charging with 16 L/h; (b) charging with 32 L/h; (c) charging with 48 L/h; (d) discharging with 16 L/h; (e) discharging with 32 L/h; (f) discharging with 48 L/h
Figs. 5 to 7 show the changes in battery temperature during charge and discharge at 1 C, 1.5 C and 2 C, respectively. It can be seen from Fig. 5 that the plateau section of the ladder-like temperature curve during the charging process at 1 C rate is shorter than that at 0.5 C rate and has an upward trend. As the cooling water flow rate increases, the temperature rises more slowly and the plateau section is longer. It can be seen from Figs. 6 and 7 that the temperature curves of the 1.5 C and 2 C rate charging process gradually show a triangular shape, and the constant current charging stage (for 1.5 C, SOC < 0.5; for 2 C, SOC < 0.38) battery temperature increases with SOC After entering the constant voltage charging stage, as the charging current slowly decreases, the heat generation rate of the battery gradually decreases, and the temperature rises slightly and then begins to decrease after reaching a high point. With the increase of the cooling water flow rate, the temperature maximum point is lower and appears earlier.
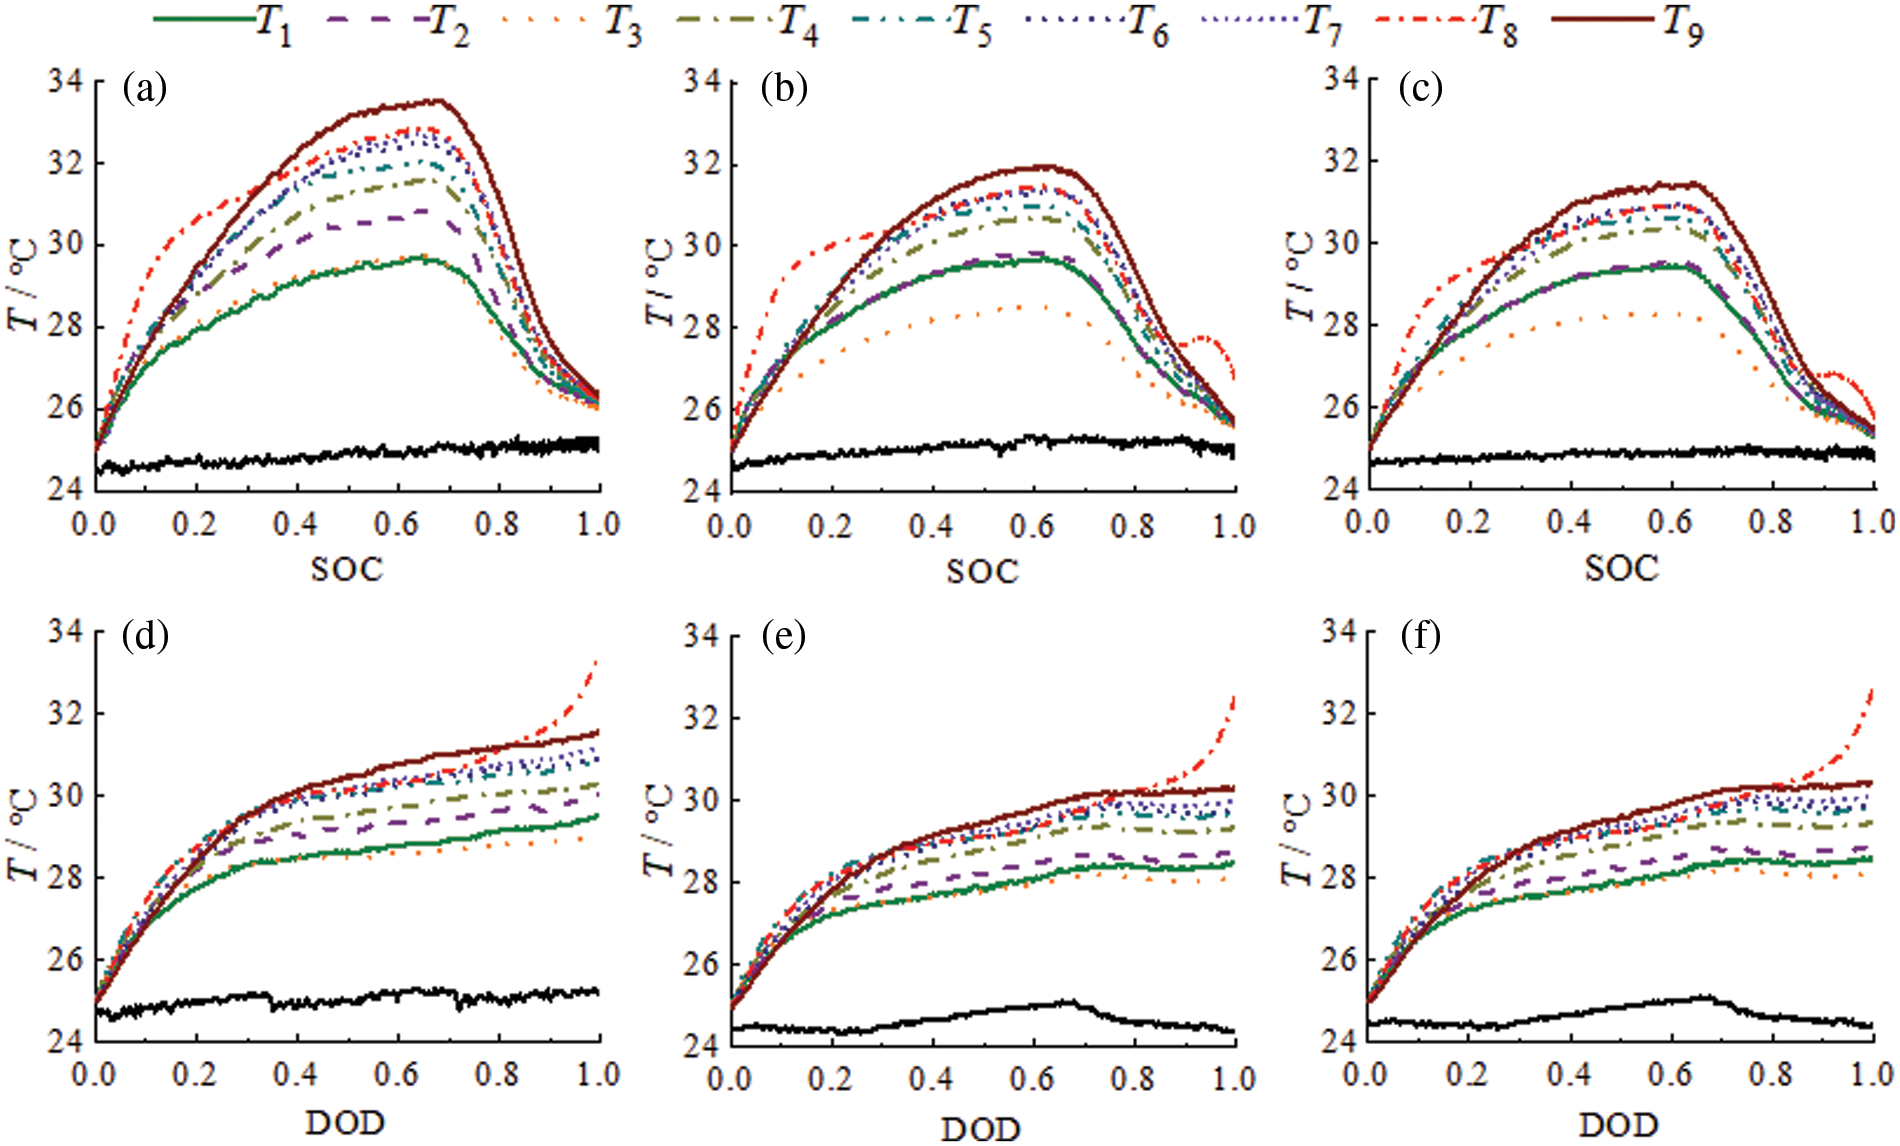
Figure 5: Comparison of the battery temperature with SOC and starting water cooling and rate of 1 C. (a) charging with 32 L/h; (b) charging with 48 L/h; (c) charging with 64 L/h; (d) discharging with 32 L/h; (e) discharging with 48 L/h; (f) discharging with 64 L/h
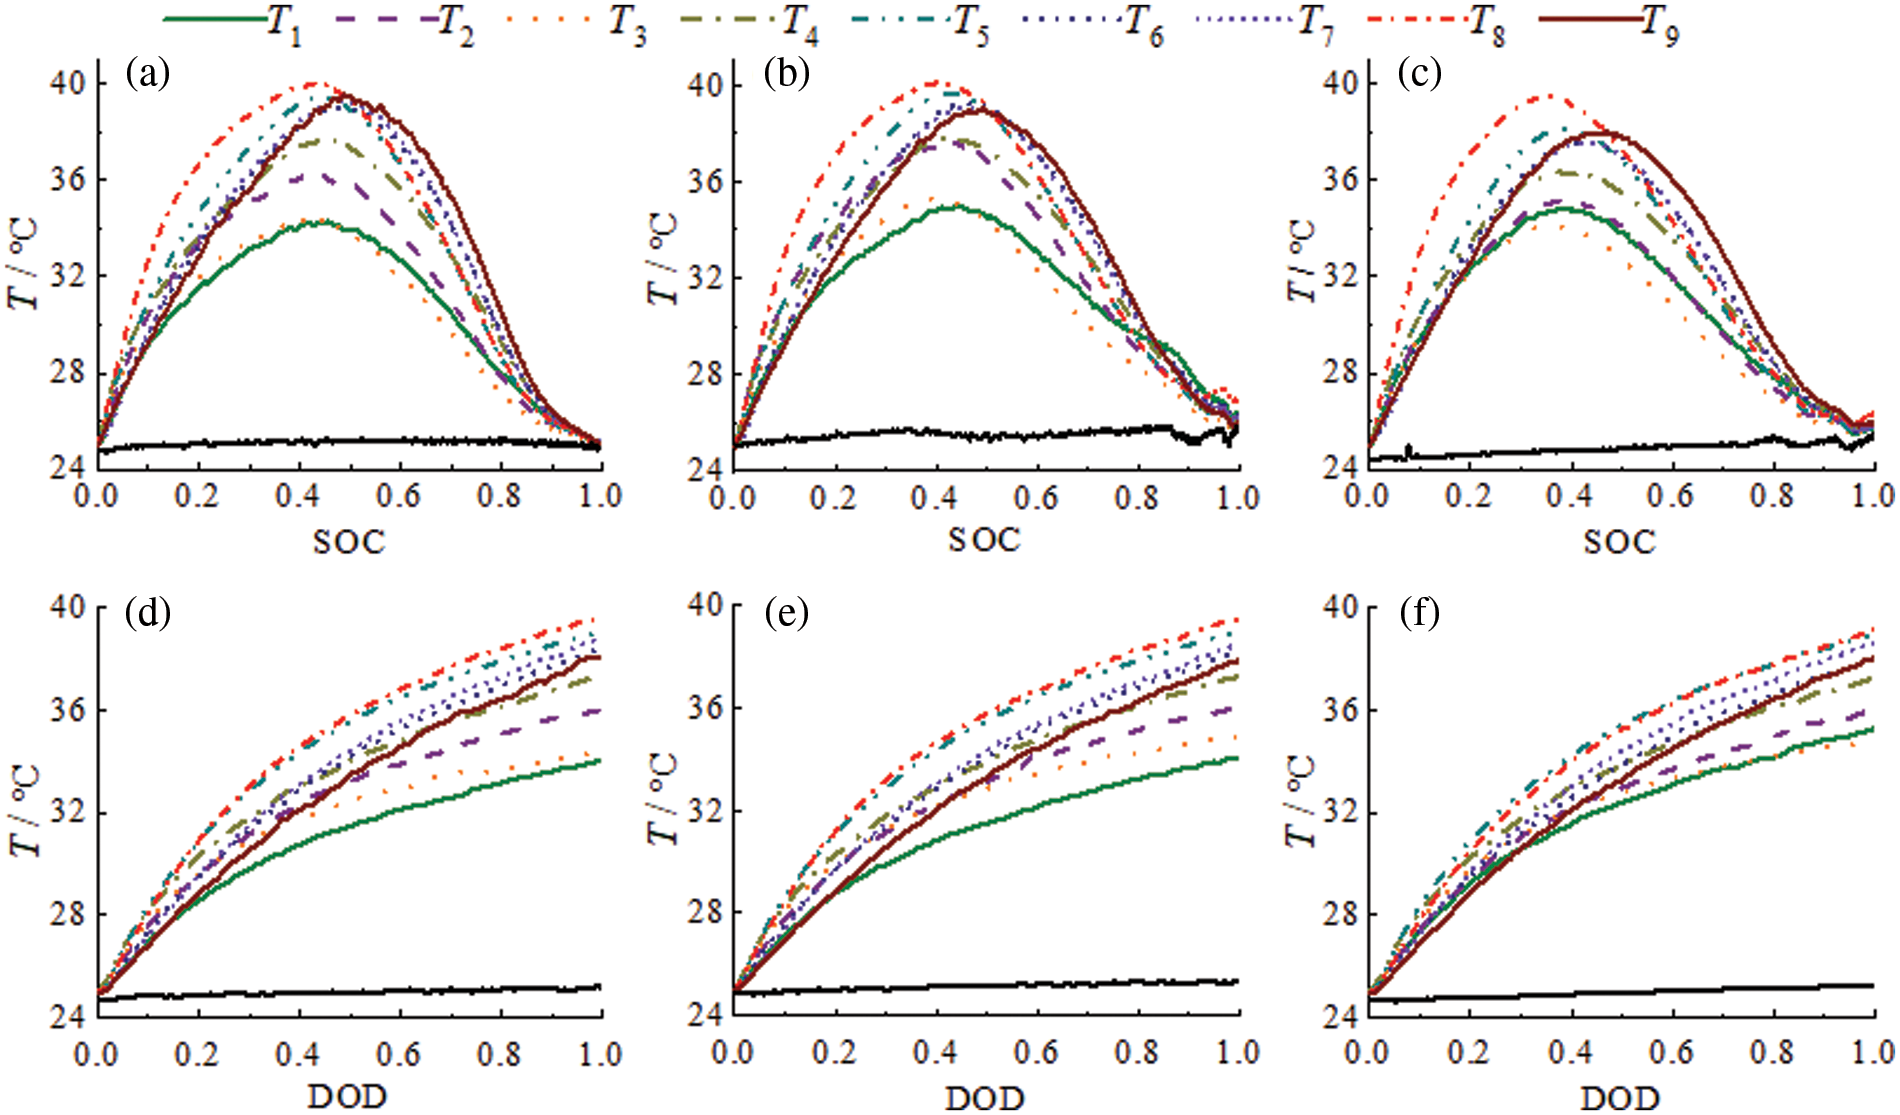
Figure 6: Comparison of the battery temperature with SOC and starting water cooling and rate of 1.5 C. (a) charging with 48 L/h; (b) charging with 64 L/h; (c) charging with 80 L/h; (d) discharging with 48 L/h; (e) discharging with 64 L/h; (f) discharging with 80 L/h
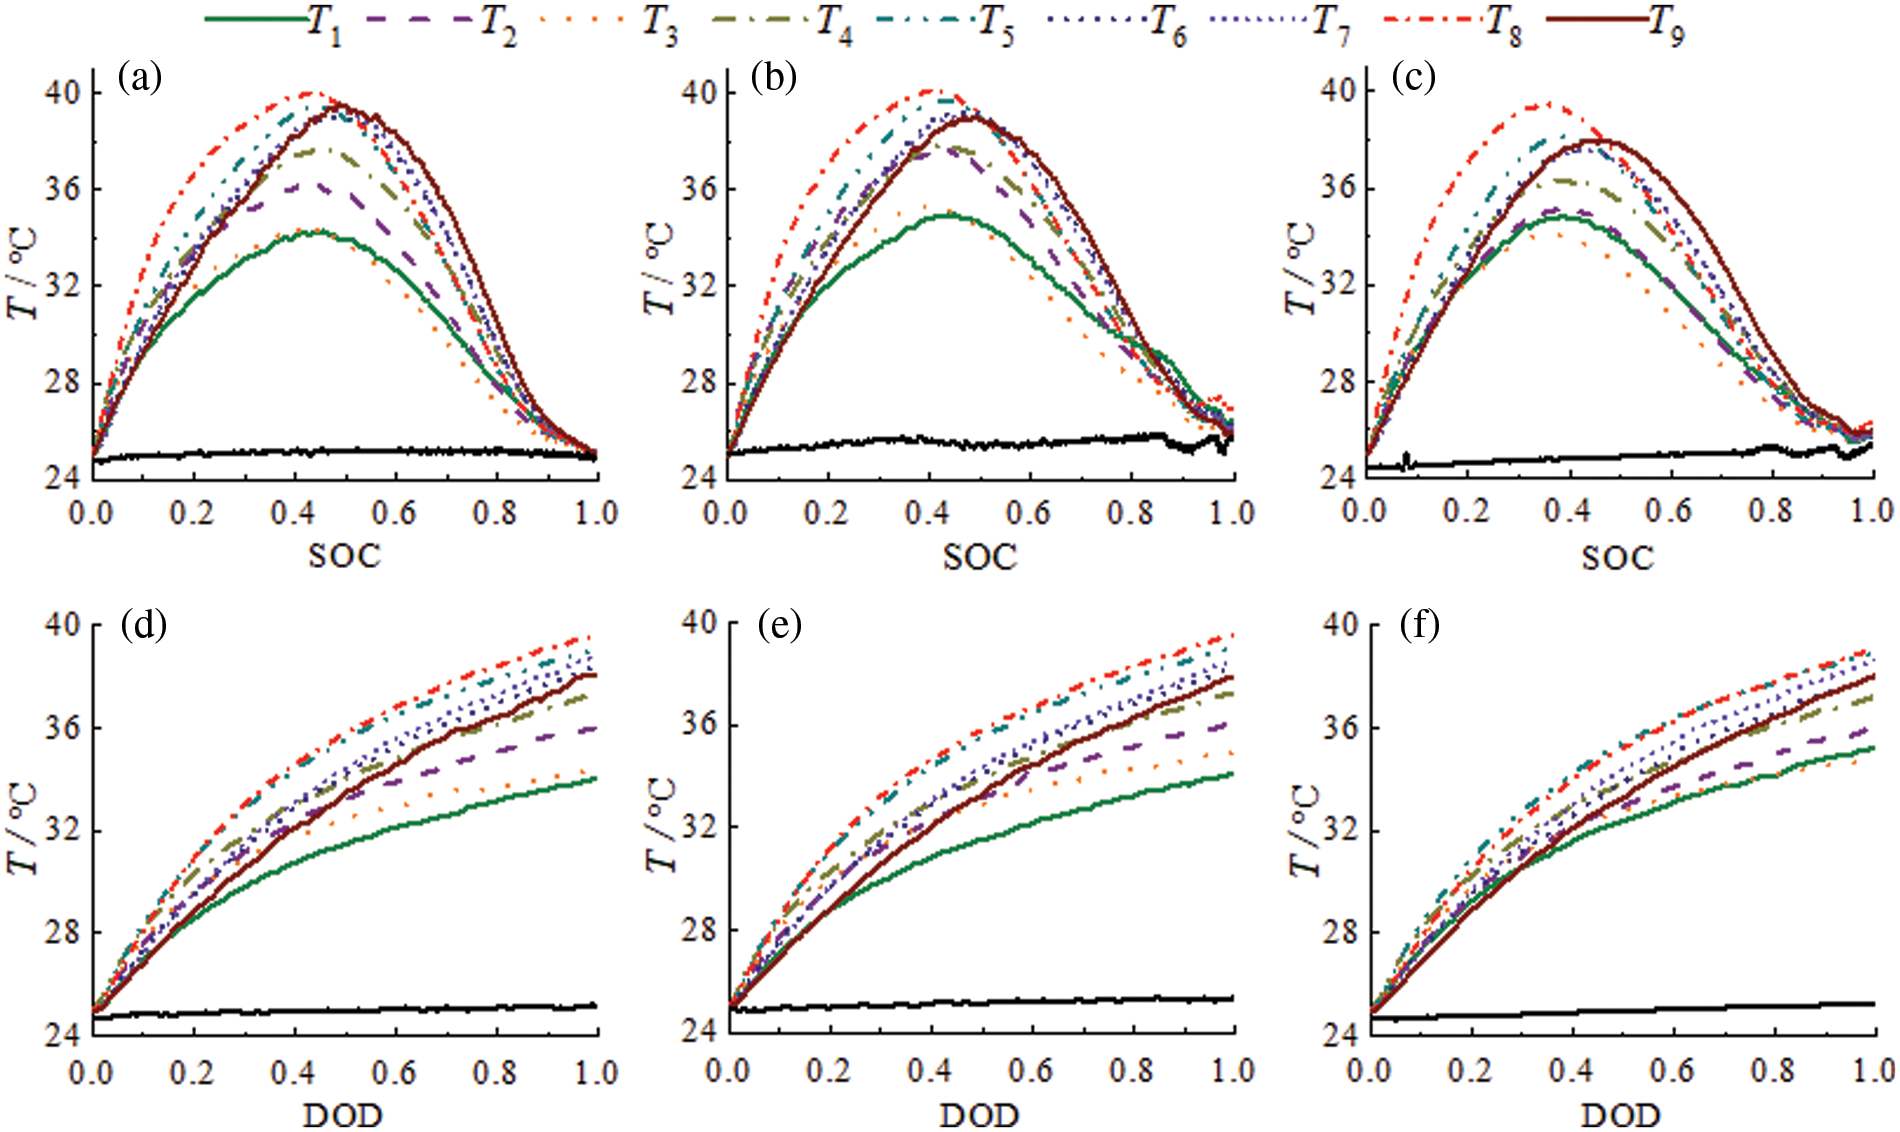
Figure 7: Comparison of the battery temperature with SOC and starting water cooling and rate of 2 C. (a) charging with 64 L/h; (b) charging with 80 L/h; (c) charging with 96 L/h; (d) discharging with 64 L/h; (e) discharging with 80 L/h; (f) discharging with 96 L/h
Fig. 8 shows the changes of the maximum temperature and the maximum temperature difference of the battery module with the cooling water flow rate during the charging and discharging process at various rates (0.5 C, 1 C, 1.5 C and 2 C). It can be seen that the maximum temperature and the maximum temperature difference both increase with cooling. decrease with increasing water flow rate. It can be seen from Fig. 8a that for the 0.5 C charge-discharge process, the maximum temperature drop caused by the increase of the cooling water flow rate from 16 L/h to 32 L/h is significantly larger than that of the increase from 32 L/h to 48 L/h. For the 1 C, 1.5 C and 2 C charge-discharge processes, the maximum temperature of the battery and the cooling water flow rate almost showed a linear decreasing trend, and the slope decreased with the increase of the charge-discharge rate. The above results show that increasing the cooling water flow rate has a marginal effect on the cooling effect of the battery, and the marginal effect is more obvious in the case of low rate charge and discharge (0.5 C in this experiment). It can be seen from Fig. 8b that for each rate of charge-discharge process, increasing the cooling water flow rate can help reduce the maximum temperature difference of the battery and enhance the temperature consistency between battery modules. It can be seen that although the effect of increasing the cooling water flow rate on reducing the maximum temperature of the battery is weakened during high-rate charge and discharge, it still has a good effect on improving the temperature consistency within the battery module.
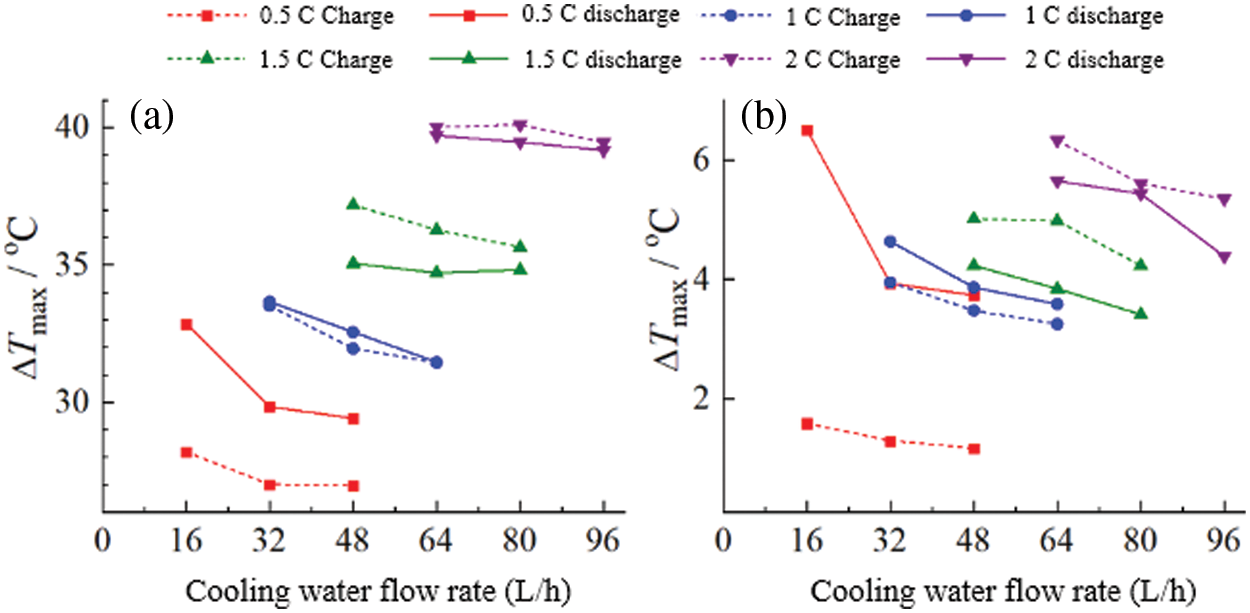
Figure 8: Comparison of the maximum temperature and the difference
In order to analyze the relationship between the thermal management benefits and pump power consumption brought by increasing the cooling water flow rate, and to determine the optimal cooling water flow rate for each charge and discharge rate, this paper defines the thermal management benefit value (η) as the When the cooling water flow rate is increased, the ratio between the drop value of the maximum temperature of the battery and the increase value of the pump power is:
Among them:
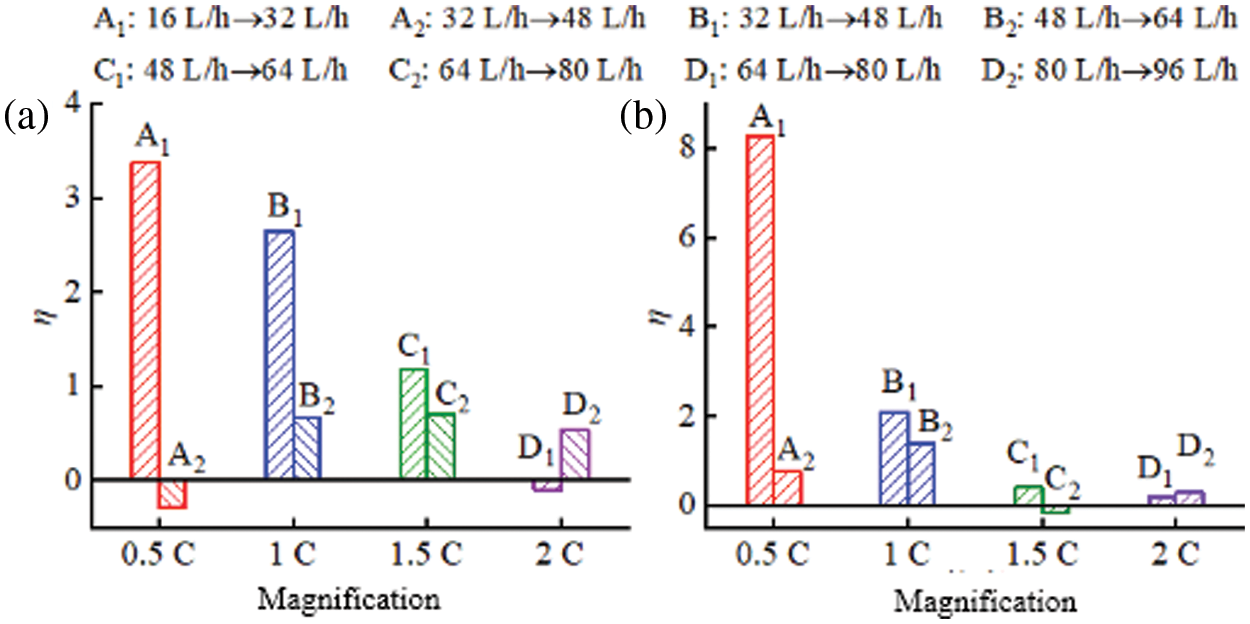
Figure 9: Thermal feasibility utilization. (a) charging; (b) discharging
Based on a multi-channel serpentine bellows liquid-cooled thermal management system, a power battery module composed of 200 18650 lithium-ion batteries is used as the thermal management object. The management scheme was experimentally studied. The main conclusions are as follows: (1) The thermal management system proposed in this paper has a good thermal management effect on the power battery under various charging and discharging application conditions, and the maximum temperature and maximum temperature difference of the battery can be basically controlled below 40°C and within 5°C; (2) Increasing the cooling water flow rate helps to reduce the maximum temperature of the battery, but the decreasing trend gradually slows down with the increase of the flow rate. At a rate of 0.5 C, the flow rate increased from 16 L/h to 32 L/h, and the maximum temperature of the battery decreased by 3°C. After continuing to increase the flow rate to 48 L/h, it decreased by 0.5°C; when the rate increased to 2°C, the slowing slope decreased. Small, and the pump power consumed by the system operation increases, resulting in a significant decrease in thermal management benefits with the increase of cooling water flow rate; (3) Increasing the cooling water flow rate helps reduce the maximum temperature difference of the battery and enhances the temperature consistency between battery modules. Although the effect of increasing the cooling water flow rate on the reduction of the maximum temperature of the battery is weakened during high-rate (1.5 ∼ 2 C) charge and discharge, it still has a good effect on improving the temperature consistency within the battery module.
From the perspective of battery safety performance and thermal management benefits, the cooling water flow rate of the thermal management system at each charge-discharge rate is based on the lowest flow rate of the temperature index to ensure battery safety and performance (16 L/h for 0.5 C); 32 L/h for 1 C; 48 L/h for 1.5 C; 64 L/h for 2 C).
Acknowledgement: The author would like to thanks the editors and reviewers for their review and recommendations.
Funding Statement: The author received no specific funding for this study.
Conflicts of Interest: The author declares that he has no conflicts of interest to report regarding the present study.
References
1. J. A. Sanguesa, V. Sanz, P. Garrido, F. Martinez and J. M. Barja, “A review of electric vehicles: Technologies and challenges,” Smart Cities, vol. 4, no. 1, pp. 1–28, 2021. [Google Scholar]
2. X. R. Zhang, X. Chen, W. Sun and X. Z. He, “Vehicle re-identification model based on optimized densenet121 with joint loss,” Computers, Materials & Continua, vol. 67, no. 3, pp. 3933–3948, 2021. [Google Scholar]
3. X. R. Zhang, H. L. Wu, W. Sun, A. G. Song and S. K. ha, “A fast and accurate vascular tissue simulation model based on point primitive method,” Intelligent Automation & Soft Computing, vol. 27, no. 3, pp. 873–889, 2021. [Google Scholar]
4. Y. Chen, Y. Kang, Y. Zhao, L. Wang, J. Liu et al., “A review of lithium-ion battery safety concerns: The issues, strategies, and testing standards,” Journal of Energy Chemistry, vol. 59, no. 2, pp. 83–99, 2021. [Google Scholar]
5. H. Wu, Y. Ciou, J. Wu and D. Huang, “Study of natural convection of lithium-ion battery module employing phase change material,” Processes, vol. 9, no. 11, pp. 1–17, 2021. [Google Scholar]
6. T. Buidin and F. Mariasiu, “Modeling approach of an air-based battery thermal management system for an electric vehicle,” Applied Sciences, vol. 11, no. 15, pp. 1–17, 2021. [Google Scholar]
7. X. Wang, S. Liu, Y. Zhang, S. Lv, H. Ni et al., “A review of the power battery thermal management system with different cooling, heating and coupling system,” Energies, vol. 15, no. 6, pp. 1–15, 2022. [Google Scholar]
8. W. Cao, C. Zhao and Y. Wang, “Thermal modeling of full-size-scale cylindrical battery pack cooled by channeled liquid flow,” International Journal of Heat and Mass Transfer, vol. 138, no. 3, pp. 1178–1187, 2019. [Google Scholar]
9. R. Yang, R. Xiong, W. Shen and X. Lin, “Extreme learning machine-based thermal model for lithium-ion batteries of electric vehicles under external short circuit,” Engineering Journal, vol. 7, no. 3, pp. 345–405, 2021. [Google Scholar]
10. M. Astaneh, J. Andric, L. Lofdahl and P. Stopp, “Multiphysics simulation optimization framework for lithium-ion battery pack design for electric vehicle applications,” Energy Journal, vol. 239, no. 2, pp. 1292–1304, 2022. [Google Scholar]
11. G. Xia, L. Cao and G. Bi, “A review on battery thermal management in electric application,” Journal of Power Sources, vol. 367, no. 3, pp. 90–105, 2017. [Google Scholar]
12. A. Sarchami, M. Najafi, A. Iman and E. Houshfar, “Experimental study of thermal management system for cylindrical li-ion battery pack based on nanofluid cooling and copper sheath,” International Journal of Thermal Sciences, vol. 171, no. 7, pp. 1072–1085, 2022. [Google Scholar]
13. L. Fan, J. Khodadadi and A. Massage, “A parametric study on thermal management of an air-cooled lithium-ion battery module for plug-on hybrid electric vehicles,” Journal of Power Sources, vol. 238, no. 3, pp. 301–312, 2013. [Google Scholar]
14. Z. Li, J. Cen and P. Peng, “Experimental research on thermal management of cylindrical lithium-ion batteries,” New Energy Development, vol. 4, no. 4, pp. 305–311, 2016. [Google Scholar]
15. T. Wang, K. Zhu, J. Zhao and C. Shen, “Thermal investigation of lithium-ion battery module with different cell arrangement structures and forced air-cooling strategies,” Applied Energy, vol. 134, no. 7, pp. 229–238, 2014. [Google Scholar]
16. N. Yang, X. Zhang and G. Li, “Assessment of the forced air-cooling performance for cylindrical lithium-ion battery packs: A comparative analysis between aligned and staggered cell arrangements,” Applied Thermal Engineering, vol. 80, no. 6, pp. 55–65, 2015. [Google Scholar]
17. Y. Wang, Q. Gao, P. Lu, M. Zhao and W. Bao, “A review on research status and key technologies of battery thermal management and its enhanced safety,” International Journal of Energy Research, vol. 42, no. 13, pp. 4008–4033, 2018. [Google Scholar]
18. X. Zhang, X. Kong and G. Li, “Thermodynamic assessment of active cooling/heating methods for lithium-ion batteries of electric vehicles in extreme conditions,” Energy Journal, vol. 64, no. 3, pp. 1092–1101, 2014. [Google Scholar]
19. B. Munir and V. Dyo. “On the impact of mobility on battery-less RF energy harvesting system performance,” Sensors, vol. 18, no. 11, pp. 1–17, 2018. [Google Scholar]
20. L. Saw, Y. Ye, M. Yew and L. Liu, “Computational fluid dynamics simulation on open cell aluminum foams for li-ion battery cooling system,” Applied Energy, vol. 204, no. 5, pp. 1489–1499, 2017. [Google Scholar]
21. Y. Huo, Z. Rao and X. Liu, “Investigation of power battery thermal management by using mini-channel cold plate,” Energy Conversion and Management, vol. 89, no. 3, pp. 387–395, 2015. [Google Scholar]
22. C. Zhao, W. Cao and T. Dong, “Thermal behavior study of discharging/charging cylindrical lithium-ion battery module cooled by channeled liquid flow,” International Journal of Heat and Mass Transfer, vol. 120, no. 7, pp. 751–762, 2017. [Google Scholar]
23. H. Mbulu, Y. Laoonual and S. Wongwises, “Experimental study on the thermal performance of a battery thermal management system using heat pipes,” Case Studies in Thermal Engineering, vol. 26, no. 3, pp. 1029–1038, 2021. [Google Scholar]
24. W. Li, X. Peng and M. Xiao, “Multi-objective design optimization for mini-channel cooling battery thermal management system in an electric vehicle,” International Journal of Energy Research, vol. 43, no. 8, pp. 3668–3680, 2019. [Google Scholar]
25. L. Sheng, L. Su and H. Zhang, “Numerical investigation on a lithium ion battery thermal management utilizing a serpentine-channel liquid cooling plate exchanger,” International Journal of Heat and Mass Transfer, vol. 141, no. 4, pp. 658–668, 2019. [Google Scholar]
26. L. Jiang, X. Diao, Y. Zhang, J. Zhang and T. Li, “Review of the charging safety and charging safety of electric vehicles,” World Electric Vehicle Journal, vol. 12, no. 4, pp. 1–18, 2021. [Google Scholar]
27. K. Shah, D. Chalise and A. Jain, “Experimental and theoretical analysis of a method to predict thermal runaway in li-ion cells,” Journal of Power Sources, vol. 330, no. 3, pp. 167–174, 2016. [Google Scholar]
28. A. Ibrahim, J. Guo and Y. Wang, “Performance of serpentine channel based li-ion battery thermal management system: An experimental investigation,” International Journal of Energy Research, vol. 44, no. 13, pp. 10023–10043, 2020. [Google Scholar]
29. Z. Y. Jiang, H. Li, Z. Qu and J. Zhang, “Recent progress in lithium-ion battery thermal management for a wide range of temperature and abuse conditions,” International Journal of Hydrogen Energy, vol. 47, no. 15, pp. 9428–9459, 2022. [Google Scholar]
30. Y. Wang, Q. Gao and G. Wang, “A review on research status and key technologies of battery thermal management and its enhanced safety,” International Journal of Energy Research, vol. 42, no. 5, pp. 4008–4033, 2018. [Google Scholar]
31. O. Kalaf, D. Solyali and M. Asmel, “Experimental and simulation study of liquid coolant battery thermal management system for electric vehicles: A review,” International Journal of Energy Research, vol. 45, no. 5, pp. 6495–6517, 2021. [Google Scholar]
32. T. Liu, C. Tao and X. Wang, “Cooling control effect of water mist on thermal runaway propagation in lithium ion battery modules,” Applied Energy, vol. 267, no. 4, pp. 1150–1165, 2020. [Google Scholar]
33. C. Kim, J. Han and S. Hong, “Evaluation of spoiler model based on air cooling on lithium-ion battery pack temperature uniformity,” Processes, vol. 10, no. 3, pp. 1–18, 2022. [Google Scholar]
34. C. Lin, S. Xu and G. Chang, “Experimental and simulation of a LiFePO4 battery pack with a passive thermal management system using composite phase change material and graphite sheets,” Journal of Power Sources, vol. 275, no. 3, pp. 742–749, 2015. [Google Scholar]
35. Y. Wang, P. Peng, W. Cao and S. Chen, “Experiment study on a novel compact cooling system for cylindrical lithium-ion battery module,” Applied Thermal Engineering, vol. 180, no. 5, pp. 1157–1168, 2020. [Google Scholar]
36. M. Saadi, J. Olmos, A. Ibarra, J. Mierlo and M. Berecibar, “Fast charging impact on the lithium-ion batteries lifetime and cost-effective battery sizing in heavy-duty electric vehicles applications,” Energies, vol. 15, no. 4, pp. 1–18, 2022. [Google Scholar]
37. J. Cen, Z. Li and F. Jiang, “Experimental investigation on using the electric vehicle air conditioning system for lithium-ion battery thermal management,” Energy for Sustainable Development, vol. 45, no. 5, pp. 88–95, 2018. [Google Scholar]
38. A. Baklouti, K. Dammak and A. Hami, “Uncertainty analysis based on kriging meta-model for acoustic-structural problems,” Applied Sciences, vol. 12, no. 3, pp. 1–18, 2022. [Google Scholar]
39. D. Song, J. Lee, S. Ha and S. Huh, “Assessment of control room habitability and unfiltered air inleakage test of the OPR 1000 NPP,” Journal of Nuclear Science and Technology, vol. 52, no. 6, pp. 905–911, 2014. [Google Scholar]
40. G. Jian, X. Yan and W. Liu, “Effects of upwind area of tube inserts on heat transfer and flow resistance characteristics of turbulent flow,” Experimental Thermal and Fluid Science, vol. 48, no. 3, pp. 147–155, 2013. [Google Scholar]
41. G. Liu and L. Zhang, “Research on the thermal characteristics of an 18650 lithium-ion battery based on an electrochemical- thermal flow coupling model,” World Electric Vehicle Journal, vol. 12, no. 4, pp. 1–23, 2021. [Google Scholar]
Cite This Article
 Copyright © 2023 The Author(s). Published by Tech Science Press.
This work is licensed under a Creative Commons Attribution 4.0 International License , which permits unrestricted use, distribution, and reproduction in any medium, provided the original work is properly cited.
 Downloads
 Citation Tools