
 Submit a Paper
 Propose a Special lssue
 Open Access
ARTICLE
Up-Sampled Cross-Correlation Based Object Tracking & Vibration Measurement in Agriculture Tractor System
1 Department of Mechanical Engineering, Sathyabama Institute of Science and Technology, Chennai, 600119, India
2 Department of Mechanical Engineering, CEGC, Anna University, Chennai, 600025, India
* Corresponding Author: R. Ganesan. Email:
Intelligent Automation & Soft Computing 2023, 36(1), 667-681. https://doi.org/10.32604/iasc.2023.031932
Received 30 April 2022; Accepted 01 July 2022; Issue published 29 September 2022
 View Full Text
 Download PDF
Abstract
This research introduces a challenge in integrating and cleaning the data, which is a crucial task in object matching. While the object is detected and then measured, the vibration at different light intensities may influence the durability and reliability of mechanical systems or structures and cause problems such as damage, abnormal stopping, and disaster. Recent research failed to improve the accuracy rate and the computation time in tracking an object and in the vibration measurement. To solve all these problems, this proposed research simplifies the scaling factor determination by assigning a known real-world dimension to a predetermined portion of the image. A novel white color sticker of the known dimensions marked with a color dot is pasted on the surface of an object for the best result in the template matching using the Improved Up-Sampled Cross-Correlation (UCC) algorithm. The vibration measurement is calculated using the Finite-Difference Algorithm (FDA), a machine vision system fitted with a macro lens sensor that is capable of capturing the image at a closer range, which does not affect the quality of displacement measurement from the video frames. The field test was conducted on the TAFE (Tractors and Farm Equipment Limited) tractor parts, and the percentage of error was recorded between 30% and 50% at very low vibration values close to zero, whereas it was recorded between 5% and 10% error in most high-accelerations, the essential range for vibration analysis. Finally, the suggested system is more suitable for measuring the vibration of stationary machinery having low frequency ranges. The use of a macro lens enables to capture of image frames at very close-ups. A 30% to 50% error percentage has been reported when the vibration amplitude is very small. Therefore, this study is not suitable for Nano vibration analysis.Keywords
The image vision system is very suitable for manufacturing systems in Industry 4.0, as an image can provide information about displacement, acceleration, surface quality, and tool conditions. Thermal images are capable of providing information about the surface temperature at different places and are easily portable to the computer software for an automated process to vary the various parameters for achieving the desired outcome. Vibration and vibration data are extensively applied to the area of condition monitoring based on predictive maintenance, structural health monitoring, and surface quality. The vibration provides information about the dynamic behavior of the structure and machine parts, which also helps in the optimal design of the machine elements.
Research on easy, repeatable, accurate, and fast displacement measurement methods has become the first task in the vibration of structures or machine elements. The measurement of displacement is a very important variable that can be converted into velocity, acceleration, and deformation by the mathematical relationship with time. Monitoring structural dynamic displacement can provide information about its working condition, maintenance requirements, and fault diagnosis. Contact-type displacement/vibration measurement sensors and data acquisition systems are expensive.
The contact-type accelerometer sensors provide some heaviness to the sections or superstructure, and they are also physically connected to the system. The sensors cannot withstand high-temperature and high-radiation environments, making contact-type sensors unsuitable for the measurement of vibration at places such as forging machine structures, nuclear power plant machinery structures, and structures that are not easily approachable. Machine vision systems, GPS, laser accelerometers, and interferometry systems are some of the non-contact measurement systems used to measure displacement/vibration. The GPS technique for measuring displacement is not suitable because it has an error range of 5–10 mm.
Yu et al. developed an image-based sensor that uses a high-speed camera vibration measurement system using Digital Image Correlation (DIC). The experimental setup includes optical mirrors, lenses, and a high-frame-rate camera sensor for complete area vibration quantities, which are more suitable for laboratory studies [1]. Shan et al. established an image-based vibration measurement system to screen the free vibrations of a stayed cable model. The system includes two CCD cameras that focus on circular target dots on the stay cable. The displacement of the center of the circular shaft was measured using a combination algorithm of Canny-Zernike. The results from the image vision system were compared with those of the laser LVDT [2].
Zhan et al. presented a computer-vision method to calculate scaling factors to measure displacement at sub-pixel accuracy by employing an upsampled cross-correction template matching algorithm in a pedestrian bridge [3]. Son et al. recommended a technique to measure vibration/displacement using grayscale camera images of a cylindrical structure. The setup includes a camera, computer system, shaker, and gap sensor. The vibration displacement is measured by the brightness changes in the point edge area with a size of 9 × 9 pixel in the ROI. The brightness variation across the Y-axis was measured at the sub-pixel level over time. The results were compared with the displacement values measured from the gap sensor and laser displacement sensors [4].
Liu et al. endorsed a machine vision scheme to measure the displacement of a grating ruler motion platform, and vibration in the steering wheel of a forklift was measured. The system includes a camera focused on the cross target on the grating scale, a computer system, grating ruler displacement sensors, and FEM software. The results show that the modified Taylor algorithm and UCC algorithms recorded the minimum error [5]. Jeng et al. developed a computer vision-based arrangement to record the vibration frequency using image frames captured by a video camera. The study includes a dedicated camera and image processing software that has the potential to capture LED light targets on the surface of the ROI [6].
Vibration analysis plays an important role in monitoring and maintaining the condition of machines. Vibration analysis can be used to read the current status of a machine. Condition monitoring can predict machine repairs. This is a way to detect and correct mistakes in advance. Continuous vibration monitoring helps to improve the performance of the machines. Using modern vibration analysis methods, it is possible to record continuous vibration measurements and send them to various systems like computers, smartphones, etc., so that the present operations of the machines can be monitored [7,8].
Vehicle Type Classification is a system for identifying and classifying vehicles. In this way in the growing intelligent transport, various benefits can be achieved by classifying vehicles. Vehicle type classification can be simplified by comparing class similarity and internal class similarity using the Convolutional Neural Network and the Light Convolutional Neural Network. Based on these methods it may possible to measure the vibrations that occur at several close points in the intended area of a machine simultaneously [9].
2 Proposed Machine Vision System
Template matching techniques are fundamental principles of vision sensors for calculating displacement. Many research papers recommend the template matching algorithm as a very effective method to identify a point and its relative position in successive image frames by comparing two consecutive frames.
Assume an image I, with an offset of x = (xa, xb) and a template T of dimension rT × cT. The error of the fit E(x) can be expressed as,
Eq. (2) shows, that the second term is called the correlation expression used for template matching. Because the first term is constant, and the third term is very close to constant as the value of x varies very minutely. The maximum value of the correlation expression gives the best template matching.
The relationship between the real-world dimension of the object and the dimension of the object in the video image frame must be established in units of mm/pixel. According to Zhang’s method [10], camera calibration is reduced, and the effect of distortion on camera calibration is reduced. Hijazi et al. [11], Feng et al. [12] described the relationship of scaling factors.
where,
doknown = real-world dimensions on the surface of an object
diknown = Ipknown dppixel is the known real-world length of the image plane,
dipknown is the image pixel length
Ipknown is the image plane pixel length,
dppixel is the size of the pixel (mm/pixel)
Dc is the distance object to the camera, and
F is the focal length
2.1 Improved Up Sampled Cross-Correlation Algorithm
Many research articles have recommended an improved Up-Sampled Cross-Correlation (UCC) algorithm to find the sub-pixel-level accuracy in calculating the structural displacement in the x-and y-axes. The identical video frame image fvf (x, y) of size M × N will be matched with the keyframe template tp (x, y), which has a known dimension paper sticker that has a blue dot in it to ensure errorless RGB matching. To locate the place at the paper sticker that identified the blue hue of the video sequence, the mean luminance of the RGB region was assessed. The model match changes over a set period to account for color and form variations.
The Fourier transform is defined for the cross-correlation between fvf (x, y) and tp (x, y) as the mean brightness of the RGB region was measured to track the point at the paper sticker, which marked the blue color of the video frames. The template match evolves in a definite interval to adjust the color and shape changes with time. The Fourier transform is defined for the cross-correlation between fvf (x, y) and tp (x, y) as
where (x, y) is the summation of the overall points on the image, (x0, y0) is the overall coordinate shift, (’) represents the complex conjunction, and Fvf(x, y) is the Discrete Fourier Transform DFT of (u, v), T’(u, v) is the Discrete Fourier Transform DFT of its lower case counterpart.
Eqs. (5) and (6) give an initial pixel-level displacement calculation based on the peak of Rft. Eq. (7) gives time-efficient Matrix Multiplication DFT (MM-DFT) sub-pixel level cross-correlation is done in a 1.5 ∗ 1.5-pixel neighborhood around the initial peak of Rft peak with an up-sampling factor of k to attain a sub-pixel resolution [13–17].
2.2 Finite-Difference Algorithm for Vibration Measurement
The velocity and acceleration are then computed using the sub-pixel value from the template that was matched using the up-sampled cross-correlation technique. A comparison was made between the acceleration values derived from the machine vision process and the acceleration values measured by the conventional Integrated Electronics Piezo-Electric (IEPE) accelerometer sensor, SIRIUS® MINI interface, and Dewesoft NVH analysis software uses the finite-difference formula to calculate the sub-pixel displacement. As a standard formula, the Discrete Fourier Transform DFT is used to bring close agreement between the results of the two measuring methods. The finite-difference algorithm is used to calculate the sub-pixel-level displacement values into velocity and acceleration. This algorithm expresses the mean velocity over a 2-step interval and the second derivative of a parabolic fit at the center with a 4-step interval is used to calculate the acceleration. Comparing many algorithms for finding acceleration, the second derivative of the parabolic curve fit delivers more accuracy than the others because this algorithm is less sensitive to position uncertainties.
Acceleration:
where i- is the number of steps, aXi is the acceleration in the x-direction at the i-step number, aYi-is the acceleration in the y-direction at the i-step number, and
3 Experimental Setup and Methods
3.1 Experimental Model and Setup
Agricultural tractor make & model: TAFE 4410, Engine Power: 32.8 kW, Manual transmission, Wheelbase: 184 cm, Weight: 1999 kg. Canon Eos 5D Mark II DSLR with 21.1 Megapixel with a macro lens to capture the target point. The computer system is made by Toshiba Satellite-Laptop with intel core-i3-370M processor. Dewesoft NVH analysis software with 13TI-50G-1 type accelerometer sensor for measuring the vibration and the LED light.
The camera model Canon Eos 5D Mark II DSLR provides 1920 × 1080, 640 × 480 at 30 fps, while in a 1920 × 1080 image, the lower right corner is at (1920, 1080) pixels, and the upper left corner is at (0.0, 0.0) of the x, y coordinates. Figs. 1–3 show the initial setup used to determine the relationship between the image and real-world dimensions. A physical object present in the camera image has world coordinates that are in scaled world units in meters to the reference frame. The known dimension paper sticker is taken as a reference for the first frame of the video; the same reference will be assigned to all frames of the video.
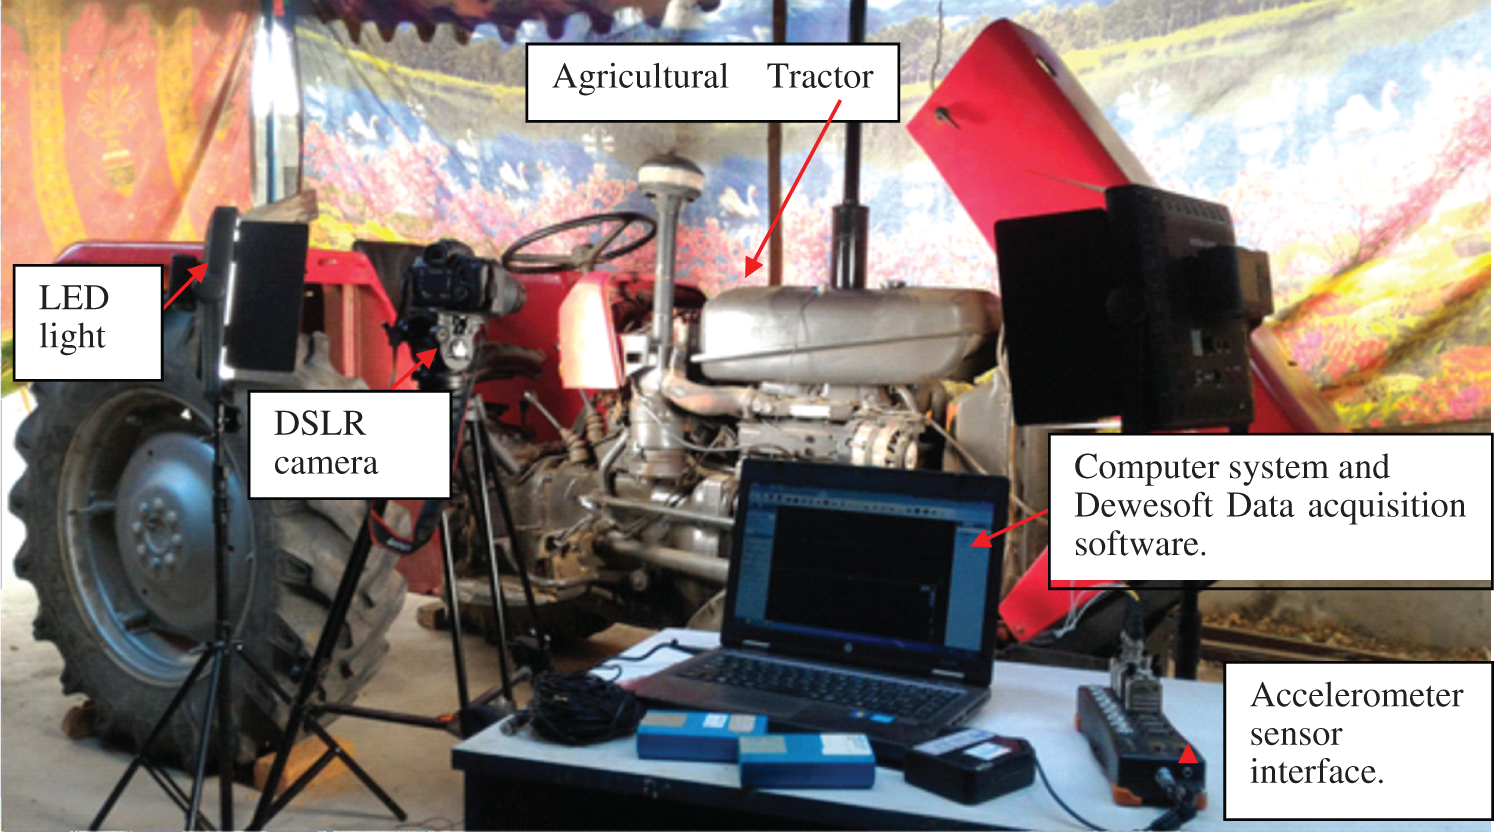
Figure 1: Experiment test setup
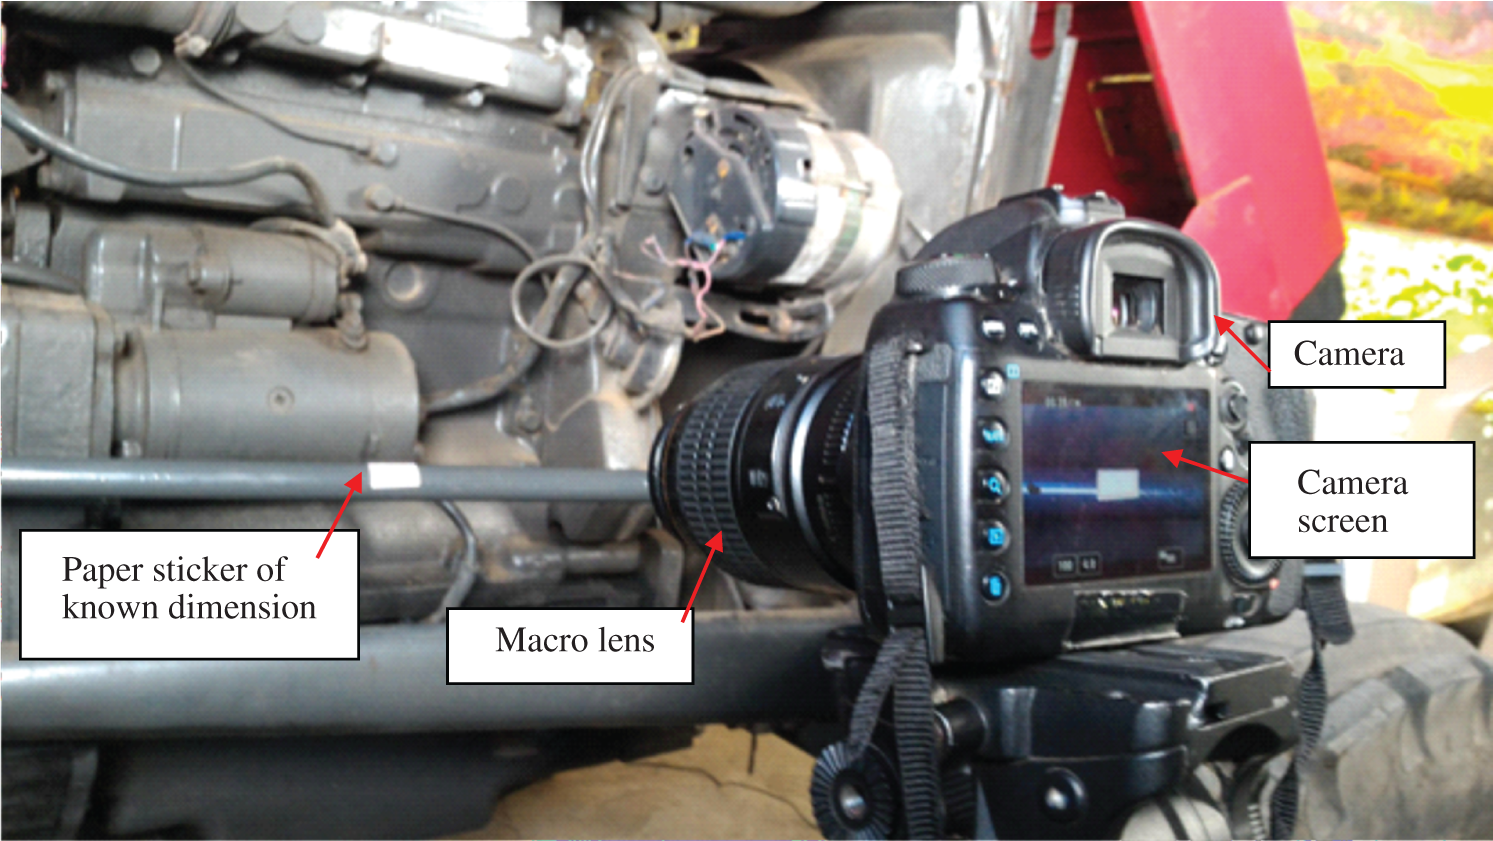
Figure 2: A closer view of the experimental test setup
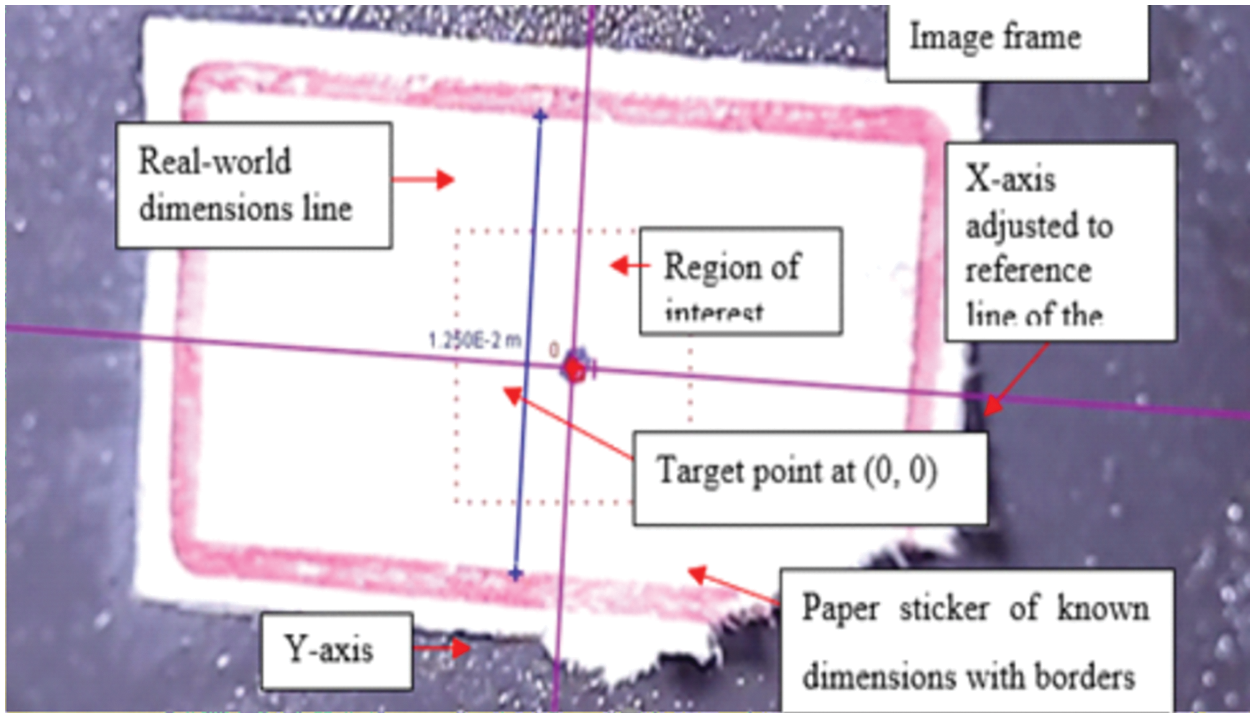
Figure 3: The x and y axes are set to (0, 0) at the target of ROI
The coordinate system, which is used to connect the image dimension to the world coordinates, explains each frame of the movie. The scale (image unit per world unit) is determined by the height of the paper sticker with defined measurements, and the origin is determined by the image location of the reference frame. Tracking the blue color point indicated on the paper sticker in the video frames required measuring the mean brightness of the RGB data in the ROI as a function of time. The template match evolves with a definite interval to adjust the color and shape changes with time. The shorter interval time of template tracking causes rapid changes that may lead to measurement drift over various frames.
Using a template matching algorithm, the programmed tracing of the target point is performed by creating one or more template images in the ROI. The template image compares two consecutive images to obtain the best match. The best template match is achieved when the sum of the squares of the RGB is recorded as the value of the maximum difference between the template and match pixels. Interpolation between the maximum match score and nearby match scores gives the sub-pixel accuracy match position of two successive image frames. The structural displacements in the x-and y-axis directions were tabled at the end of the template matching process in terms of the changes in the location of the target point [18–21].
Fig. 3 shows the paper sticker in the image frame of known real-world dimensions. The tilt in the image was adjusted by keeping one of the axes parallel to the border line of the sticker. The region of interest indicates the maximum area for the template search. The target describes the position of a point marked in blue relative to the template during the matching process. Track points should be specified to automate the tracking of a target point.
The present machine vision system was designed to measure vibrational quantity. Field tests were conducted on the TAFE tractor in various parts, and the results were associated. The displacement and acceleration data were calculated using the conventional acceleration IEPE accelerometer sensor, SIRIUS® MINI interface, and Dewesoft NVH analysis software. Another set of displacement and acceleration values were calculated from the video image frames using a mathematical algorithm, and a satisfactory and comparable agreement was observed between the two methods.
The sub-pixel value acquired from the template matching process using the Upsampled Cross-Correlation approach was then used to calculate the displacement in pixels per millimeter. Research on the various vision system methods used to calculate displacement from images with a target point was accomplished by the machine vision system. Tests were performed on a forklift steering wheel, and the experimental findings from finite element analysis were compared with grating ruler motion. The modified Taylor approximation algorithm and Up-Sampled Cross-Correlation algorithm (UCC) with a sampling rate of a hundred show a very close accuracy level but the modified Taylor approximation recorded 15 times faster processing time to extract displacement value from the image frames than UCC.
Fig. 4 shows the acceleration data from the DEWESOFT NVH data acquisition system, tested on the fuel tank of the TAFE tractor at an engine speed of 1560 rpm. The graph was plotted for the 60 s against the acceleration data in g units. These data were converted into displacement and acceleration data using the in-built math function in the DEWESOFT NVH system.
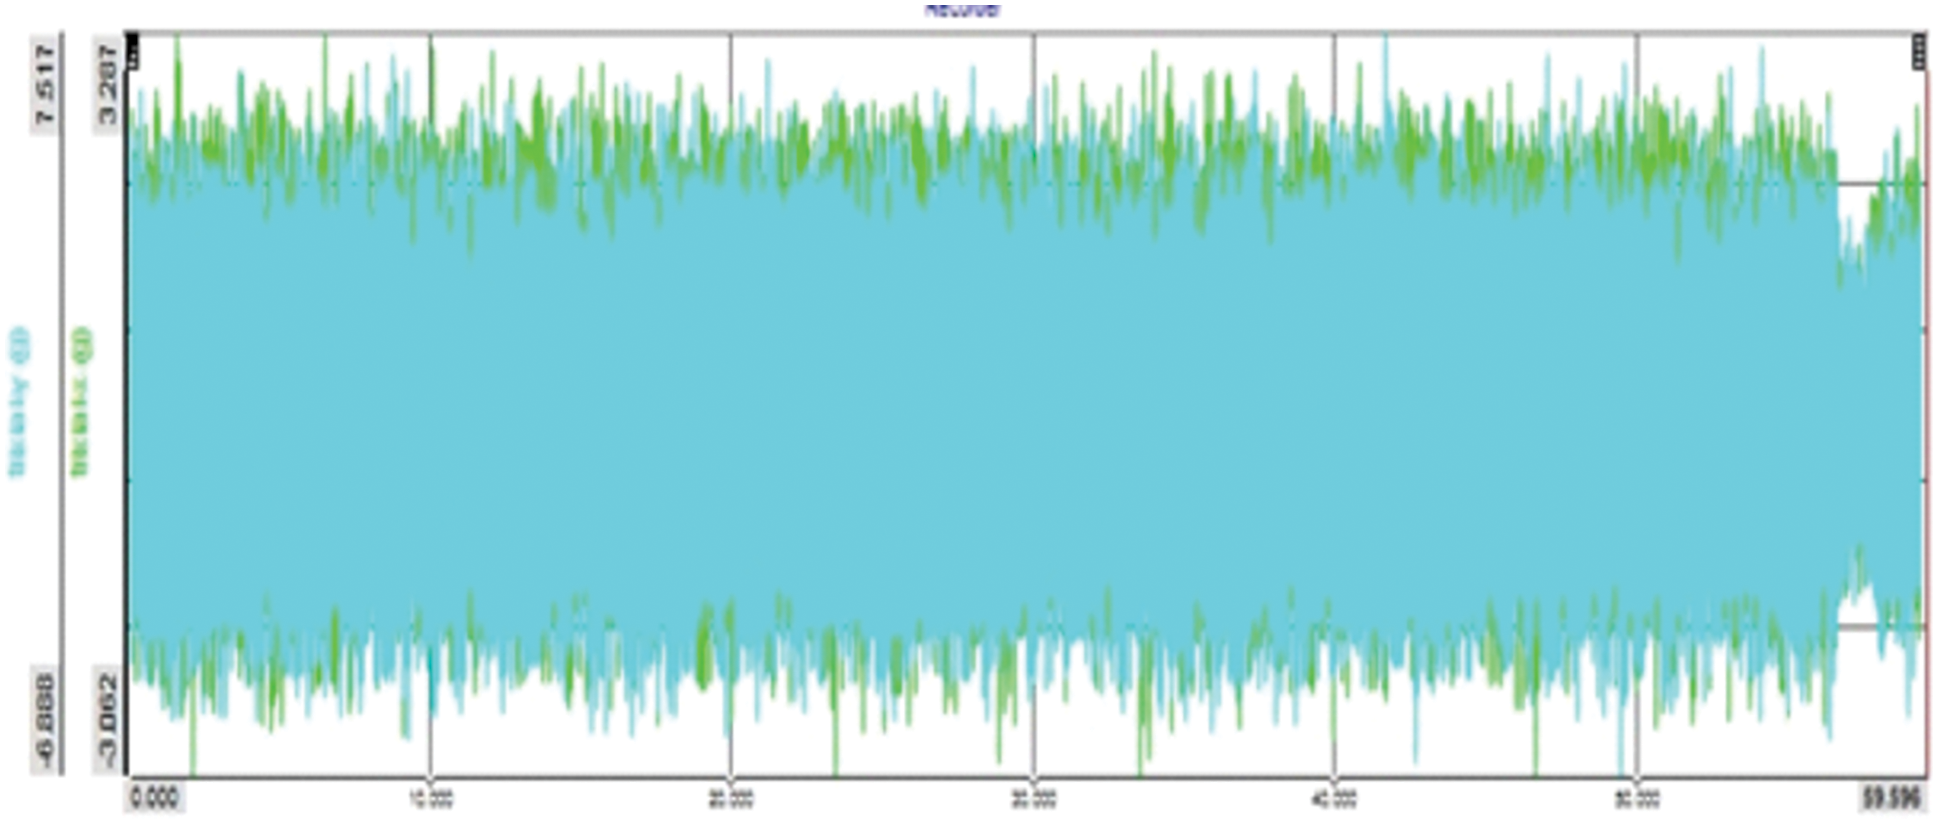
Figure 4: Acceleration data-time in s vs. acceleration in g tested at 1560 RPM engine speed
Fig. 5 shows the graph plotted between the frequency and acceleration value in ‘g” units. The maximum acceleration was 0.1 g and was recorded at a frequency of 800 Hz on the x-axis. The maximum acceleration was 0.125 g and was recorded at a frequency of 1200 Hz on the y-axis.
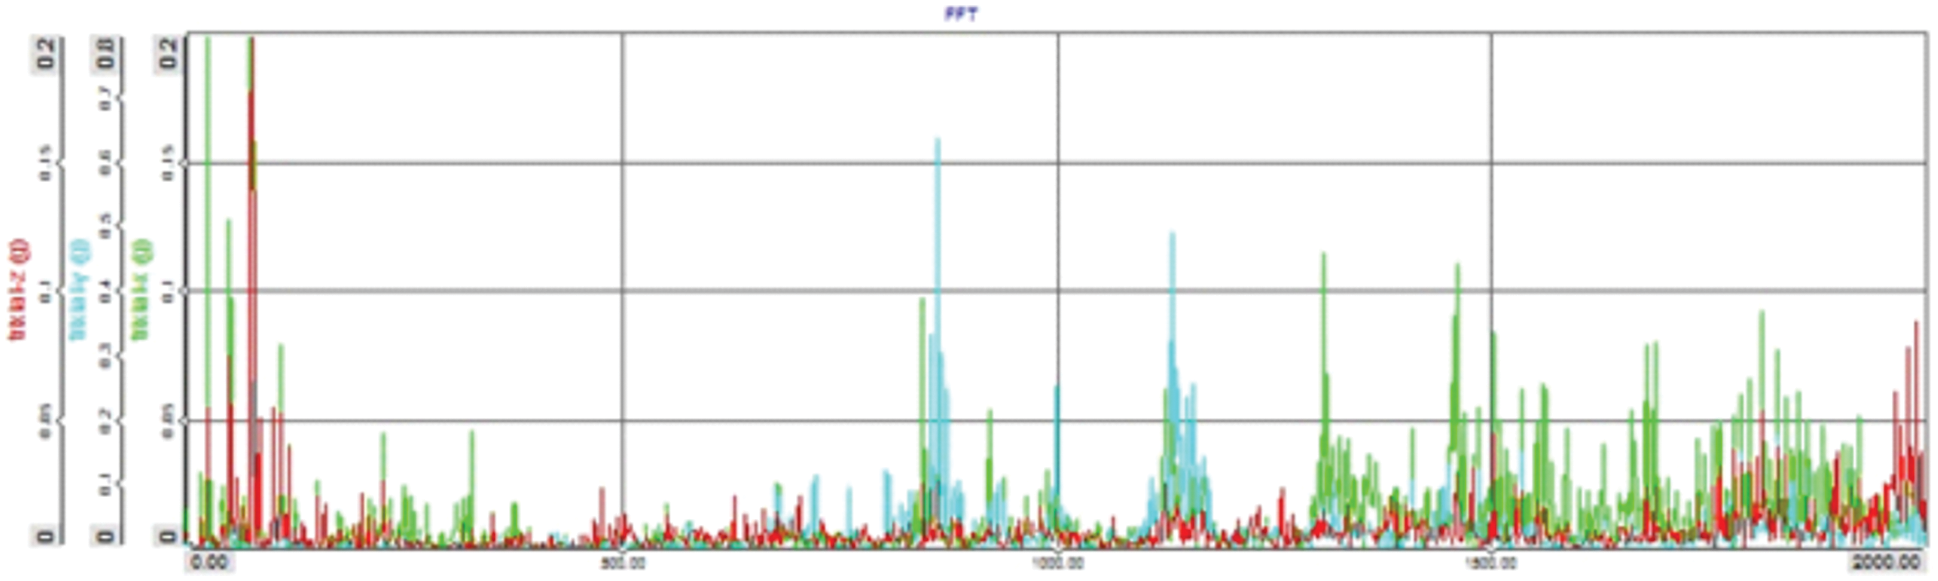
Figure 5: The FFT data–frequency in Hz vs. acceleration in g tested at 1560 rpm engine speed
Tab. 1 shows the model calculation of the data retrieved from the image vision process and accelerometer readings, the least measurable displacement value is 0.01 mm. Figs. 6–13 the color of the legend in red and blue show the acceleration value measured from the vision process and the conventional acceleration sensors.


Figure 6: Vibration comparisons for two seconds (0.00 to 2.00 s)

Figure 7: Vibration comparisons for two seconds (0.00 to 2.00 s)

Figure 8: Vibration comparison for ten seconds (0.00 to 10.00 s)

Figure 9: Vibration comparisons for ten seconds (10.04 to 21.29 s)
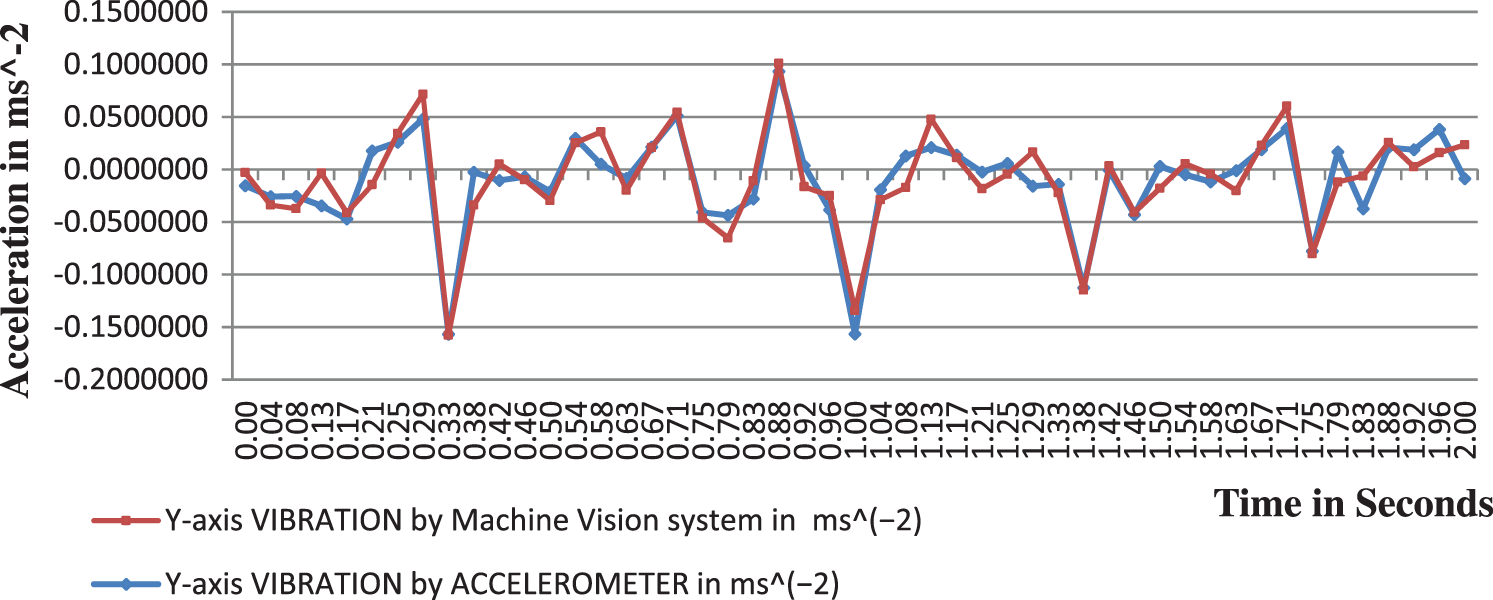
Figure 10: Vibration comparison for two seconds on Y-axis (0.00 to 2.00 s)
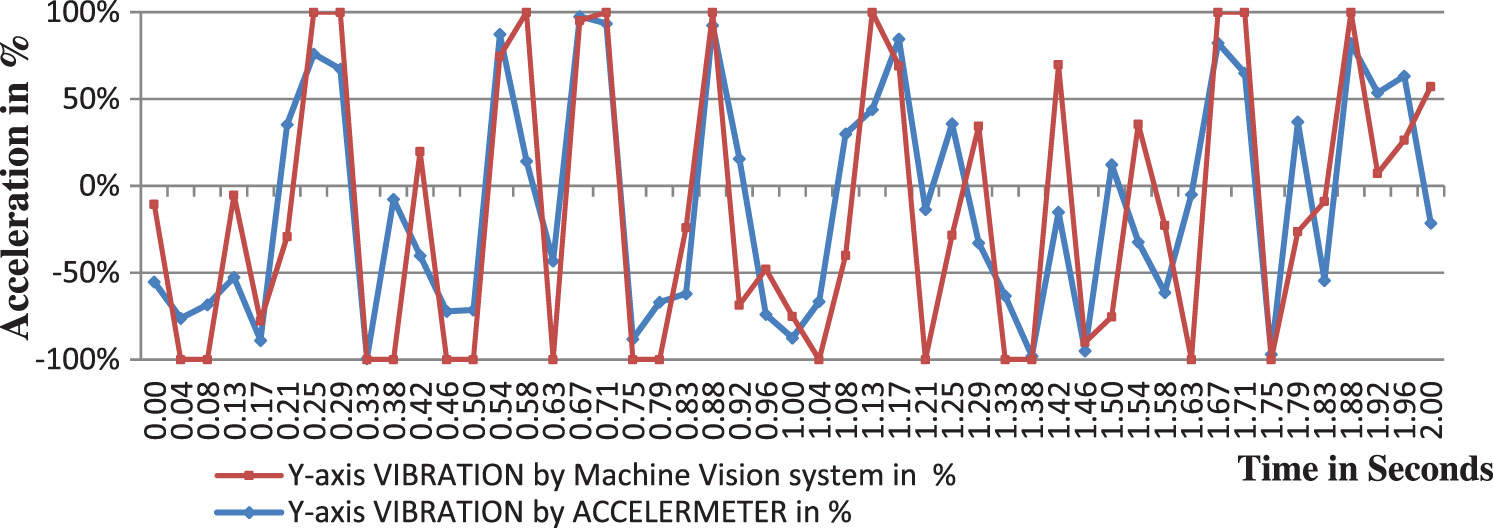
Figure 11: Vibration comparison for two seconds on the Y-axis (0.00 to 2.00 s)
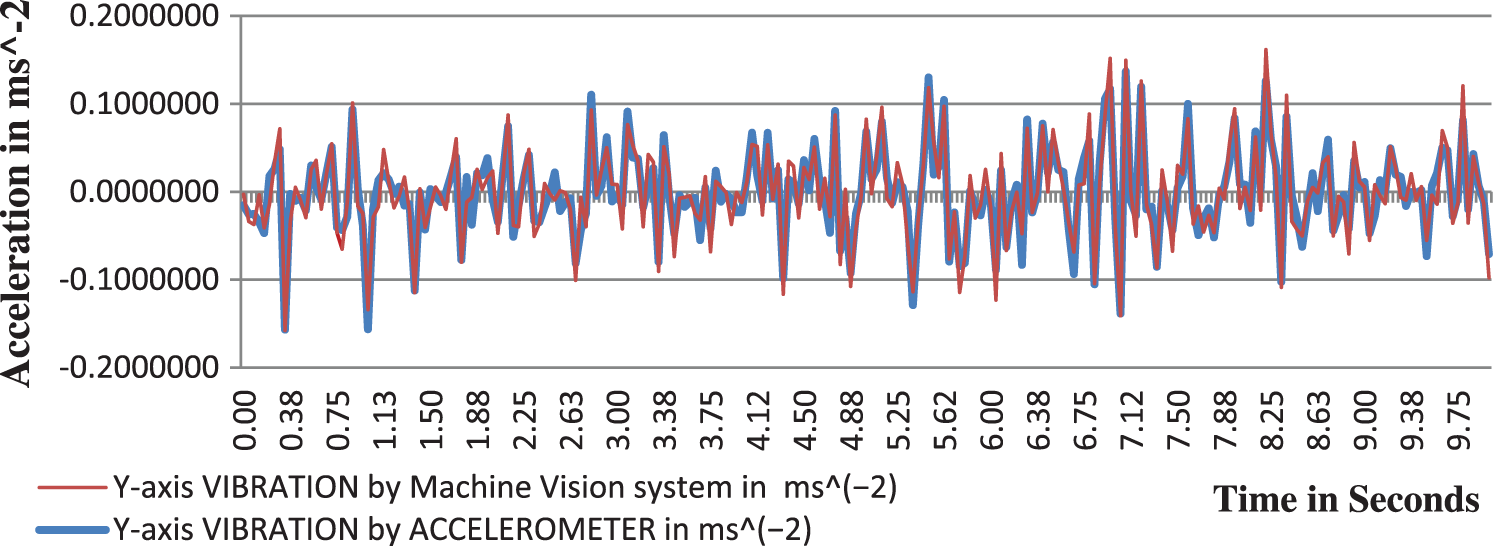
Figure 12: Vibration comparisons for ten seconds on the Y-axis (0.00 to 10.00 s)

Figure 13: Vibration comparisons for ten seconds on the Y-axis (10.04 to 20.00 s)
Figs. 6 and 7 show the vibration amplitude compared to two seconds. The maximum positive amplitude is at 1.17 s with an error of 10% and the maximum negative amplitude is at 0.08 sec with an error of 10%. The maximum percentage of error is recorded at 0.13, 0.63, and 1.0 s with an error ranging from 30% to 50% at very low vibration amplitude which is not the essential range for vibration analysis. The maximum error was recorded at very low acceleration values of 0.001–0.005 ms−2.
Figs. 8 and 9 show the vibration comparison for the period of 0 to 9.75 s and 10.04 to 21.29 s. The graph trend shows good agreement between the two measurement techniques.
Figs. 10 and 11 show the vibrational amplitude trends in the Y direction for two seconds. The maximum positive amplitude was recorded at 0.88 s with an error of 8%. The maximum negative amplitude is recorded in 0.33 s with a 10% error. The maximum percentage of error was recorded at 0.00, 0.04, 0.42, 0.63, 0.79, and 1.92 s at very low vibrational frequencies with errors ranging from 30% to 50%, which is not a necessary range for vibration analysis. The maximum deviation or error was recorded at very low acceleration values of 0.001–0.005 ms−2.
Figs. 12 and 13 show the vibration comparison for the period of 0 to 9.75 and 10.04 s to 21.29 s with a graph between time and y-axis acceleration.
Figs. 14 and 15 show that even at different intensities of light, the vibration measurements do not vary significantly.

Figure 14: Vibration comparisons at the various intensity of light for two seconds (00.00 to 2.00 s)

Figure 15: Vibration comparisons at the various intensity of light for two seconds on the Y-axis (00.00 to 2.00 s)
An experiment was conducted using a long-stroke shaker, a single camera of 300 fps, and a heterodyne laser interferometer. The two methods of calculating displacement show close agreement. Displacement was measured at several frequencies; the minimum error of 0.195% was recorded when the displacement was 175 mm and the maximum error of 0.447% was recorded when the displacement was 10.335 mm [22–26]. The latest vision-based experiment was conducted on a beam having nine LED light target points subjected to two loading conditions. In a dynamic loading, displacement was recorded for four excitations; the maximum error of 2.9% was recorded at 5.317 mm, and the minimum error of 0.41% was recorded at 7.012 mm. In a static loading, displacement was recorded for three loads at two target points; the first point records a maximum error of 5.38% at 5.317 mm and a minimum error of 2.14% at 7.012 mm. The second point records a maximum error of 8.45% at 2.761 mm and a minimum error of 3.03% at 1.355 mm. The least amount of displacement that can be measured is 0.1 mm [27–29].
The citations [30–35] are validating the vision sensor and the algorithm used in the proposed vision system. The citations [36–40] are validating the results and the percentage of error. The proposed system follows the same error pattern. The percentage of error is more at lower displacement values; the percentage of error is more comparable at the higher value of displacements. The minimal amount of 0.01 mm displacement can be measured in this proposed machine vision system.
Finally, the suggested system is more suitable for measuring the vibration of stationary machinery having low frequency ranges. The use of a macro lens permits capturing the image frames at very close-ups. The close-up images facilitate the marking of a very small target in the region of interest in addition to assigning real-world dimensions to the known white sticker to achieve the accuracy level of 0.01 mm. The laborious procedure of camera calibration is avoided in the proposed study. A color white sticker of a known real-world dimension is used to bring the scaling factor high because the image dimension is adjusted with a real-world dimension with an accuracy of less than one mm. The white sticker background minimizes the noise in the image. Image processing is performed without pre-processing to calculate sub-pixel-level displacement to save time and memory. A larger sticker marked with different color dots allows measuring vibration at several points from video frames. Any tilt either in the camera fixture or in the sticker that is pasted on the surface of the machine can be adjusted easily in the video frames to account for more accuracy. The percentage of error was recorded between 30% and 50% at very low vibration values close to zero, whereas it was recorded between 5% and 10% error in most high-accelerations, the essential range for vibration analysis. However, the graph trends follow the same path for all the sets of data. The vibration quantity measured by the machine vision system using the mathematical algorithm is less than the values of conventional accelerometer readings, which may be due to the sensitivity of the accelerometer sensor. Further research is needed to determine the exact reason for this error. The measurement data have comparable accurate graph trends that can be used as a non-contact vibration measuring tool in an automated condition monitoring system. A 30% to 50% error percentage has been reported when the vibration amplitude is very small. Therefore this study is not suitable for Nano vibration analysis. This is a significant limitation of this study.
Acknowledgement: The authors show a deep sense of gratitude to the Sathyabama Institute of Science and Technology and the anonymous reviewers.
Funding Statement: The authors received no specific funding for this study.
Conflicts of Interest: The authors declare that they have no conflicts of interest to report regarding the present study.
References
1. L. Yu and B. Pan, “Single-camera high-speed stereo-digital image correlation for full-field vibration measurement,” Mechanical Systems and Signal Processing, vol. 94, pp. 374–383, 2017. [Google Scholar]
2. B. Shan, S. Zheng and J. Ou, “Free vibration monitoring experiment of a stayed-cable model based on stereovision,” Measurement, vol. 76, pp. 228–239, 2015. [Google Scholar]
3. D. Zhan, L. Yu, J. Xiao and T. Chen, “Multi-camera and structured-light vision system (MSVS) for dynamic high-accuracy 3D measurements of railway tunnels,” Sensors, vol. 15, pp. 8664–8684, 2015. [Google Scholar]
4. K. -S. Son, H. -S. Jeon, J. -H. Park and J. W. Park, “Vibration displacement measurement technology for cylindrical structures using camera images,” Nuclear Engineering and Technology, vol. 47, no. 4, pp. 488–499, 2015. [Google Scholar]
5. B. Liu, D. Zhang, J. Guo and C. Zhu, “Vision-based displacement measurement sensor using modified Taylor approximation approach,” Optical Engineering, vol. 55, no. 11, pp. 114103–10, 2016. [Google Scholar]
6. Y. -N. Jeng and C. -H. Wu, “Frequency identification of vibration signals using video camera,” Sensors, vol. 12, pp. 13871–13898, 2012. [Google Scholar]
7. S. K. Nithin, K. Hemanth, V. Shamanth, R. S. Mahale, P. C. Sharath et al., “Importance of condition monitoring in mechanical domain,” Materials Today: Proceedings, vol. 54, pp. 234–239, 2021. [Google Scholar]
8. C. Zhi Dong and F. Necati Catbas, “A review of computer vision–based structural health monitoring at localand global levels,” Structural Health Monitoring, vol. 20, no. 2, pp. 692–743, 2021. [Google Scholar]
9. W. Sun, G. C. Zhang, X. R. Zhang, X. Zhang and N. N. Ge, “Fine-grained vehicle type classification using lightweight convolutional neural network with feature optimization and joint learning strategy,” Multimedia Tools and Applications, vol. 80, no. 20, pp. 30803–30816, 2021. [Google Scholar]
10. W. Sun, X. Chen, X. R. Zhang, G. Z. Dai, P. S. Chang et al., “A Multi-feature learning model with enhanced local attention for vehicle re-identification,” Computers, Materials & Continua, vol. 69, no. 3, pp. 3549–3560, 2021. [Google Scholar]
11. A. Hijazi, A. Friedl and C. J. Kähler. “Influence of camera’s optical axis non-perpendicularity on measurement accuracy of two-dimensional digital image correlation,” Jordan Journal of Mechanical and Industrial Engineering, vol. 5, pp. 373–382, 2011. [Google Scholar]
12. D. Feng, M. Q. Feng, E. Ozer and Y. Fukuda, “A Vision-based sensor for noncontact structural displacement measurement,” Sensors, vol. 15, no. 7, pp. 16557–16575, 2015. [Google Scholar]
13. J. Sładek, K. Ostrowska, P. Kohut, K. Holak, A. Gąska et al., “Development of a vision based deflection measurement system and its accuracy assessment,” Measurement, vol. 46, pp. 1237–1249, 2013. [Google Scholar]
14. L. He, J. Tan, Q. Hu, S. He, Q. Cai et al., “Contact measurement of the surface displacement of a slope based on a smart binocular vision system,” Sensors, vol. 18, pp. 2890, 2018. [Google Scholar]
15. J. Unger and K. Brinker, “Efficient image registration with subpixel accuracy using a hybrid Fourier-based approach,” Matrix, vol. 1000, pp. 136–143, 2021. [Google Scholar]
16. M. G-Sicairos, S. T. Thurman and J. R. Fienup, “Efficient subpixel image registration algorithms,” Optics Letters, vol. 33, pp. 156–158, 2008. [Google Scholar]
17. J. Li and Q. Ma, “A fast subpixel registration algorithm based on single-step DFT combined with phase correlation constraint in multimodality brain image,” Computational and Mathematical Methods in Medicine, vol. 2020, pp. 10, 2020. [Google Scholar]
18. Z. Zhang, “A flexible new technique for camera calibration,” IEEE Transactions on Pattern Analysis and Machine Intelligence, vol. 22, pp. 1330–1334, 2000. [Google Scholar]
19. Z. Dworakowski, P. Kohut, A. Gallina, K. Holak and T. Uhl, “Vision-based algorithms for damage detection and localization in structural health monitoring,” Structural Control and Health Monitoring, vol. 23, no. 1, pp. 35–50, 2015. [Google Scholar]
20. D. Brown, “Innovative uses of video analysis,” The Physics Teacher, vol. 47, pp. 145, 2009. [Google Scholar]
21. C. Eberl, R. Thompson, D. Gianol and S. Bundschuh, “Digital image correlation and tracking with matlab,” in Matlab Central, Karlsruhe, Germany, 2010. [Online]. Available: https://www.mathworks.com/matlabcentral/. [Google Scholar]
22. D. Zhang, J. Guo, X. Lei and C. Zhu, “A High-speed vision-based sensor for dynamic vibration analysis using fast motion extraction algorithms,” Sensors, vol. 16, pp. 572, 2016. [Google Scholar]
23. J. Lee, K. -C. Lee, S. Cho and S. -H. Sim, “Computer vision-based structural displacement measurement robust to light-induced image degradation for in-service bridges,” Sensors, vol. 17, pp. 2317, 2017. [Google Scholar]
24. J. Javh, J. Slavic and M. Boltezar, “Measuring full-field displacement spectral components using photographs taken with a DSLR camera via an analogue Fourier integral,” Mechanical Systems and Signal Processing, vol. 100, pp. 17–27, 2018. [Google Scholar]
25. M. Yang, C. Cai, Y. Wang, H. Zhu and Z. Liu, “A novel low frequency vibration measurement method based on single camera,” Journal of Physics, Conference Series, vol. 1, pp. 1065, 2018. [Google Scholar]
26. T. Wu, L. Tang, S. Shao, X. Y. Zhang, Y. J. Liu et al., “Cost-effective, vision-based multi-target tracking approach for structural health monitoring,” Measurement Science and Technology, vol. 32, pp. 125116, 2021. [Google Scholar]
27. J. Luo, B. Liu, P. Yang and X. Fan, “High-speed vision measurement of vibration based on an improved ZNSSD template matching algorithm,” Systems Science & Control Engineering, vol. 10, no. 1, pp. 43–54, 2022. [Google Scholar]
28. Y. Xu, J. Zhang and J. Brownjohn, “An accurate and distraction-free vision-based structural displacement measurement method integrating Siamese network-based tracker and correlation-based template matching,” Measurement, vol. 179, pp. 109506, 2021. [Google Scholar]
29. J. R. Albert and A. A. Stonier, “Design and development of symmetrical super-lift DC–AC converter using firefly algorithm for solar-photovoltaic applications,” IET Circuits, Devices & Systems, vol. 14, no. 3, pp. 261–269, 2020. [Google Scholar]
30. D. Shunmugham Vanaja, J. R. Albert and A. A. Stonier, “An experimental investigation on solar PV fed modular STATCOM in WECS using intelligent controller,” International Transactions on Electrical Energy Systems, vol. 31, no. 5, pp. e12845, 2021. [Google Scholar]
31. M. Murugesan, K. Kaliannan, S. Balraj, K. Singaram, T. Kalianna et al., “A hybrid deep learning model for effective segmentation and classification of lung nodules from CT images,” Journal of Intelligent and Fuzzy System, vol. 42, no. 3, pp. 2667–26791, 2021. [Google Scholar]
32. J. R. Albert, A. Sharma, B. Rajani, A. Mishra, A. Saxena et al., “Investigation on load harmonic reduction through solar-power utilization in intermittent SSFI using particle swarm, genetic, and modified firefly optimization algorithms,” Journal of Intelligent and Fuzzy System, vol. 42, no. 4, pp. 4117–4133, 2022. [Google Scholar]
33. K. Vanchinathan, K. R. Valluvan, C. Gnanavel, C. Gokul and R. Renold, “An improved incipient whale optimization algorithm based robust fault detection and diagnosis for sensorless brushless DC motor drive under external disturbances,” International Transactions on Electrical Energy Systems, vol. 31, no. 12, pp. e13251, 2021. [Google Scholar]
34. S. K. Ramaraju, T. Kaliannan, S. Androse Joseph, U. Kumaravel, J. R. Albert et al., “Design and experimental investigation on VL-MLI intended for half height (h-h) method to improve power quality using modified particle swarm optimization (MPSO) algorithm,” Journal of Intelligent and Fuzzy System, vol. 42, no. 6, pp. 5939–5956, 2022. [Google Scholar]
35. L. Thangamuthu, J. R. Albert, K. Chinnanan and B. K. Chinnanan, “Design and development of extract maximum power from single-double diode PV model for different environmental condition using BAT optimization algorithm,” Journal of Intelligent and Fuzzy System, vol. 42, pp. 1–12, 2021. [Google Scholar]
36. P. Rajarathinam, G. Vijayakumar, S. Saravanan and J. R. Albert, “Experimental investigation and comparative harmonic optimization of AMLI incorporate modified genetic algorithm using for power quality improvement,” Journal of Intelligent and Fuzzy System, vol. 43, pp. 1–14, 2022. [Google Scholar]
37. J. R. Albert, “Design and investigation of solar PV fed single-source voltage-lift multilevel inverter using intelligent controllers,” Journal of Control, Automation and Electrical Systems, vol. 33, pp. 1–26, 2022. [Google Scholar]
38. C. Gnanavel, P. Muruganatham, K. Vanchinathan and J. R. Albert, “Experimental validation and integration of solar Pv fed modular multilevel inverter and flywheel storage system,” in Proc. 2021 IEEE Mysore Sub Section Int. Conf., Hassan, India, vol. 1, pp. 147–153, 2021. [Google Scholar]
39. T. Kaliannan, J. R. Albert, D. M. Begam and P. Madhumathi, “Power quality improvement in modular multilevel inverter using for different multicarrier PWM,” European Journal of Electrical Engineering and Computer Science, vol. 5, no. 2, pp. 19–27, 2021. [Google Scholar]
40. A. Johny Renoald, D. Muhamadha Begam and B. Nishapriya, “Micro grid connected solar PV employment using for battery energy storage system,” Journal of Xidian University, vol. 15, no. 3, pp. 85–97, 2021. [Google Scholar]
Cite This Article
 Copyright © 2023 The Author(s). Published by Tech Science Press.
This work is licensed under a Creative Commons Attribution 4.0 International License , which permits unrestricted use, distribution, and reproduction in any medium, provided the original work is properly cited.
 Downloads
 Citation Tools