
 Submit a Paper
 Propose a Special lssue
 Open Access
ARTICLE
Novel Path Counting-Based Method for Fractal Dimension Estimation of the Ultra-Dense Networks
1 Department of Telecommunication Networks and Data Transmission, The Bonch-Bruevich Saint-Petersburg State University of Telecommunications, Saint Petersburg, 193232, Russia
2 Department of Information Technology, College of Computer and Information Sciences, Princess Nourah bint Abdulrahman University, Riyadh, 84428, Saudi Arabia
3 Department of Computer Sciences, College of Computer and Information Sciences, Princess Nourah bint Abdulrahman University, Riyadh, 84428, Saudi Arabia
4 Department of Electronics and Communications Engineering, Zagazig University, Zagazig, 44519, Sharqia, Egypt
* Corresponding Author: Hussah Nasser AlEisa. Email:
Intelligent Automation & Soft Computing 2023, 36(1), 561-572. https://doi.org/10.32604/iasc.2023.031299
Received 14 April 2022; Accepted 21 June 2022; Issue published 29 September 2022
 View Full Text
 Download PDF
Abstract
Next-generation networks, including the Internet of Things (IoT), fifth-generation cellular systems (5G), and sixth-generation cellular systems (6G), suffer from the dramatic increase of the number of deployed devices. This puts high constraints and challenges on the design of such networks. Structural changing of the network is one of such challenges that affect the network performance, including the required quality of service (QoS). The fractal dimension (FD) is considered one of the main indicators used to represent the structure of the communication network. To this end, this work analyzes the FD of the network and its use for telecommunication networks investigation and planning. The cluster growing method for assessing the FD is introduced and analyzed. The article proposes a novel method for estimating the FD of a communication network, based on assessing the network’s connectivity, by searching for the shortest routes. Unlike the cluster growing method, the proposed method does not require multiple iterations, which reduces the number of calculations, and increases the stability of the results obtained. Thus, the proposed method requires less computational cost than the cluster growing method and achieves higher stability. The method is quite simple to implement and can be used in the tasks of research and planning of modern and promising communication networks. The developed method is evaluated for two different network structures and compared with the cluster growing method. Results validate the developed method.Keywords
The dramatic increase of the number of wireless devices that exceeds the number of inhabitants of the earth puts high constraints on the design and development of modern communication networks [1]. Such communication networks that include fifth-generation (5G) cellular systems, Internet of Things (IoT), and sixth-generation (6G) cellular systems are required to achieve high-to-ultra-high network scalability [2–4]. Moreover, the design issues associated with coverage and other network requirements should be provided for dense/ultra-dense deployment scenarios [5]. Thus, novel approaches should be considered while designing communication networks of such systems.
Since such networks are heterogeneous, the network structure undergoes changes related to the system requirements, e.g., speed of data transfer, latency of communicated data, availability, and reliability [6,7].
Structural changes are associated with the required quality of service (QoS)/quality of experience (QoE), which is achieved by reducing distances between end-devices and the access technology, e.g., base station and gateway [8]. Moreover, introducing service delivery points, i.e., cloud services and capabilities, near end-devices is another structural approach that can improve network performance and increase the QoS/QoE [9,10].
The extremely large number of network nodes inevitably leads to the appearance of typical structures of various scales [11]. For example, user service structures in the area of operation of the base station, base station service structures, micro, mini, and macro cloud services organization structures, transport network organization structures, and others [12]. When organizing software-configurable networks, e.g., the cores of a 5G network, such typical structures arise, e.g., the structures of networks serviced by various controllers and orchestrators [13,14].
The presence of typical structures assumes the invariance of the structure when it is scaled [15]. Typical structures in communication networks could always be distinguished; however, quantitative changes caused by the development of the large-scale modern networks, e.g., Internet, social networks, Internet of Things, and Tactile Internet services, lead to the formation of structures that need to be described using new models and methods [16–18]. For example, when the number of users in the coverage area of a base station is calculated in units, the structure of the served area differs from the traditional structure, and moreover it dynamically changes as the number of users changes.
This number is estimated in thousands of devices and is expected to increase exponentially. Thus, minor changes in the number of devices per unit, practically, do not affect the structure, which means that the quantitative change in the number of deployed devices has no significant effect on the stability of the network structure. In such cases, it is necessary to represent the structure of the network, at both the physical and logical levels, which would allow to evaluating the network properties. The properties of typical structures used to build traditional communication networks, e.g., star, bus, and tree topologies, are quite clear and well-known [19]. However, with a large number of nodes, such structures are used together, which represents a challenge in determining the network properties. In order to represent the structure of a high/ultra-high-density network, it is necessary to have some characteristics that enable to numerically evaluate the differences between typical structures, as well as having links with the main indicators of the functioning of the communication network [20].
This work considers using fractal dimension (FD) as an indicator to represent the communication network structure. FD is usually used to describe natural objects that are difficult to be analyzed [21]. It has a geometric meaning of the shape’s characteristics that are dependent on the scale in which the object is viewed. The invariance of the structure with respect to scale changes is related to the concept of self-similarity.
The numerical value of the FD allows us to judge the geometric properties of the object. The concept of FD has been expanded and applied to random processes. Recent techniques in the theory of Teletraffic use the Hearst to evaluate the properties of the network traffic [22,23]. In [24,25], the concept of FD is used to describe the network environment, while in [26] it is used to describe the size of digital clusters. In the previously mentioned works, FD is used in relation to artificial objects of the network environment space, e.g., buildings and roads; however, real objects in the surrounding world should be considered fractal. In some cases, when it comes to networks of natural origin in the microcosm, e.g., molecular connections and neural network, physics and chemistry also resort to their description using the concept of FD [27]. The communication network is an artificial object; however, its development is associated with an evolutionary process of natural objects, and the current numerical indicators allow it to be put on a par with such objects.
The main contributions of this article can be summarized as follows.
1. Design a network model based on graph theory, and model the problem of network structure.
2. Design a framework to describe the structure of the communication network based on the concept of FD.
3. Development of a method for estimating the fractal dimension of the wireless network based on the connectivity.
4. Design a novel method for extracting features of the network structure. This is achieved by employing the FD values as numerical indicators that characterize the network features. The value of FD is not an exhaustive characteristic of the structure, but FD can be an attribute of network indicators since FD provides information that is necessary for evaluating and comparing network structures.
2 Network Model and Problem Statement
We consider a wireless network with a model represented by a graph G (V, E); V is the set of network vertices, and E is the set of communication links. For a physical network structure, the set of vertices V is associated with a set of network nodes, and the set of edges E is associated with a set of communication lines. For a logical structure, i.e., the structure of information links, the set of vertices V is also associated with a set of network nodes, while the set of edges E is associated with a set of routes, i.e., information links.
In general, an oriented weighted graph should be used to describe the communication network since the parameters of the connections may not be symmetric. For the modeled network, it is assumed that the communication channels are symmetric, and thus we consider an undirected weighted graph. The weights of the edges of graph G reflect some numerical characteristics essential for solving a specific problem, e.g., distance, data transfer rate, delivery delay, and probability of losses.
A network model in the form of a graph considers its structural and geographical features by setting the corresponding coordinates to the vertices, i.e., weights to the edges of the graph. Moreover, it can reflect other topological features. The considered model is an undirected weighted graph, and thus, the FD of the network, i.e., graph, can be defined for it [28]. To evaluate the FD of the network, the cluster growing method is used [29].
The cluster formation process in a communication network starts by randomly selecting of some vertices [30]. Then, the selected vertices are connected, starting from the first selected one, with edges, if the distance between them does not exceed a given value r. The resulting cluster contains m vertices. Each of the vertices is assigned a certain weight, using the mass coefficient, Vj, and thus, the total mass of the cluster, C, is MC, and is calculated as in Eq. (1).
For a unity weight of different vertices, i.e., Vj = 1, the average mass of the cluster is equal to the average number of vertices in it. Increasing the value of r, results in an increase in the size of the resulting cluster, i.e., the number of vertices in the cluster. This is due to the fact that the cluster in this case includes vertices that are further away from the neighboring vertices. As r increases, the cluster growth process is observed. This process characterizes a set of vertices, i.e., nodes, from the point of view of forming a network according to the metric r. The network operation parameter can be selected as this metric. For example, if it is a distance, then this process can characterize a change in the connectivity of a wireless network. Other examples, if it is a delay, then it characterizes the network’s ability to meet data delivery time requirements, and if it is the probability of failure (loss), then this characteristic corresponds to the probability of delivery.
Fig. 1 presents an example for two iterations of clustering with different values of r. Fig. 1a shows the clustering result with a cluster size of r = 23 m, while Fig. 1b shows the result of the clustering with a cluster size of r = 27 m. In this example, a geometric model is given, in which the nodes of the graph model, i.e., network nodes, are located in a flat square area with a 500 m side. The network deploys 500 randomly distributed nodes, i.e., graph vertices. In the first case, the average number of nodes in the cluster, i.e., cluster mass, is 6.3 while in the second is 15.4. From the presented graph, all vertices can be connected, while the connectivity condition is not to exceed the distance r.
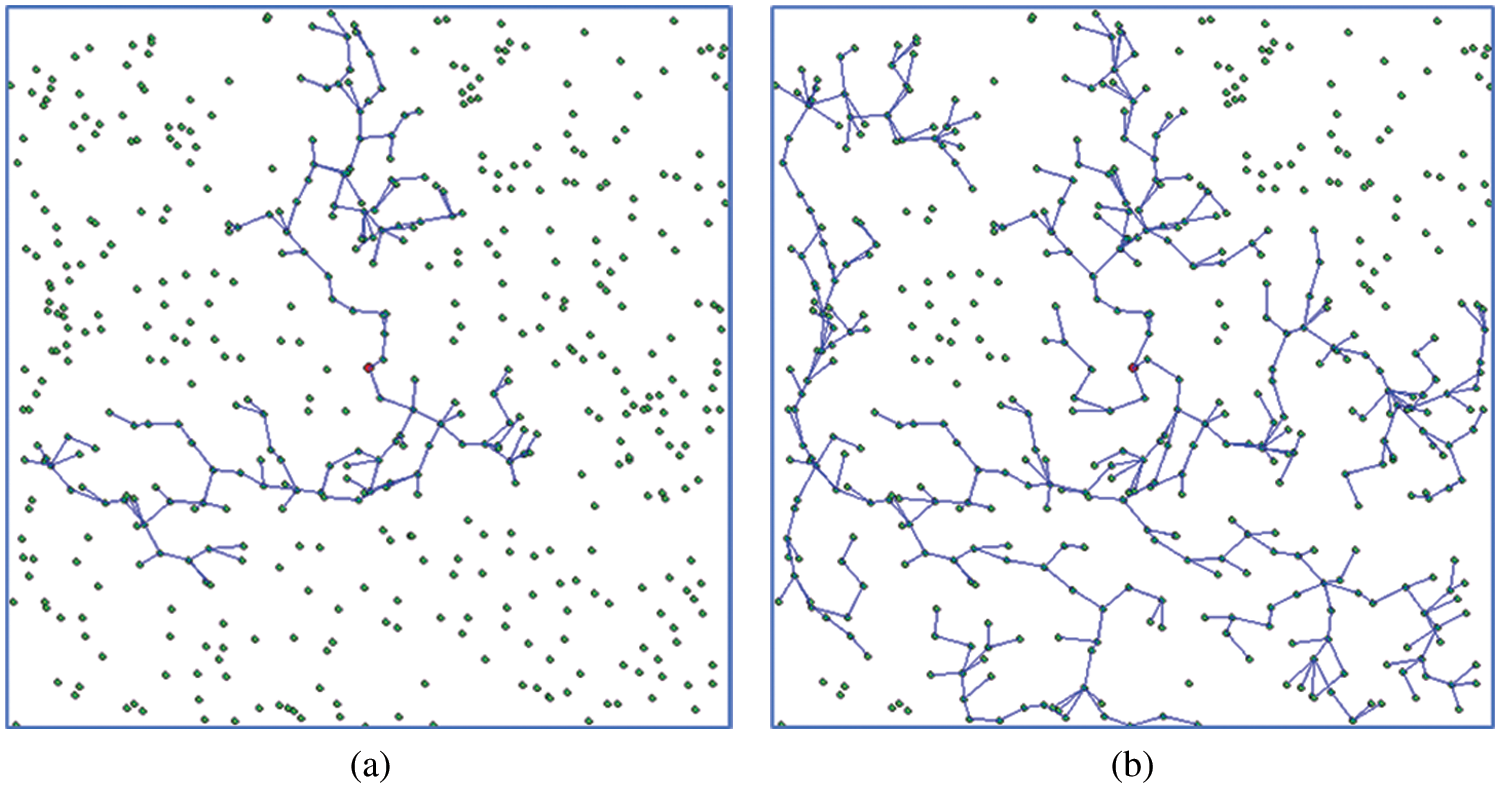
Figure 1: An example of performing clustering with different iterations (a) result of the clustering with a cluster size of r = 23 m, (b) result of clustering with a cluster size of r = 27 m
Obviously, the process of cluster growth depends on the choice of the initial vertex, and thus, one observation does not give a complete picture of the network. Therefore, the considered cluster growth method involves a lot of observations. Thus, the process of growing a cluster is repeated many times with different initial conditions that the process is started from different vertices of the network k times. These different vertices are randomly selected. The cluster’s average size, i.e., weight, is calculated as in Eq. (2).
To estimate the fractional dimension, FD, the fundamental relation is used as follows.
where df is the fractal dimension, FD. This method involves performing a number of graph clustering operations at different cluster size, r, values. For each clustering operation, the average mass of the cluster is calculated using Eq. (2), and the value of the FD, df, is calculated based on the fundamental relation introduced in Eq. (3). Turning the relation equation, Eq. (3), into equality, Eq. (3) can be modified as follows.
where a is a constant coefficient. This equation is a linear equation with the slope representing the value of FD, df, as illustrated in Fig. 2. Thus, the essence of the method of estimating the FD of a graph is to analyze the dependence of the average number of cluster vertices, i.e., cluster mass, on its size.
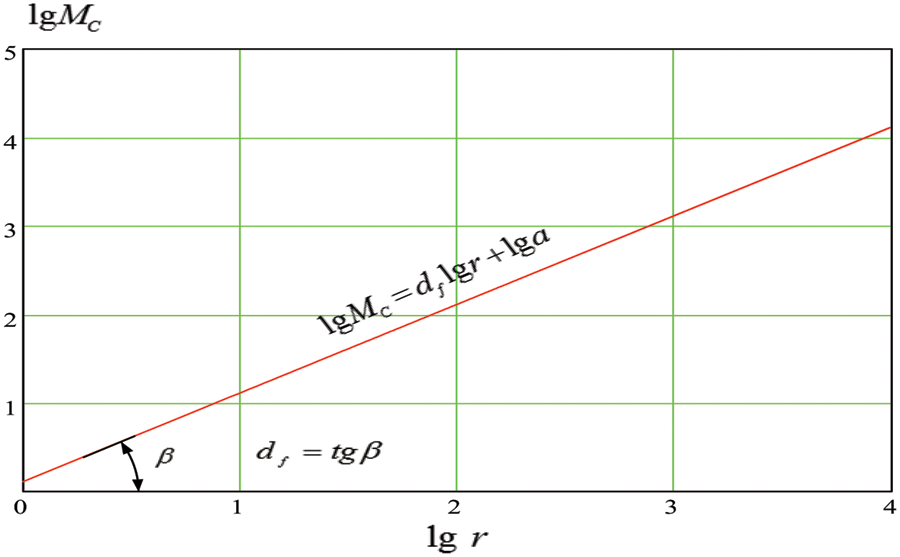
Figure 2: Analysis and introduction of FD
Obviously, the meaning of the FD differs when choosing different metrics for the weight coefficients attributed to the edges of the graph, i.e., the magnitude of r. For example, suppose the value of the data delivery delay is used as the weighting factor. In that case, the clustering will result in clusters made up of nodes, and the data delivery time between them does not exceed a specified value. The value of the FD, in this case, reflects the dependence of the number of nodes, in such clusters, on the value of the allowable delay. Such characteristics are important in evaluating communication networks, and for planning them. As it gives an idea of the logical structure of the network and its dependence on the requirements of the parameter selected as a metric.
The accuracy of the estimation process depends on the selected number of iterations k. Theoretically, this number is equal to the number of network nodes. However, in most practical cases, this number of itterations results in massive computations, and with different values of k, the results obtained may differ significantly. Labor intensity is a significant difficulty in implementing this method. Thus, the characteristic of the FD network can be used for promising communication networks as a characteristic of the structure for various functional parameters. For the practical use of FD, novel methods with limited computations should be introduced.
3 The Proposed Method for Estimating the Fractal Dimension of a Network Based on Connectivity
As mentioned in the previous section, the FD of a network can be estimated using Eq. (3), which represents the dependence of the number of vertices in the cluster on the value of r. This dependence characterizes the process of cluster growth with increasing r. Such a process is well identified in the theory of random graphs and percolation theory [31,32]. In the theory of random graphs, this process is considered as the process of phase transition of a graph from a disconnected state to a connected state, namely, the formation of a giant component of the graph [31]. The percolation theory also considers the phase transition of a medium from one state to another, e.g., from a non-conducting state to a conducting or another physical state, which is characterized by the formation of an infinite, i.e., percolation, cluster [32].
Both mentioned theories are similar in considering the process of cluster growth, clusters or graph components, which leads to a change in the properties of the network, environment, or graph. In this case, a cluster is understood as a set of vertices representing a graph component, i.e., a fully connected subgraph. Thus, when using the cluster growth method, if the range of the variation of r is large enough, the cluster in question is connected to a giant component after a certain step of increasing r. However, for small values of r, it most likely does not belong to a giant component. The choice of different clustering options, e.g., initial vertices, averages this process and allows to judge it as a process of changing the connectivity of the graph, i.e., network.
In this section, we propose a method for evaluating the FD of a network by evaluating its connectivity, which characterizes the reachability of the graph vertices. It is estimated through the number of shortest paths that can be established between its vertices. The proposed method is referred to as the method of counting paths.
When the graph is connected, there is at least one path between any pair of its vertices. Thus, in a connected graph, there is the shortest path between any pair of vertices, and when the several paths are of equal weight, then any of them is chosen as the shortest. Furthermore, if the graph contains N vertices and is completely connected, the number of shortest paths between its vertices is N2-N, excluding paths from the vertex to itself. When the value of r changes, the number of shortest paths in the graph changes from 0, a completely disconnected state, to the maximum possible value, the state of complete connectivity.
To estimate the FD, Eq. (3) is modified by replacing the cluster mass estimate with the number of shortest paths in the graph, as follows.
where S(r) is the number of shortest paths in the graph that can be estimated using Floyd’s algorithm [33]. The initial data of the algorithm is the distance matrix, D, which is defined as follows.
where di,j is the distance between vertices, i.e., nodes, i and j. The original distance matrix is modified by taking into account the value of r as follows.
where, dBIG is a sufficiently large number that exceeds the maximum possible path length, which in this case is equivalent to an infinitely large number. Obviously, a change in the value of r leads to a change in the distance matrix and, consequently, the shortest path search result.
Moreover, the Floyd’s algorithm is used to find the weights between all pairs of vertices and find the shortest paths. The weights of the shortest paths are represented by the C matrix defined in Eq. (8).
If the weight of the found path is not infinity, this indicates that this path exists; otherwise, there is no path. Thus, the number of paths is calculated as follows.
where, I is the indicator function that is defined as follows.
To calculate the FD, Eq. (5) is turned to the equality equation, Eq. (11).
where, S(r) is the number of shortest paths calculated using Eq. (9). The main steps of the Floyd’s algorithm for the developed route counting method are presented in Fig. 3.
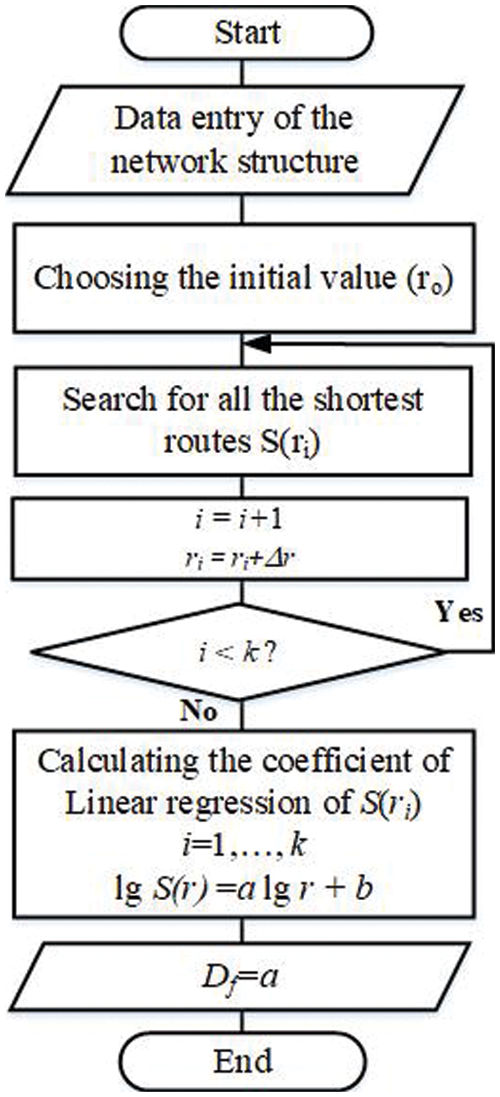
Figure 3: Processes of the route counting method to calculate FD
The cycle is performed k-times depending on the range of the changes of r, and the step size of its change Δr. Thus, k can be calculated as follows.
where rmax and rmin are the maximum and minimum values of r, respectively. The maximum and minimum values are selected based on the initial data from the distance matrix D.
The value of Δr is chosen based on the considerations of obtaining a sufficient number of points for constructing a linear regression, practically, several tens of points.
In this section, the developed method for estimating the fractal dimension of a communication network based on connectivity is evaluated. This is for the network shown in Fig. 1, with 500 nodes evenly distributed in a square.
Fig. 4 shows the result of the FD evaluation for the considered network using the proposed method and the cluster growing method.
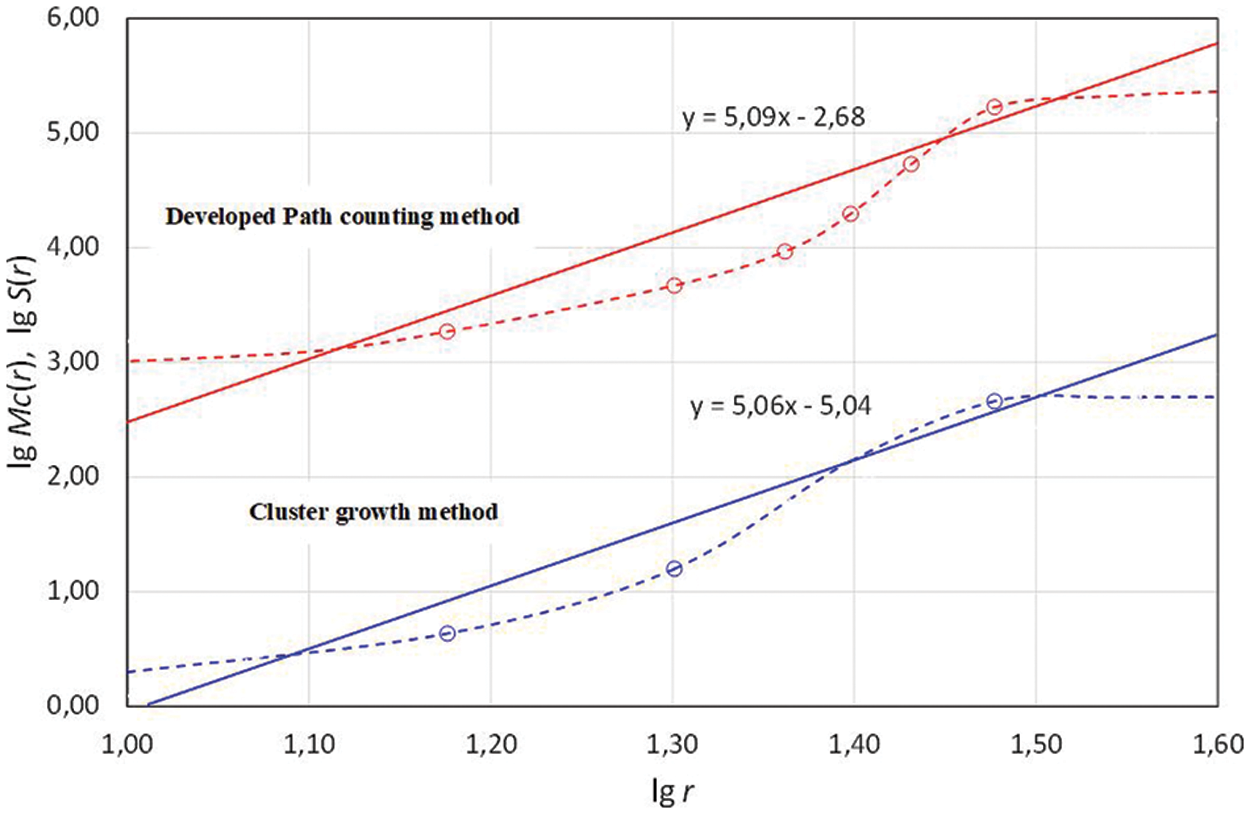
Figure 4: The result of the FD assessment by two methods
As presented in Fig. 4, both methods achieve nearly similar results. The mentioned points in the results are obtained by calculating the estimated indicators; the number of vertices in accordance with the cluster growing method, i.e., lower group of curves, and the number of routes in accordance with the proposed method, i.e., upper group of curves. These points are connected by dotted lines, which demonstrate the nature of the dependence of the corresponding indicator on the value of r. From the above dependencies, it can be seen that the laws of change of the considered indicators are very similar. The construction of linear regressions for the obtained results also confirms their similarity.
The FD was obtained by the cluster growing method for the given network, and its value is 5.06, while from the route counting method is 5.09. The proximity of the results obtained by these methods has been tested on a sufficiently large samples of different networks, while the difference between the estimates obtained has not exceed 5%. This gives grounds to assert that the proposed method can be used to evaluate the FD of a communication network with sufficient accuracy for practical application.
This 5% difference in the obtained values, when evaluating the cluster growth method is due to the number of iterations, i.e., initial conditions, is limited to reduce the number of calculations.
Thus, the proposed method is similar to the cluster growing method in the sense that it is also based on an estimate of the number of connected network nodes. The difference is that the estimation of this number is based on an estimate of the number of routes in the network.
The main advantage of the proposed method is the simplest implementation of the method that does not require many iterations, which reduces the implementation time and cost. Moreover, it is enough to obtain only one dependence of S(r). Fig. 5 shows another two constructed network structures formed by the placement of nodes. Both network structures are of 500 nodes distributed over a square area. The two considered structures differ in the distribution of nodes over the network area. In Fig. 5a, the coordinates of the nodes are distributed according to a two-dimensional, 2D, normal distribution, with a scattering point in the middle of the square and a standard deviation of 80. Fig. 5b shows a network structure, while nodes are distributed according to a multi-modal mixed distribution obtained from four 2D normal distributions.
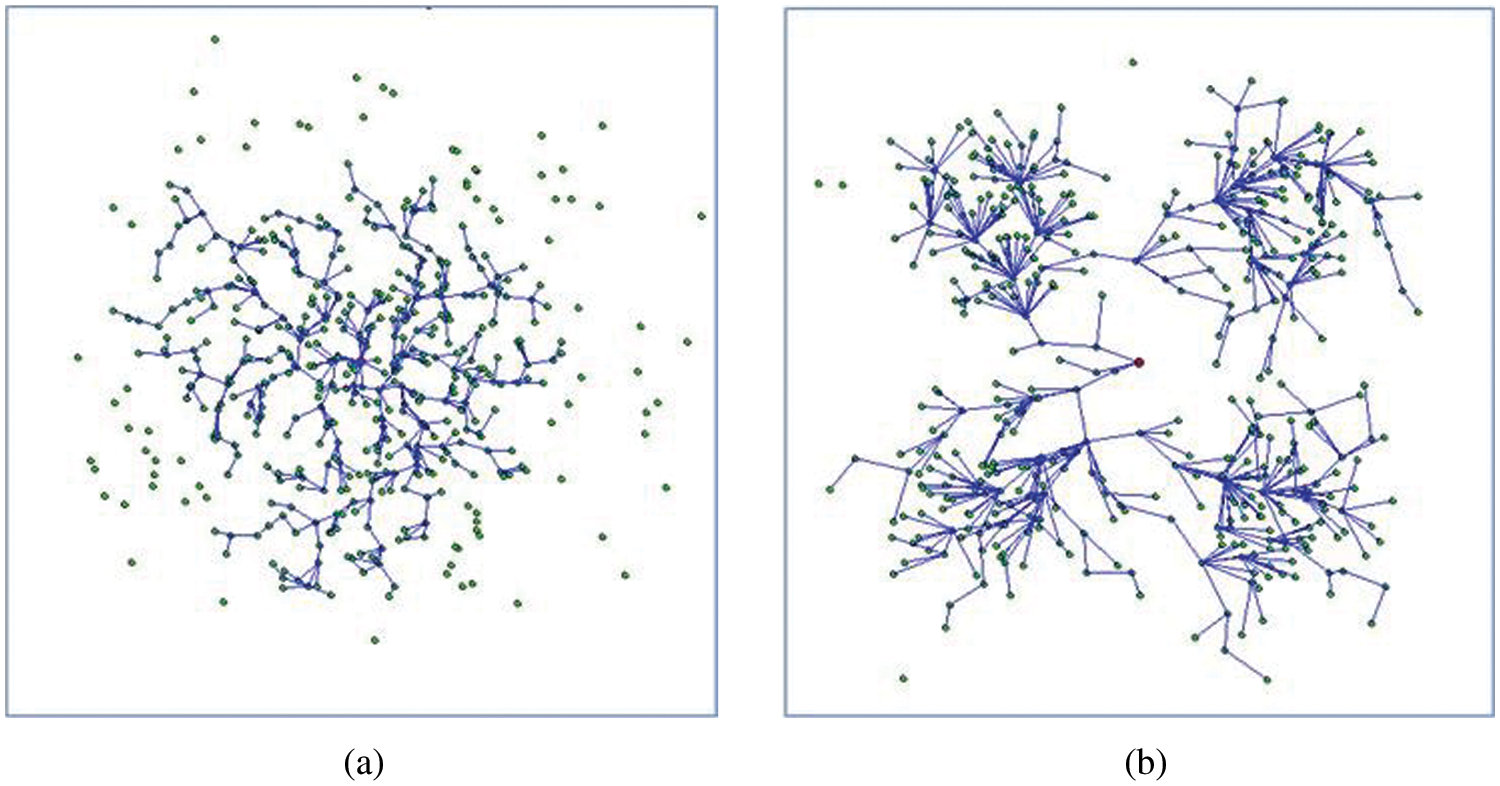
Figure 5: Two network structures with two different distributions
The FD is estimated using the developed route calculation method for both considered structures, and the results are presented in Fig. 6. Results indicate that the nature of the number dependencies of routes on the value of r is different. Moreover, the numerical values of the FD of the two network structures are different. For the first of network structure the value of FD is 2.4, while for the second is 4.7.
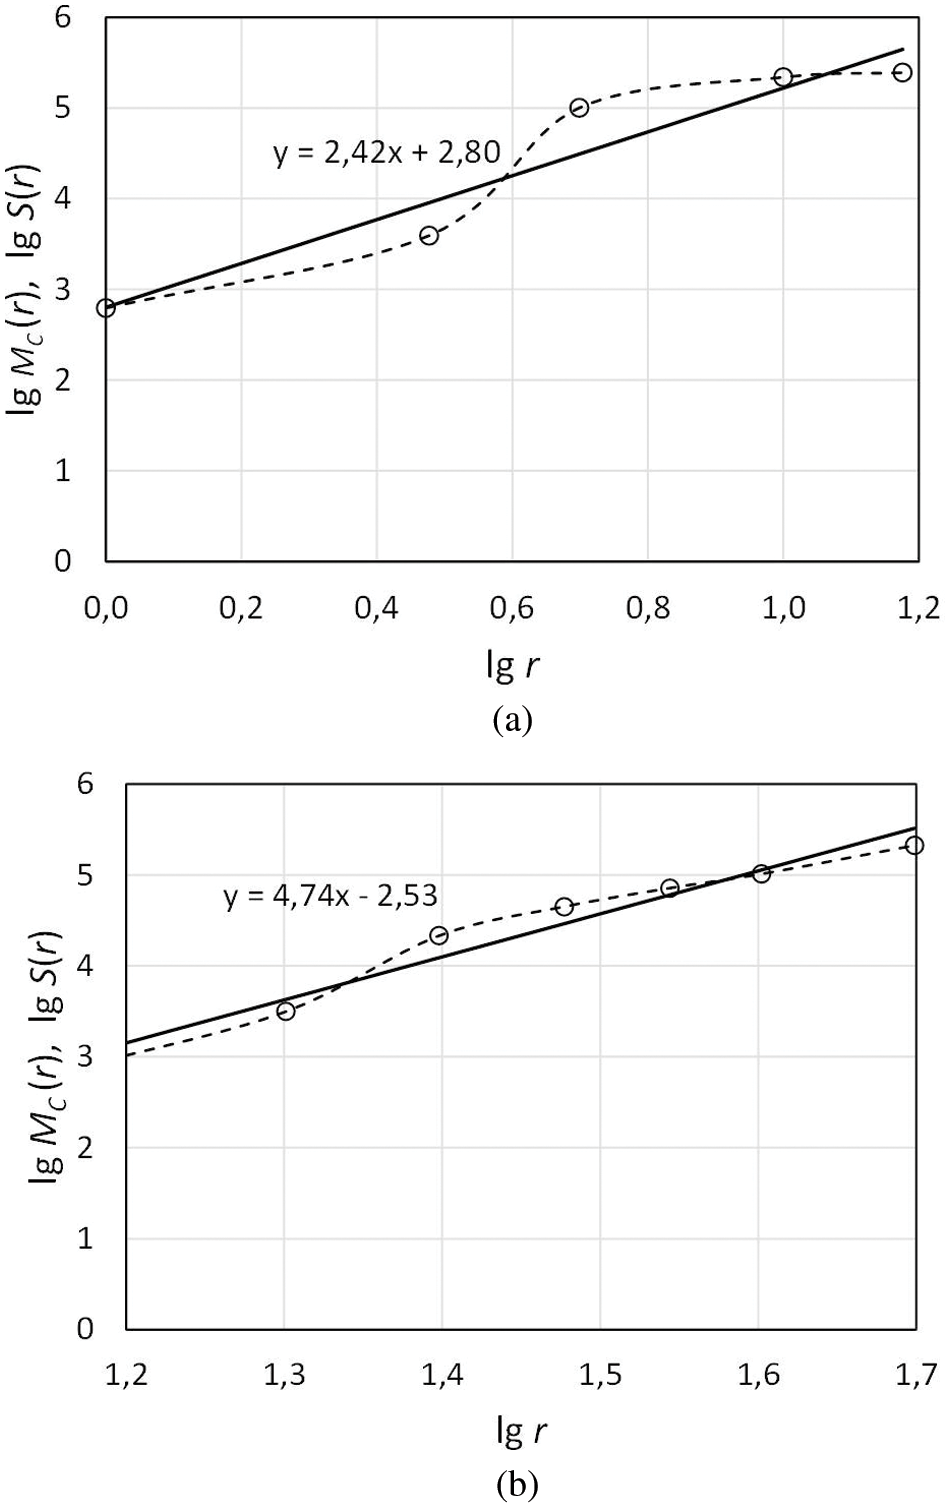
Figure 6: Estimation of FD for the two considered network structures
There are two limiting cases for analyzing the boundaries of the change of the FD network using the developed method. The first case is when the distances between network nodes are very small, i.e., the network is pulled to a point. Changing r, in such case, does not change the number of nodes in the cluster or the number of routes and thus achieves a zero-regression, i.e., linear regression coefficient is zero. This results in a zero FD. The second case is when all nodes of the network are located at equal distances from each other, i.e., nodes that form a flat grid with square cells. In this case, changing the number of nodes in the cluster, or the number of routes results in an instantaneous peak when r becomes equal to the distance between the nodes. This results in a maximum regression that achieves an infinite FD. These cases describe boundary states, the real value of the FD of the network lies between them, and depends on the distribution of the value of r.
FD is really a characteristic of the network that can be used independently or in addition to other characteristics. The main advantage of the developed route counting method is the stability of the results obtained, compared to the cluster growing method. However, it should be noted that the volume of calculations of this method is determined by the cube of the number of vertices, i.e., nodes of the network, N3, which is the number of operations performed by the Floyd algorithm. With a large number of network nodes, N, a significant amount of computing resources may be required. In such case, a limited selection of nodes should, probably, be used; however, this leads to a decrease in the stability of the results. Thus, the developed route counting method is advisable, when there is data on all/most of the network nodes. The use of the cluster growing method is advisable, when a selective analysis of the network is assumed without covering all nodes.
The concept of the FD network can be applied to communication networks to characterize the features of their structure. This parameter gives a numerical characteristic of the network structure, describing its properties in relation to a selected metric. This metric can be any parameter of the quality of network functioning indicators. Therefore, for communication networks, the FD parameter should be given in the context of the analyzed parameter of the quality of functioning. The numerical value of this parameter characterizes the degree of the invariance of the network structure to the scale determined by the value of the selected functioning parameter. The estimation of the FD of the network can be performed on the graph model of the network by the developed cluster growing method. With a relatively large number of network nodes, this method requires quite large computing resources. Also, the results obtained with a limited number of iterations are random and cannot always be used to compare the simulated structures. The article proposes a novel method for estimating the FD of a communication network, based on assessing the connectivity of the network by searching for the shortest routes. Unlike the cluster growing method, the proposed method does not require multiple iterations, which reduces the number of calculations, and increases the stability of the results obtained. The method is quite simple to implement and can be used in research and planning modern and promising communication networks.
Acknowledgement: The authors extend their appreciation to Princess Nourah bint Abdulrahman University Researchers Supporting Project number (PNURSP2022R66), Princess Nourah bint Abdulrahman University, Riyadh, Saudi Arabia.
Funding Statement: This work was supported by Princess Nourah bint Abdulrahman University Researchers Supporting Project number (PNURSP2022R66), Princess Nourah bint Abdulrahman University, Riyadh, Saudi Arabia.
Conflicts of Interest: The authors declare that they have no conflicts of interest to report regarding the present study.
References
1. T. Vermeulen, B. Reynders, F. E. Rosas, M. Verhelst and S. Pollin, “Performance analysis of in-band collision detection for dense wireless networks,” EURASIP Journal on Wireless Communications and Networking, vol. 1, no. 1, pp. 1–23, 2021. [Google Scholar]
2. E. Yaacoub and M. S. Alouini, “A key 6G challenge and opportunity—connecting the base of the pyramid: A survey on rural connectivity,” Proceedings of the IEEE, vol. 108, no. 4, pp. 533–582, 2020. [Google Scholar]
3. A. A. Ateya, A. Muthanna, M. Makolkina and A. Koucheryavy, “Study of 5G services standardization: Specifications and requirements,” in Proc. 2018 10th Int. Congress on Ultra Modern Telecommunications and Control Systems and Workshops (ICUMT), Moscow, Russia, IEEE, pp. 1–6, 2018. [Google Scholar]
4. M. Centenaro, C. E. Costa, F. Granelli, C. Sacchi and L. Vangelista, “A survey on technologies, standards and open challenges in satellite IoT,” IEEE Communications Surveys & Tutorials, vol. 23, no. 3, pp. 1693–1720, 2021. [Google Scholar]
5. S. Chen, Y. C. Liang, S. Sun, S. Kang, W. Cheng et al., “Vision, requirements, and technology trend of 6G: How to tackle the challenges of system coverage, capacity, user data-rate and movement speed,” IEEE Wireless Communications, vol. 27, no. 2, pp. 218–228, 2020. [Google Scholar]
6. M. W. Akhtar, S. A. Hassan, R. Ghaffar, H. Jung, S. Garg et al., “The shift to 6G communications: Vision and requirements,” Human-centric Computing and Information Sciences, vol. 10, no. 1, pp. 1–27, 2020. [Google Scholar]
7. H. Viswanathan and P. E. Mogensen, “Communications in the 6G era,” IEEE Access, vol. 8, pp. 57063–57074, 2020. [Google Scholar]
8. H. K. Ravuri, M. T. Vega, J. van der Hooft, T. Wauters and F. D. Turck, “A scalable hierarchically distributed architecture for next-generation applications,” Journal of Network and Systems Management, vol. 30, no. 1, pp. 1–32, 2020. [Google Scholar]
9. K. N. Qureshi, R. Hussain and G. Jeon, “A distributed software defined networking model to improve the scalability and quality of services for flexible green energy internet for smart grid systems,” Computers & Electrical Engineering, vol. 84, no. 3, pp. 106634, 2020. [Google Scholar]
10. M. Abiri, M. Mehrjoo and M. Rezaei, “Scalable video traffic offloading for streaming services in 5G HetNets,” Multimedia Tools and Applications, vol. 81, no. 9, pp. 1–23, 2021. [Google Scholar]
11. S. P. Khedkar, R. A. Canessane and M. L. Najafi, “Prediction of traffic generated by IoT devices using statistical learning time series algorithms,” Wireless Communications and Mobile Computing, vol. 2021, no. 5, pp. 12, 2021. [Google Scholar]
12. F. Xhafa, “Cloud services, storage and communications at large scale for reliable enterprise systems,” Enterprise Information Systems, vol. 15, no. 2, pp. 131–132, 2021. [Google Scholar]
13. A. A. Ateya, A. D. Algarni, M. Hamdi, A. Koucheryavy and N. Soliman, “Enabling heterogeneous IoT networks over 5G networks with ultra-dense deployment—using MEC/SDN,” Electronics, vol. 10, no. 8, pp. 910, 2021. [Google Scholar]
14. S. H. Haji, S. R. Zeebaree, R. H. Saeed, S. Y. Ameen, H. M. Shukur et al., “Comparison of software defined networking with traditional networking,” Asian Journal of Research in Computer Science, vol. 9, no. 2, pp. 1–18, 2021. [Google Scholar]
15. L. Baumann, “A model of weighted network formation,” Theoretical Economics, vol. 16, no. 1, pp. 1–23, 2021. [Google Scholar]
16. V. Kisel, R. Kirichek, A. Koucheryavy and A. Shestakov, “Evaluation of a mesh network based on LoRa technology,” in Proc. 2021 23rd Int. Conf. on Advanced Communication Technology (ICACT), PyeongChang, Korea (SouthIEEE, pp. 1–6, 2021. [Google Scholar]
17. R. Kirichek, V. Vishnevsky and A. Koucheryavy, “Analytic model of a mesh topology based on LoRa technology,” in Proc. 2020 22nd Int. Conf. on Advanced Communication Technology (ICACT), Phoenix Park, Korea (SouthIEEE, pp. 251–255, 2020. [Google Scholar]
18. N. Promwongsa, A. Ebrahimzadeh, D. Naboulsi, S. Kianpisheh, F. Belqasmi et al., “A comprehensive survey of the tactile internet: State-of-the-art and research directions,” IEEE Communications Surveys & Tutorials, vol. 23, no. 1, pp. 472–523, 2020. [Google Scholar]
19. H. Abuella, M. Elamassie, M. Uysal, Z. Xu, E. Serpedin et al., “Hybrid RF/VLC systems: A comprehensive survey on network topologies, performance analyses, applications, and future directions,” IEEE Access, vol. 9, pp. 160402–160436, 2021. [Google Scholar]
20. M. Simsek, O. Orhan, M. Nassar, O. Elibol and H. Nikopour, “IAB topology design: A graph embedding and deep reinforcement learning approach,” IEEE Communications Letters, vol. 25, no. 2, pp. 489–493, 2020. [Google Scholar]
21. T. Wen and K. H. Cheong, “The fractal dimension of complex networks: A review,” Information Fusion, vol. 73, no. 2, pp. 87–102, 2021. [Google Scholar]
22. W. Willinger, M. S. Taqqu and D. V. Wilson, “Lessons from on the self-similar nature of ethernet traffic,” ACM SIGCOMM Computer Communication Review, vol. 49, no. 5, pp. 56–62, 2019. [Google Scholar]
23. E. D. Poymanova and T. M. Tatarnikova, “Models and methods for studying network traffic,” in Proc. 2018 Wave Electronics and its Application in Information and Telecommunication Systems (WECONF), St. Petersburg, Russia, IEEE, pp. 1–5, 2018. [Google Scholar]
24. A. Paramonov, E. Tonkikh, A. Koucheryavy and T. M. Tatarnikova, “High density Internet of things network analysis,” in Proc. Internet of Things, Smart Spaces, and Next Generation Networks and Systems, Cham, Springer, pp. 307–316, 2020. [Google Scholar]
25. E. V. Slim, A. Paramonov and A. Koucheryavy, “Planning the network structure of the Internet of things with the use of fractals,” Telecommunications, vol. 4, pp. 55–62, 2021. [Google Scholar]
26. N. A. Chistova, A. Paramonov, A. Vybornov and A. Koucheryavy, “The method of selection of sizes digital cluster networks with delays ultramarine,” Telecommunications, vol. 4, pp. 43–48, 2021. [Google Scholar]
27. P. Skums and L. Bunimovich, “Graph fractal dimension and structure of fractal networks: A combinatorial perspective,” arXiv preprint, arXiv:1912.11385, 2019. [Google Scholar]
28. Z. Zhang and Y. Xiao, “Graph concatenations to derive weighted fractal networks,” Complexity, vol. 2020, pp. 9, 2020. [Google Scholar]
29. G. Palla, I. Derényi, I. Farkas and T. Vicsek, “Uncovering the overlapping community structure of complex networks in nature and society,” Nature, vol. 435, no. 7043, pp. 814–818, 2005. [Google Scholar]
30. A. Paramonov, M. Khayyat, N. Chistova, A. Muthanna, I. A. Elgendy et al., “An efficient method for choosing digital cluster size in ultralow latency networks,” Wireless Communications and Mobile Computing, vol. 2021, pp. 9, 2021. [Google Scholar]
31. M. E. Zhukovskii and A. M. Raigorodskii, “Random graphs: Models and asymptotic characteristics,” Russian Mathematical Surveys, vol. 70, no. 1, pp. 33–81, 2015. [Google Scholar]
32. I. N. Beckman, D.А. Syrtsova, M. G. Shalygin, P. Kandasamy and V. V. Teplyakov, “Transmembrane gas transfer: Mathematics of diffusion and experimental practice,” Journal of Membrane Science, vol. 601, no. 6, pp. 117737, 2020. [Google Scholar]
33. N. Rawat, “An algorithmic approach to graph theory,” in Proc. Int. Conf. on Advances in Engineering & Technology, Goa, India, 2014. [Google Scholar]
Cite This Article
 Copyright © 2023 The Author(s). Published by Tech Science Press.
This work is licensed under a Creative Commons Attribution 4.0 International License , which permits unrestricted use, distribution, and reproduction in any medium, provided the original work is properly cited.
 Downloads
 Citation Tools