
 Submit a Paper
 Propose a Special lssue
 Open Access
ARTICLE
Anomaly Detection in Social Media Texts Using Optimal Convolutional Neural Network
1 Department of Computer Science and Engineering, Ramco Institute of Technology, Rajapalayam, 626117, India
2 Department of Electronics and Communication Engineering, P. S. R. Engineering College, Sivakasi, 626140, India
* Corresponding Author: Valarmathi Krishnasamy. Email:
Intelligent Automation & Soft Computing 2023, 36(1), 1027-1042. https://doi.org/10.32604/iasc.2023.031165
Received 11 April 2022; Accepted 05 July 2022; Issue published 29 September 2022
 View Full Text
 Download PDF
Abstract
Social Networking Sites (SNSs) are nowadays utilized by the whole world to share ideas, images, and valuable contents by means of a post to reach a group of users. The use of SNS often inflicts the physical and the mental health of the people. Nowadays, researchers often focus on identifying the illegal behaviors in the SNS to reduce its negative influence. The state-of-art Natural Language processing techniques for anomaly detection have utilized a wide annotated corpus to identify the anomalies and they are often time-consuming as well as certainly do not guarantee maximum accuracy. To overcome these issues, the proposed methodology utilizes a Modified Convolutional Neural Network (MCNN) using stochastic pooling and a Leaky Rectified Linear Unit (LReLU). Here, each word in the social media text is analyzed based on its meaning. The stochastic pooling accurately detects the anomalous social media posts and reduces the chance of overfitting. The LReLU overcomes the high computational cost and gradient vanishing problem associated with other activation functions. It also doesn’t stop the learning process when the values are negative. The MCNN computes a specified score value using a novel integrated anomaly detection technique. Based on the score value, the anomalies are identified. A Teaching Learning based Optimization (TLBO) algorithm has been used to optimize the feature extraction phase of the modified CNN and fast convergence is offered. In this way, the performance of the model is enhanced in terms of classification accuracy. The efficiency of the proposed technique is compared with the state-of-art techniques in terms of accuracy, sensitivity, specificity, recall, and precision. The proposed MCNN-TLBO technique has provided an overall architecture of 97.85%, 95.45%, and 97.55% for the three social media datasets namely Facebook, Twitter, and Reddit respectively.Keywords
The emerging trend of online social media has become the center of research nowadays. The analysis of the usage of online activities as well as the detection of abnormal activities fetches the attention of different researchers. Although social media offer different fruitful activities like communication, sharing worthwhile feeds, and collaboration, they also involve some unnecessary and intimidating illegal activities like online bullying, terrorist attack planning, and fraud information dissemination, etc., [1]. Hence, the prior prediction of abnormal activities is promptly important to ignore several attacks. However, the social media data are available ingress and it is a challenging task to extract the most necessary data required for the detection task. Social media networks comprise different social networking sites like video sharing sites, micro-blogging sites, Facebook, Twitter, Instagram, etc., Since the usage of social media networks has been growing exponentially, security issues and vulnerability activities like revealing sensitive information, provenance, and trust issues lead to spam and deception.
Anomaly detection is exploited to detect anomalous behaviors in social media for the prior prediction. This may also help to detect the prior identification of disease outbreaks and natural disasters thus provide extra time to take action. It also plays a major role in information security, particularly in technically challenging platforms like multimedia or online social networks (OSNs). Usually, anomaly detection provides information about different users [2,3]. Moreover, the anomaly is classified into two types; point anomaly and group anomaly. The point anomaly provides information about the abnormal behaviors of individual users and group anomaly is utilized to reveal the information about a group of users working together to accomplish the illegal activities. Anomaly detection is also classified based on the input utilized, which includes sequential data, unstructured texts, and graphs. The graph-based anomaly detection is exploited nowadays to explore the hidden graph data, suspicious nodes, etc., [4].
In social networks, an anomaly is the one in which a certain individual or a group of people makes certain changes in the way of interacting with their mutual friends and it will hurt others or an organization. To detect these types of behavior in the social network profile, the text in the post needs to be analyzed and from that, the anomalies can be classified. The interest in anomaly detection is decreasing because it is often too complex to detect the characteristics/behavior of the text, which is different from the normal post. If the text data follow specific guidelines, they are considered normal or else they are considered abnormal [5]. The abnormal emotion in the text is known as an anomaly. Hence, each word in the social media post is identified in this manner. The traditional techniques such as similarity measures, time-series data, statistical models, often need a large amount of annotated corpus which is often impossible to find. To overcome this model, a modified Convolutional Neural Network (CNN) with Teaching Learning-based Optimization (TLBO) (MCNN-TLBO) algorithm which can extract the accurate features from the social media text has been proposed. The main contributions of this paper are presented below:
• The MCNN computes the score of each social network post from the test set. The values above the score of 0.5 indicate an anomalous behavior and the values below this score indicate the normal behavior of a user.
• The anomalies are identified from the social media posts collected from Facebook, Twitter, and Reddit by analyzing the number of neutral emotions, happiness, share, angry reactions, etc.
• The TLBO algorithm increases the speed of the MCNN in training and feature extraction. The algorithm is quite simple and doesn’t involve complex operations used in the state-of-art meta-heuristic algorithm.
• The efficiency of the proposed model is proved by comparing it with other techniques in terms of sensitivity, specificity, precision, accuracy, etc.
The rest of this paper has been organized as follows. Section 3 examines the works of several authors in the subject of anomaly detection, as well as the various approaches employed, such as the fundamentals of CNN architecture. It also presents different methodologies used such as the basics of the CNN architecture, TLBO algorithm, Modified CNN architecture, and the novel integration design strategy. Section 4 presents the experiments conducted using the proposed methodology along with its comparison with different state-of-art techniques. Section 5 concludes the paper.
Hettiarachchi et al. [6] have proposed Embed2Detect for an automatic identification of event and anomaly detection in social media. Higher data production volume in data is streamed by considering the dynamic nature. In order to utilize the social media data, it is essential to involve some computerized methods. The semantical features in the text are incorporated with the help of prediction-oriented word embedding. The proof of significant improvements is obtained with efficient and effective event detection results. More time is consumed during anomaly detection in social medial networks. The users, who have anomalous relationships with other users, are identified by graph metrics which have been proposed by Hassanzadeh et al. [7]. Further, the graph metrics have validated community cohesiveness, betweenness centrality, neighboring edges, and nodes number. Online social networks provide real-world data for experimental analysis. When compared to other approaches, the graph metrics have demonstrated better detection accuracy with a higher computational cost.
According to online social networks, Kokatnoor et al. [8] have introduced a self-supervised learning model. Neutral, negative, and positive are the different classes of opinions posted and in which, the anomalous is the lighter group’s opinions. Because of inherent ambiguity in the tweeted data, many clustering and conventional classification methods are suggested under an unsupervised and supervised environment. For the training data, the class labels are assigned by means of Supervised Learning thereby, various behavioral anomalies are detected. Hence, the supervised model takes higher labeling time with poor enhancement in labeling the textual dataset. For separate learning modules, a unified model of image and text combined to reduce the need has been proposed by Kumari et al. [9]. The unified model has utilized a single-layer Convolutional Neural Network model. The information is effectively encoded to represent the text. The two-dimensional models with better anomaly results are accomplished by single-layer Convolutional Neural Network [10,11] One layer of Convolutional Neural Network with 74% recall of the bullying class is provided by utilizing three text layers.
The CNN-based long short-term memory has been proposed by Sun et al. [12] to detect the anomalies in social networks. For information retrieval, the big data platform has been provided with the help of social media platforms including Twitter or Sino Weibo. The power-law distribution and multivariate Gaussian model has been adopted based on the single post sentiment in Weibo. The correlation among various feature emotions is captured via the Gaussian method and the batch calculation with few numbers of time is saved. The multi-stage anomaly detection has been proposed by Garg et al. [13] for anomaly detection in social media networks. From the databases, the relevant features are extracted with the help of Boruta algorithm. The partitioning is performed via Davies–Bouldin Index based K-medoid with firefly algorithm. The nearest neighbor search problem is solved by traditional DBSCAN in a kernel-based locality sensitive hashing. The desired sets of parameters are determined by using the resulting set of the nearest neighbors [14].
The proposed method has exploited an optimal CNN-based TLBO algorithm for anomaly detection of social media networks. Different techniques utilized for anomaly detection are presented in this section.
It is the starting stage of the proposed method and it is used to format the raw data. Min-Max normalization [15] is used to normalize the input values and reduce the training time. The values are finally changed to a range of 0 to 1. The normalization result is represented as Nnormz. The initial value before normalization is taken as N. The values Nmax and Nmin indicate both the minimum and maximum values used for each feature.
The feature extraction and selection process have been carried out by an MCNN-TLBO algorithm presented below.
In anomaly detection, the extraction of suspicious features from the social media text is considered as an important step. When a social media post has a lot of suspicious or defaming words, then the anomaly can be identified more accurately from the textual features extracted. In some posts, there may be a low number of words that represent an anomalous behavior possessed by the user, but in reality, it is not. These problems mainly reduce the accuracy of the system when the features are manually extracted. Hence, this proposed model utilizes deep learning for abstract and automatic feature extraction layer by layer which extracts the crucial features that determine the anomaly and accurately identifies the anomalies present in the text [16–18]. The features are extracted via the CNN by a sequence of convolutional layers, pooling layer, and fully connected layers [19]. The crucial components of the CNN are the convolutional and pooling layers. Usually, a backpropagation algorithm [20] is used to train the CNN network.
In the convolutional layer, the upper feature maps are convolved by a convolutional kernel and an output using an activation function. To extract the maximum number of features from the input feature map, the convolutional layer uses more than one convolutional kernel to form a plural output feature map. Each feature map has a size of (I − s + 1) × (I − s + 1), Here, s is the convolutional kernel size, and I is the input feature map size. The computations held in the convolutional layer proceeds as follows.
Here, the ith output feature of the nth layer is represented as
Here, Fj is the set of input feature maps used. The enhanced capabilities of the CNN by means of the pooling operation, convolutional operation, and backpropagation algorithm ease the anomaly detection process.
3.3 Modified CNN Architecture with Stochastic Pooling and LReLU
Even though the conventional CNN offers major benefits, improvements are needed in terms of pooling and activation functions. The max-pooling mainly selects the fittest feature instead of selecting the features which are less strong but considered useful. In this way, the max-pooling eliminates the critical features whereas the average-pooling computes the equality of every feature and hence, it fails to extract the crucial information. Adding both the max-pooling and the average pooling increases the chance of over-fitting and to overcome this problem, stochastic pooling has been introduced. Based on the contribution of each instance, the attribute is sampled. The modified CNN architecture utilizing both LReLU and stochastic pooling is presented in Fig. 1. CNN has lot of benefits, but the pooling and activation methods may be improved. Max-pooling removes the important characteristics. Although the average-pooling computes the equality of all features, it fails to extract the critical information. Using both the max-pooling and the average pooling increases the risk of overfitting and hence, the stochastic pooling is used to solve the problem. In the proposed method, a CNN-based stochastic pooling [21] has been employed for anomaly detection of social media data. The stochastic pooling more accurately detects and samples every information from the users based on its usage. The sampling probability can be determined as below,
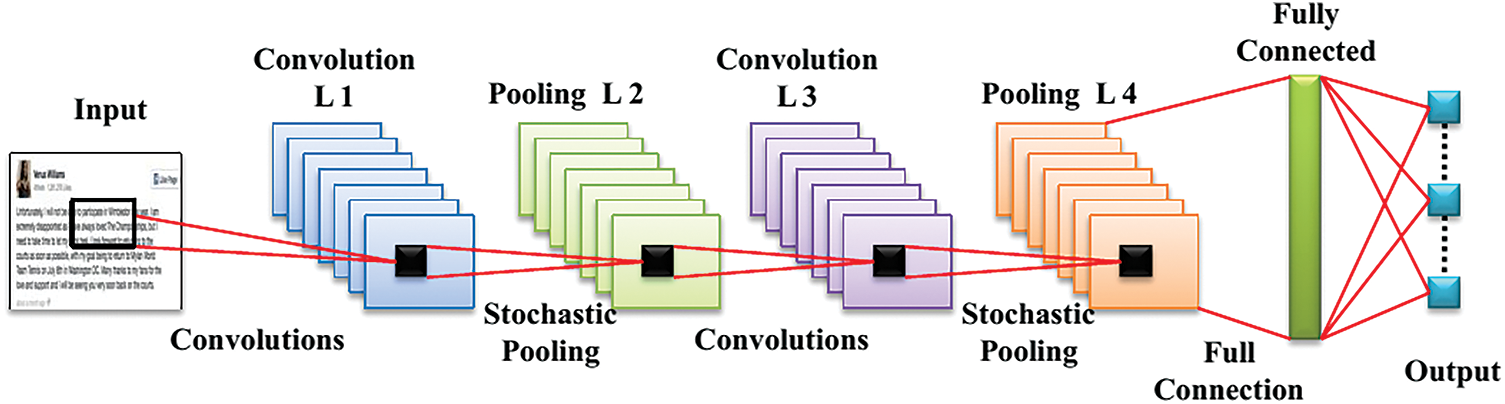
Figure 1: Modified CNN architecture with LReLU and stochastic pooling
For element
In contrast to equations from (3) to (5), the stochastic pooling covers every crucial information and also pays attention to the fittest feature of all time. This work omits the activation functions such as sigmoid and Tanh, due to its high computational cost and gradient vanishing problem. These two drawbacks are overcome by using a Leaky ReLU which even operates if the input values are negative by means of setting a minimal gradient. The continuous learning of the neural network is preceded as follows:
The modified CNN with respect to stochastic pooling and LReLU is similar to the basic functioning of CNN. A stochastic Gradient Descent algorithm is added to enhance the learning performance of CNN with the help of updatable momentum values as shown in the equation below:
Here.
The target model can be initialized by using the learned parameters of the pre-trained source model. The training samples are used to initially train the source CNN. The target CNN utilizes the same architecture as the source CNN with its corresponding neurons, layers, learning rate, momentum, and activation functions. The weights and biases which are already trained are passed from the source CNN to the target CNN. To adjust the parameters even further, the target CNN is fine-tuned while using a small amount of target training samples. The CNN architecture constructed utilizing transfer learning is presented in Fig. 2. The variables CL1, CL3, PL2, and PL4 used in Fig. 2. represent the convolutional layer 1, convolutional layer 3, pooling layer 2, and pooling layer 3, respectively.
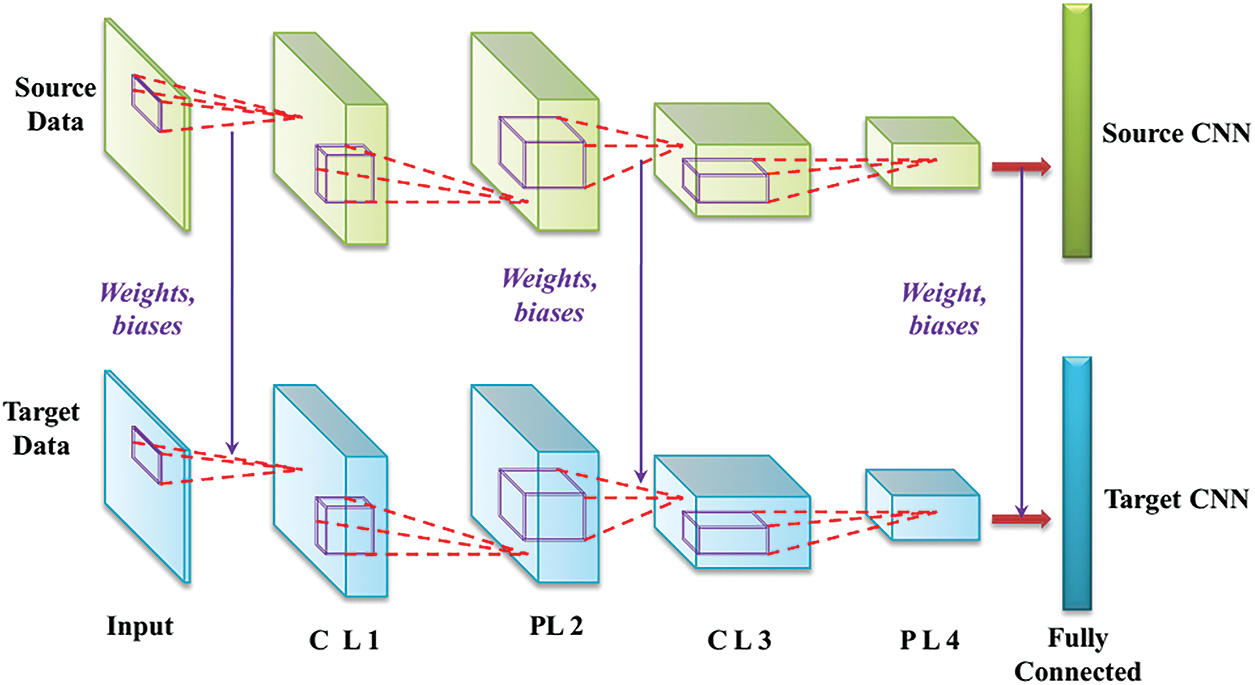
Figure 2: CNN model construction using transfer learning
3.5 Design of Novel Output Integration Technique
After each input sample is successively analyzed using the constructed CNN model, different transfer anomaly results are obtained when testing the samples in the target domain. To utilize each individual result fully to yield an accurate outcome, the novel output integration technique is developed and the score computed is used to detect the anomaly in the text. This technique is mainly formed by integrating the majority voting technique with the weight assessment. The designing process is implemented as shown below.
Step-1: The jth testing sample obtained from the target domain is represented as
Step-2: For each individual anomaly detection result, assign its approximate weight as follows:
Here, the value
Here,
Here,
Step 3: The computational formulas for the integrated anomaly detection accuracies are depicted as shown below:
The optimal structure of the modified CNN is found by the TLBO algorithm to enhance the prediction accuracy of the anomaly detection even further by taking less training time.
3.6 Teaching Learning Based Optimization Algorithm
The TLBO algorithm [22,23] replicates the environment of a classroom for the optimization task. This evolutionary algorithm is uncomplicated and tough, and offers strong convergence. TLBO has various advantages, including its fundamental notion, the lack of algorithm-specific parameters, rapid convergence, and ease of implementation while being effective. During the training phase, each individual’s search space will be changed from the original search space to an area around the origin by reducing the algorithm’s global optimization potential. During the learning phase, each individual’s search space will change from the initial search space to a region near the origin by diminishing the algorithm’s global optimization ability. As a result, the fundamental TLBO algorithm has a substantial impact on solving optimization problems where the ideal value point is at the origin and the global optimum may be found with a small number of iterations. Simplicity is mainly offered by this algorithm by eliminating the tuning parameters often used by other algorithms such as Genetic Algorithm (mutation and crossover) [24], Particle Swarm Optimization (PSO) (acceleration constants) [25], etc. This algorithm consists of two phases namely the Teaching phase and the learning phase. The working of the TLBO algorithm is illustrated in Fig. 3. The population size (N) is taken as the total number of pupils present in the classroom (R). For a selected population in a generation, the fitness value is computed based on the overall marks secured by the student in every subject.
i) Teacher phase: Here, the efficiency of the pupils is enhanced with the help of a teacher.
ii) Learner Phase: The pupils collaborate among themselves to enhance their effectiveness.
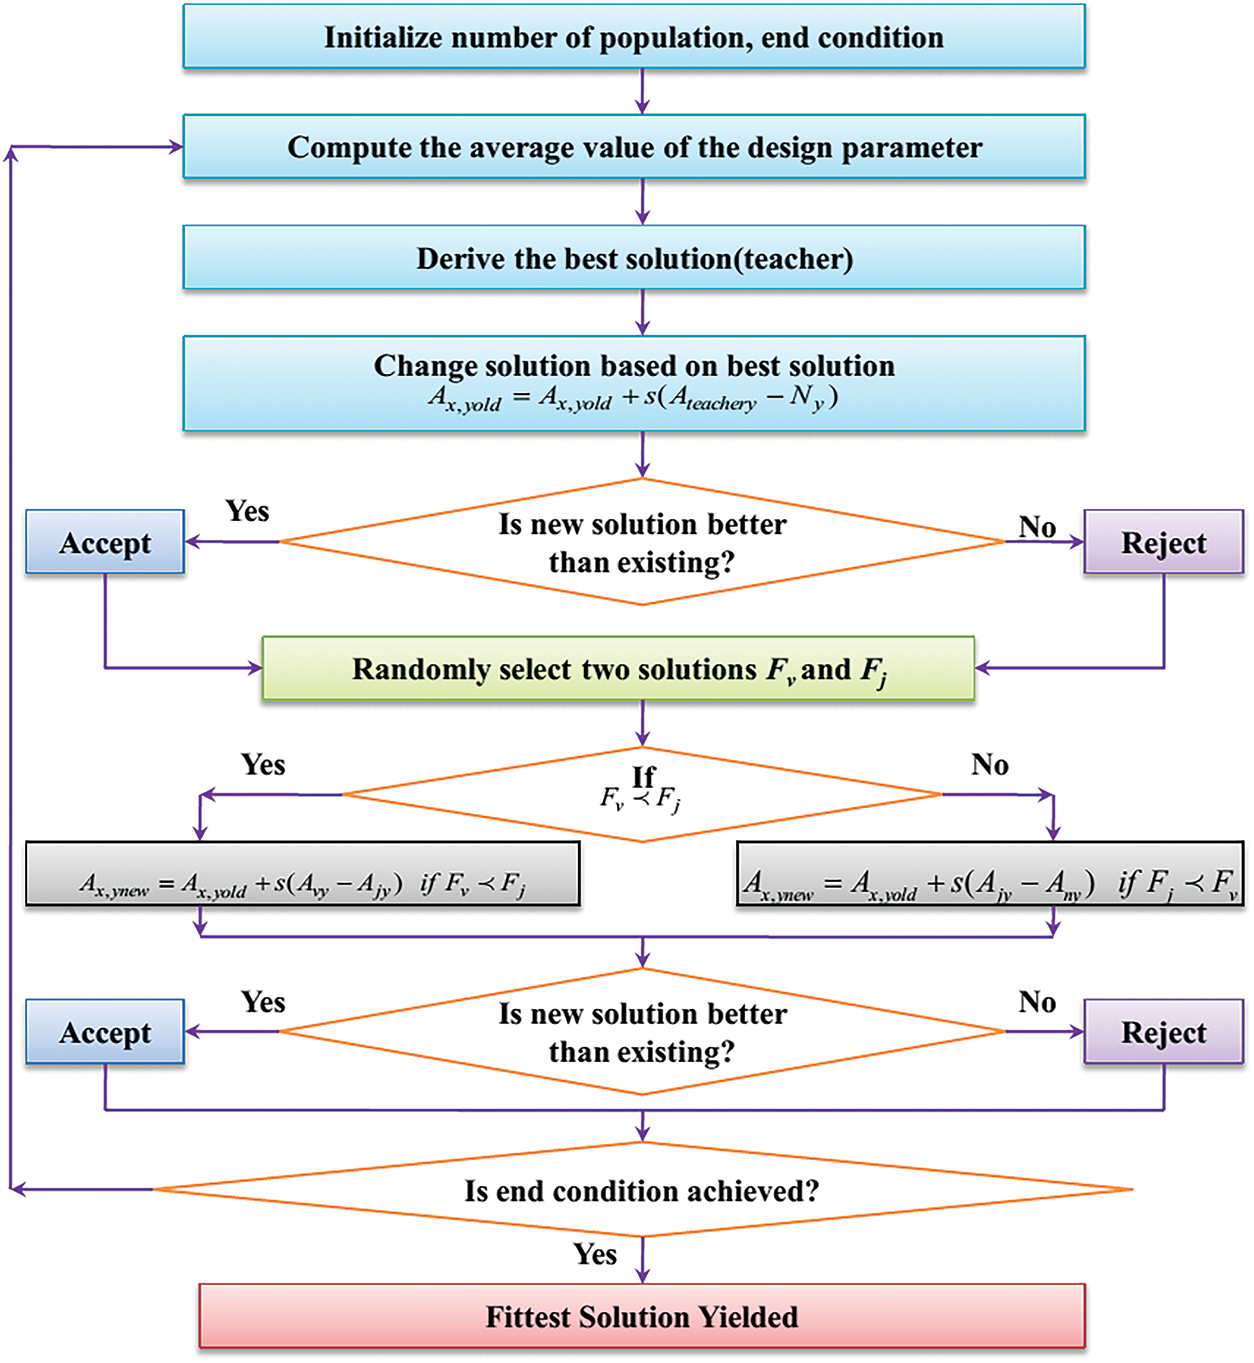
Figure 3: Working of the TLBO algorithm
Teacher Phase
The overall population’s performance is increased with the help of the teacher. Let s be a random number whose value falls between 0 and 1. Initially, the mean value Ny is computed for each instance. The mean of the design parameters is the mean value computed. In the next step, the old values (
This step is iterated for the whole population. After the fitness values of the design parameters are updated, the fitness value of the population is compared with its old fitness value. From this, the best fitness value along with its associated design parameters is retrieved. After this phase, the teacher phase is terminated.
• Learner Phase
Here, the performance of the students is improved by communicating among themselves. After the convergence of the teacher phase, two randomly generated populations (v,j) are chosen and their fitness values are represented as Fv and Fj. After the fitness variables are assigned, the design parameters are altered as shown below.
These equations are iterated for the whole population. The updated design parameter values are now utilized to calculate the new fitness value. Now, the fitness values obtained from the learner phase are contrasted with the fitness values gained from the teaching phase. From this, the best solutions obtained from both the phases are chosen and it is set as the best solution obtained in the present iteration. This phase is iterated until the termination condition is achieved. The overall architecture of the proposed approach is presented in Fig. 4.
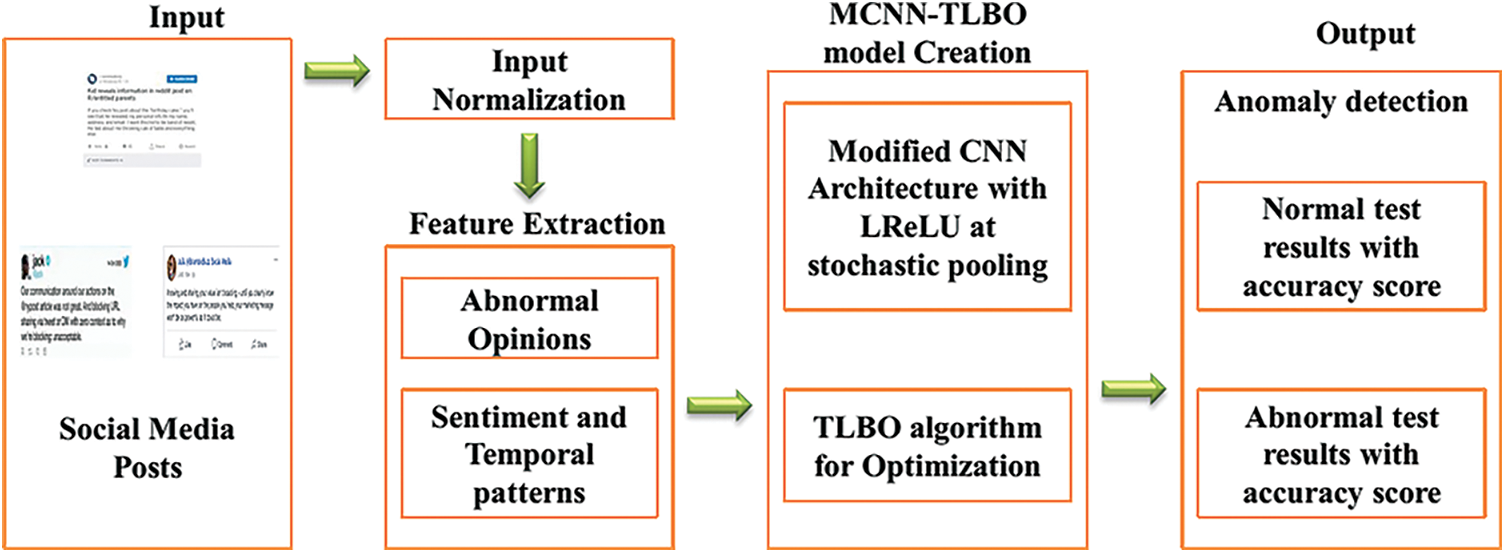
Figure 4: Overall architecture of the proposed methodology
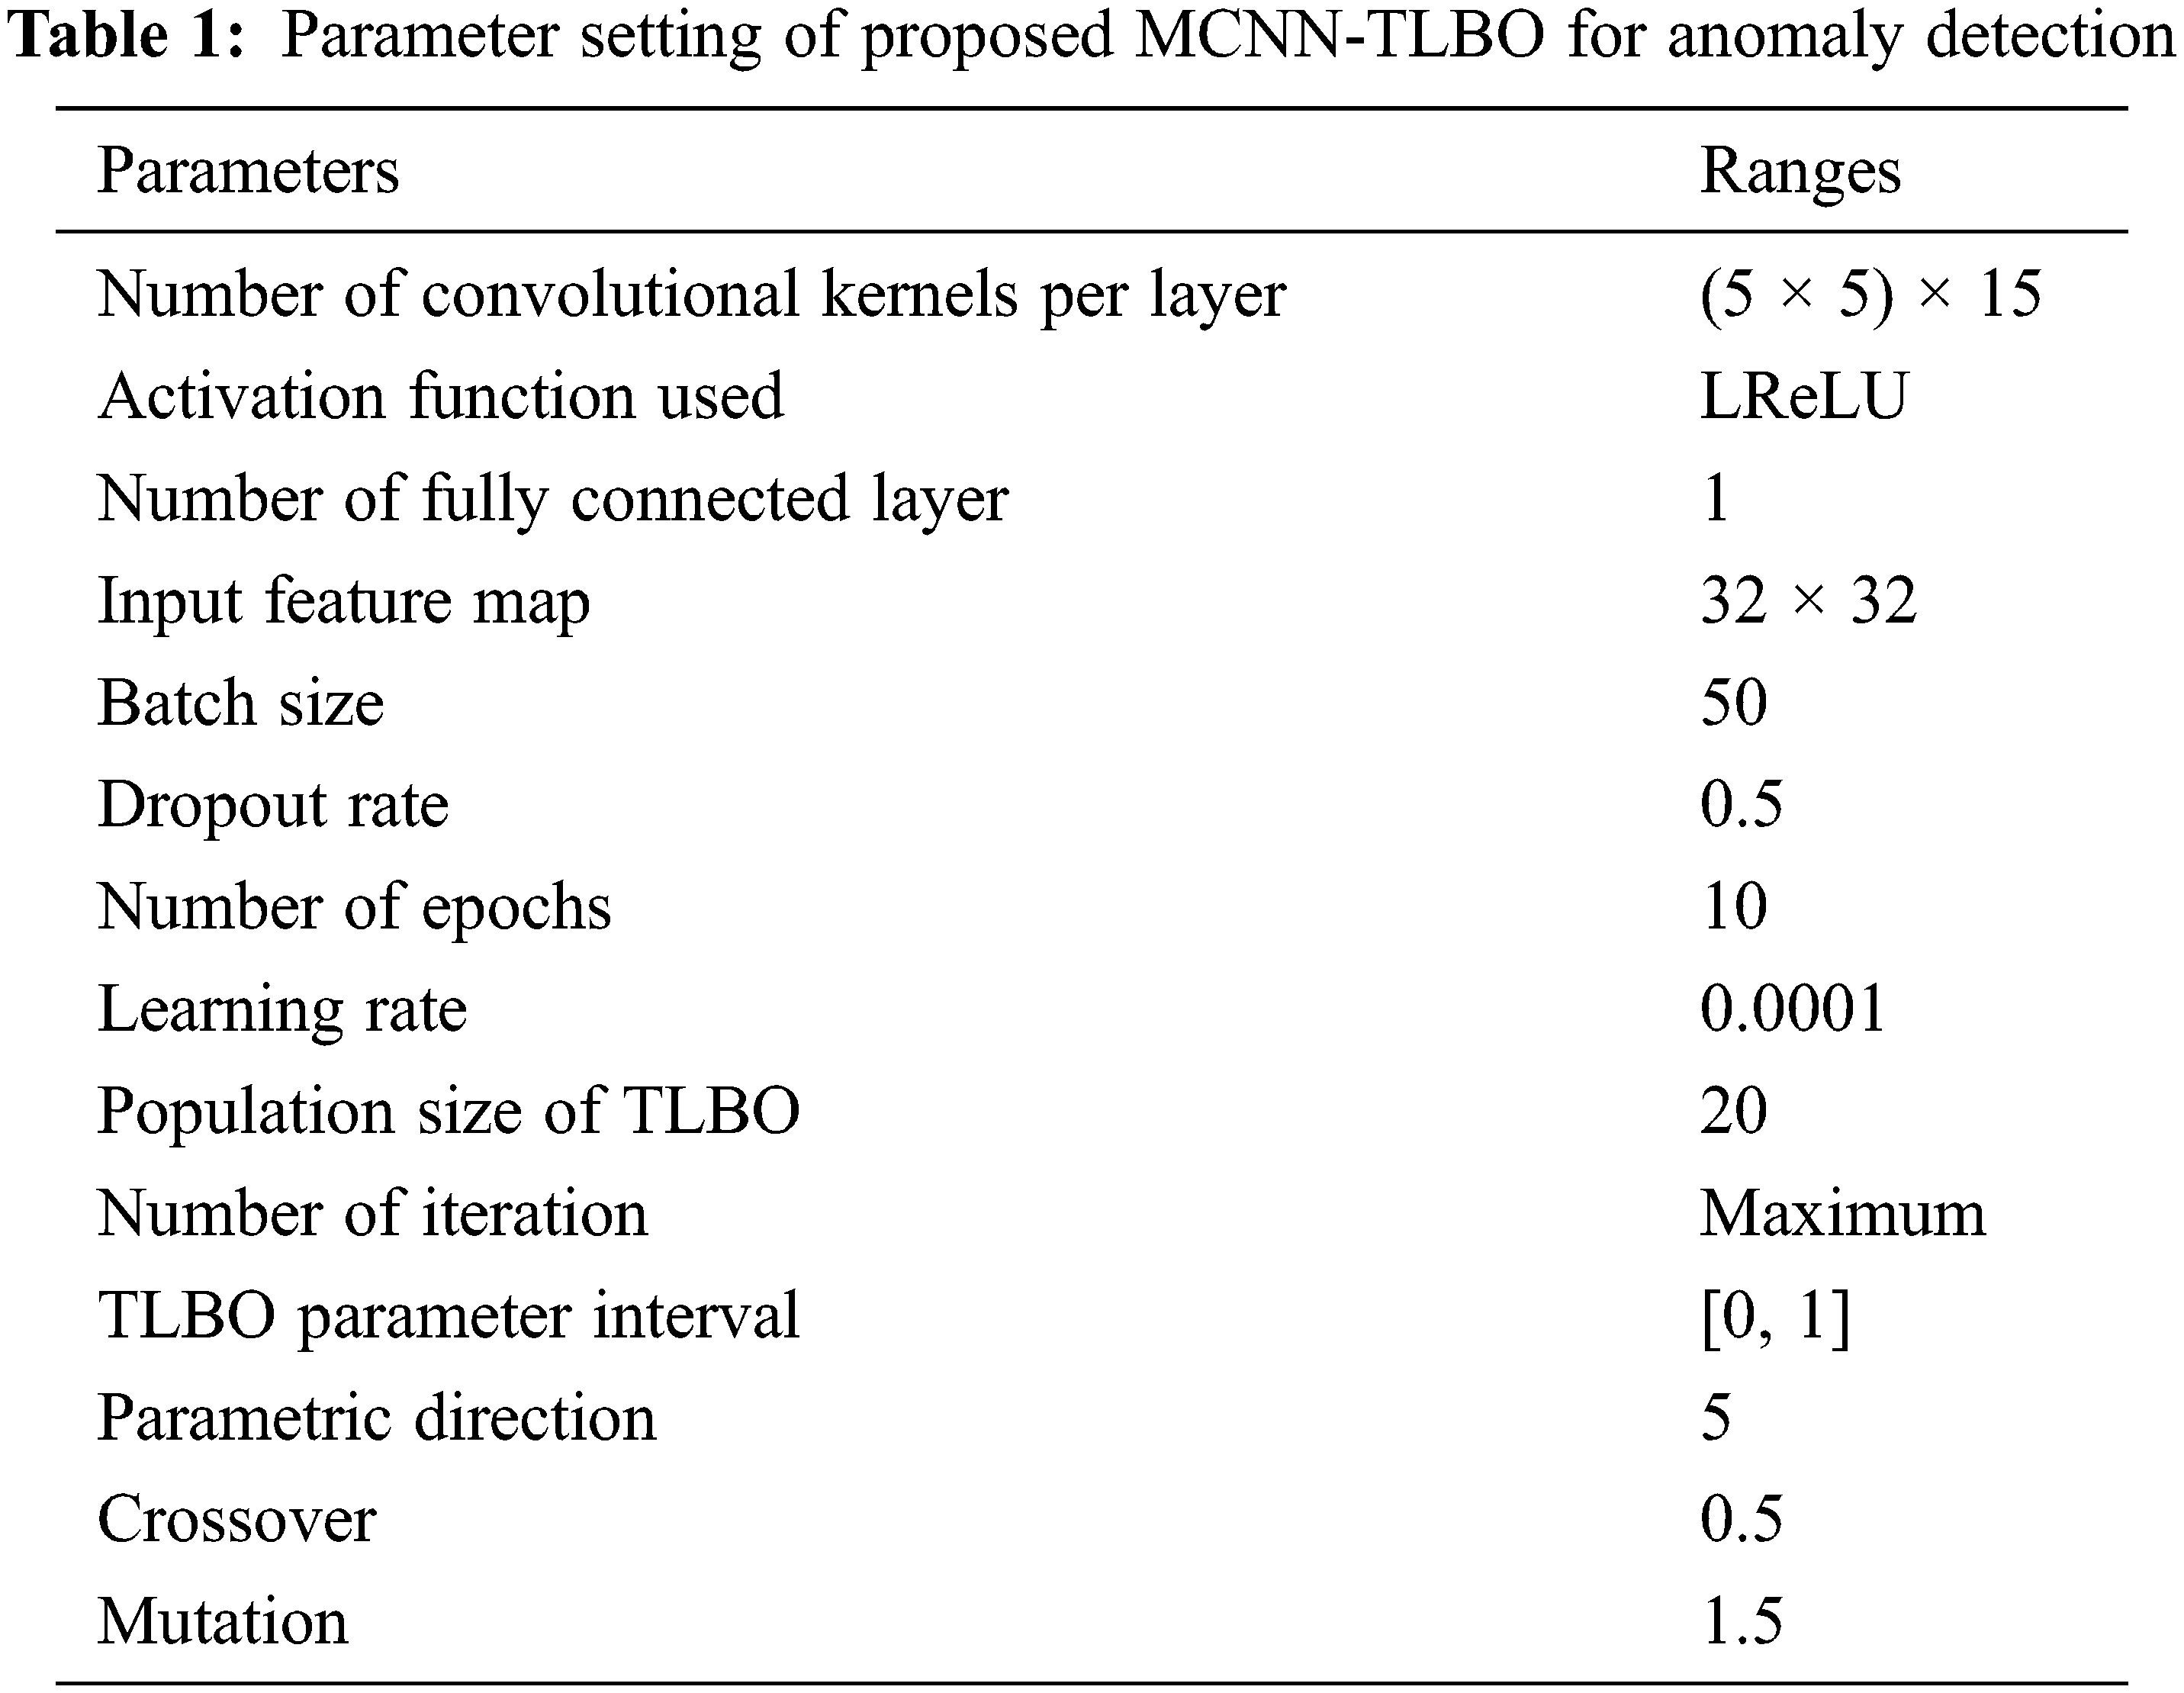
In this section, the modified CNN with TLBO optimization (MCNN-TLBO) algorithm for anomaly detection in social media network performance is validated. The experimental analysis is evaluated in Matlab R2016a software running in Intel i7-7500U CPU @2.70GHz by 8 GB of RAM. The state-of-art comparisons with various experimental analyses are carried out to estimate the performance of MCNN-TLBO [26]. Parameter settings of the proposed MCNN-TLBO method are as shown in Tab. 1.
The experimental data like Reddit, Twitter, and Facebook datasets have been obtained from reported articles [27,28] which are explained in the below section.
The publicly available data from Facebook are extracted via Facebook scraper script. The script extracts different features such as comments per post, replays per comment, the total number of reactions and likes, post messages, etc. The Facebook API returns the post via the “get” request. The extracted data are first in a JSON format and then converted to a CSV file (tabular format) after parsing
Five kinds of classes are obtained with randomly selected 11742 tweets out of 200 users according to the Client, Tweet posted time, Tweet type, user name, and Tweet URL. There are 10 basics including time, epochs, frame number, arrival time, and so on with 35 attributes present in this dataset.
An average length of 270 words with a total of 3,47778,54 posts is involved, thereby 28 words are present in the Reddit dataset. Here, the subreddit_id, normalized body, body, author, content, and summary are the extracted features [24].
The detection performance of the proposed MCNN-TLBO is validated by evaluating different evaluation measures such as accuracy, specificity, sensitivity, precision, and recall [29].
where, true positive and negative anomalies are
The performance of the proposed TLBO with respect to population size Vs availability is depicted in Fig. 5. In this experiment, the population sizes of TLBO algorithm 10, 20, 30, 40, 50, 60, 70, 80, 90 and 100 with the availability rate of 0.6 to 1 are taken. The availability result values of 0.83, 0.77, 0.76, 0.66, 0.74, 0.75, 0.88, 0.89, 0.79 and 0.85 are obtained according to the population sizes such as 10, 20, 30, 40, 50, 60, 70, 80, 90 and 100, respectively. From the results, it is clear that the proposed TLBO algorithm accomplishes better availability in terms of varying population sizes.
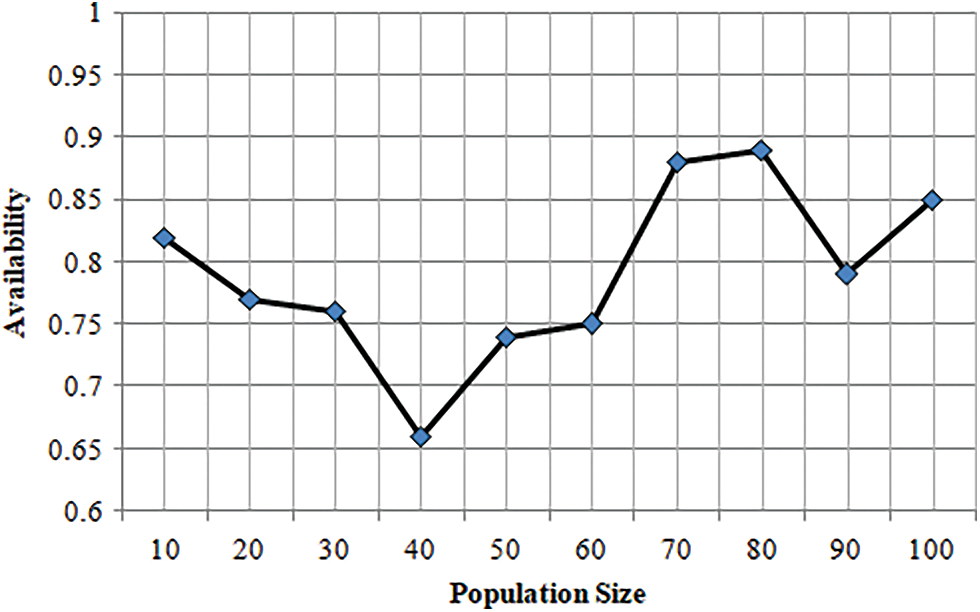
Figure 5: Proposed TLBO performance with respect to population size vs. availability
The proposed model with respect to performance measures is outlined in Fig. 6. In this experiment, five measures including accuracy, specificity, sensitivity, precision and recall are taken for three sorts of databases such as Reddit, Facebook and Twitter datasets. The execution esteem can be changed according to the datasets and performance measures. Moreover, the Reddit accomplishes accuracy as 98.13%, Sensitivity as 100%, Specificity as 96.32%, precision achieves 84.45%, and recall as 81.74%. Similarly, the proposed approach yields better results in case of other two datasets.
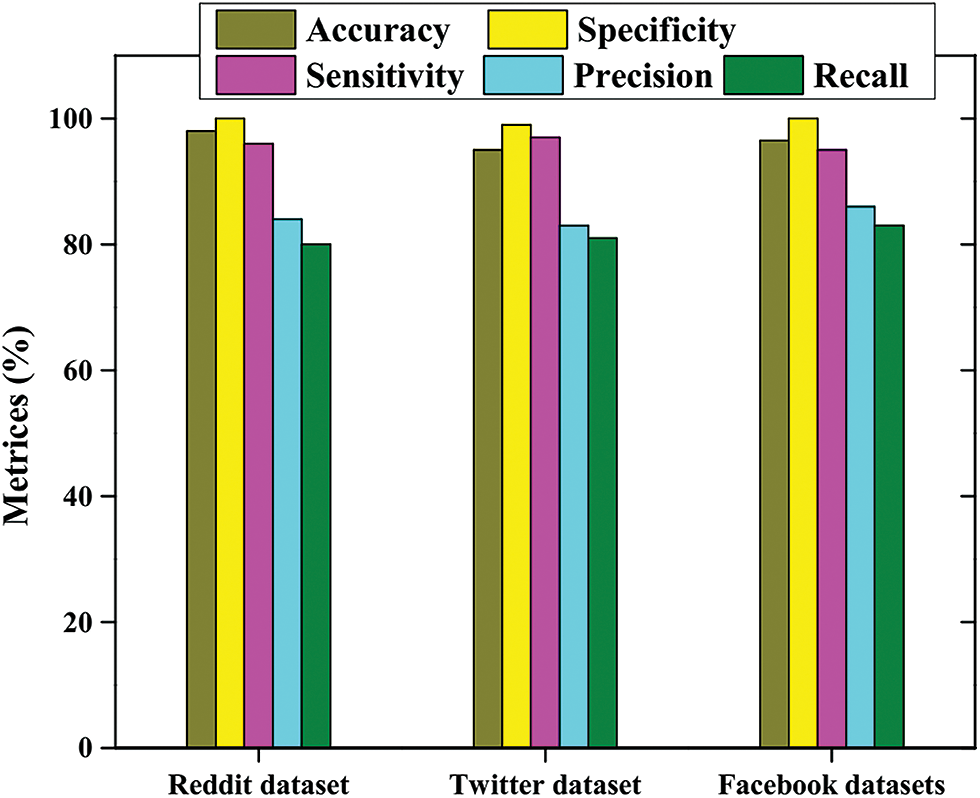
Figure 6: Performance metrics with respect to the proposed model
Tab. 2 explains the MCNN-TLBO performance with respect to accuracy. Here, various methods such as teaching learning-based optimization (TLBO), convolutional neural network (CNN), and modified convolutional neural network (MCNN) have been used to compare with the proposed MCNN-TLBO. Comparing to all other methods, the proposed MCNN-TLBO provides higher detection accuracy rates.
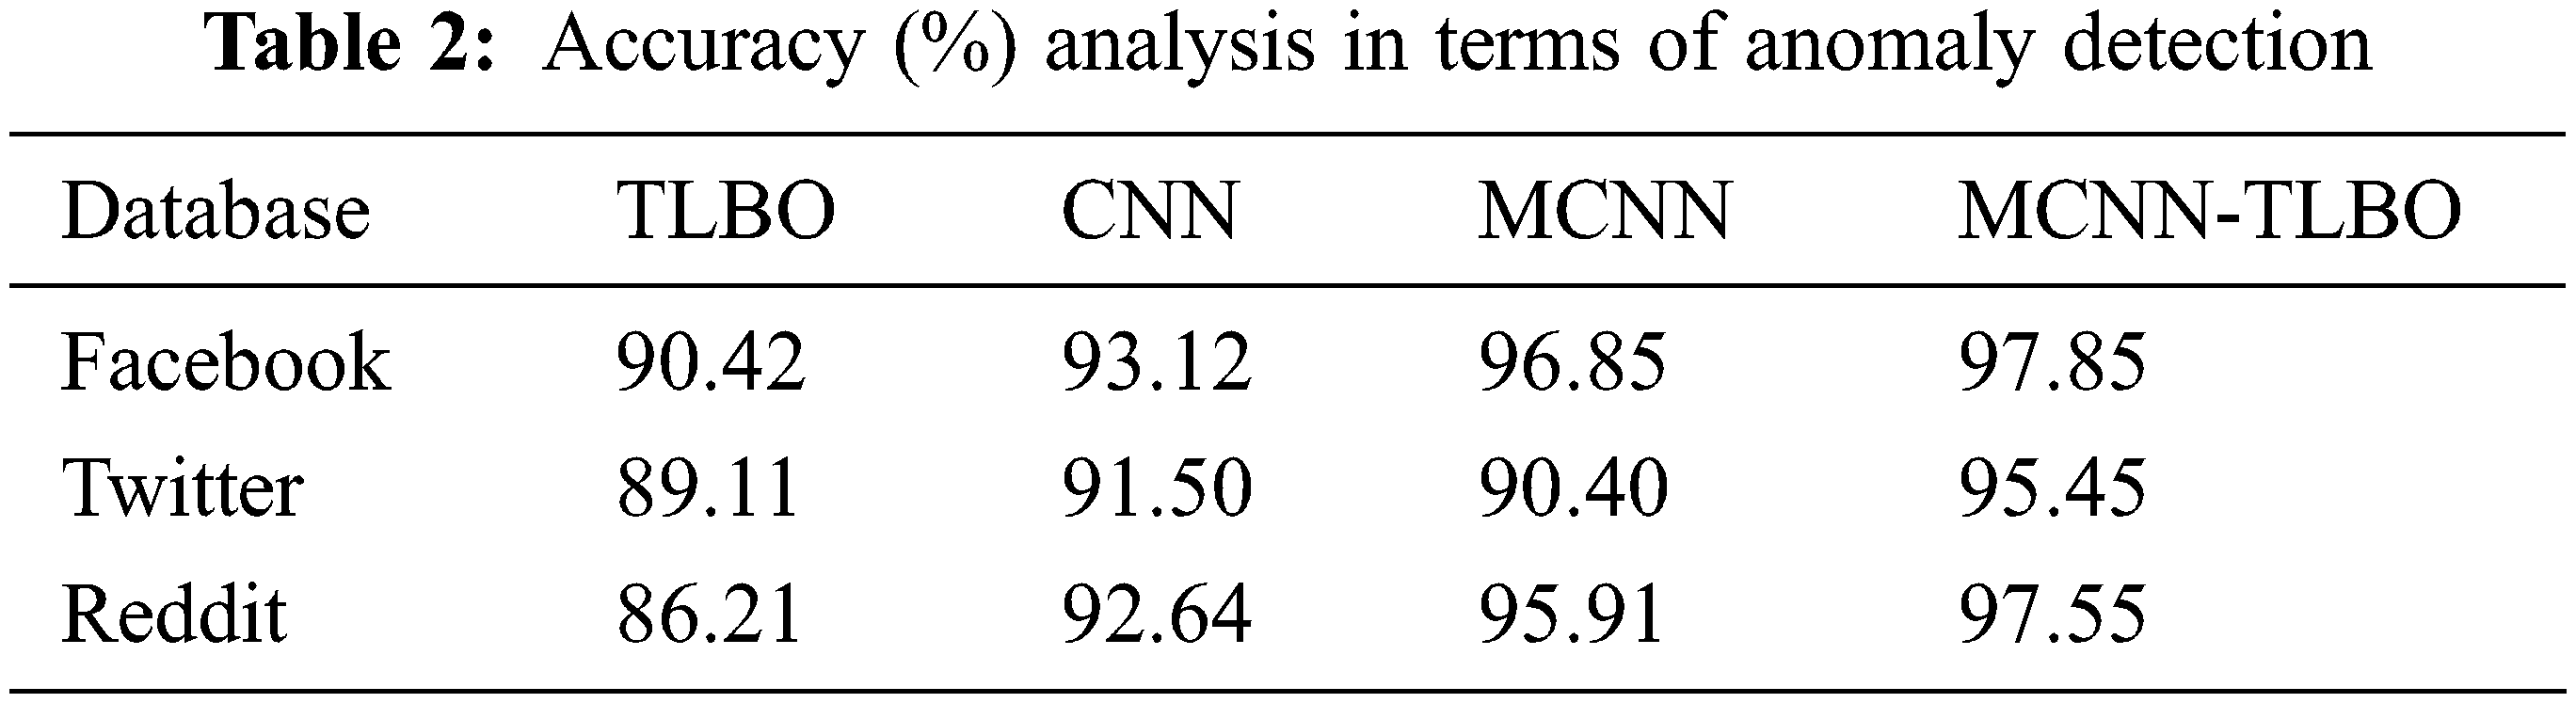
Fig. 7 depicts the comparative examination of Reddit database. The execution measurements have been measured and contrasted with four approaches i.e., TLBO, CNN, MCNN, and the proposed MCNN-TBLO. During the accuracy examination, the TLBO accomplishes 92.45%, CNN as 84.54%, MCNN gets 94.74%, and the proposed MCNN-TBLO achieves 96.75%. While considering specificity, the TLBO achieves 88.12%, CNN as 83.69%, MCNN accomplishes 90.74% and the proposed MCNN-TBLO achieves 98.90%. Likewise, the other measures such as sensitivity, Precision, and recall additionally provide an equivalent kind of result. During the examination of all these methods, the proposed MCNN-TBLO in terms of Reddit database accomplishes optimal incentive.
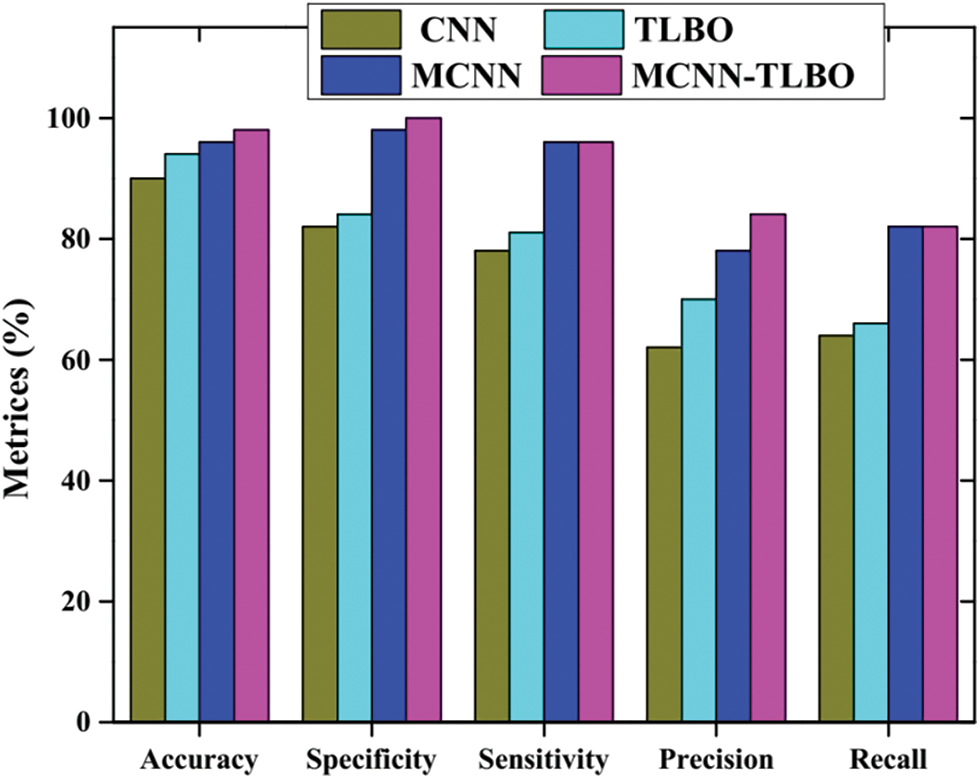
Figure 7: Comparative analysis of Reddit dataset
Fig. 8 demonstrates the comparative examination of the Facebook database. The TLBO, CNN, MCNN, and the proposed MCNN-TLBO methods have been chosen for the comparisons of performance measures including accuracy, specificity, sensitivity, precision, and recall for anomaly detection in social media networks. The proposed MCNN-TLBO accomplishes 98.09%, 100%, 96.03%, 84.39%, and 82.90% in terms of accuracy, specificity, sensitivity, precision, and recall, respectively. During the examination of all the methods involving all the execution measures, the maximal esteem is attained by MCNN-TLBO, contrasted with the other three optimization techniques. Finally, the proposed MCNN-TLBO detects the anomalies effectively with respect to the Facebook dataset.

Figure 8: Comparative analysis of Facebook dataset
Fig. 9 depicts the comparative examination of Twitter database. The execution measurements are measured and contrasted with four approaches i.e., TLBO, CNN, MCNN, and the proposed MCNN-TBLO. During the accuracy examination, the TLBO accomplishes 92.56%, CNN as 84.54%, MCNN gets 94.74% and the proposed MCNN-TBLO achieves 95.75%. While considering specificity, the TLBO achieves 86.12%, CNN as 84.09%, MCNN accomplishes 88.74%, and the proposed MCNN-TBLO achieves 98.02%. In view of experimentation of all other strategies, the proposed MCNN-TLBO delivers the greatest results contrasted with other methods. As a whole, the proposed approach yields better and higher detection results than the other methods.
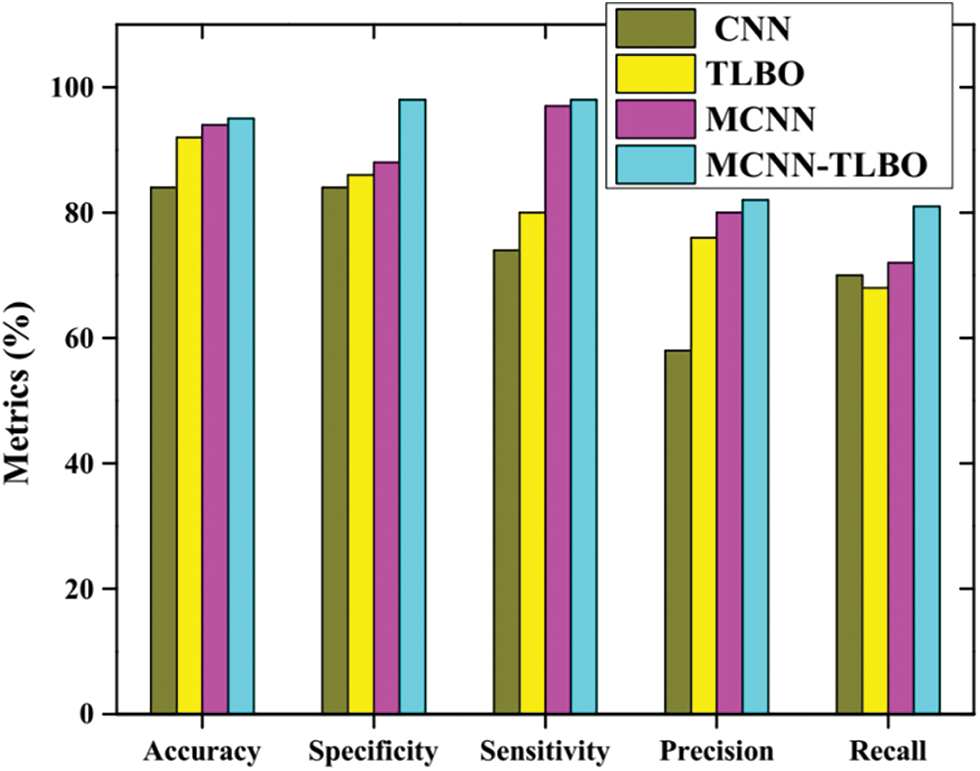
Figure 9: Comparative analysis of the Twitter dataset
Several researchers have employed anomaly detection through deep learning algorithms in online social networks over the last few years. There are still a lot of steps that can be taken to improve the models. DL is one of the most effective ways to support the world’s future innovation development. Firstly, the thin boundary between the normal and the abnormal users makes it difficult to predict one another, requiring the development of more effective and new solutions using DL. Secondly, many applications will not involve in risk by compromising their sensitive information. They must be alert to the existence of any abnormalities before they are detected. A significant amount of work has been done towards anomaly detection rather than prevention. Hence, preventing anomaly detection in social media can be focused upon.
The recent popularity of social media networks like Facebook, Twitter, YouTube, etc., might cause different types of anomalous behaviors such as bullying, terrorist attack, and fraud information distributions. Social media anomaly detection is a precise method to detect and extract different malicious attacks. Several anomaly detection approaches have been carried out by different researchers. However, they lack the accuracy of feature extraction and hence, a new novel method MCNN-TLBO, which comprises CNN approach along with the TLBO algorithm, has been proposed. In the proposed CNN based anomaly detection, the abnormal behaviors are analyzed and extracted by a modified CNN with Sstochastic pooling and LReLU. Further, Teacher-learning based optimization is incorporated with CNN to increase the accuracy of feature extraction in anomaly detection. The present method is compared with different existing methods like CNN, TLBO, MCNN, in terms of accuracy, sensitivity, specificity, precision, and recall for different databases from Facebook, Twitter, and Reddit and the proposed approach has outperformed with 97.85%, 95.45%, and 97.55%, respectively for the three datasets. Thus, the performance analysis of the proposed method delineates better results than the previously approaches.
Authorship and Contribution: M. Swarna Sudha, Assistant Professsor (SG), Ramco Institute of Technology, Rajapalayam India has made substantial contributions to the intellectual content of an article in terms of conception, drafting, and revising the work. K. Valarmathi, Professor, PSR Engineering College, Sivakasi, has made substantial contributions to acquisition, analysis, and interpretation of the data.
Funding Statement: The authors received no specific funding for this study.
Conflicts of Interest: The authors declare that they have no conflicts of interest to report regarding the present study.
References
1. Z. N. Gastelum and K. M. Whattam, State-of-the-Art of Social Media Analytics Research. Richland, United States: Pacific Northwest National Lab, 2013. [Google Scholar]
2. A. C. Hsu and R. Indrakshi, “Specification and enforcement of location-aware attribute-based access control for online social networks,” in Proc. ACM Int. Workshop on Attribute based Access Control, USA, pp. 25–34, 2016. [Google Scholar]
3. E. Adriana-Cristina and S. Valentin, “Enhanced intrusion detection system based on bat algorithm-support vector machine,” in Proc. 11th Int. Conf. on Security and Cryptography, Vienna, Austria, pp. 1–6, 2014. [Google Scholar]
4. K. Ummidivarapu, H. K. Voruganti, T. Khajah and S. P. Alain Bordas, “Isogeometric shape optimization of an acoustic horn using the teaching-learning-based optimization (TLBO) algorithm,” Computer Aided Geometric Design, vol. 80, no. 1, pp. 101881, 2020. [Google Scholar]
5. M. Swarna Sudha and K. Valarmathi, “An optimized deep belief network to detect anomalous behavior in social media,” Journal of Ambient Intelligence and Humanized Computing, vol. 24, no. 9, pp. 6421, 2021. [Google Scholar]
6. S. Kokatnoor and K. Balachandran, “Self-supervised learning based anomaly detection in online social media,” International Journal of Intelligent Engineering and Systems, vol. 13, no. 3, pp. 446–456, 2020. [Google Scholar]
7. K. Kumari, J. P. Singh, Y. K. Dwivedi and N. P. Rana, “Towards Cyberbullying-free social media in smart cities: A unified multi-modal approach,” Soft Computing, vol. 24, no. 15, pp. 11059–11070, 2020. [Google Scholar]
8. X. Sun, C. Zhang, S. Ding and C. Quan, “Detecting anomalous emotion through big data from social networks based on a deep learning method,” Multimedia Tools and Applications, vol. 79, no. 9689, pp. 1–22, 2018. [Google Scholar]
9. G. Garg, K. Kuljeet, B. Shalini, K. Georges, K. Neeraj et al., “A multi-stage anomaly detection scheme for augmenting the security in IoT-enabled applications,” Future Generation Computer Systems, vol. 104, no. 5, pp. 105–118, 2020. [Google Scholar]
10. J. Wang, Y. Wu, S. He, P. K. Sharma, X. Yu et al., “Lightweight single image super-resolution convolution neural network in portable device,” KSII Transactions on Internet and Information Systems, vol. 15, no. 11, pp. 4065–4083, 2021. [Google Scholar]
11. J. Wang, Y. Zou, P. Lei, R. S. Sherratt and L. Wang, “Research on recurrent neural network based crack opening prediction of concrete dam,” Journal of Internet Technology, vol. 21, no. 4, pp. 1161–1169, 2020. [Google Scholar]
12. T. Dennis, B. Harald K. Steffen, W. Michael and E. Thomas, “Spatiotemporal anomaly detection through visual analysis of geolocated twitter messages,” in Proc. IEEE Pacific Visualization Symp., Songdo, Korea, pp. 41–48, 2012. [Google Scholar]
13. T. Toshimitsu, T. Ryota and Y. Kenji, “Discovering emerging topics in social streams via link-anomaly detection,” IEEE Transactions on Knowledge and Data Engineering, vol. 26, no. 1, pp. 120–130, 2012. [Google Scholar]
14. S. He, Z. Li, Y. Tang, Z. Liao, F. Li et al., “Parameters compressing in deep learning,” Computers, Materials & Continua, vol. 62, no. 1, pp. 321–336, 2020. [Google Scholar]
15. H. Hansi, A. O. Mariam, B. Jagdev and M. G. Mohamed, “Embed2Detect: Temporally clustered embedded words for event detection in social media,” Machine Learning, vol. 111, no. 1, pp. 49–87, 2022. [Google Scholar]
16. S. R. Zhou and B. Tan, “Electrocardiogram soft computing using hybrid deep learning CNN-ELM,” Applied Soft Computing, vol. 86, no. 4, pp. 105778, 2020. [Google Scholar]
17. W. Wang, H. Liu, J. Li, H. Nie and X. Wang, “Using CFW-net deep learning models for X-ray images to detect COVID-19 patients,” International Journal of Computational Intelligence Systems, vol. 14, no. 1, pp. 199–207, 2021. [Google Scholar]
18. W. Wang, Y. Yang, J. Li, Y. Hu, Y. Luo et al., “Woodland labeling in Chenzhou, China, via deep learning approach,” International Journal of Computational Intelligence Systems, vol. 13, no. 1, pp. 1393–1403, 2020. [Google Scholar]
19. D. Zhang, J. Hu, F. Li, X. Ding, A. K. Sangaiah et al., “Small object detection via precise region-based fully convolutional networks,” Computers, Materials and Continua, vol. 69, no. 2, pp. 1503–1517, 2021. [Google Scholar]
20. R. Hassanzadeh, R. Nayak and D. Stebila, “Analyzing the effectiveness of graph metrics for anomaly detection in online social networks,” in Proc. Int. Conf. on Web Information Systems Engineering, Berlin, Heidelberg, pp. 624–630, 2012. [Google Scholar]
21. S. P. Siregar, P. Sandy and W. Anja, “Analysis of artificial neural network accuracy using backpropagation algorithm,” International Journal of Information System & Technology, vol. 1, no. 1, pp. 34–42, 2017. [Google Scholar]
22. Z. He, H. Shao, X. Zhong and X. Zhao, “Ensemble transfer CNNs driven by multi-channel signals for fault diagnosis of rotating machinery cross working conditions,” Knowledge-Based Systems, vol. 207, pp. 106396, 2020. [Google Scholar]
23. J. Sukirty, S. Sanyam and W. Rajesh, “Dynamic selection of normalization techniques using data complexity measures,” Expert Systems with Applications, vol. 106, no. 1, pp. 252–262, 2018. [Google Scholar]
24. D. Whitley, “A genetic algorithm tutorial,” Statistics and Computing, vol. 4, no. 2, pp. 65–85, 1994. [Google Scholar]
25. R. Poli, K. James and B. Tim, “Particle swarm optimization,” Swarm Intelligence, vol. 1, no. 1, pp. 33–57, 2007. [Google Scholar]
26. B. Pan, Z. Yu, W. David and C. Shahabi, “Crowd sensing of traffic anomalies based on human mobility and social media,” in Proc. ACM SIGSPATIAL Int. Conf. on Advances in Geographic Information Systems, China, pp. 344–353, 2013. [Google Scholar]
27. Patrick Martinchek, “2012-2016 Facebook Posts,” data.world., 2016. [Online]. Available: https://data.world/martinchek/2012-2016-facebook-posts. [Google Scholar]
28. Data Society, “Twitter User Data,” data.world, 2016. [Online]. Available: https://data.world/data-society/twitter-user-data. [Google Scholar]
29. P. Riccardo, K. James and B. Tim, “Particle swarm optimization,” Swarm Intelligence, vol. 1, no. 1, pp. 33–57, 2007. [Google Scholar]
Cite This Article
 Copyright © 2023 The Author(s). Published by Tech Science Press.
This work is licensed under a Creative Commons Attribution 4.0 International License , which permits unrestricted use, distribution, and reproduction in any medium, provided the original work is properly cited.
 Downloads
 Citation Tools