
 Submit a Paper
 Propose a Special lssue
 Open Access
ARTICLE
Smart Lung Tumor Prediction Using Dual Graph Convolutional Neural Network
Department of Computer Science, College of Arts and Sciences, Prince Sattam Bin Abdulaziz University, KSA
* Corresponding Author: Abdalla Alameen. Email:
Intelligent Automation & Soft Computing 2023, 36(1), 369-383. https://doi.org/10.32604/iasc.2023.031039
Received 08 April 2022; Accepted 21 June 2022; Issue published 29 September 2022
 View Full Text
 Download PDF
Abstract
A significant advantage of medical image processing is that it allows non-invasive exploration of internal anatomy in great detail. It is possible to create and study 3D models of anatomical structures to improve treatment outcomes, develop more effective medical devices, or arrive at a more accurate diagnosis. This paper aims to present a fused evolutionary algorithm that takes advantage of both whale optimization and bacterial foraging optimization to optimize feature extraction. The classification process was conducted with the aid of a convolutional neural network (CNN) with dual graphs. Evaluation of the performance of the fused model is carried out with various methods. In the initial input Computer Tomography (CT) image, 150 images are pre-processed and segmented to identify cancerous and non-cancerous nodules. The geometrical, statistical, structural, and texture features are extracted from the preprocessed segmented image using various methods such as Gray-level co-occurrence matrix (GLCM), Histogram-oriented gradient features (HOG), and Gray-level dependence matrix (GLDM). To select the optimal features, a novel fusion approach known as Whale-Bacterial Foraging Optimization is proposed. For the classification of lung cancer, dual graph convolutional neural networks have been employed. A comparison of classification algorithms and optimization algorithms has been conducted. According to the evaluated results, the proposed fused algorithm is successful with an accuracy of 98.72% in predicting lung tumors, and it outperforms other conventional approaches.Keywords
Based on the structure of the cells, lung carcinoma is classified into small-cell carcinomas and non-small-cell carcinomas. More than 85% of lung cancers are caused by long-term tobacco use [1]. There are 15%–20% of lung tumors among people who have never smoked, as a result of factors such as air pollution, asbestos, radon gas, and secondhand smoke. According to the size and location of the lymph nodes on the tumor, lung cancer can be divided into I to IV categories. A timely diagnosis of this lung cancer may reduce the mortality rate, or else the chances of survival are high [2]. Radiology and CT are the traditional methods to detect lung tumors due to their lower distortion levels and the ability to detect malignant growths [3]. The CT image depicts a lung malignancy with irregular and regular lung structures.
An image is preprocessed by normalizing, enhancing quality, and reducing distortion. Various filters in both the frequency and spatial domains are applied to enhance the input image [4]. The adaptive median filter eliminates the noise issues associated with the median filter. In the Wiener filter, low pass filters are used to minimize noise and high pass filters are used for deconvolution on the CT image. In medical imaging, segmentation is considered the most dangerous task for locating the nodule region to extract its features. Different approaches are used for segmentation such as watershed edge-based approaches [5], thresholding [6], and region-based segmentation [7]. Thresholding and morphological operation are used to determine the tumor region from the segmented nodule. The lung nodule region is segmented and statistical, textual, geometric, and shape-based features are extracted [8]. There are several features present in medical neuroimaging, such as gray-level co-occurrence matrix (GLCM), gray level run length matrix (GLRLM), local binary pattern (LBP) and histogram, and gray level dependence matrix (GLDM) [9]. These feature sets are used to evaluate the decision-making process.
To reduce the dimension of the feature space, an evolutionary fusion technique referred to as Whale Optimization with Adaptive PSO (WASO-APSO) has been used to remove redundant features [10,11]. To improve the classification stage, the features are grouped using LDA (linear discriminate algorithm) [12,13]. In this study, the whale optimization approach is fused with bacterial foraging optimization to enhance the feature selection for the classification phase. The classification is a major step in determining parameters such as accuracy, sensitivity, and specificity of the classifier that aids in the diagnosis of lung cancer. In this study, support vector machines, convolutional neural networks, and dual graph convolutional neural networks are compared. Based on a linear function from statistical theory, a support vector machine is a multiclass model used to predict medical imaging results [14]. Recently, deep learning has been widely utilized in medical applications and problem-solving techniques. The convolutional neural network and its variants take into account the fully connected neurons with activation functions and use backpropagation to adjust weights [15].
Messay et al. developed a lung tumor detection system using thresholding and a rule-based approach [16]. Support Vector Machine (SVM) and rule-based approach have been implemented here to detect the false positive rate. Ant colony optimization approach has been used to find the edges and given as input to a circular neighbor algorithm to detect the lung nodule in. Bari et a. used a genetic algorithm to detect the relevant lung nodule feature for SVM classification [17]. Kumar et al. analyzed five algorithms for the detection of lung tumors [18]. The algorithms are k-means clustering, k-median clustering, inertia-weighted particle swarm optimization (IWPSO), particle swarm optimization (PSO), and guaranteed convergence particle swarm optimization (GCPSO). With the experimental analysis, they proved that for preprocessing adaptive median filter performs better and for classification GCPSO secured high accuracy of 95.89%.
The remaining section of this smart lung cancer detection is structured as follows: Section 2 discusses the related literature. Section 3 discusses the materials and methods. Experimented results are discussed in Section 4 and Section 5 concludes the proposed lung tumor detection system with its future work.
The early detection of cancer may increase the chance of a patient’s survival. Researchers are rapidly developing computational intelligence techniques to detect disease patterns with medical imaging. In recent research on medical imaging, artificial intelligence [19,20], pattern recognition [21], and computer vision have been applied to data visualization concepts. To extract the abnormalities from CT images, computer-aided diagnosis is a challenging task for radiologists to take the necessary actions based on their decision-making. This section reviews relevant literature regarding lung tumor detection.
For lung CT image segmentation, Kumar et al. developed a hybrid 2D Otsu method with a modified artificial bee colony approach [18]. Uzelaltinbulat et al. applied thresholding and morphological operations to segment lung tumors [22]. Joon et al. utilized k-means clustering with fuzzy c-means to identify cancerous and non-cancerous lung nodules using texture and structural features [23]. Wang et al. used a multilevel image thresholding segmentation method and the best exponential k gravitational search method [24]. Prabukumar et al. developed a hybrid method for segmentation with texture, statistics, and geometrical features called Fuzzy C Mean with Region Growing Method [25]. The features have been enhanced by using a cuckoo search and an SVM classifier has been used to obtain an accuracy of 98.5%. Recently, Naqi et al. proposed a hybrid method called Active Contour Model (ACM), combining 3D neighborhood connectivity with 3D geometric properties for nodule detection [26]. Comparative analysis with naïve Bayes, SVM, and k-nearest neighbors (KNN) is performed., Zhou et al. proposed a novel computer-aided diagnosis method using the Convolutional Neural Network (CNN) for the detection of lung tumors on PET imaging [27]. The system has been evaluated for recall, precision, and F-score.
For lung CT image segmentation, Kumar et al. [18] developed a hybrid 2D Otsu method with a modified artificial bee colony approach. Uzelaltinbulat et al. applied thresholding and morphological operations to segment lung tumors [22]. Joon et al. utilized k-means clustering with fuzzy c-means to identify cancerous and non-cancerous lung nodules using texture and structural features [23]. Wang et al. used a multilevel image thresholding segmentation method and the best exponential k gravitational search method [24]. Prabukumar et al. developed a hybrid method for segmentation with texture, statistics, and geometrical features called Fuzzy C Mean with Region Growing Method [25]. The features have been enhanced by using a cuckoo search and an SVM classifier has been used to obtain an accuracy of 98.5%. Recently, Naqi et al. proposed a hybrid method called Active Contour Model (ACM), combining 3D neighborhood connectivity with 3D geometric properties for nodule detection [26]. Comparative analysis with naïve Bayes, SVM, and k-nearest neighbors (KNN) is performed. Zhou et al. proposed a novel computer-aided diagnosis method using the Convolutional Neural Network (CNN) for the detection of lung tumors on PET imaging [27].
3 Proposed Materials and Method Descriptions
Fig. 1 illustrates the materials and proposed methodologies of the computer-aided diagnosis (CAD) system for the smart detection of lung tumors. This system has five steps, including CT image preprocessing, Image segmentation using thresholding methods and morphological operations, Feature extraction by using GLM, GLRLM, and HOG, optimization with W-BFOA and, Classification by using Dual Graph CNN (DGCNN).
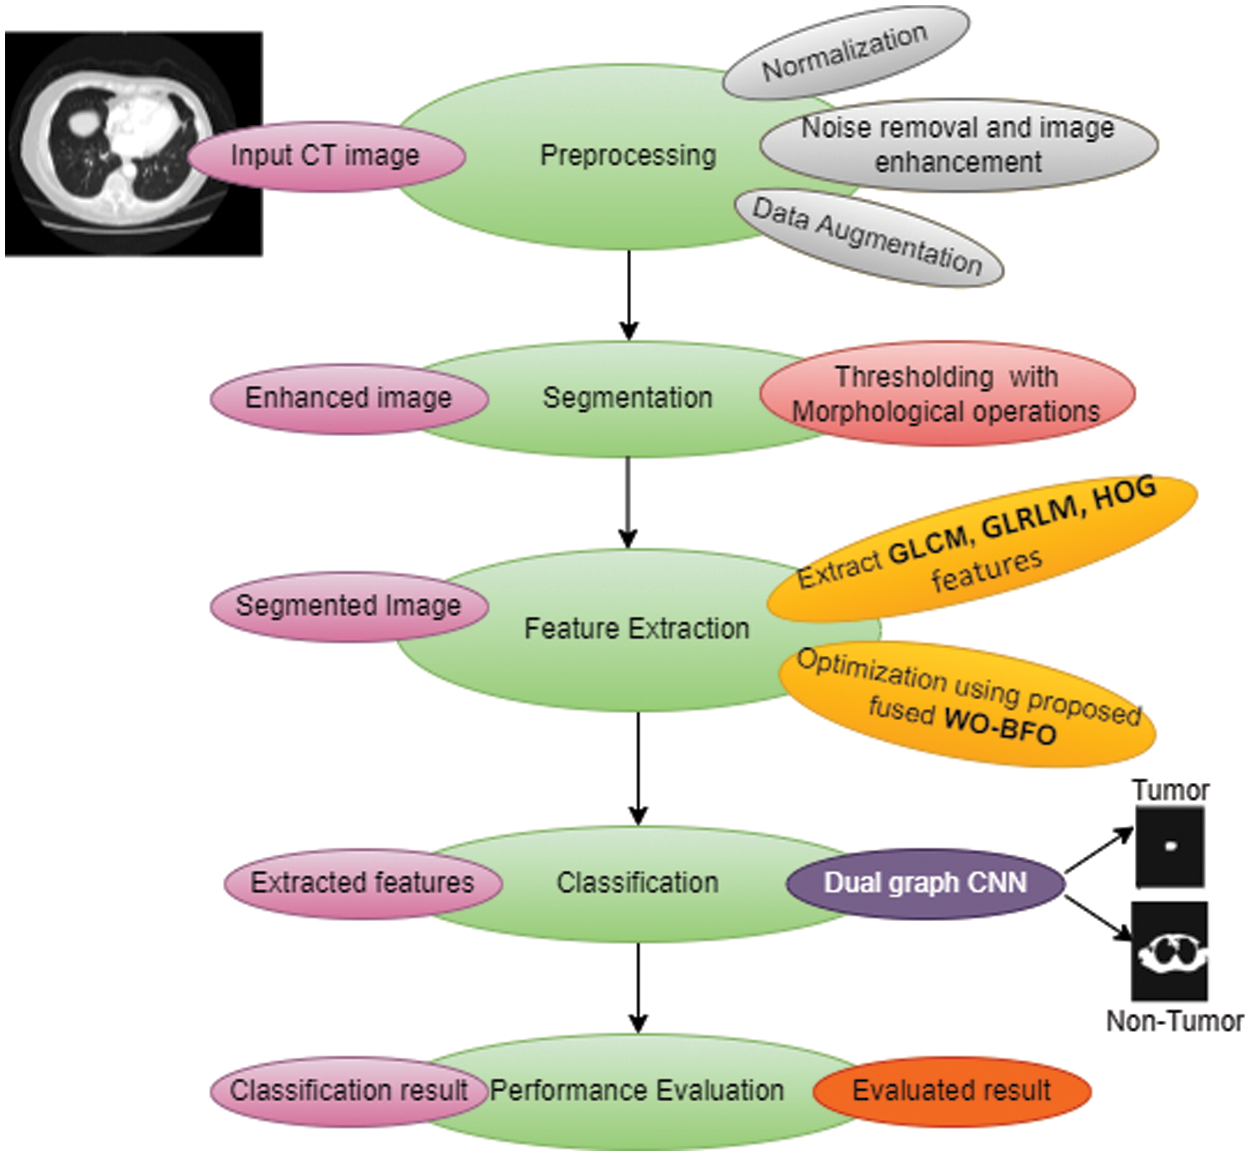
Figure 1: Overview of proposed lung-tumor prediction system
Based on 150 CT images of tumorous lung and non-tumor patients obtained by the NCI Lung Cancer Database Consortium, the proposed CAD system called smart lung tumor detection has been implemented [28]. Preprocessing of the input image is considered a significant phase in research related to clinical applications of neuroimaging for improving image quality. In this paper, we perform preprocessing steps such as normalization, noise removal, image enhancement, and augmentation of the input image to produce an improved image,
It has been found that an adaptive median filter (AMF) coupled with a Wiener filter (WF) can be used to remove noise from a normalized input image with a minimum mean square error. An adaptive median filter can address some of the issues associated with the median filter (MF), including how it is only effective on salt and pepper noise, inefficient when the spatial density of the noise is high, and does not provide proper smoothing for large kernel sizes. Unlike MF, Adaptive MF employs a variable kernel size, and all pixels are not replaced with the median value. It consists of two steps, namely (I) identifying the median value for the kernel, and (II) determining whether the current pixel value is salt and pepper noise (impulse).
Using AMF, the denoise image is further improved using WF with minimum mean square error. In Eq. (1), WF is a statistical method to reduce image blurring and smoothen the image effect. Fig. 2 illustrates the enhanced CT image using AMF and WF.
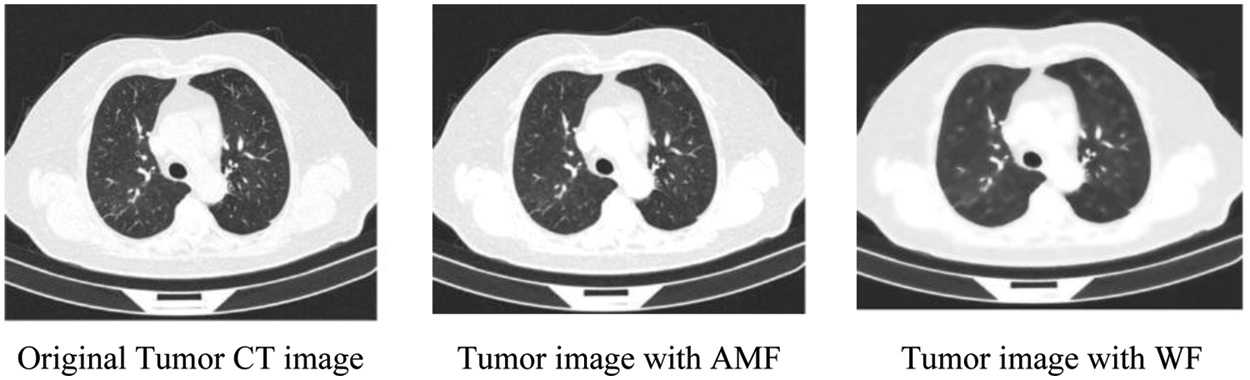
Figure 2: Filtered CT images
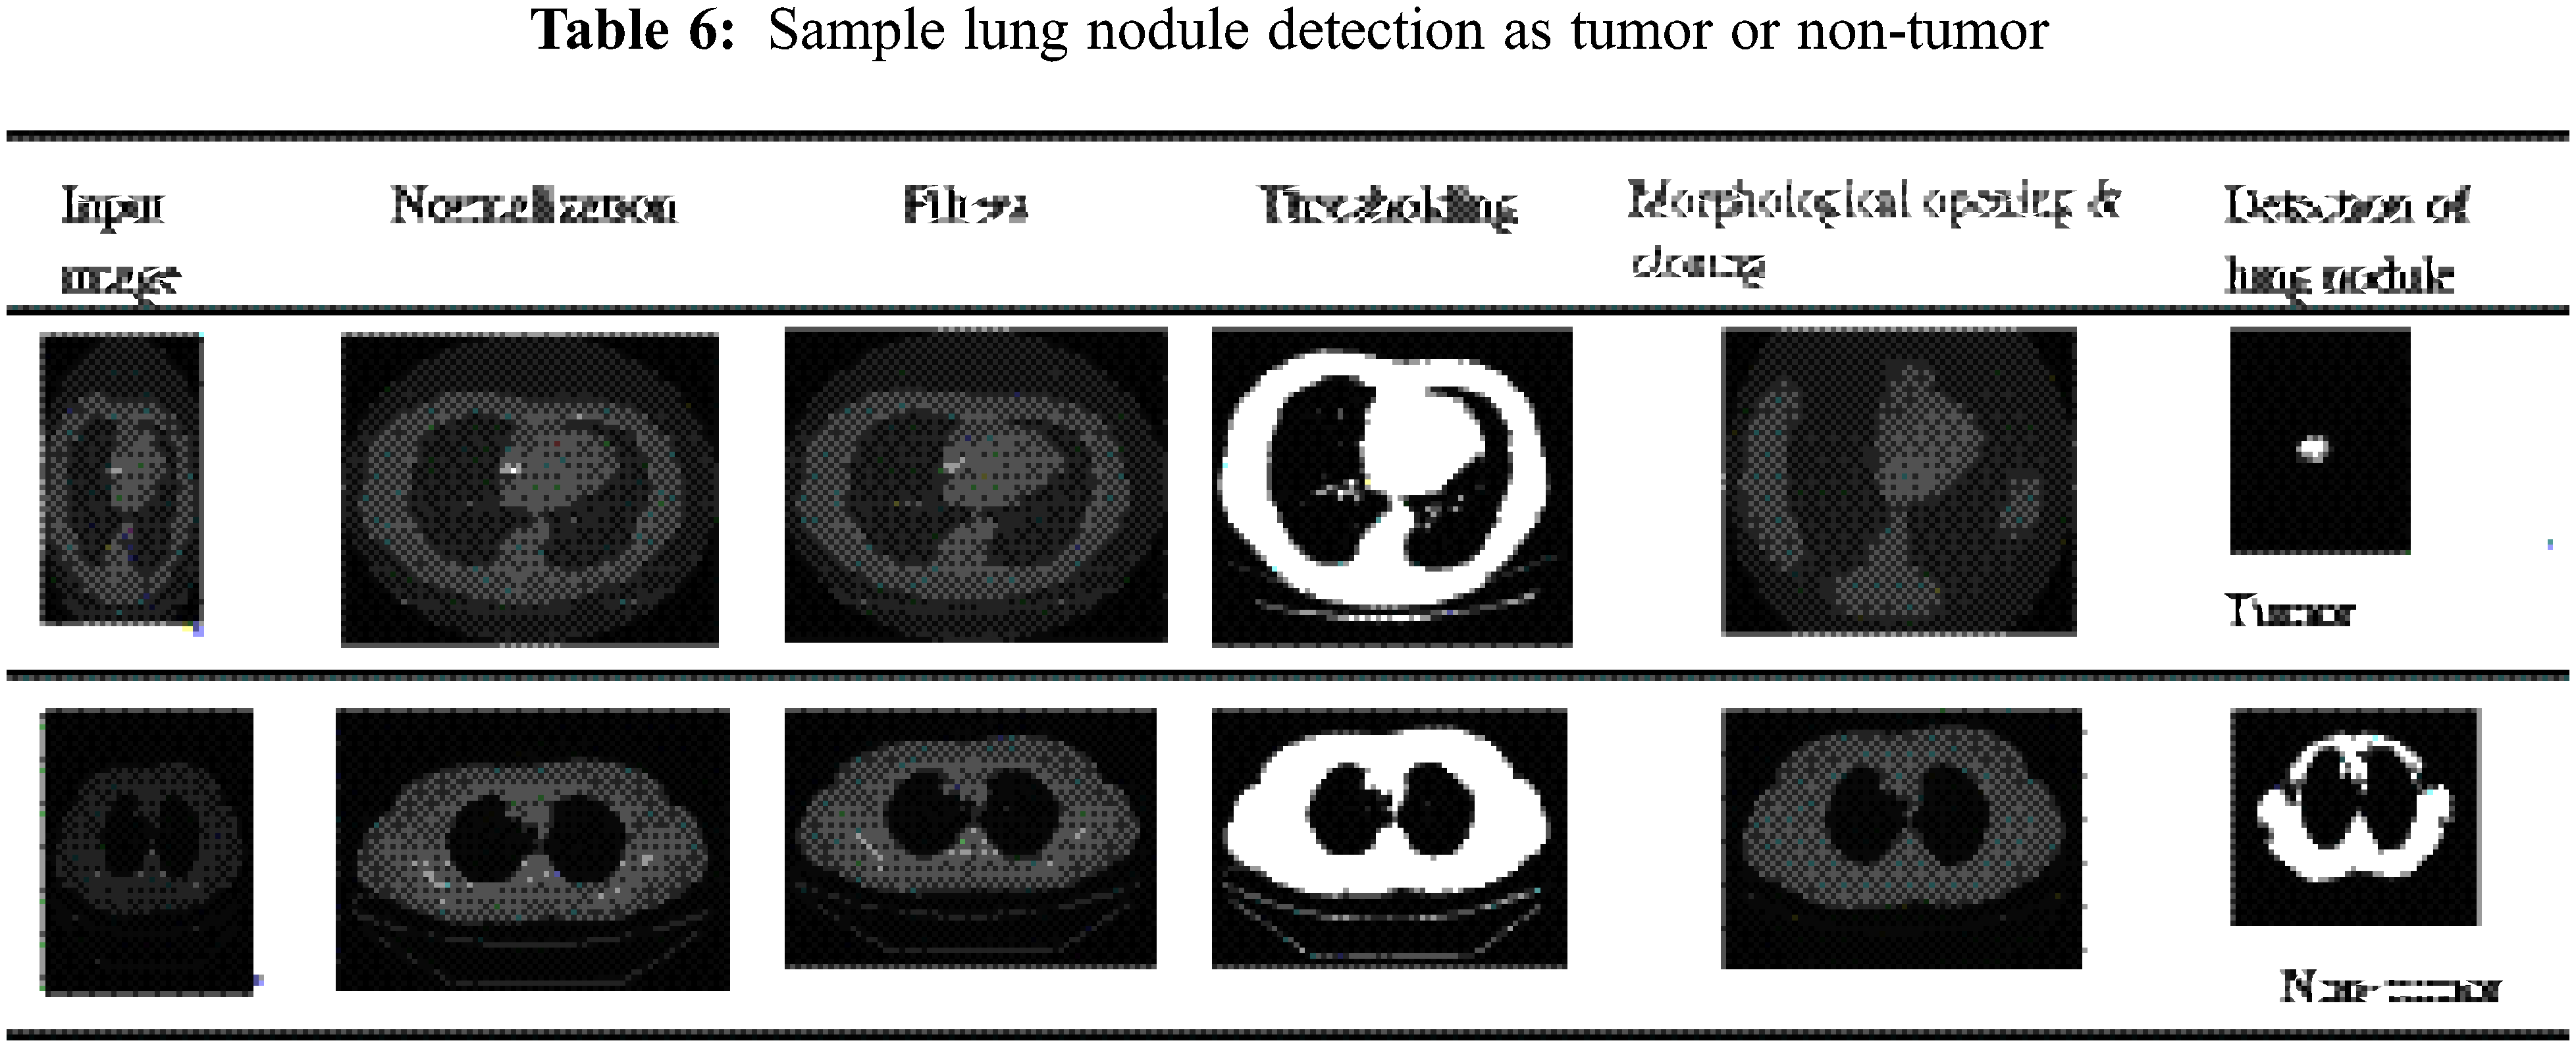
To avoid the overfitting issue and satisfy the training process, network augmentation is being utilized. Image segmentation involves the process of separating images into parts based on objects or other relevant information. Using this method, the image becomes useful data for further analysis. Based on Shakeel et al., the purpose of image segmentation is to identify the boundaries and objects within the image [29]. The proposed work uses thresholding to segment CT images, while morphological operations are used to smooth the region of interest.
One of the simplest forms of segmentation is the threshold which segments grayscale images into binary images. If a pixel value is greater than the threshold value, that pixel is segmented as an object, otherwise as a boundary. Morphological mathematical operations are applied to the possible locating of a particular structuring element to smoothen the region of interest. Assume D is the binary image and B is the structuring element then the morphological operations such as Erosion, Dilation, Opening and Closing are depicted in Eqs. (2)–(5) respectively. Fig. 3 illustrates the thresholding-morphological operation-based segmentation.
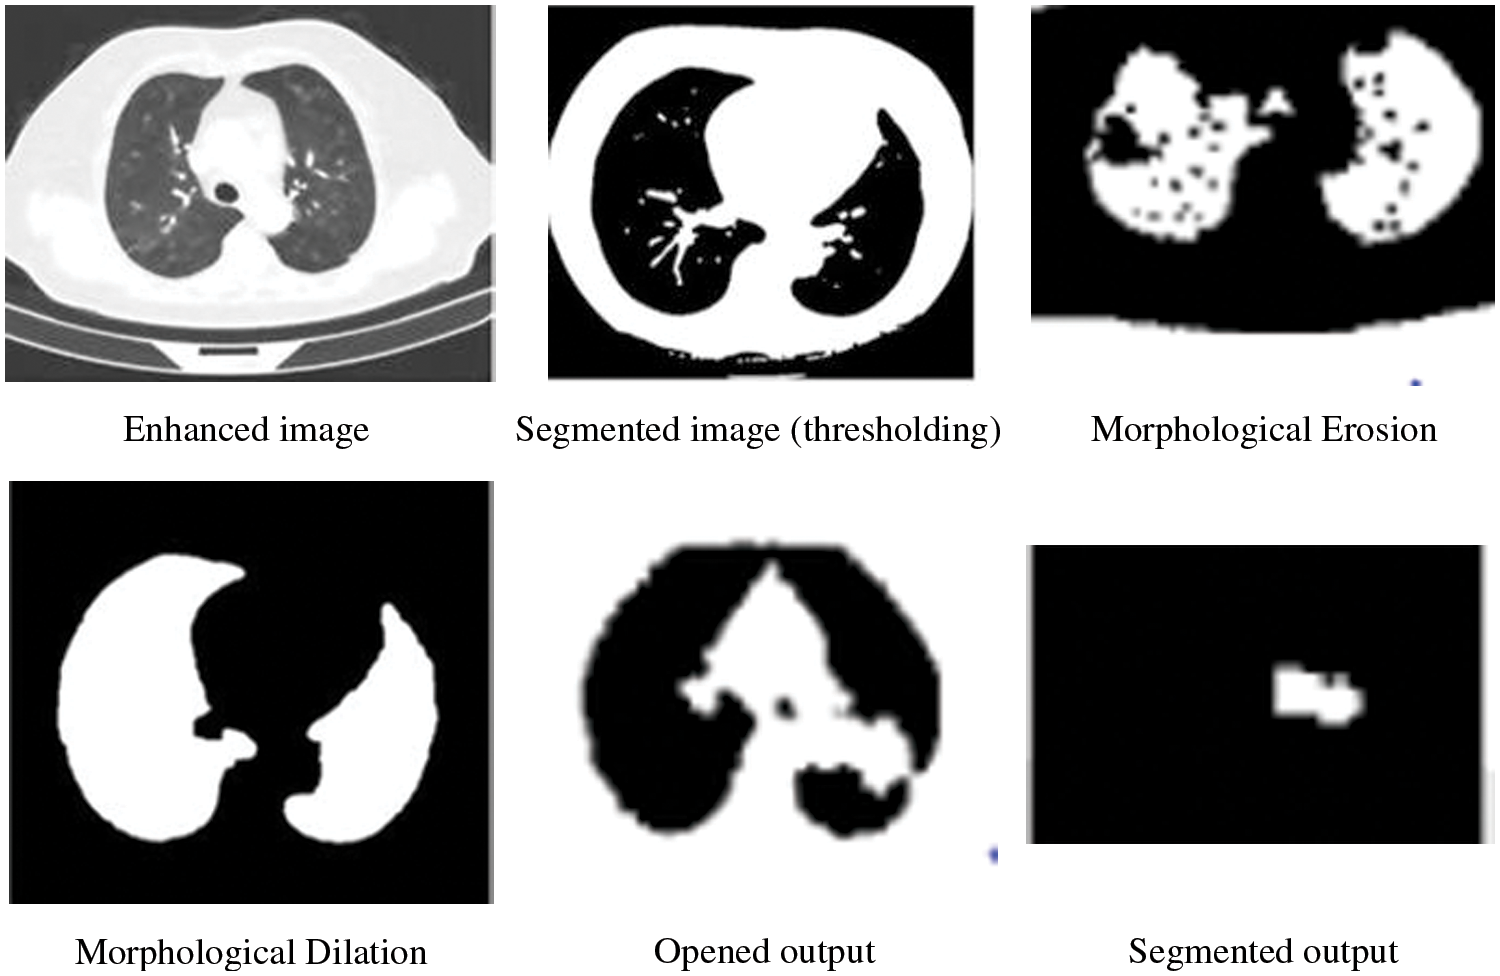
Figure 3: Thresholding-morphological operation based segmentation
After segmentation, lung nodule pattern information is obtained in the feature extraction phase. From each segmented nodule, this proposed feature extraction method extracts various geometrical, texture, statistical and structural features. The techniques such as GLCM, GLRLM, and HOG are used for feature extraction. GLCM is a second-order statistics approach that considers the relationship between couples of pixels. GLRLM obtains a higher-order statistical method that extracts the features with gray levels pixels that are occurring continuously. Metaheuristic approaches mimic the biological phenomenon of nature to solve the real work applications. In this study, whale optimization and bacterial foraging optimization are combined to select the optimal features to improve the prediction of lung tumor outcomes. Standard Whale Optimization Algorithm (WOA) simulates the behavior of predation by whales through swarm intelligence.
In the WOA approach, first, the prey’s location and its surrounding are recognized by the whale. In some situations, the whale didn’t find the prey’s location. In that case, the current possible prey position is the target prey and the remaining individuals in the prey are moving to that optimal position. Once the best possible solution is found, other individuals also update their positions. This behavior is mathematically expressed as follows in Eqs. (6) and (7).
where, t: current no. of iterations,
where, r: a random number in the range [0, 1], a: control parameter, and for the number of iterations it decreases the value in the range 2 to 0 as stated in Eq. (10), and
The humpback whale’s bubble net behavior is within the encirclement as shown in Fig. 4, the whale is moving toward the prey along the spiral path. This behavior is mathematically modeled with two steps such as the shrinking inspiring method and spiral update position respectively.
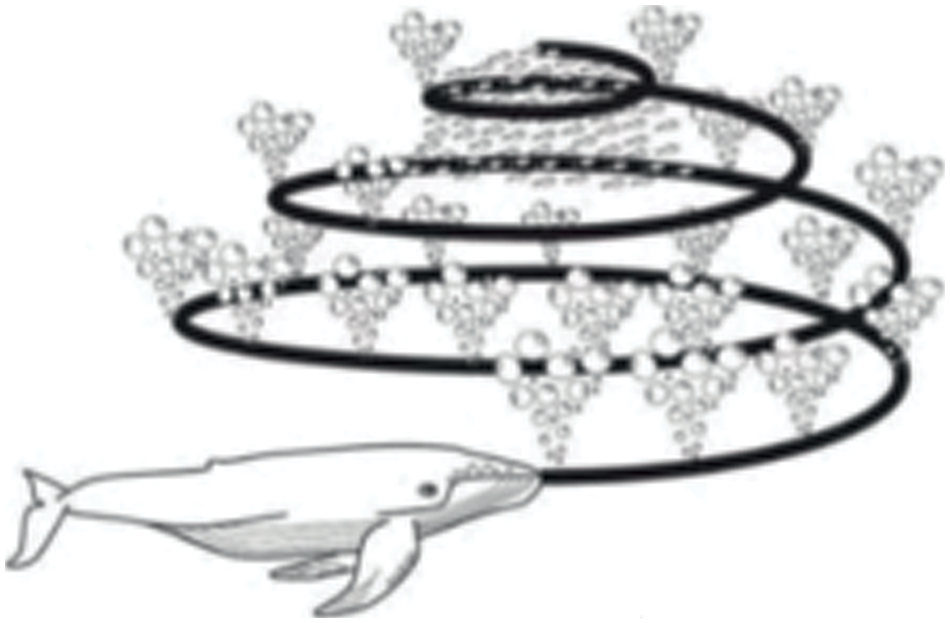
Figure 4: Bubble-net foraging of the whale [30]
In the first step, the convergence factor is reduced using the Eqs. (8)–(10). The second step to updating the position is to calculate the distance from the individual whale to the current position. Simulate the whale to capture food in the spiral mathematically as in Eq. (11).
where D1: the distance between whale i to the current position, b: constant to define the spiral logarithmic form, l: a random number between [−1, 1]. Spiral and contraction envelopment are performed with equal probability to obtain the synchronous model.
Randomly select the whale with the current position if
where rnd: random number (vector) of the whale position.
The bacterial Foraging Optimization Algorithm (BFO) was proposed in 2002 to imitate the food searching attitude of a swarm of bacteria. Searching for the nutrients called global solution by bacteria in n-dimensional space. This will use three operations such as chemotaxis, reproduction, and elimination-dispersal events. The bacteria find the best solution with the help of the locomotive flagella linked to it. The swarm is defined that flagella rotation in a counter-clock direction that takes action to bacteria in a forwarding direction. If the flagella rotation is clockwise then each flagellum is behaving independently in a random direction. During the chemotactic progress, bacteria alternate the modes as tumble and run. Tumble is modeled as single chemotactic progress by a run. Among the total population called ‘B’ bacteria, θ (p, c, rp, e) denotes the current position of pth bacteria during cth chemotactic, rpth reproduction, and eth elimination. The location of the succeeding bacteria is exhibited as in Eq. (15).
where C(p, c): run-length unit of pth bacteria and
All ‘B’ bacteria are ordered based on their health value in ascending order. To make the population of bacteria constant, at least B/2 healthy bacteria gets replaced with the remaining bacteria that are healthier. After Nrp reproduction steps, based on the probability of Ped, some of the bacteria are forcefully moved to a random search space which will avoid the local optimal solution to provide the best possible solution in the search area.
Fused WBFO is the novel optimization algorithm that works on both WO and BFO optimization algorithms. Based on WO’s best possible solution finding strategy using the bubble net foraging approach, a globally optimal solution is found from the swam population. With this idea to give space to bacteria, the bacteria optimal solution is compared with the global optimal solution in chemotaxis iteration. The bacteria swim until the best possible solution is found. In BFO, the chemotaxis is the major step and WO is used here to update the arbitrary variables.
Based on the energy, bacteria are sorted in ascending order. Due to a lack of energy, some of the bacteria are dying. The remaining are inherited from the bacterial position of their parents. The bacteria are dispersed as per the Eq. (17)
The workflow of the proposed optimization algorithm is shown in Fig. 5. Until the maximum number of iterations is reached, the parameters, location, and fitness functions are updated. If the termination condition and elimination dispersion are reached then the best solution is returned. For chemotaxis count, check the parameter value of P, if it is greater than 1 then the current position and bacteria dispersion are calculated, or else the position of the whale is updated. The optimal feature subset using the proposed WBFO has been given as input to the classification phase for the detection of lung tumors.
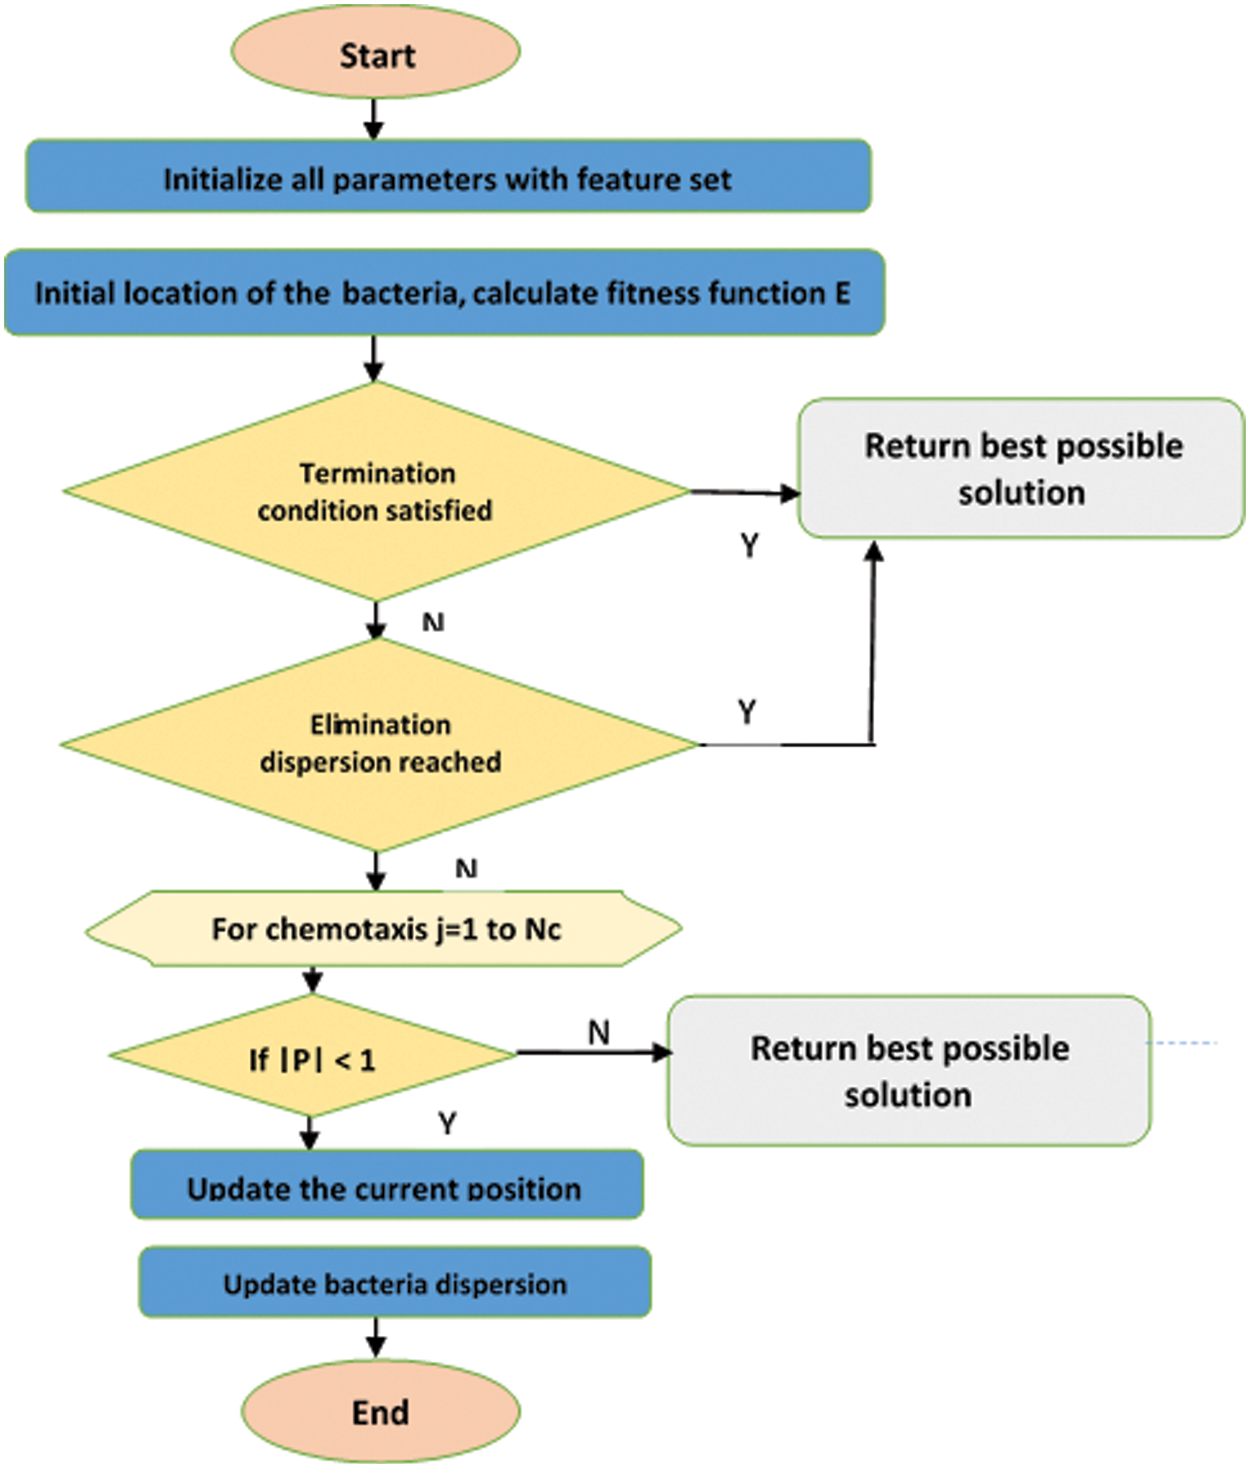
Figure 5: Proposed WBFO workflow
Each node of the NN graph is represented with the features extracted. The graph local and global consistency is considered by dual graph CNN with the implementation of two CNN. In Dual graph CNN, the dataset is represented as a matrix D
where,
The frequency matrix fm is calculated as follows: The random path is chosen from the sequence of nodes visited by the random user. If the random user on the node xi at time t, the state is described as s(t ) = xi. The transition from one node to the neighbor xj is declared as, r(s(t + 1) = xjs(t) = xi). These transition states are assigned to the given adjacency matrix A as Eq. (19). The random walk used here is to calculate the similarity between the nodes.
The frequency matrix fm is created using the Eq. (3) for all the pairs of nodes. The path between the nodes is calculated using a random walk. Once the fm is created, the ith node of FM is the ith row vector of fmi and the jth column of fm is the jth column vector of fmj. it is also called context cj. the entry of the frequency the matrix fmi,j is the number of times xi occurs in cj. then the fm has been used to calculate the PPMI matrix
where,
As compared to the adjacency matrix, the PPMI matrix has reduced the hub nodes and increased the relationship among the data points. The global consistency convolution network
where, the P-PPMI matrix and
To combine the local and global consistency convolution for a dual graph convolutional network, a regularize is used. Loss function with the regularize is represented in Eqs. (25) and (26)
where
4 Experimental Results and Analysis
The 150 lung CT images for tumor and non-tumor categories are collected from the lung cancer consortium for the proposed system evaluation. The input feature sets are split into a 7:3 ratio of training and testing datasets. The proposed system is implemented using python Sci-kit-learn and the results are compared with existing preprocessing filters, feature extraction methods, and classification systems in terms of accuracy, sensitivity, and specificity.
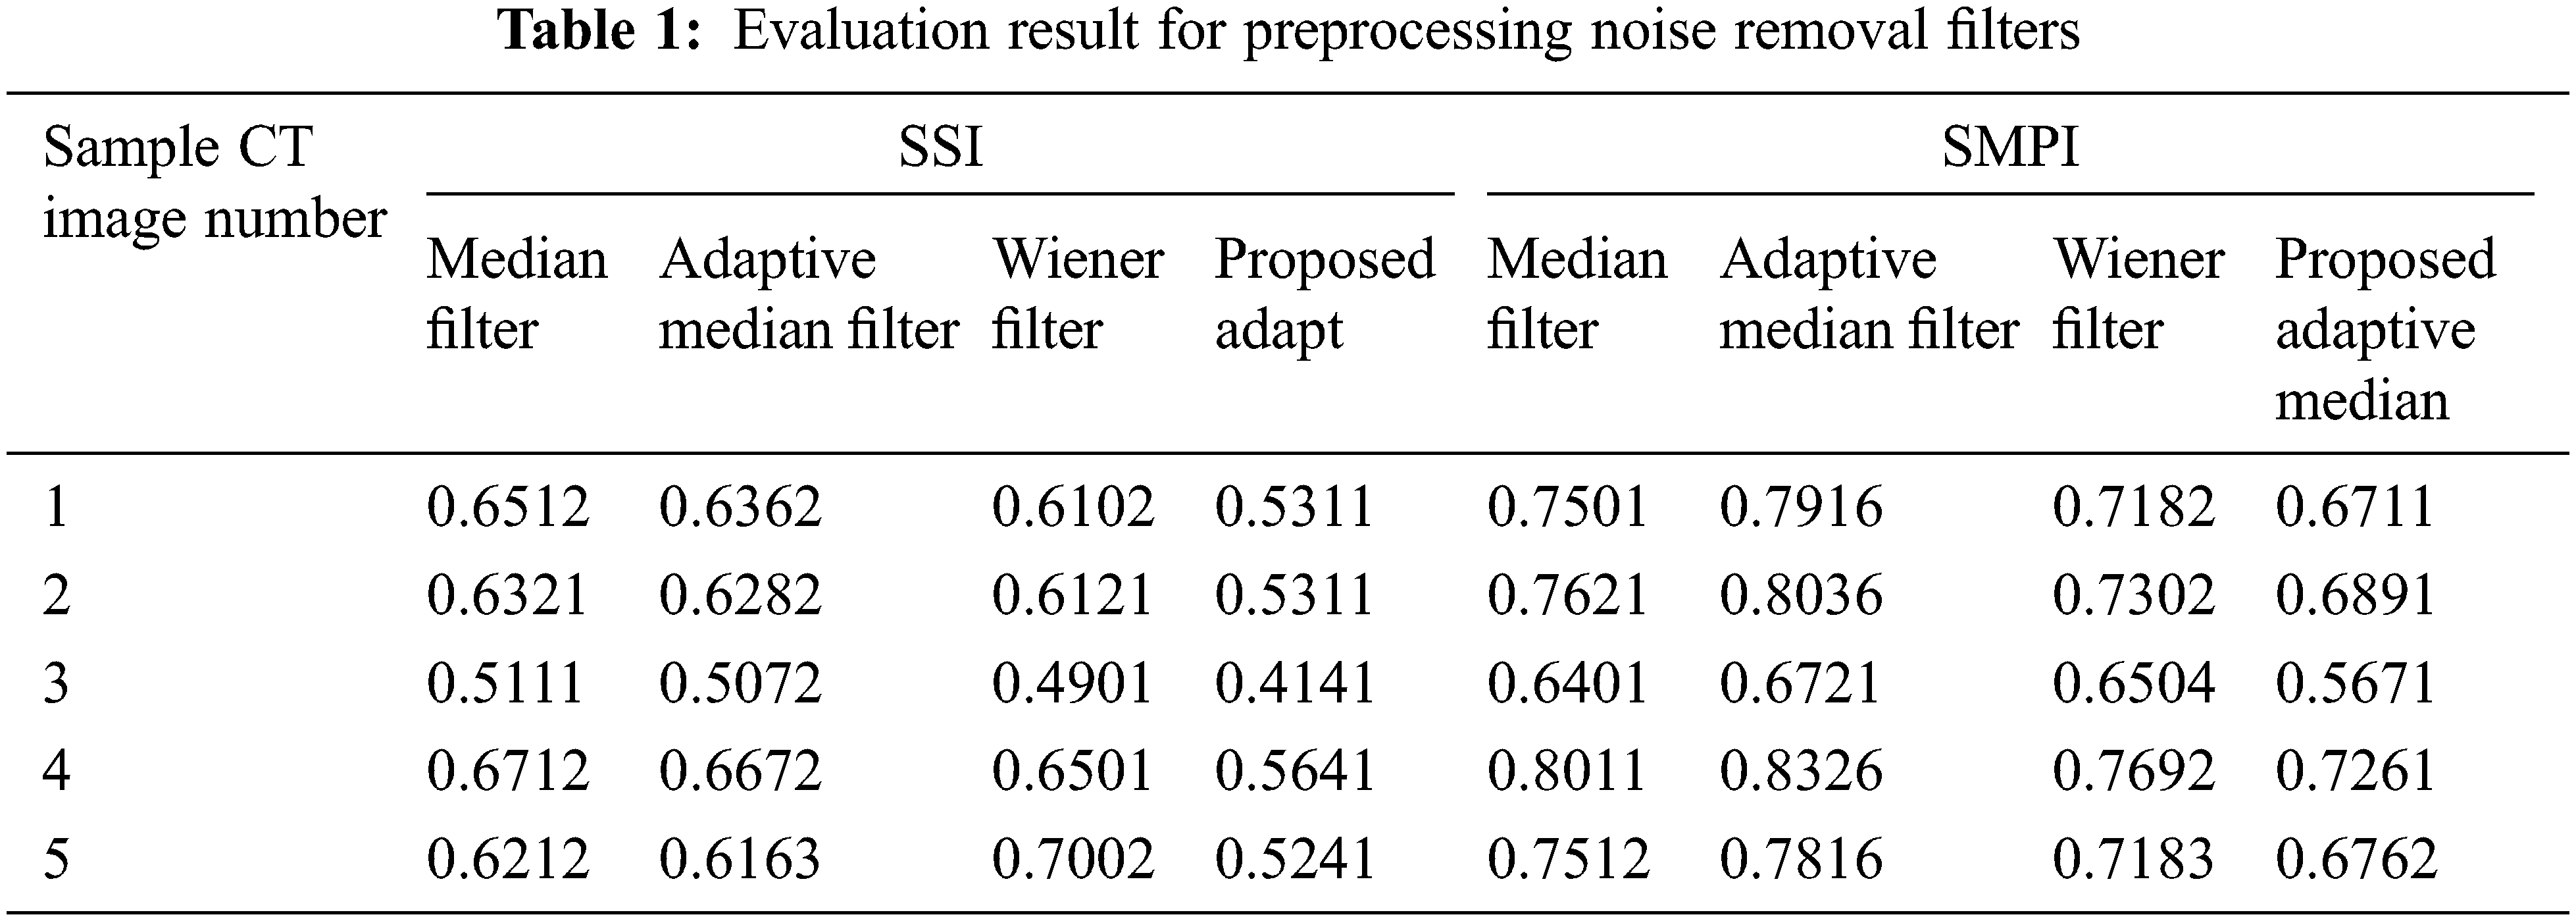
4.1 Evaluation of Preprocessing
In the preprocessing stage, the filters such as Adaptive median and wiener filter combination are used in the proposed system. This is compared with other filters to prove the performance of the proposed preprocessing system in terms of the Speckle Suppression Index (SSI) and Speckle Suppression and Mean Preservation index (SMPI). SSI value is a linear minimum mean-square error filter value, and it can be reassessed similarity between pixels as shown in Eq. (27). SMPI value determines the lower values that give better performance of the filter in terms of mean preservation and noise reduction as shown in Eqs. (28) and (29).
where
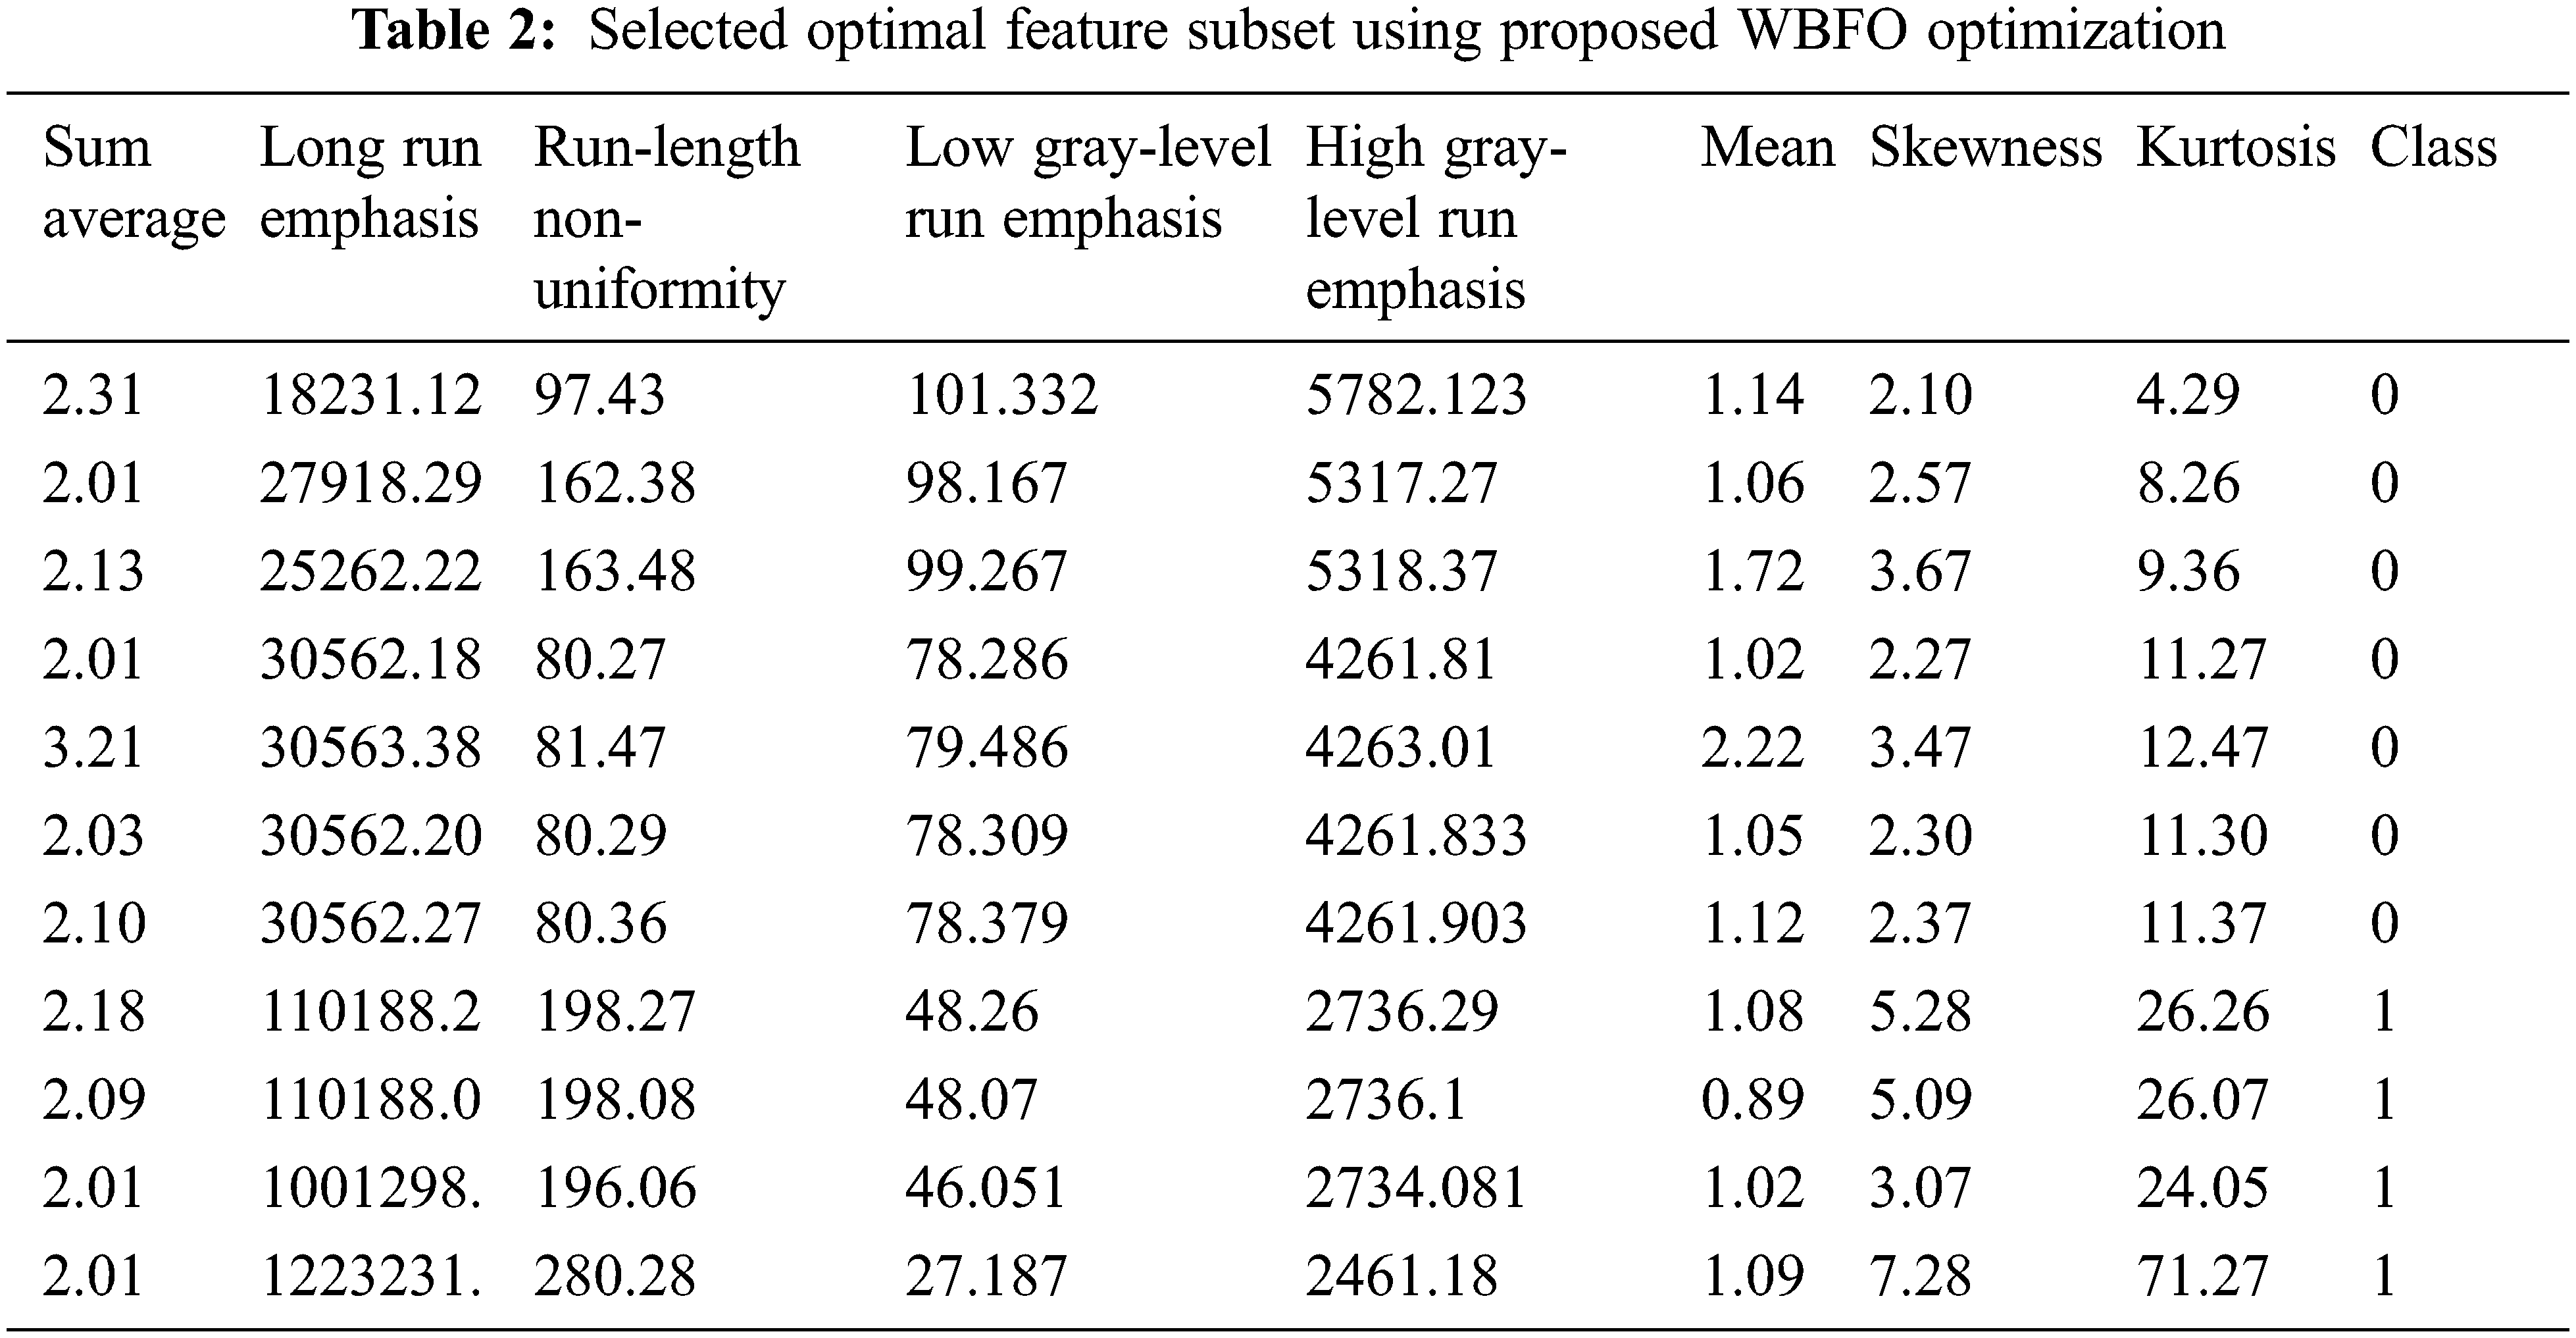
4.2 Evaluation of Feature Extraction Method
The evaluation of the proposed feature extraction with optimization using WBFO is shown in Tab. 2. The optimized threshold value obtained by WBFO is compared with the standard Whale optimization algorithm (WOA) and Bacterial foraging optimization (BFO). Based on the proposed WBFO optimization, we selected first-order texture features kurtosis, skewness, and uniformity, and for gray level matrix, we also selected Run-length Nonuniformity Low gray-level to run emphasis High gray-level run emphasis for Gray level run length matrix features.
4.3 Evaluation of Classification System
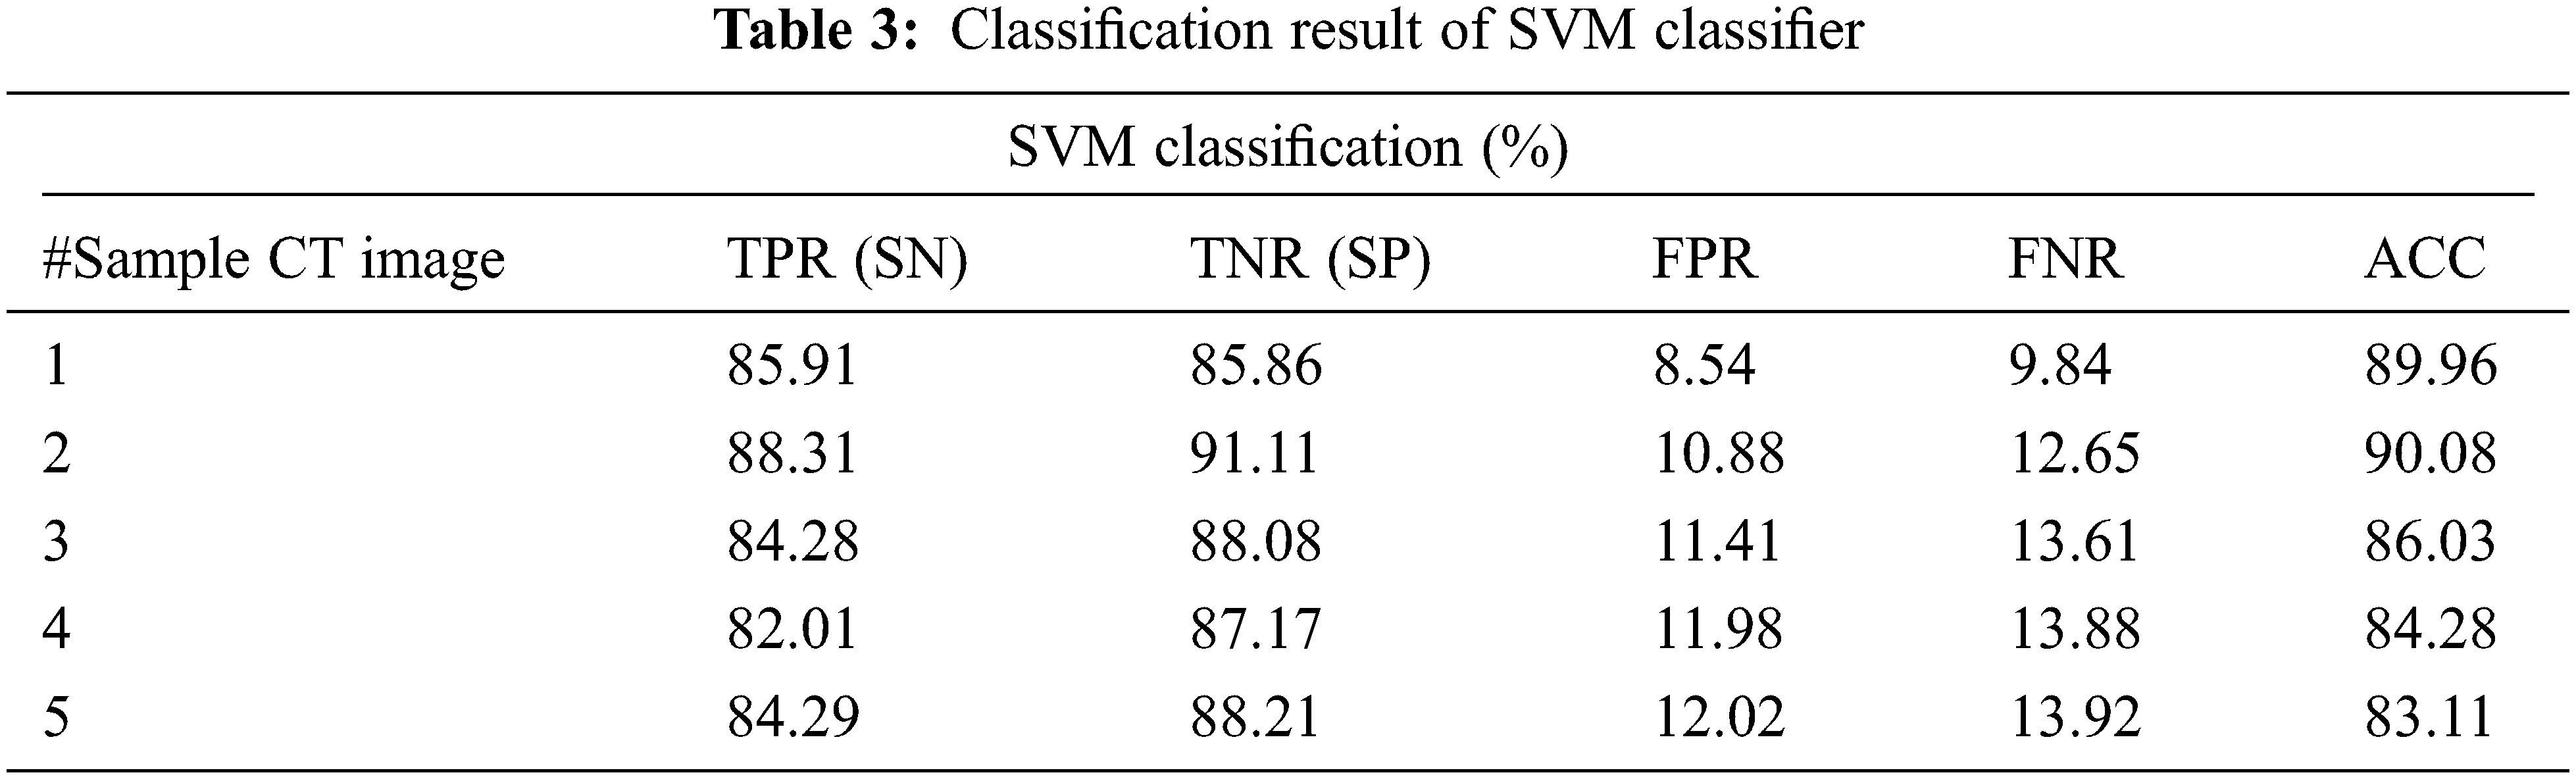
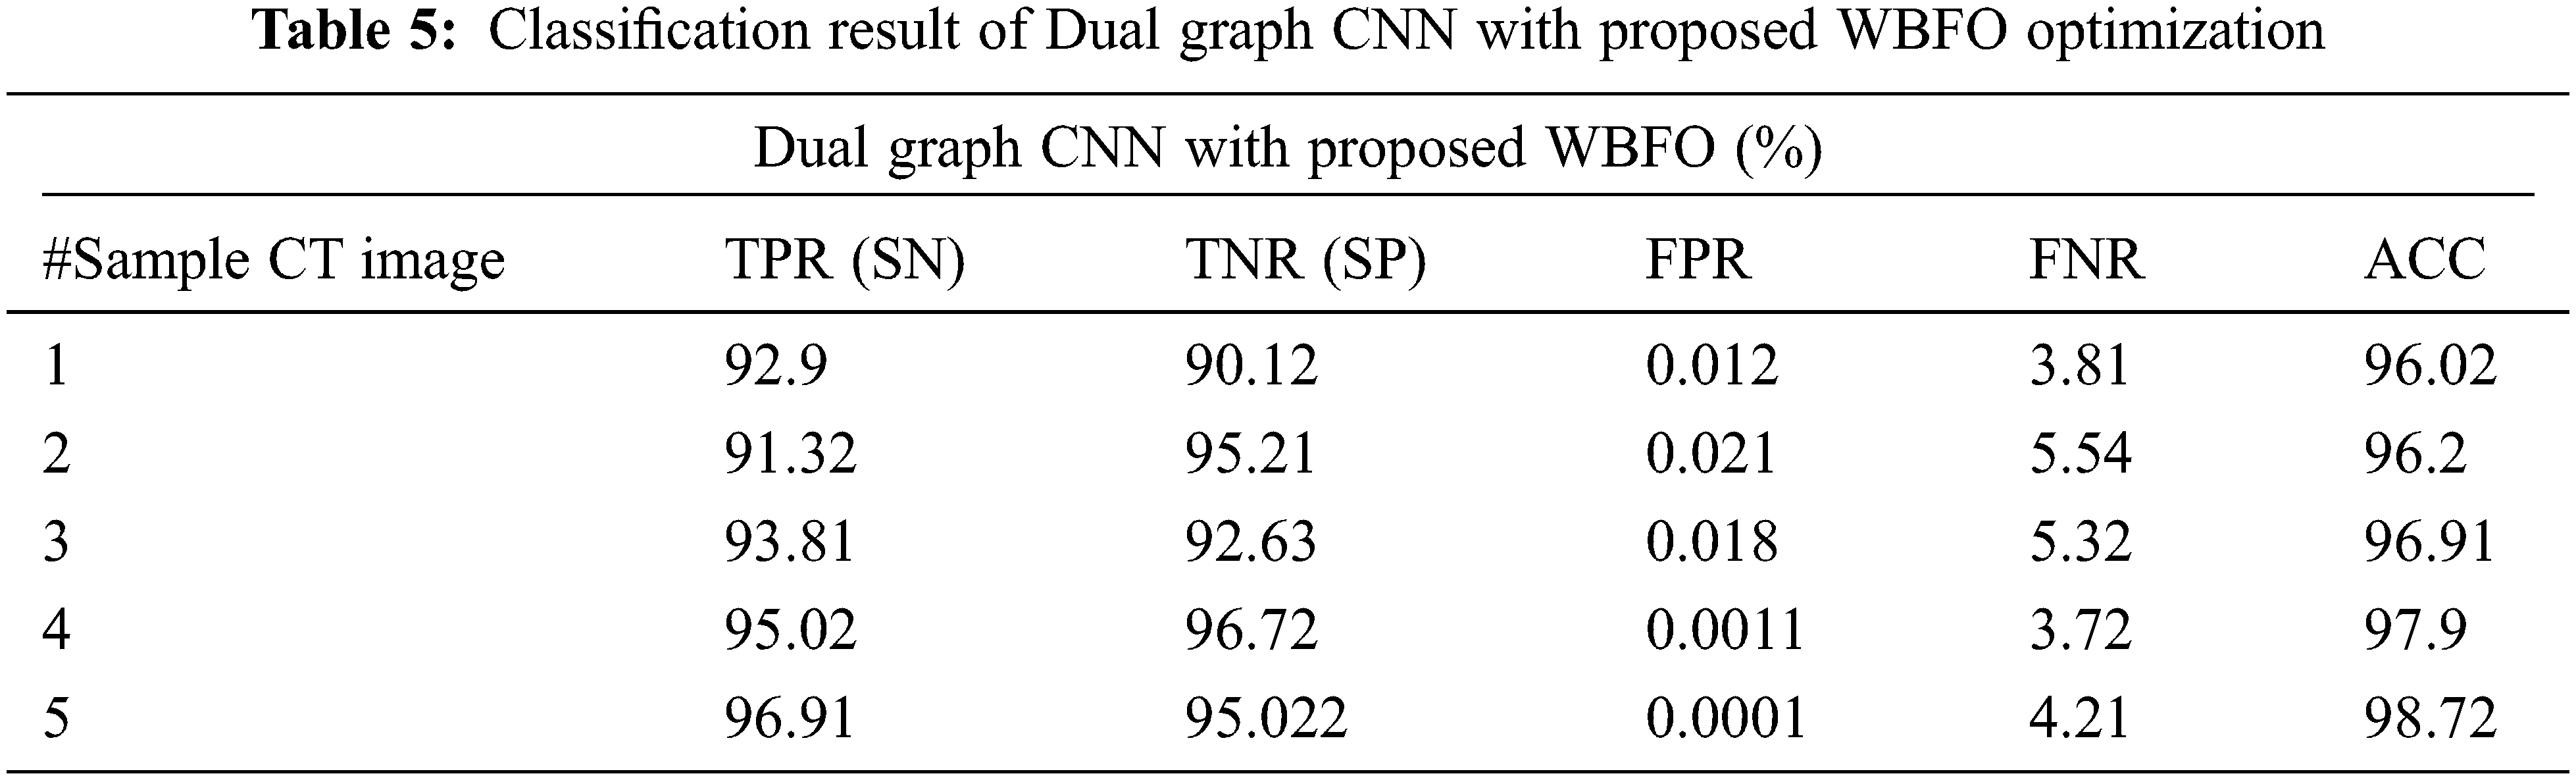
The proposed smart lung tumor detection using Dual graph CNN with an optimized feature set using WBFO has been evaluated with the parameters such as accuracy, sensitivity, and specificity. The proposed classification system with WBFO is compared with standard classification with traditional classifiers such as support vector machine (SVM), convolutional neural network (CNN), and Dual graph CNN without WBFO. The evaluated results are shown in Tabs. 3–6. The overall comparative analysis in terms of the accuracy of the classification system is shown in Fig. 6.
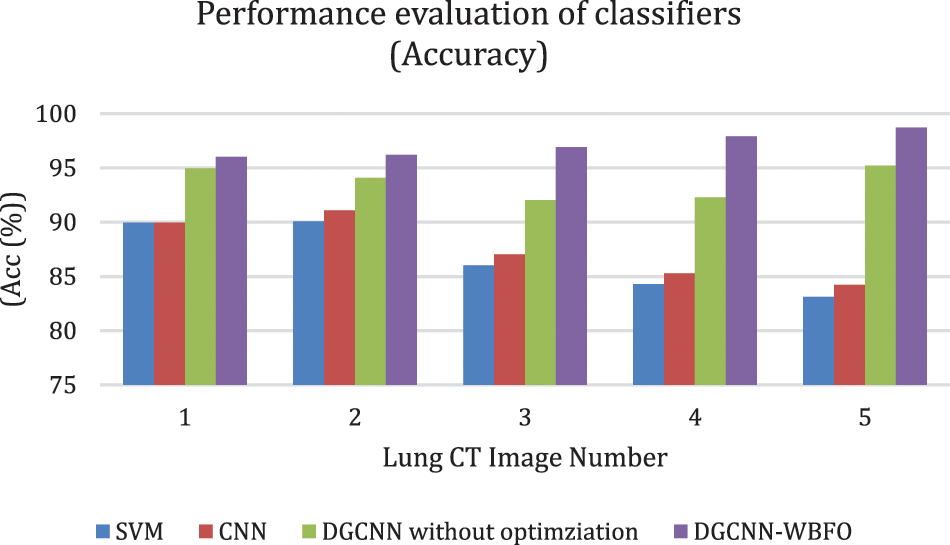
Figure 6: Accuracy comparison of classifiers
As a result of various evaluations, it has been demonstrated that the proposed lung cancer detection system is effective when the proposed WBFO-based optimization of feature selection is combined with a Dual Graph CNN classifier. Contrary to other classifiers such as SVM, CNN, and DGCNN without optimization, the proposed system ensured high accuracy. The accuracy of sample image 5 was determined by the machine learning approaches to be 83.11%, 84.22%, and 95.22%, respectively. The proposed optimization approaches enhance the result of the Dual graph CNN classifier and increase the accuracy percentage to 98.72%. Consequently, the proposed WBFO evolutionary approach improves the classification accuracy of the detection of lung tumors and non-lung tumor images.
The proposed DGCNN with WBFO secures the index percentage as shown in Tab. 5. CNN achieved 87.91%, 87.87%, and 89.96% for TPR, TNR, and AUC for the sample CT images number 1. Whereas SVM achieved 85.91% 85.86% and 89.96% and DGCNN generated 92.9%, 90.12% and 96.02% respectively. The sample result analysis for lung tumors is shown in Tab. 6. Thus, the proposed WBFO improves the similarity index values, thereby proving the efficiency of the proposed system. In all types of statistical analyses, the proposed WBFO enhances the lung CT image feature selection and classification system for efficient lung tumor prediction.
Early diagnosis of lung tumors is very important in determining the type of treatment that should be administered to the patient as well as taking preventative measures to lengthen the life of the patient. Using evolutionary and deep learning methods, we present a novel approach to the diagnosis of lung tumors. Preprocessed images are normalized and, adaptive median filters with wiener filters are applied to the input images. After the image has been normalized and enhanced, the tumor region is segmented using thresholding and morphological operations. To improve the accuracy of decision-making, the various features of lung CT images are extracted using GLCM, GLRLM, and HOG to obtain statistical information on the features. To enhance the feature selection process, the fused WFO method is used. With the proposed system, lung tumor detection accuracy was evaluated at 98.72% using graph dual CNN. It is compared with support vector machines, standard CNNs, and DGCNNs without optimization. In comparison to existing algorithms, the proposed approach is shown to be effective through performance analysis using various metrics. To enhance the performance of the proposed system, various medical imaging and other meta-heuristic approaches will be added to the proposed work in the future.
Acknowledgement: The author thanks the Deanship of Research, Prince Sattam Bin Abdul-Aziz University, KSA, for providing an opportunity to conduct research.
Funding Statement: The author received no specific funding for this study.
Conflicts of Interest: The author declares that he has no conflicts of interest to report regarding the present study.
References
1. M. Kurkure and A. Thakare, “Introducing automated system for lung cancer detection using evolutionary approach,” International Journal of Engineering and Computer Science, vol. 5, no. 5, pp. 16736–16739, 2016. [Google Scholar]
2. S. Makaju, P. Prasad, A. Alsadoon, A. K. Singh and A. Elchouemi, “Lung cancer detection using CT scan images, ”Procedia Computer Science, vol. 125, no. 1, pp. 107–104, 2018. [Google Scholar]
3. C. Szegedy, W. Liu, Y. Q. Jia, P. Sermanet, S. Reed et al., “Going deeper with convolutions,” in Proc. of the IEEE Conf. on Computer Vision and Pattern Recognition, Boston, MA, USA, pp. 1–9, 2015. [Google Scholar]
4. N. Mesanovic, M. Grgic, H. Huseinagic, M. Males, E. Skejic et al., “Automatic CT image segmentation of the lungs with region growing algorithm,” in 18th Int. Conf. on Systems, Signals and Image Processing-IWSSIP, Marlbor, Slovenia, pp. 395–400, 2011. [Google Scholar]
5. J. John and M. G. Mini, “Multilevel thresholding based segmentation and feature extraction for pulmonary nodule detection,” Procedia Technology, vol. 24, pp. 957–963, 2016. [Google Scholar]
6. A. Humeau-Heurtier, “Texture feature extraction methods: A survey,” IEEE Access, vol. 7, pp. 8975–9000, 2019. [Google Scholar]
7. C. Zu, Y. Wang, L. Zhou, L. Wang and D. Zhang, “Multi-modality feature selection with adaptive similarity learning for classification of Alzheimer’s disease,” in 2018 IEEE 15th Int. Symp. on Biomedical Imaging ISBI 2018, Washinton, USA, pp. 1542–1545, 2018. [Google Scholar]
8. J. Nalepa and M. Kawulok, “Selecting training sets for support vector machines: A review,” Artificial Intelligence Review, vol. 52, no. 2, pp. 857–900, 2019. [Google Scholar]
9. D. C. R. Novitasari, A. Lubab, A. Sawiji and A. H. Asyhar, “Application of feature extraction for breast cancer using one order statistic, GLCM, GLRLM, and GLDM,” Advances in Science, Technology and Engineering Systems Journal (ASTESJ), vol. 4,. no. 4, pp. 115–120, 2019. [Google Scholar]
10. D. Zhang, J. Hu, F. Li, X. Ding, A. K. Sangaiah et al., “Small object detection via precise region-based fully convolutional networks,” Computers, Materials and Continua, vol. 69, no. 2, pp. 1503–1517, 2021. [Google Scholar]
11. J. Zhang, J. Sun, J. Wang and X. G. Yue, “Visual object tracking based on residual network and cascaded correlation filters,” Journal of Ambient Intelligence and Humanized Computing, vol. 12, no. 8, pp. 8427–8440, 2021. [Google Scholar]
12. A. Teramoto, H. Fujita, O. Yamamuro and T. Tamaki, “Automated detection of pulmonary nodules in PET/CT images: Ensemble false-positive reduction using a convolutional neural network technique,” Medical Physics, vol. 43, no. 6 Part 1, pp. 2821–2827, 2016. [Google Scholar]
13. N. Zheng, G. Loizou, X. Jiang, X. Lan and X. Li, “Computer vision and pattern recognition,” International Journal of Computer Mathematics, vol. 84, no. 9, pp. 1265–1266, 2007. [Google Scholar]
14. S. Vijh, D. Gaur and S. Kumar, “An intelligent lung tumor diagnosis system using whale optimization algorithm and support vector machine,” International Journal of System Assurance Engineering and Management, vol. 11, no. 2, pp. 374–384, 2020. [Google Scholar]
15. P. Kavitha and G. Ayyappan, “Lung cancer detection at early stage by using SVM classifier techniques,” Int J Pure Appl Math, vol. 119, no. 12, pp. 3171–3180, 2018. [Google Scholar]
16. T. Messay, R. C. Hardie and S. K. Rogers, “A new computationally efficient CAD system for pulmonary nodule detection in CT imagery,” Medical Image Analysis, vol. 14, no. 3, pp. 390–406, 2010. [Google Scholar]
17. M. Bari, A. Ahmed, M. Sabir and S. Naveed, “Lung cancer detection using digital image processing techniques: A review,” Mehran University Research Journal of Engineering & Technology, vol. 38, no. 2, pp. 351–360, 2019. [Google Scholar]
18. S. Kumar, T. K. Sharma, M. Pant and A. K. Ray, “Adaptive artificial bee colony for segmentation of CT lung images,” Int J Comp App iRAFIT, vol. 5, pp. 1–5, 2012. [Google Scholar]
19. G. T. Herman, “Image reconstruction from projections,” Real-Time Imaging, vol. 1, no. 1, pp. 3–18. 1985. [Google Scholar]
20. U. Reddy, B. Reddy and B. Reddy, “Recognition of lung cancer using machine learning mechanisms with fuzzy neural networks, ”Traitement du Signal, vol. 36, no. 1, pp. 87–91, 2019. [Google Scholar]
21. S. Vijh, S. Sharma and P. Gaurav, “Brain tumor segmentation using OTSU embedded adaptive particle swarm optimization method and convolutional neural network,” in Data Visualization and Knowledge Engineering, springer, Cham, pp. 171–194, 2020. [Google Scholar]
22. S. Uzelaltinbulat and B. Ugur, “Lung tumor segmentation algorithm,” Procedia Computer Science, vol. 120, pp. 140–147, 2017. [Google Scholar]
23. P. Joon, S. B. Bajaj and A. Jatain, “Segmentation and detection of lung cancer using image processing and clustering techniques,” in Progress in Advanced Computing and Intelligent Engineering, Springer, Singapore, vol. 713, pp. 13–23, 2019. [Google Scholar]
24. J. Wang, Y. Wu, S. He, P. K. Sharma, X. Yu et al., “Lightweight single image super-resolution convolution neural network in portable device,” KSII Transactions on Internet and Information Systems (TIIS), vol. 15, no. 11, pp. 4065–4083, 2021. [Google Scholar]
25. M. Prabukumar, L. Agilandeeswari and K. Ganesan, “An intelligent lung cancer diagnosis system using cuckoo search optimization and support vector machine classifier,” Journal of Ambient Intelligence and Humanized Computing, vol. 10, no. 1, pp. 267–293, 2019. [Google Scholar]
26. S. M. Naqi, M. Sharif and I. U. Lali, “A 3D nodule candidate detection method supported by hybrid features to reduce false positives in lung nodule detection,” Multimedia Tools and Applications, vol. 78, no. 18, pp. 26287–26311, 2019. [Google Scholar]
27. S. R. Zhou and B. Tan, “Electrocardiogram soft computing using hybrid deep learning CNN-ELM,” Applied Soft Computing, vol. 86, pp. 1–11, 2020. [Google Scholar]
28. C. Bhuvaneswari, P. Aruna and D. Loganathan, “A new fusion model for classification of the lung diseases using genetic algorithm,” Egyptian Informatics Journal, vol. 15, no. 2, pp. 69–77, 2014. [Google Scholar]
29. P. M. Shakeel, M. A. Burhanuddin and M. I. Desa, “Lung cancer detection from CT image using improved profuse clustering and deep learning instantaneously trained neural networks,” Measurement, vol. 145, pp. 702–712, 2019. [Google Scholar]
30. Y. G. Kim, S. M. Lee, K. H. Lee, R. Jang, J. Seo et al., “Optimal matrix size of chest radiographs for computer-aided detection on lung nodule or mass with deep learning,” European Radiology, vol. 30, no. 9, pp. 4943–4951, 2020. [Google Scholar]
Appendix A:

Cite This Article
 Copyright © 2023 The Author(s). Published by Tech Science Press.
This work is licensed under a Creative Commons Attribution 4.0 International License , which permits unrestricted use, distribution, and reproduction in any medium, provided the original work is properly cited.
 Downloads
 Citation Tools