
 Submit a Paper
 Propose a Special lssue
 Open Access
ARTICLE
An Integrated Multilayered Framework for IoT Security Intrusion Decisions
Umm Al-Qura University, Makkah, 225400, KSA
* Corresponding Author: Hassen Sallay. Email:
Intelligent Automation & Soft Computing 2023, 36(1), 429-444. https://doi.org/10.32604/iasc.2023.030791
Received 01 April 2022; Accepted 05 May 2022; Issue published 29 September 2022
 View Full Text
 Download PDF
Abstract
Security breaches can seriously harm the Internet of Things (IoT) and Industrial IoT (IIoT) environments. The damage can exceed financial and material losses to threaten human lives. Overcoming these security risks is challenging given IoT ubiquity, complexity, and restricted resources. Security intrusion management is a cornerstone in fortifying the defensive security process. This paper presents an integrated multilayered framework facilitating the orchestration of the security intrusion management process and developing security decision support systems. The proposed framework incorporates four layers with four dedicated processing phases. This paper focuses mainly on the analytical layer. We present the architecture and models for predictive intrusion analytics for reactive and proactive defense strategies. We differentiate between the device and network levels to master the complexity of IoT infrastructure. Benefiting from the singularity of IIoT devices traffic, we approach the reactive security intrusion prediction through outlier detection models mean. We thoroughly experiment with ten outlier detection models on the IIoT wustl realistic dataset. The obtained results show the adequacy of the approach with an area under the curve (AUC) results surpassing 98% for several models with a good level of precision and time efficiency. Furthermore, we investigate the use of survival analysis semi-parametric predictive models to forecast the security intrusion before its occurrence for the proactive security strategy. The experiments show encouraging results with a concordance index (c-Index) reaching 89% and an integrated brier score (IBS) of 0.02. By integrating outlier intrusion detection and survival forecasting, the framework provides a valuable means to monitor the security intrusions in IoT.Keywords
Ensuring information technology infrastructure safety and business continuity is a necessity nowadays. As known, security attacks in digital legacy systems cause critical damages and induce significant losses in the worldwide economy. Despite the continuous efforts in the security field, the risk is still imminent and even exacerbated with the emergence of the Internet of Things and the 5G communication networks. The IoT incorporates digital data in servers and real devices that individuals directly interact with, such as wearable devices in healthcare networks, smart cars, smart homes, manufacturers, and smart cities. According to [1], IoT will reach 41.6 billion devices by 2025 and 75 billion by 2030, becoming ubiquitous. These devices differ in their hardware platforms, communication protocol, and tasks to perform depending on the application domains. They are also very limited in memory and processing capabilities. For instance, in industrial IoT, many telemetry devices are commonly used. These deployed devices perform interesting collection and control functions to enhance productivity while ensuring compliance with industry standards. Unfortunately, since security is considered a secondary concern for the manufacturers, the IoT devices are full of vulnerabilities. Users unaware of security risks do not take the necessary security precautions, such as changing the device’s default configurations. Moreover, being an infected mobile device, moving everywhere propagates the malware and contaminates the global network [2]. Given the complexity induced by IoT, deciding on security intrusion becomes an unstructured problem requiring an integrated decision with great accuracy.
This paper proposes an integrated multilayered framework supporting security intrusion decisions in IoT. The proposed framework facilitates the orchestration of the security intrusion management process and provides a means to develop decision support systems for security intrusion. On the other hand, the IoT devices perform specific tasks yielding singular traffic. This feature makes them different from generic purpose devices such as computers which perform several tasks generating different kinds and forms of traffic. This singularity and stability of IoT devices’ traffic simplify their behavior prediction and justify our idea to approach security intrusion as an outlier detection problem. Therefore, this paper investigates a variety of outliers detection models existing in the literature when instantiating the framework in the context of industrial IoT.
Moreover, this paper investigates the use of survival analysis techniques in intrusion forecasting. The need for preventive security management justifies this choice by forecasting the security attacks instead of only predicting their occurrence. Such forecasting is very crucial since it transforms security management strategy from reactive to proactive one, which helps to (1) prevent or minimize the damage a security attack could induce and therefore ensure the business continuity and daily work activities, (2) improve the readiness of security response team to intervene at the right time and take the adequate security defensive measures by performing the necessary security checks (3) ensure efficient and cost-effective management by supporting the security staff in their decisions and facilitating their work by removing unnecessary tasks increasing, therefore, their productivity. By orchestrating the proposed outlier detection model, the survival-based forecasting model, and other security components, we profit from their power of prediction and forecasting for security intrusion. Therefore, we improve the security analytics process in the complex environment of IoT and IIoT. Section 2 presents the related work. Section 3 shows the proposed framework and gives a bird view of its layers. Section 4 presents the architecture of the components of the analytical layer, instantiates it in the IIoT context, and experiments with the use of outlier models for detection and the survival analysis for forecasting in industrial IoT. Section 5 concludes the paper and gives some future work.
The related works present research efforts related to the intrusion and outlier detection in IoT, the security frameworks associated with IoT, and survival analysis and its use for intrusion forecasting in IoT.
2.1 Intrusion and Outlier Detection
An intrusion detection system (IDS) is placed either on hosts or inside the network. While misuse-based IDSs inspect network packets and host logs to detect the attack, the anomaly-based systems mimic the normal/abnormal behavior of the network/hosts and then see any deviation from the learned behaviors to generate security alerts. The anomaly-based methods are used mainly due to their ability to detect new unseen attacks by exploiting the statistical characteristics of the traffic and logs rather than the content itself, which is usually encrypted. Their success was mainly supported by the emergence of machine learning and deep learning techniques. The models used in machine learning are either discriminative or generative. The discriminative models learn how to separate between normal and abnormal data points without considering how these data points were generated [3–5]. On the contrary, the generative approaches model the latent data generation law using probabilistic and statistical technics [6,7]. Deep learning uses neural networks with many hidden layers discriminating between normal and abnormal behaviors. The main drawback of the deep learning-based approach is its unexplainably result. It is considered a black box making it hard for the security officer to know the root causes of the security attacks or anomalies. Note that deep learning can be seen as a generative approach with the emergence of generative adversarial networks [8]. Several works based on machine learning for security intrusion in IoT were proposed in the literature. They perform classification for supervised learning with labeled datasets or clustering for unsupervised learning with unlabeled datasets. [9] propose misuse intrusion detection solutions by training various discriminative models such as support vector machine, naïve Bayes, decision tree, random forest, and fully convolutional neural networks to classify the traffic and detect the attacks. [10,11] propose various anomaly-based solutions based on a vanilla autoencoder and an ensemble of encoders. The outlier detection, investigated thoroughly in this paper, can be categorized into methods using linear, proximity-based, probabilistic, and ensemble-based models. Principal component analysis (PCA), Minimum covariance determinant (MCD), and One-class support vector machines (OCSVM) are linear outlier detection models. PCA uses the sum of weighted projected distances to the eigenvector hyperplane as an outlier score. MCD uses the Mahalanobis distances as a score, whereas OCSVM uses the SVM discrimination approach for one class. On the other hand, Local outlier factor (LOF), Clustering-based local outlier factor (CBLOF), Histogram-based outlier score (HBOS), and K nearest neighbors (KNN) are proximity-based outlier detection models. Angle-based outlier detection (ABOD), Isolation forest (IF), and Feature bagging are considered probabilistic and ensemble learning-based outlier detection models. The reader is referred to [12] for in-depth details of outlier detection models. While these models were thoroughly studied in different contexts, up to our knowledge, there not been fully experimented on IoT, where the intrusion security problem is more appropriate to be approached by outlier detection methods given the singularity of IoT devices’ traffic. Furthermore, most of the proposed solutions neglect architectural design and management issues and treat the problem of security intrusion partially.
On the other hand, many IoT frameworks for securing IoT were proposed in the literature. The OWASP IoT security verification standard is a framework to verify the devices’ security after their development through checklists and questionnaires. A more mature framework is the ETSI303645 which gives detailed instructions for the basic security of IoT devices. The IoT security compliance framework extends the security to the business process level. There are also guidelines of ENISA that could be consulted. These frameworks guide professionals in the specification, design, and procurement of IoT devices. The authors in [13,14] survey works related to security frameworks dedicated to IoT security. The works focus on the security and privacy of the IoT device, network, and service layers. [15] focus on the IoT framework related to the trust concerns. [16] compares four security frameworks dedicated to secure IoT compliance and deployment according to ISO27001 standard. [17] focuses on the implementation guidance frameworks of IoT security. [18] proposes a security framework for IoT within a set of enhancement techniques provided for IoT devices’ security. The surveyed works either focus on generic IoT security architectures at a specific layer such as device, network, or services or are specific to a security property such as privacy, trust, and compliance or address IoT information security from the point of view of risk analysis and management. They are not specific for IoT security intrusion and are very specific or very generic to be instantiated for IoT intrusion. Moreover, they do not incorporate dedicated ingredients for security analytics to support IoT security intrusions monitoring decisions. [19] proposes decision support systems for security intrusion for the classical Internet and therefore inappropriate to the IoT context. Furthermore, they are limited in analytics used techniques and architectural deployment. The authors in [20] propose a cross-layer framework by aggregating information from IoT devices, networks, and services layers. They propose a generic approach to deal with vulnerabilities technically without focusing on intrusion analytics. Therefore, a security framework is required to tackle IoT intrusion security in an integrated manner. That framework should incorporate the different aspects of intrusion security from different and complementary points of view. One view angle is to fortify the intrusion detection process by forecasting the intrusion before its occurrence. In this paper, we take profit from survival analysis for that purpose.
In the survival analysis approach, we track the sample subjects (in our case, device/network) until the occurrence of an event (in our case, security intrusion) to the subject or be censored from the sample [21,22]. Survival analysis strength consists in considering this so-called censored data in its statistical analysis. Contrary to regression models that neglect these subjects, losing consequently precious information, the survival analysis considers censored data. It considers this uncertainty, making it possible to predict the probability of event occurrence at a specific time instead of predicting only the event happening time. This exciting feature justifies our choice of investigating survival analysis and its applicability for security intrusion in IoT. Usually, censored data is very common in IoT devices for three reasons. Firstly the IoT devices periodically enter idle status to preserve their limited resources in energy. Secondly, IoT devices are susceptible to loose connections due to intentional and unintentional reliability problems. Thirdly, the IoT devices’ monitoring is usually not continuous, introducing a set of periods in which the IoT devices are not tracked.
There are three kinds of survival models: nonparametric, semiparametric, and parametric. Unlike the nonparametric survival models, the semiparametric and parametric survival models include independent variables. The Nelson-Aalen estimator and Kaplan-Meier are the most popular nonparametric survival models [21]. Nelson-Aalen estimator sums up hazard function over time (cumulative) to estimate hazard function. Kaplan-Meier takes the ratios of subjects without events over those at risk and multiplies that over time to estimate the survival function of an entire group or cohort. Among the most popular semiparametric models comes Cox proportional hazard (CPH) model [21,22], assuming that time and features are proportional. While the risk function is usually expressed via a linear representation in CPH, the non-linear model was recently introduced in [23], providing more modeling flexibility by using Neural Networks (NN) within the original design. Introduced in [24], the Multi-Task Logistic Regression (MTLR) model is an alternative to the CPH model. MTLR involves a series of logistic regression models built on different time intervals. Within each, it estimates the event occurrence probability. Neural-MTLR was introduced in [25], incorporating NN within the original MTLR design for modeling flexibility. When it is possible to approximate the hazard and survival function distributions, or we have prior knowledge of them, the parametric models are used rather than the semiparametric models in which the time component of the hazard function is left unspecified. By doing so, we obtain better results for forecasting, and the returned risk rate and survival functions will be smoother [26–28].
While survival analysis is widely used in medicine, engineering, and sociology, to name a few, it is surprisingly rarely used in the security field. We only find two works in the literature. The first presents a host-based intrusion detection system based on the Cox model. The system forecasts insider threats for the CERT dataset. This work is inadequate for the IoT context since the dataset is generated by generic devices and not IoT devices [29]. The second presents a survival network-based IDS. It forecasts intrusion on the controller area network bus system. The controller manages the communication between the mobile electronic control units [30]. Unfortunately, the developed system is limited to the modern automobile context.
3 Framework for Security in IoT (A Bird-Eye View)
A framework is a structure around which people will build something. In this paper, the intended framework aims to build decision support systems for security intrusion in IoT environments. The three main design criteria considered for the proposed framework are broadness, comprehensiveness, and Multifaceted. Broadness means that the framework must cover many IoT environments different in size, complexity, and security criticality. Comprehensiveness means that the framework must cover all kinds of analytics required for accurate decision-making. Structuring these analytics is a cornerstone to building a successful intrusion decision support system. Multifaceted means that the framework should span across the whole security kill chain. In other words, the framework should incorporate the main components that can track the security intrusions in their different evolution stages in time and space.
Although a framework is not intended to be a solution, it has to help security professionals flexibly provide a set of keys for their intrusion security problems. These three main design criteria ensure the flexibility and usability of the framework. They also serve to evaluate the framework by domain experts. The validity of a framework is generally performed by instantiating the framework for a specific study context. In this paper, only the analytical component of the framework is partially instantiated for industrial IoT. Mainly we focused on identifying and experimenting with the appropriate models and techniques for intrusion detection and forecasting in the IIoT context. Consequently, the validation is limited to chosen models and techniques by a set of proper commonly used evaluation metrics. The complete instantiation of the whole framework and its experimentation in real or simulated IIoT context will be a subject of a future publication.
The proposed framework incorporates four layers with four processing phases (Fig. 1).
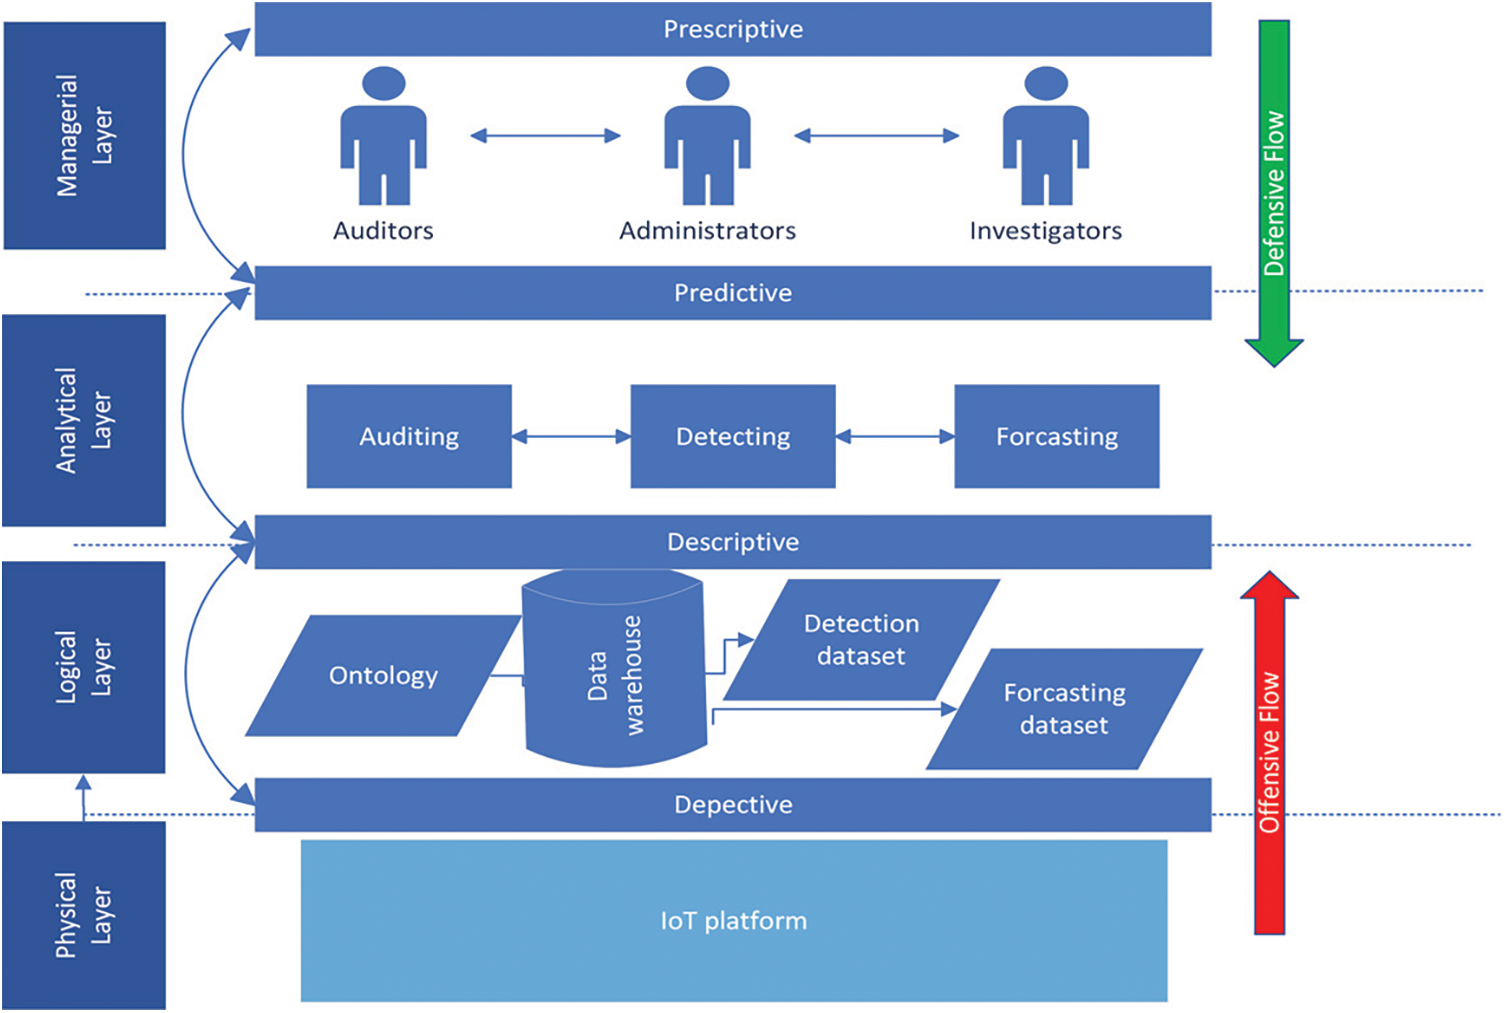
Figure 1: IoT intrusion decision support framework
3.1 Physical Layer (Where All Things Happening)
The physical layer (PL) reflects the real IoT platform where all things are happening. The platform connects IoT devices through different network technologies and protocols. It could be specific for e-health, smart home, manufacturers, or smart cities. The depictive phase is concerned with collecting data using watching agents. These watchers sniff the network traffic and control the IoT device to trace and extract all possible valuable data. Data can be the network normal/malicious traffic, devices’ activity logs, occurring failures, network topological changes, and devices’ mobility traces. Existing tools and utilities for IoT can be used as watchers. It is also where the security agents such as firewalls and intrusion detection/prevention systems are placed. These agents implement the algorithms and models specified by the predictive phase in the analytical layer and enforce the execution of the defensive security operations according to the prescriptive phase from the managerial layer. From an architectural view, the IoT devices are connected to the local network via wireless access points connected to the global Internet via a traditional router or via a software-defined network (SDN) switch. This router or SDN switch plays the role of a gateway in which we can enforce the execution of our security measures. In SDN-based IoT, they will be hosted in the controller applications. We then use OpenFlow for the gateway/controller communication, and the flows’ features can be directly extracted in the gateway by packet forwarding plane programming. For non-SDN platforms, the watchers and security agents are hosted in a local server since the IoT devices are limited in memory and processing.
3.2 Logical Layer (What was Happened? What is Happening)
The second layer is the logical layer (LL). It is the layer where the raw collected data will be structured. Since the primary goal of the framework is to manage the security intrusion based on an in-depth process of analytics, a data warehouse database appears as a prime choice. Indeed, the data warehouse will integrate the heterogenous data into one logical view dedicated to producing descriptive reporting. The descriptive phase mainly describes what happened in the IoT platform and what is happening now. We can generate different datasets for the predictive phase in the analytical layer from the data warehouse. These datasets will also be updated by security staff for labeling purposes. An IoT ontology describing the platform and the happening events will be produced. This ontology will be used to automate the auditing process and trace the execution of security policies to detect any policy breaches. Forensics processes should take many precautions in data collection and manipulation to satisfy the constraints for the admissibility of evidence in court. In a large IoT platform with big data scenarios, the collected data will be stored in a private cloud. If we opt for a public cloud, appropriate techniques should be applied to ensure the trust and privacy of the shared data.
3.3 Analytical Layer (What Will Happen? Why Will it Happen)
The third layer is the analytical layer (AL). It is the layer where predictive analytics is performed. Three principal coordinating processes are coupled to give a clear view of security intrusions in the past (Auditing process), the present (Detection process), and the future (Forecasting process). The auditing process uses the ontology to generate new detection rules to support the detection process. It also uses the outputs of detection and forecasting processes to update the security policies or develop new ones. The detection process is concerned with detecting intrusions timely. The detection can be performed through misuse-based, anomaly-based, or knowledge-based approaches or any hybrid mixing. The output of auditing/forecasting processes is directly incorporated through detection rules for misuse and knowledge-based detection. For anomaly-based detection, mainly based on machine learning, the datasets generated in the descriptive phase are used for the learning process. The learning can be online to keep the prediction process updated and ensure more accurate predictions. Note that the auditing/forecasting information is indirectly considered through the update process of the datasets by the auditing/forecasting processes. The forecasting process has paramount importance for the analytical and managerial layers since it gives insight into what will happen. It tunes the detection process by enhancing the accuracy, precision, and the security staff’s readiness by supporting them to take adequate actions. The forecasting process uses the updated dataset generated in the descriptive phase, prepared explicitly for forecasting techniques such as times series and survival analysis.
3.4 Managerial Layer (What We Should Do? Why We Should Do So?)
The fourth layer is the managerial layer (ML). The problem of intrusion detection for IoT cannot be seen as a structured problem where simple operational measures can solve the problem. It is either a semi-structured or unstructured problem depending on the complexity of the IoT platform and the criticality of the provided services. Security staff (Auditors, Administrators, and Investigators) need a sort of support system for security purposes to make the appropriate decisions and therefore take adequate actions. In the perspective phase, three types of decisions should be there: the operational, the tactical, and the strategical. The strategic decisions serve to secure the IoT platform from offensive attacks by reducing the risks to acceptable levels according to the security requirements of the application domain. They are generally few, stable, but critical, and should be built on detailed planning based on the predictive phase taking the security from different angles. The tactical decisions are needed to deal with the platform dynamics and security status changes, flexibly serving the strategic plan. The auditing/forecasting processes support taking adequate tactical security defensive decisions. The operational decisions insight security procedures executing the tactical plan, and preventing an attack before it occurs. The proposed framework guides the development of decision support systems for security intrusion for semi-structured or unstructured problems. For the rest of the paper, we focus on the analytical layer. More specifically, we will investigate the detection and forecasting processes.
4 Analytical Layer: Architecture and Instantiation for Industrial IoT
Since the behavior of IoT devices is very predictable compared to general-purpose equipment such as classic devices, a dedicated lightweight Host Intrusion Detection System (HIDS) coexisting with a Network Intrusion Detection System (NIDS) is appropriate from an architectural view. Therefore, we approach the problem through two levels of granularity of intrusion control: fine (device level) and coarse (network level). Fig. 2 exhibits the architecture of components involved in the analytical layer. Each device has its intrusion detection, forecasting, and auditing component for the device level. For the global network, there will also be the same components. Still, the models used for the forecasters and detectors differ from those of devices’ models in terms of model construction and model learning methods. The auditing component is also integrated to detect the breach in policies and applied procedures. As mentioned, the watching agents of the data layers report devices and the global network status of the platform continuously stored in the IoT security data warehouse. We generate learning datasets specific for each device, the global network, and the auditing reports from the data warehouse. Both device and network levels predict the intrusion with a probability of its occurrence in the future.
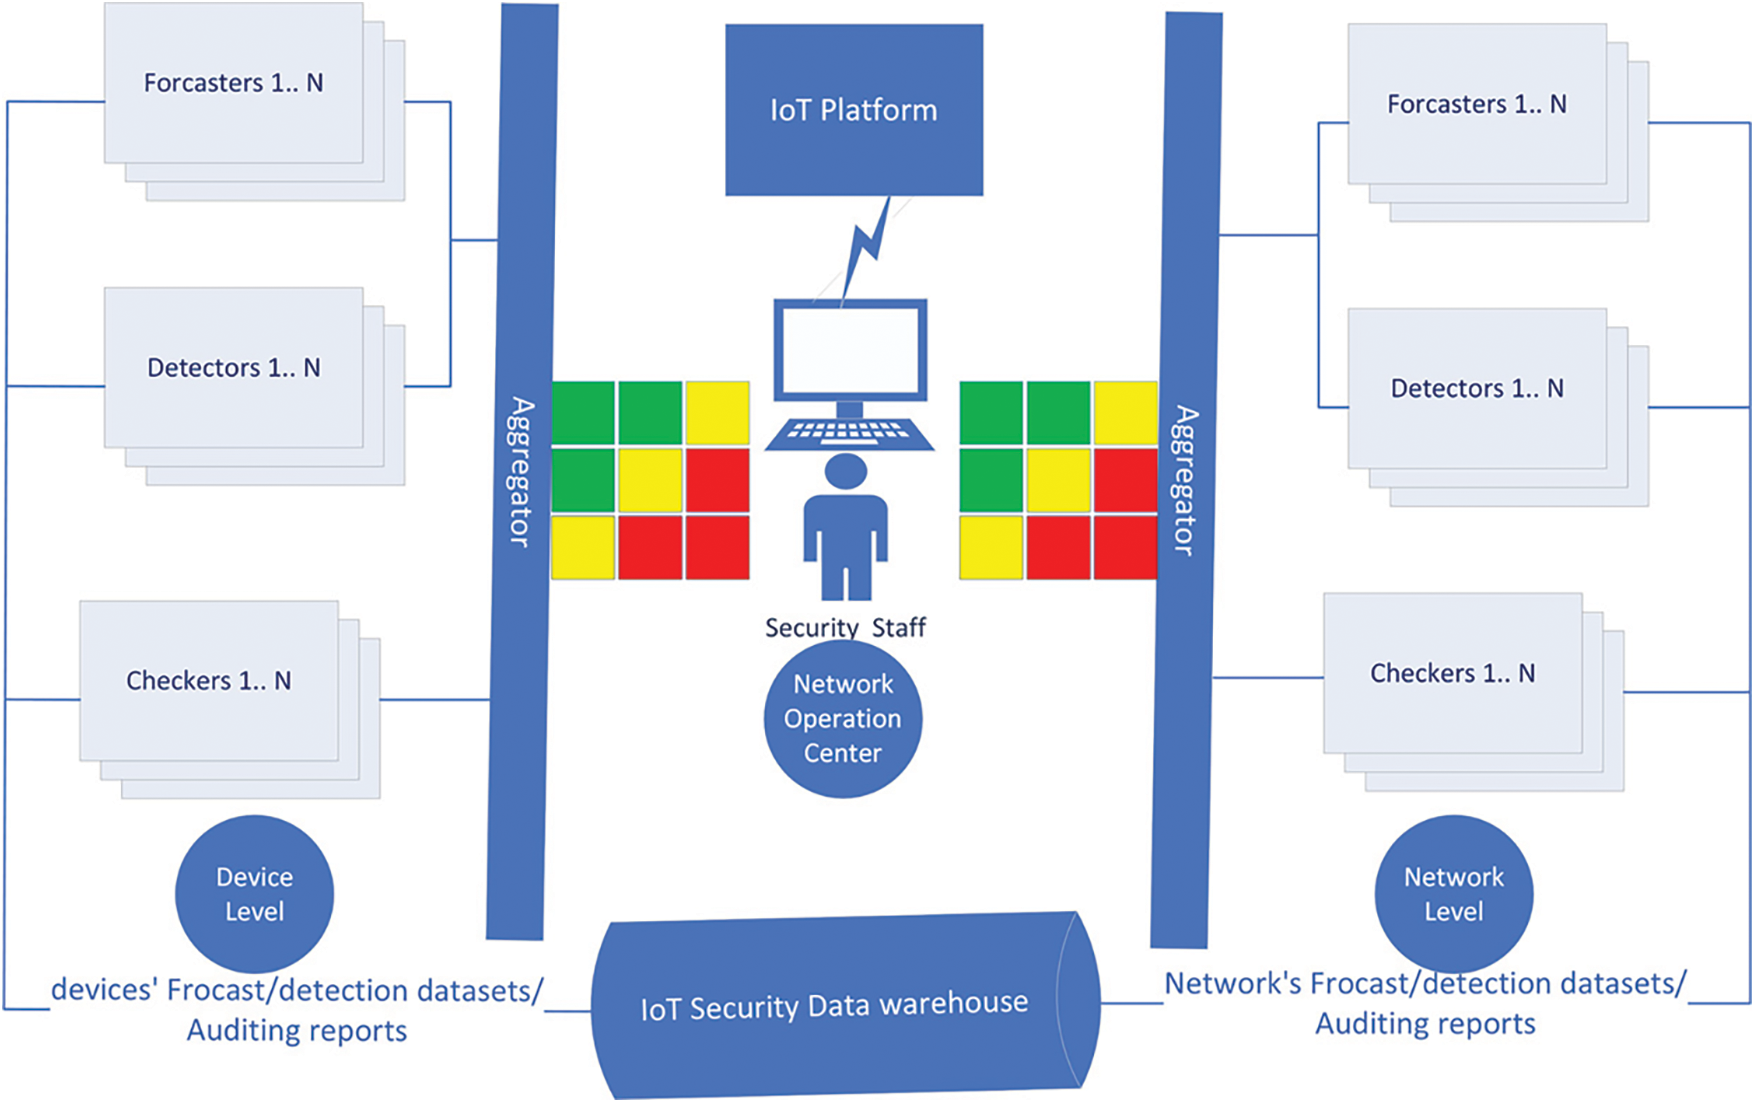
Figure 2: Analytical layer components’ architecture
Using ensemble learning to aggregate the detection and forecasting decisions ensures the prediction and forecasting decision’s stability and reduces its variability. Furthermore, combining the outputs of forecasters with the detectors fortifies and makes the intrusion detection process more accurate. For example, if the detectors trigger an intrusion alert where the forecasters indicate a low probability of an intrusion occurring at that time, this intrusion alert will be given a lower score and therefore ranked low priority score. On the contrary, if the forecasters provide a high probability of intrusion at that time, it tags the alert with a high priority score. Therefore, we construct a risk matrix to reflect the security risk status of each device and the global network. We can use risk ranking techniques, therefore. These risk matrices are very beneficial for the security operation center staff to identify the most likely critical nodes under attack or to be attacked. Moreover, they can be used to filter the false alerts that anomaly-based detectors suffer from. Therefore, they provide a means to prioritize the actions taken and support them in making appropriate decisions. These decisions are then mapped to specific operational actions deployed and executed in the IoT platform. On the other hand, differentiating in security intrusions management between a micro view (device level) and a macro view (network level) is also beneficial, mainly in the context of IIoT, in detecting the type and nature of tuned attacks launched by the intruders and the device malfunction not related to security intrusions. Consider, for example, the two following scenarios: (1) the network level triggers an intrusion alert with high probability, whereas the device level indicates that the device’s status is normal. The security staff can conclude that there is a stealthy denial attack where the traffic is generated internally through the devices infected by malicious code injecting traffic into the network. The injection rate is well-tuned such that it cannot be detected at the device level. Still, the total injected traffic can be reflected and seen when many devices are infected at the network level. Therefore, the security staff classify the attack as an internal attack, identify the malicious nodes, and sanitize them without blocking the external traffic to the IoT network since the problem is internal. (2) Consider now the inverse case, the device level triggers a high priority intrusion alert, but the network level does not; the security staff can wonder if the type of the attack is a denial of service, trying not to exhaust the network resources but the device level ones and therefore deduce that type is the probability an application denial of service attack or the device encounter a malfunctioning failure not related to security intrusion attacks. Therefore, the analysis is guided to explore these two possibilities.
4.2 Instantiation for Industrial IoT
In the following sections, we experiment with the detection and forecasting components of the analytical layer architecture in the industrial IoT context. The auditing and the aggregating processes will be investigated in future work.
4.2.1 Experimenting Outlier Detection for IIoT
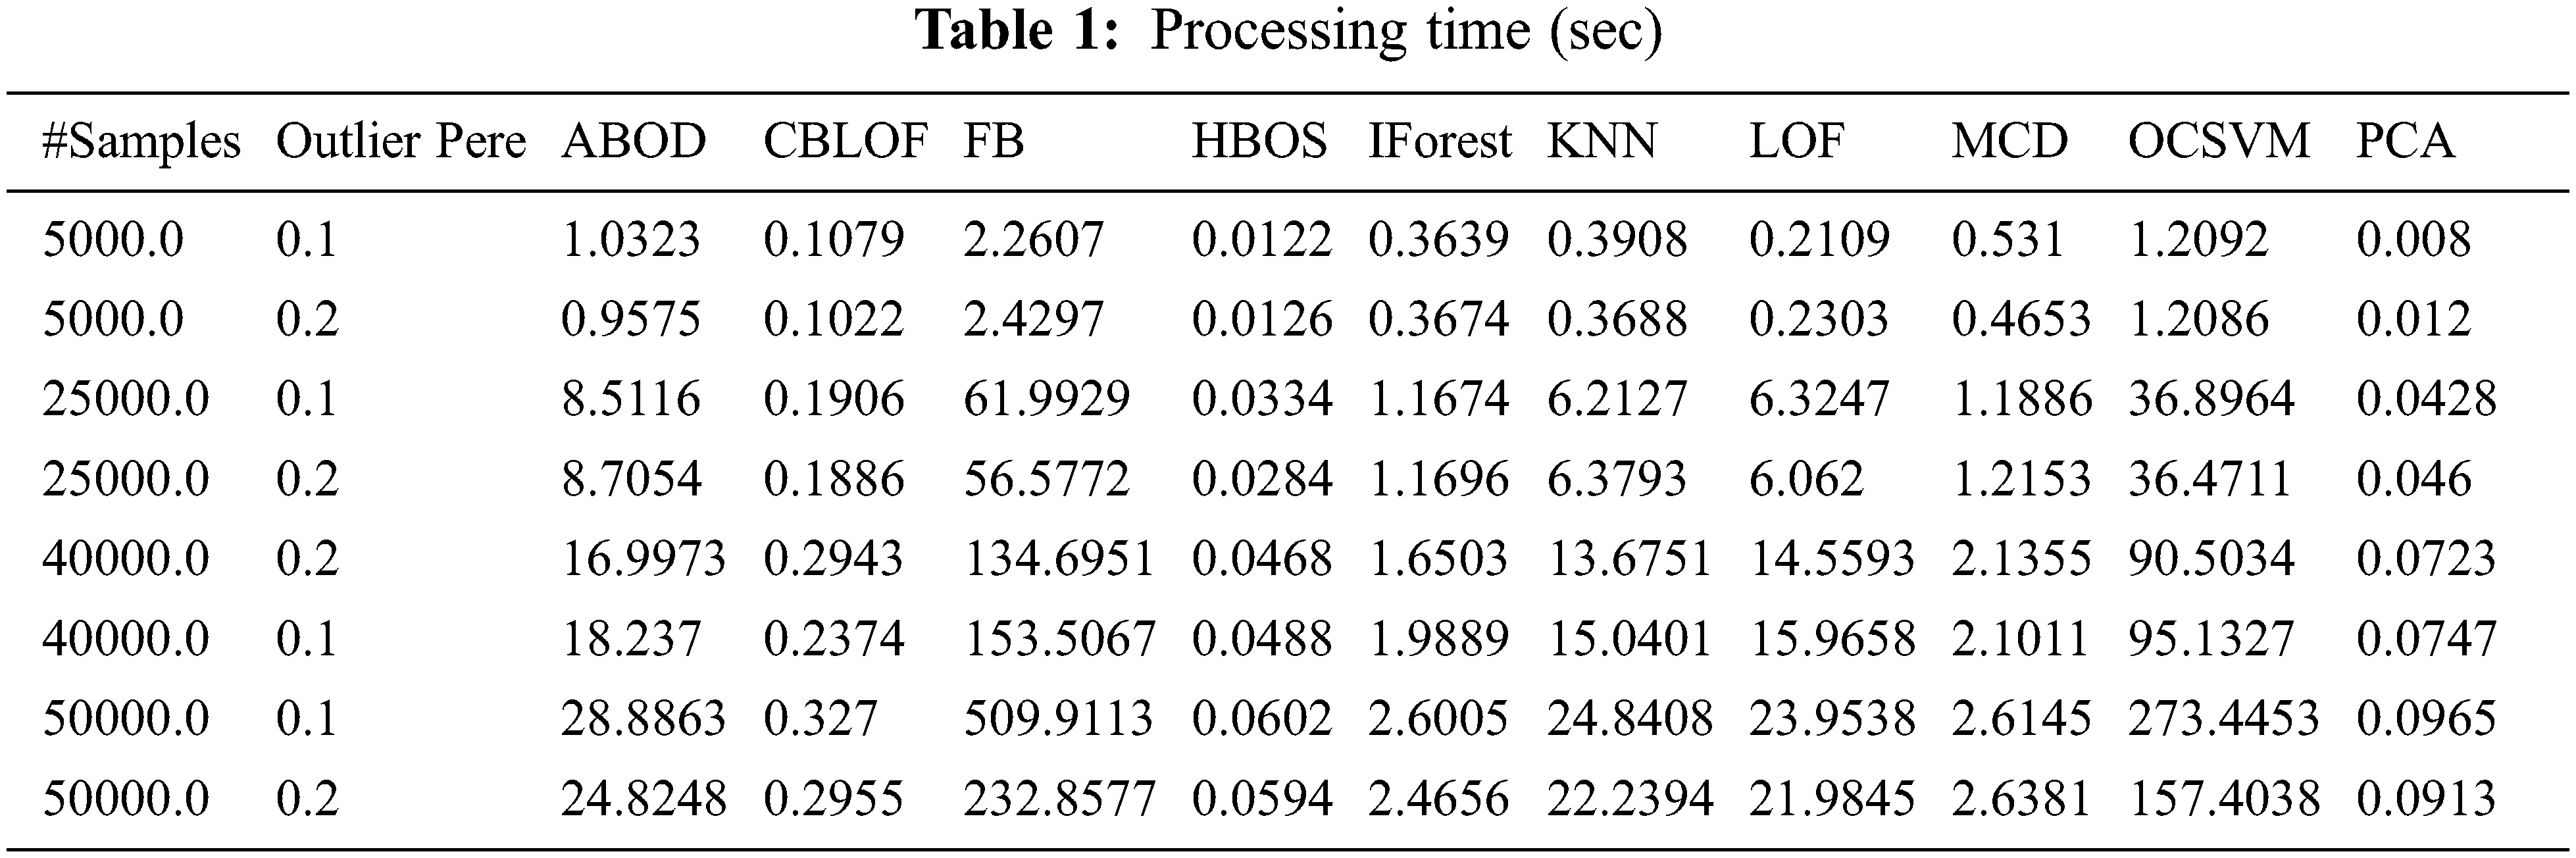
We chose the IIoT wustl dataset to perform our experiments. Wustl is a realistic dataset. We invite the reader to refer to [31] for all the details concerning the used dataset. We preprocessed the dataset. We removed the IP addresses and port numbers as recommended by the authors to be independent of the network used. We transform the categorical feature using a one-hot encoding function, and the numeric values are normalized when normalization is needed using standard and min-max normalization methods. We used a MacBook pro with a 2.3 GHZ intel core i9 with 16GB 2400 Mhz DDR4 to proceed with the experimentations of the outlier models already mentioned in the related work section. We measured the execution time (Tab. 1), the area under the curve (Tab. 2), and the precision (Tab. 3) for each model on different samples and two outlier score percentages (0.1 and 0.2). We note that the execution time generally increases when the sample size increases but slightly changes when the outlier fraction increases. We also note that the Histogram-based Outlier Score (HBOS) and Principal Components Analysis (PCA) score are the most efficient. Still, globally all the methods are efficient except the FB method. Tabs. 2 and 3 show the AUC and precision results. We note that when we increase the outlier fraction of the samples, the accuracy and the precision increase for most methods. We also note that the MCD method is the most robust with the variation of outlier percentage and sample size. Its AUC always remains more significant than 98%. It slightly outperforms PCA and Clustering-Based Local Outlier Factor (CBLOF) methods. PCA and CBLOF are the most efficient methods and beat MCD and Isolation Forest considering the execution time. In terms of precision, these four methods differ only slightly and reach all good levels of precision. PCA performs the best as a tradeoff between accuracy, precision, and efficiency. On the contrary, the BF method performs the worst. We also note that the best methods to deploy in real-time intrusion detection scenarios are the CBLOF and PCA. We can deduce globally that PCA, a linear-based outlier detection method, performs the best tradeoff score but is not far away, especially compared with the CBLOF or MCD and Isolation Forest (IForest). We recommended PCA for real-time IIoT intrusion detection. On the other hand, if we are interested in identifying the root causes of a security intrusion, IForest will be a good option. If we are in an online learning scenario in which we are present with a variation in learning batch sizes, MCD is the most appropriate, mainly when the real-time constraints are relaxed.


4.2.2 Experimenting Survival Analysis for IIoT Forecasting
Survival analysis incorporates three kinds of models: the nonparametric, the semiparametric, and the parametric. Unlike the nonparametric models, we can include independent variables in the semiparametric and parametric. Mostly we use nonparametric estimation to describe the shape of
where
Since the used datasets contain several features, using nonparametric survival analysis is not adequate since we must take profit from our features. Using a fully parametric model is very time-consuming, while the devices and network have power and processing capabilities restrictions. Furthermore, the traffic singularity of the IoT devices and their stability make them very predictable. Using a semi-parametric model is more appropriate given its simplicity and efficiency. For this reason, we selected the MTLR model.
On the other hand, the dataset should incorporate three vectors:
With
C-index (Eq. (2)) generalizes the AUC metric (area under the ROC curve) by considering censored data. It assesses how reliable a model is to rank survival times based on the individual risk scores. Like AUC, a random prediction has a c-index value of 0.5, and when it equals 1, we get the best model prediction. The Brier Score evaluates the accuracy of a predicted survival function at a given time t for a sample of n features vector x as follows. The formula calculates the average squared distances between the observed survival status and the predicted survival probability. Brier index is always a number between 0 and 1, with 0 being the best possible value. In benchmarking, it is shown that a useful model will have a Brier score below 0.25, and if the survival function equals 0.5, then the BS equals 0.25. The integrated Brier Score is just the integration of model performance at all available times.
We experimented MTLR model in the IIoT wustl dataset [31]. Fig. 3 shows the distributions of the traffic types of the datasets within the different security attacks. It reflects the realistic feature of the dataset since, in real IIoT environments, the attacks seem to be outlier traffic given the singularity of IIoT devices traffic. The most common attacks are backdoor, denial of service (DOS), communication injection, and reconnection attacks. As Fig. 3 shows, DOS attacks dominate the other attacks. Indeed, the attackers always overwhelmed IoT devices limited in memory and computational capacities. Fig. 4 presents the censored data and the histogram of the survival time. It reflects the occurrence of the attacks. Fig. 5 shows the loss function used to calculate the concordance index c-index. We get a c-index equal to 89% with an IBS score of 0.02, presenting a very good forecasting performance. Generally, in survival analysis, any IBS less than 25% is acceptable, but the lesser the IBS be better will be.
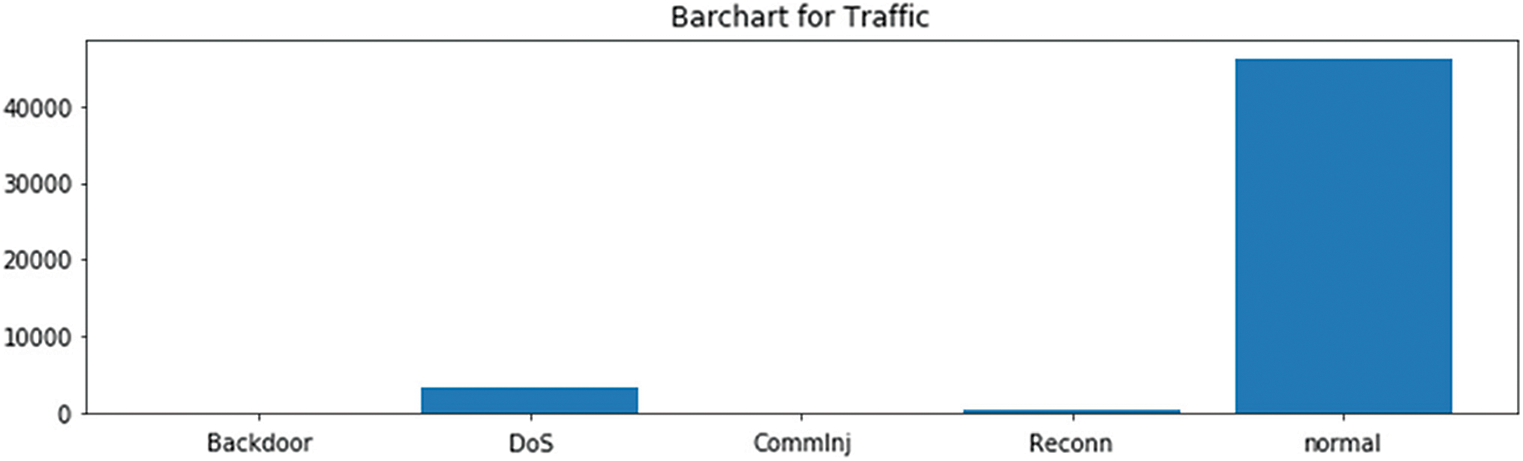
Figure 3: Distribution of normal traffic and attack types
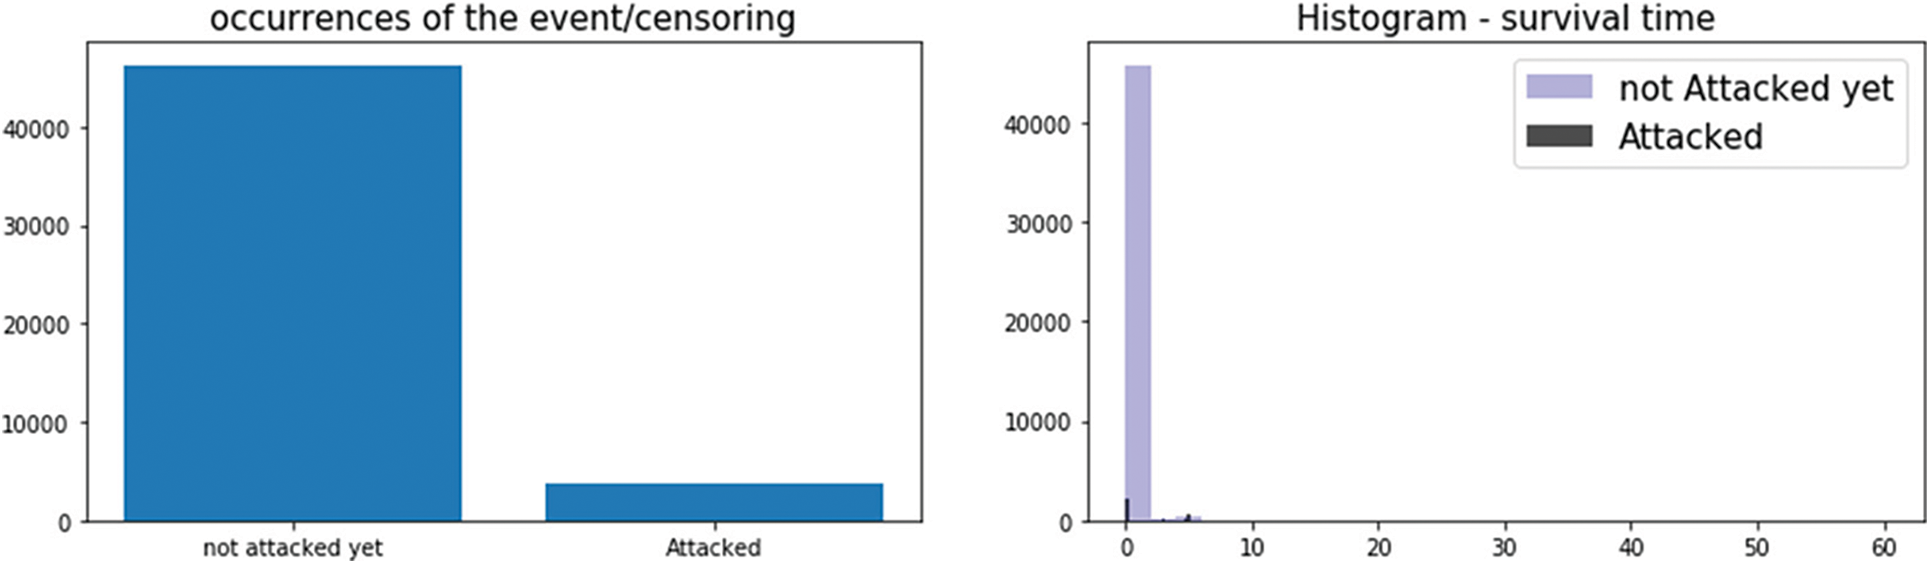
Figure 4: Occurrences of the attacks and survival time
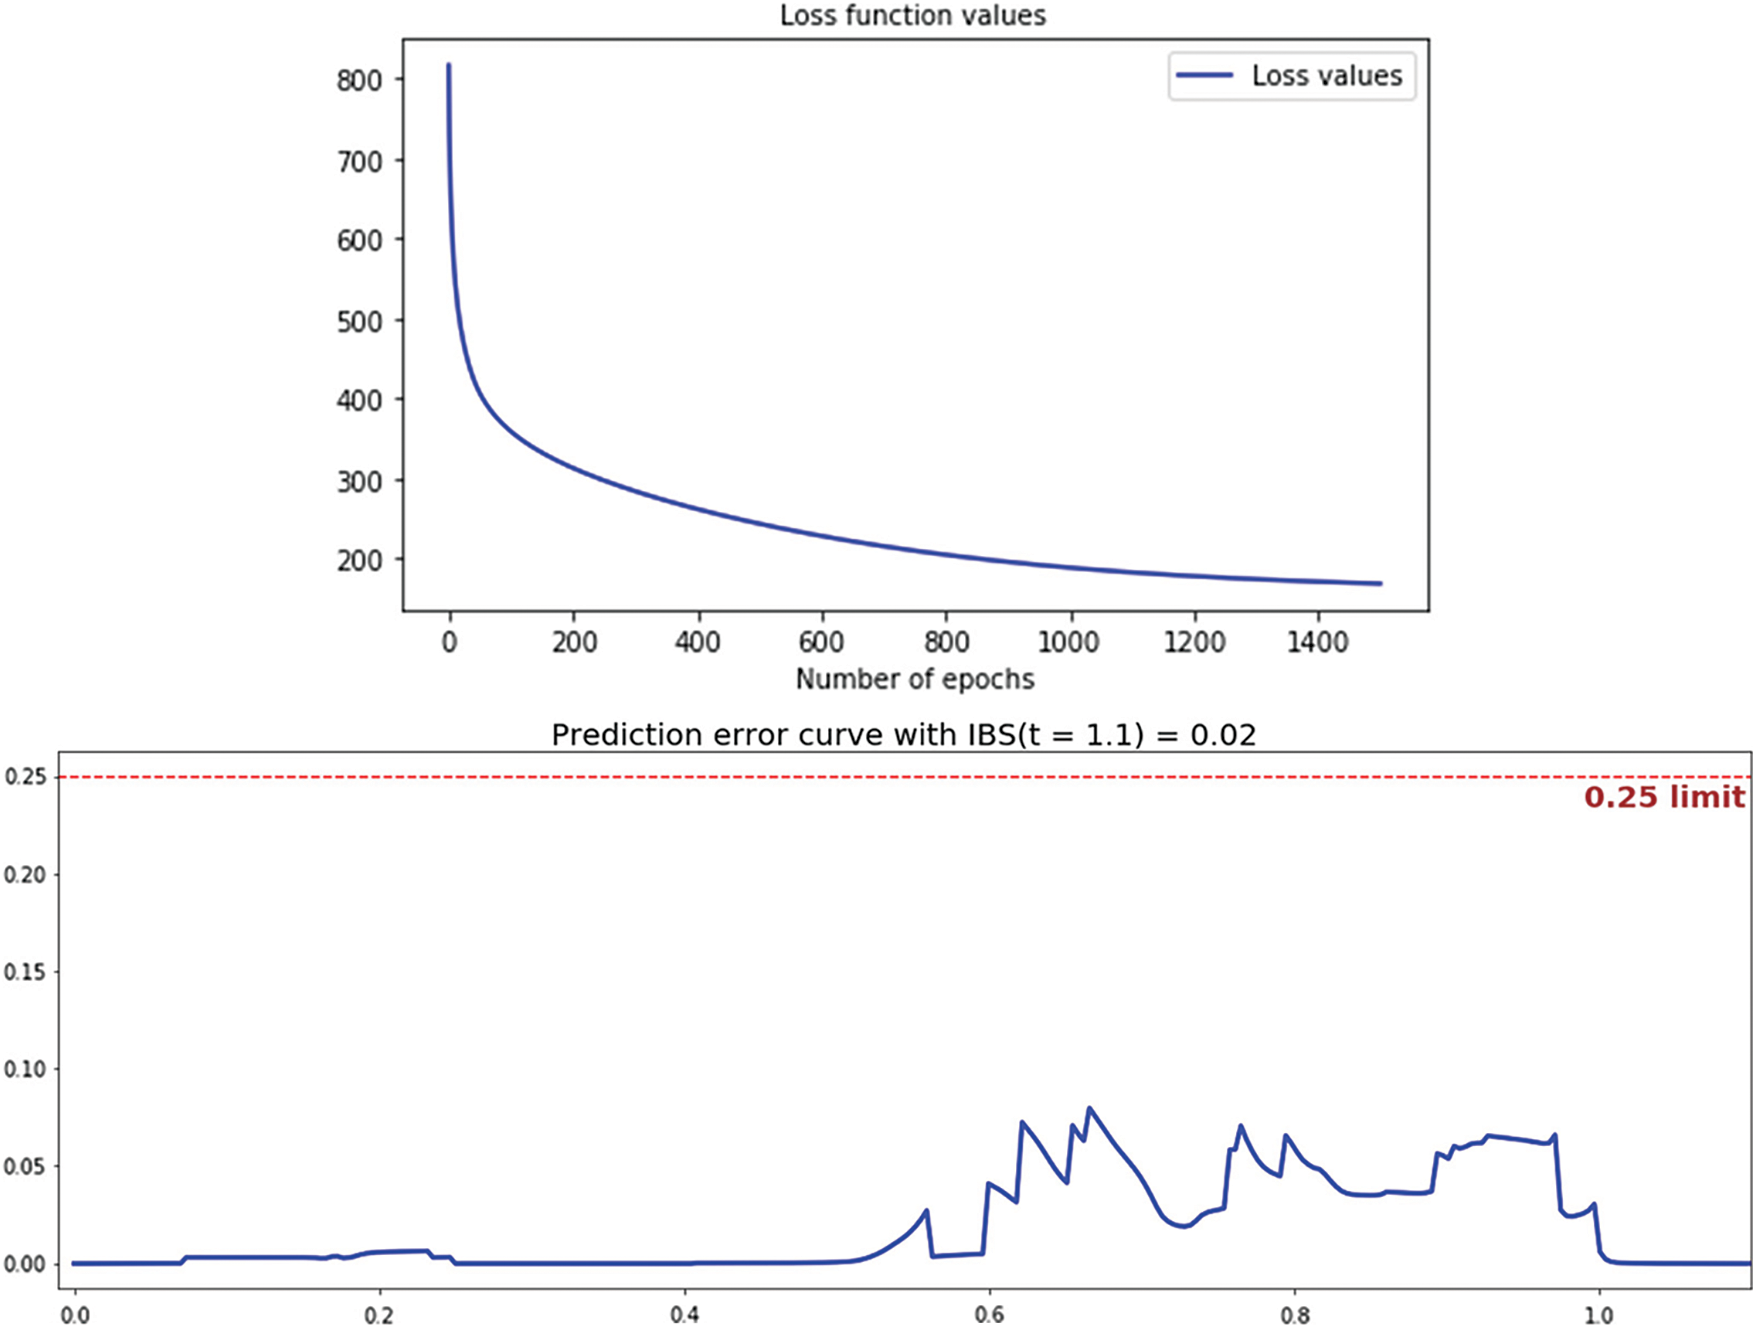
Figure 5: Loss function and IBS prediction error curve
We also compared forecasting, i.e., predicted values, with the actual dataset. Fig. 6 shows this comparison and demonstrates that the forecasting values fit well with actual values. We calculate the error using three metrics; root mean square error (rmse), mean absolute error (mean abs error), and the median absolute error (median abs error). The values shown on the graph are at acceptable levels (see the chart at the top of Fig. 6).

Figure 6: Comparison of actual vs. predicted and survival functions between risk grades
Fig. 6 also shows the risk score distribution. We note that there are three classes of risk scores. These classes are colored red, green, and blue. The security staff specifies the range of each score based on the score distribution (see the graph in the middle of Fig. 6). Finally, Fig. 6 (see the chart at the bottom of Fig. 6) compares the survival function between high, medium, and low risks. This graph is very handy for the security staff. Indeed, it provides them with the risky critical periods the IoT infrastructure is encountering and allows them to be ready and prepared to prevent attacks.
This paper tackles the problem of security intrusion management in IoT. Since the problem is considered an unstructured problem due to IoT environments’ complexity and technical specificity, a decision support system is necessary to manage the security intrusions efficiently. This paper is tentative in proposing a framework dedicated to that purpose. The proposed framework provides integrated components guiding security professionals to approach the security intrusions decision problem. As proof of concept, we instantiate the analytics component of the framework in the context of the industrial IoT. Given the singularity of device traffic in the IIoT, the paper studied and experimented with various outlier methods for intrusion detection. The obtained results confirm the adequacy of such an approach for IIoT. Because security breaches in IoT are critical and can threaten human lives, a preventive and proactive defense strategy is mandatory. We discussed the applicability of the survival analysis approach for IoT security. The experiments show their power and adequacy. Although the framework tries to satisfy the design criteria of broadness, comprehensiveness, and multifaceted, a thorough evaluation by applying the framework in various IoT contexts will reflect its shortcomings and benefits. The framework proposes to couple the forecasting with the prediction to ensure accuracy and management efficiency of security intrusions. We will investigate this coupling thoroughly in the future. Moreover, we intend to incorporate the design of the different layers and couple the auditing with the intrusion decision process. Finally, we will also investigate the architectural issues and the deployment strategies in more detail.
Acknowledgement: The author would like to thank the Deanship of Scientific Research at Umm Al-Qura University for supporting this work by Grant Code: 22UQU4350605DSR01.
Funding Statement: The author would like to thank the Deanship of Scientific Research at Umm Al-Qura University for supporting this work by Grant Code: 22UQU4350605DSR01.
Conflicts of Interest: The author declares that he has no conflicts of interest to report regarding the present study.
References
1. I.D.C. Forecast, “The growth in connected IoT devices are expected to generate 79.4ZB of data in 2025,” https://www.idc.com/getdoc.jsp?containerId=prUS45213219, 2019. [Google Scholar]
2. N. Chaabouni, “Network intrusion detection for IoT security based on learning techniques,” IEEE Communications Surveys & Tutorials, vol. 21, no. 3, pp. 2671–2701, 2019. [Google Scholar]
3. G. Dilara, “A comprehensive survey of databases and deep learning methods for cybersecurity and intrusion detection systems,” IEEE Systems Journal, vol. 15, no. 2, pp. 1717–1731, 2020. [Google Scholar]
4. R. Reddy, Y. Ramadevy and K. V. N. Sunitha, “Effective discriminant function for intrusion detection using SVM,” in Proc. of the Int. Conf. on Advances in Computing, Communications, and Informatics, Jaipur, India, pp. 1148–1153, 2016. [Google Scholar]
5. H. Sallay and S. Bourouis, “Intrusion detection alert management for high-speed networks: Current researches and applications,” Security and Communication Networks, vol. 8, no. 18, pp. 4362–4372, 2015. [Google Scholar]
6. F. Wentao, N. Bouguila and H. Sallay, “Anomaly intrusion detection using incremental learning of an infinite mixture model with feature selection,” in Proc. of the Int. Conf. on Rough Sets and Knowledge Technology, Halifax, NS, Canada, pp. in 364,–373, 2013. [Google Scholar]
7. F. Wentao, H. Sallay and N. Bouguila, “Online learning of hierarchical pitman–Yor process mixture of generalized dirichlet distributions with feature selection,” IEEE Transactions on Neural Networks and Learning Systems, vol. 28, no. 9, pp. 2048–2061, 2016. [Google Scholar]
8. I. Idriss, M. Azizi and O. Moussaoui, “An unsupervised generative adversarial network based-host intrusion detection system for internet of things devices,” Indonesian Journal of Electrical Engineering and Computer Science, vol. 25, no. 2, pp. 1140–1150, 2022. [Google Scholar]
9. S. Suchet, P. Ahmadi and K. Islam, “A robust comparison of the KDDCup99 and NSL-KDD IoT network intrusion detection datasets through various machine learning algorithms,” Journal of Student Scientists’ Research, vol. 1, pp. 350–365, 2019. [Google Scholar]
10. S. Abdul Jabbar and A. Boukerche, “Adaptive ensembles of autoencoders for unsupervised IoT network intrusion detection,” Computing, vol. 103, no. 6, pp. 1209–1232, 2021. [Google Scholar]
11. M. AL-Hawawreh, N. Moustafa and E. Sitnikova, “Identification of malicious activities in industrial internet of things based on deep learning models,” Journal of Information Security and Applications, vol. 41, no. 2, pp. 1–11, 2018. [Google Scholar]
12. C. Varun, B. Arindam and K. Vipin, “Outlier detection: A survey,” ACM Computing Surveys, vol. 14, no. 15, pp. 1–83, 2007. [Google Scholar]
13. S. O. M. Obeidat, J. Holst, A. Al Hayajneh and J. Brown, “A comprehensive and systematic survey on the internet of things: Security and privacy challenges, security frameworks, enabling technologies, threats, vulnerabilities and countermeasures,” Computers, vol. 9, no. 2, pp. 1–44, 2020. [Google Scholar]
14. S. P. J. Hariri, “IoT security framework for smart cyber infrastructures,” in 1st Int. Workshops on Foundations and Applications of Self Systems, Augsburg, Germany, pp. 242–247, 2016. [Google Scholar]
15. K. Rana, A. V. Singh and P. Vijaya, “A systematic review on different security framework for iot,” in Proc. of the Fifth Int. Symp. on Innovation in Information and Communication Technology, Amman, Jordan, pp. 1–7, 2018. [Google Scholar]
16. M. Irshad, “A systematic review of information security frameworks in the internet of things (IoT),” in Proc. of the IEEE 14th Int. Conf. on Smart City, Sydney, NSW, Australia, pp. 1270–1275, 2016. [Google Scholar]
17. J. S. Rueda-rueda and J. M. T. Portocarrero, “framework-based security measures for internet of thing: A literature review,” Open Computer Science, vol. 11, no. 1, pp. 346–354, 2021. [Google Scholar]
18. T. Aliya and L. Wadha, “Security framework for IoT devices against cyber-attacks,” Zurich, Switzerland, pp. 249–266, 2019. [Google Scholar]
19. D. Dasgupta and F. A. Gonzalez, “An intelligent decision support system for intrusion detection and response,” in Int. Workshop on Mathematical Methods, Models, and Architectures for Network Security, Springer, Berlin, Heidelberg, pp. 1–14, 2001. [Google Scholar]
20. W. An, A. Mohaisen and S. Chen, “XLF: A cross-layer framework to secure the internet of things (IoT),” in Proc. of the IEEE 39th Int. Conf. on Distributed Computing Systems, Texas, United States, pp.1830–1839, 2019. [Google Scholar]
21. E. L. Kaplan and P. Meier, “Nonparametric estimation from incomplete observations,” Journal of American Statistics Association, vol. 53, no. 282, pp. 457–481, 1958. [Google Scholar]
22. D. R. Cox, “Regression models and life-tables,” Journal of the Royal Statistical Society, vol. 34, no. 2, pp. 187–202, 1972. [Google Scholar]
23. J. L., Katzman, U. Shaham, A. Cloninger, J. Bates, T. Jiang et al., “DeepSurv: Personalized treatment recommender system using a Cox proportional hazards deep neural network,” BMC Medical Research Methodology, vol. 8, no. 1, pp. 1–12, 2018. [Google Scholar]
24. C. N. Yu, R. Greiner, H. C. Lin and V. Baracos, “Learning patient-specific cancer survival distributions as a sequence of dependent regressors,” in Proc. of the Advances in Neural Information Processing Systems, Granada, Spain, pp. 1845–1853, 2011. [Google Scholar]
25. S. Fotso, “Deep neural networks for survival analysis based on a multi-task framework,” arXiv:1801.05512. 2018. [Google Scholar]
26. H. Ishwaran, U. Kogalur, E. Blackstone and M. Lauer. “Random survival forests,” The Annals of Applied Statistics, vol. 2, no. 3, pp. 841–860, 2008. [Google Scholar]
27. G. Pierre, D. Ernst and L. Wehenkel, “Extremely randomized trees,” Machine Learning, vol. 63,. no. 1, pp. 3–42, 2006. [Google Scholar]
28. W. Marvin, N. T. Dankowski and A. Ziegler. “Random forests for survival analysis using maximally selected rank statistics,” Statistics in Medicine, vol. 36, no. 8, pp. 1272–1284, 2017. [Google Scholar]
29. E. Alhajjar and B. Taylor, “Survival analysis for insider threat,” Computational and Mathematical Organization Theory. SI: Social Cybersecurity in Times of Crisis, vol. 27, pp. 1–17, 2021. [Google Scholar]
30. M. D. Hossain, H. Inoue, H. Ochiai, D. Fall and Y. Kadobayashi, “LSTM-Based intrusion detection system for in-vehicle can Bus communications,” IEEE Access, vol. 8, pp. 185489–185502, 2020. [Google Scholar]
31. M. Zolanvari, M. A. Teixeira, L. Gupta, K. M. Khan and R. Jain. “Machine learning-based network vulnerability analysis of industrial internet of things,” IEEE Internet of Things Journal, vol. 6, pp. 6822–6834, 2019. [Google Scholar]
Cite This Article
 Copyright © 2023 The Author(s). Published by Tech Science Press.
This work is licensed under a Creative Commons Attribution 4.0 International License , which permits unrestricted use, distribution, and reproduction in any medium, provided the original work is properly cited.
 Downloads
 Citation Tools