
 Submit a Paper
 Propose a Special lssue
 Open Access
ARTICLE
A Construction of Object Detection Model for Acute Myeloid Leukemia
1 Department of Computer Science and Engineering, Annamalai University, Chidambaram, 608002, India
2 School of Computer Science and Engineering, Vellore Institute of Technology, Vellore, 632014, India
* Corresponding Author: K. Venkatesh. Email:
Intelligent Automation & Soft Computing 2023, 36(1), 543-560. https://doi.org/10.32604/iasc.2023.030701
Received 31 March 2022; Accepted 21 June 2022; Issue published 29 September 2022
 View Full Text
 Download PDF
Abstract
The evolution of bone marrow morphology is necessary in Acute Myeloid Leukemia (AML) prediction. It takes an enormous number of times to analyze with the standardization and inter-observer variability. Here, we proposed a novel AML detection model using a Deep Convolutional Neural Network (D-CNN). The proposed Faster R-CNN (Faster Region-Based CNN) models are trained with Morphological Dataset. The proposed Faster R-CNN model is trained using the augmented dataset. For overcoming the Imbalanced Data problem, data augmentation techniques are imposed. The Faster R-CNN performance was compared with existing transfer learning techniques. The results show that the Faster R-CNN performance was significant than other techniques. The number of images in each class is different. For example, the Neutrophil (segmented) class consists of 8,486 images, and Lymphocyte (atypical) class consists of eleven images. The dataset is used to train the CNN for single-cell morphology classification. The proposed work implies the high-class performance server called Nvidia Tesla V100 GPU (Graphics processing unit).Keywords
Anomalies bring about acute Myeloid Leukemia (AML) in the DNA (Deoxyribonucleic acid) that controls the improvement of cells in your bone marrow [1]. It originates from the bone marrow, soft inner bone parts, where the blood cells are produced. AML can be a deadly disease. It can spread quickly in the blood and other parts of the body. The diagnosis of the AML is that the doctor has to number of White blood cells and red blood cells count and see if they need to find any abnormal health conditions in that with the support of a microscope. The proposed model used for covid-19 diagnose but it is time taking, tedious process to find out the accurate result [2]. To overcome these issues, the proposed Novel AML detection model using Deep Convolutional neural networks and Faster R-CNN models are implemented in this research [3]. This research enlightens the path to analyze the inaccurate disease manner.
The proposed work is carrying out the terms as Adult AML is a type of cancer in bone marrow makes abnormal myeloblasts. Usually, it gets poorer when it is not treated. It is a type of acute leukemia in generally noted in adults [4]. AML is also known as acute myeloblastic leukemia, acute myelogenous leukemia, acute granulocytic leukemia and acute nonlymphocytic leukemia [5]. Once adult AML is diagnosed, tests determine if cancer has spread to other body parts [6]. There is no staging system for adult AML. The author in [6], implies the Munich AML Morphology Dataset has 18,365-expert labelled single image cells between 2014 and 2017. Non-pathological and Pathological leukocytes are classified into morphological classification acquired from the clinical practice by trained experts [7].
Fast R-CNN uses a region proposal network (RPN) with the CNN. The RPN shares fully-connected convolutional highlights the detection network empowering about without region proposals. It is an entirely CN that simultaneously predicts object limits and adjacent Ness scores. R-CNN is prepared to finish creating the region proposals which utilizes for location. It is converged into solitary network by sharing convolutional highlights. The RPN part advises brought together network. Faster R-CNN comprises two modules: the primary module and the subsequent module. The primary module is completely a convolutional network that proposes regions and the subsequent module is the Fast R-CNN indicator that utilizes the anticipated regions [8,9].
In this work, the process with the high-class performance server called Nvidia DGX. It is a line of Nvidia produced servers and workstations specializing in GPGPU (General-purpose Graphics processing unit is a graphics processing unit to accelerate deep learning applications. The product line is provided to bridge the gap among AI and GPUs accelerators in device has certain features specializing it for DL workloads. DGX-1 servers feature 8 GPUs relies on Volta or Pascal daughter cards with HBM 2 memory, connected by an NV Link mesh network. The initial Pascal-based DGX-1 delivers 170 teraflops of precision processing while volta-based upgrade enhanced to 960 teraflops [10]. The forthcoming section explains the briefing of our work.
Recently, the rapid growth of artificial intelligence has carried new assumptions to the various fields like medicine, agriculture, industry automation, banking sector, risk management, and fraud detection, especially for diagnosing the diseases, finding the variance, prognostication, and visualization [11]. Some studies recommend data concerning the bone marrow, insusceptible framework and Leukemia cell digestion may further develop prediction accuracy [12]. ML procedures are turned into development tool for predicting the disease outcome [13]. For instance, it can distinguish actual examples and connections between datapoint to anticipate the result of cancer. Among ML strategies, highlight choice-based methods are choosing a subset of elements from the first arrangement of elements. These methods are beneficial to involve and somewhat precise to execute for prediction processed [14].
It is reported that approximately 20 000 new cases are predicted with AML, and a 12,000-mortality rate was noted in 2020. The development of AML is considered to be miserable, specifically for patients 65 years old, and the report says that 59% of new cases are found over a specific region every year and 73% AML-based deaths. With this population, the roughly one-year survival rate is
Some patients are diagnosed with AML and treated with IC followed by consolidation therapy and stem cell transplant. Lower intensity treatments like hypomethylating agents are available for some patients who may not been IC members for the past few decades [18]. Some new non-intensive treatments like venetoclax and glasdegib are considered targeted treatment measures like isocitrate dehydrogenase (IDH) inhibitors, FMS such as FLT3 antibody-drug conjugate gemtuzumab ozogamicin is an induction therapy of AML [19]. The patients may receive BSC with certain pain relief combination, infection control, antiemesis and transfusions.
NIC or determining candidacy (IC) is not so standardized. Some prevailing treatment guidelines are suggested against the age as a dominating factor. However, no consensus algorithm is proposed as in data [20]. Despite of age, disease characteristics, comorbidities, performance status, some physicians account for other factors like available support system, essential resources, financial support and performance status. Some evidence to assist decision-making is generally contradictory and constraint factors [21]. In some cases, the clinical trials eliminate patients based on their age, confounding comorbidities, and poor PS. Both the patients and providers are provided with risk balancing during adverse causes, treatment-based mortality and anti-cancer therapy advantages for older patients [22]. With the complex considerations and lack of consensus, the optimal older patient’s treatment with the presence of AML [23,24] is distinctly challenging for many Physicians. Despite AML-based publication evidence over age 65 that benefits from the active anti-leukemia treatment process [25–27]. Extensive variations in the treatment process still exist. However, the analysis with real-world data and therapeutic usage related to AML recommends many patients who receive NAAT [27–30].
The proposed work is carrying out the terms as Adult acute myeloid leukemia (AML) is a cancer type where bone marrow is identified with abnormal myeloblasts. There is no proper staging system for adult AML. The data is collected from the American Cancer Society’s for leukemia in US (2020). Roughly 60,530 leukemia cases and 23,100 deaths are predicted. Roughly 19,940 new cases of AML are identified. The sample is taken from the adults. Almost all will be adults. The following Fig. 1 indicates the flow of the proposed AML detection model.
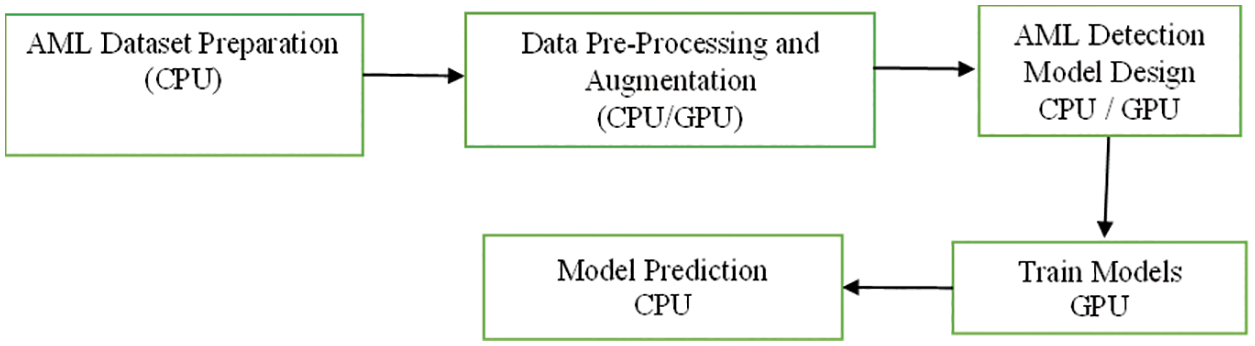
Figure 1: Flow of proposed AML detection model
This research considers BioGPS for AML which is characterized on molecular heterogeneity (http://biogps.org/#goto=genereport&id=1017&show_dataset=E-GEOD-38987). The genomic region points to candidate genes like leukemogenesis, and the dataset constructor uses single nucleotide polymorphism and microarray-based genomic hybridization with 390 AML cases to narrow down genomic ROI (Region of Interest). The targeted genes are located over the critical regions with a cohort representation of 50 AML samples with sub-groups. The predicted 120 nonsense and missense mutations and 60 deletions or insertions were acquired from 73 various genes (
3.2 Pre-Processing with Data Augmentation
It is a technique that increases the number of trainings samples and eliminates over-fitting issues. Here, sample processing with augmentation is a step that is performed to enhance the dataset quality before it is adapted to a classifier model. It includes color corrections, orientation and resizing. Data augmentation is a manipulation applied to create various content versions to expose the model towards a more comprehensive array of training samples. The augmentation process is typically used for the training data. Therefore, transformation is measured as an augmentation that best-suited pre-processing step. In some cases, the provided images are composed of low contrast images. In the case of the prediction process, the low contrast images are not best suited. Therefore, the contrast adjustment is highly solicited. When the provided training data does not have a constant contrast level representation, it is less specific where constant contrast adjustment is highly appropriate. Indeed, random contrast altering during the training process gives better generalization. It is known as augmentation.
The proposed work is processed with the input layer as the various images Fig. 2 as input one and got the output as the dimensions 256,235,3 and not use any parameters. Then processing the next pass as block one convolution one along with the convolution 2D and acquired the output as 256,256,64 and implies the parameters as 1792. The outcome of block one convolution one is given to block one convolution two after processing the output dimension as 256,256,64 and the parameters as 36928. In the final pass1, the max-pooling 2D processed and output as following dimensions are 128,128,64, and zero parameters apply. The Tab. 1 shows the convolutional parameters. Fig. 3 depicts the R-CNN model.
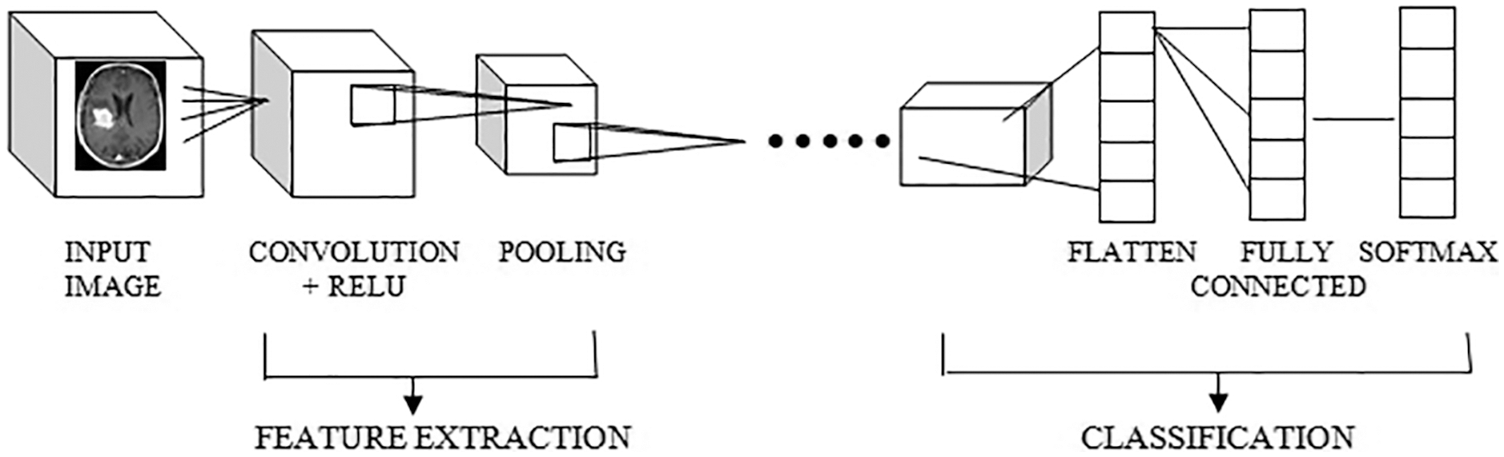
Figure 2: CNN model architecture
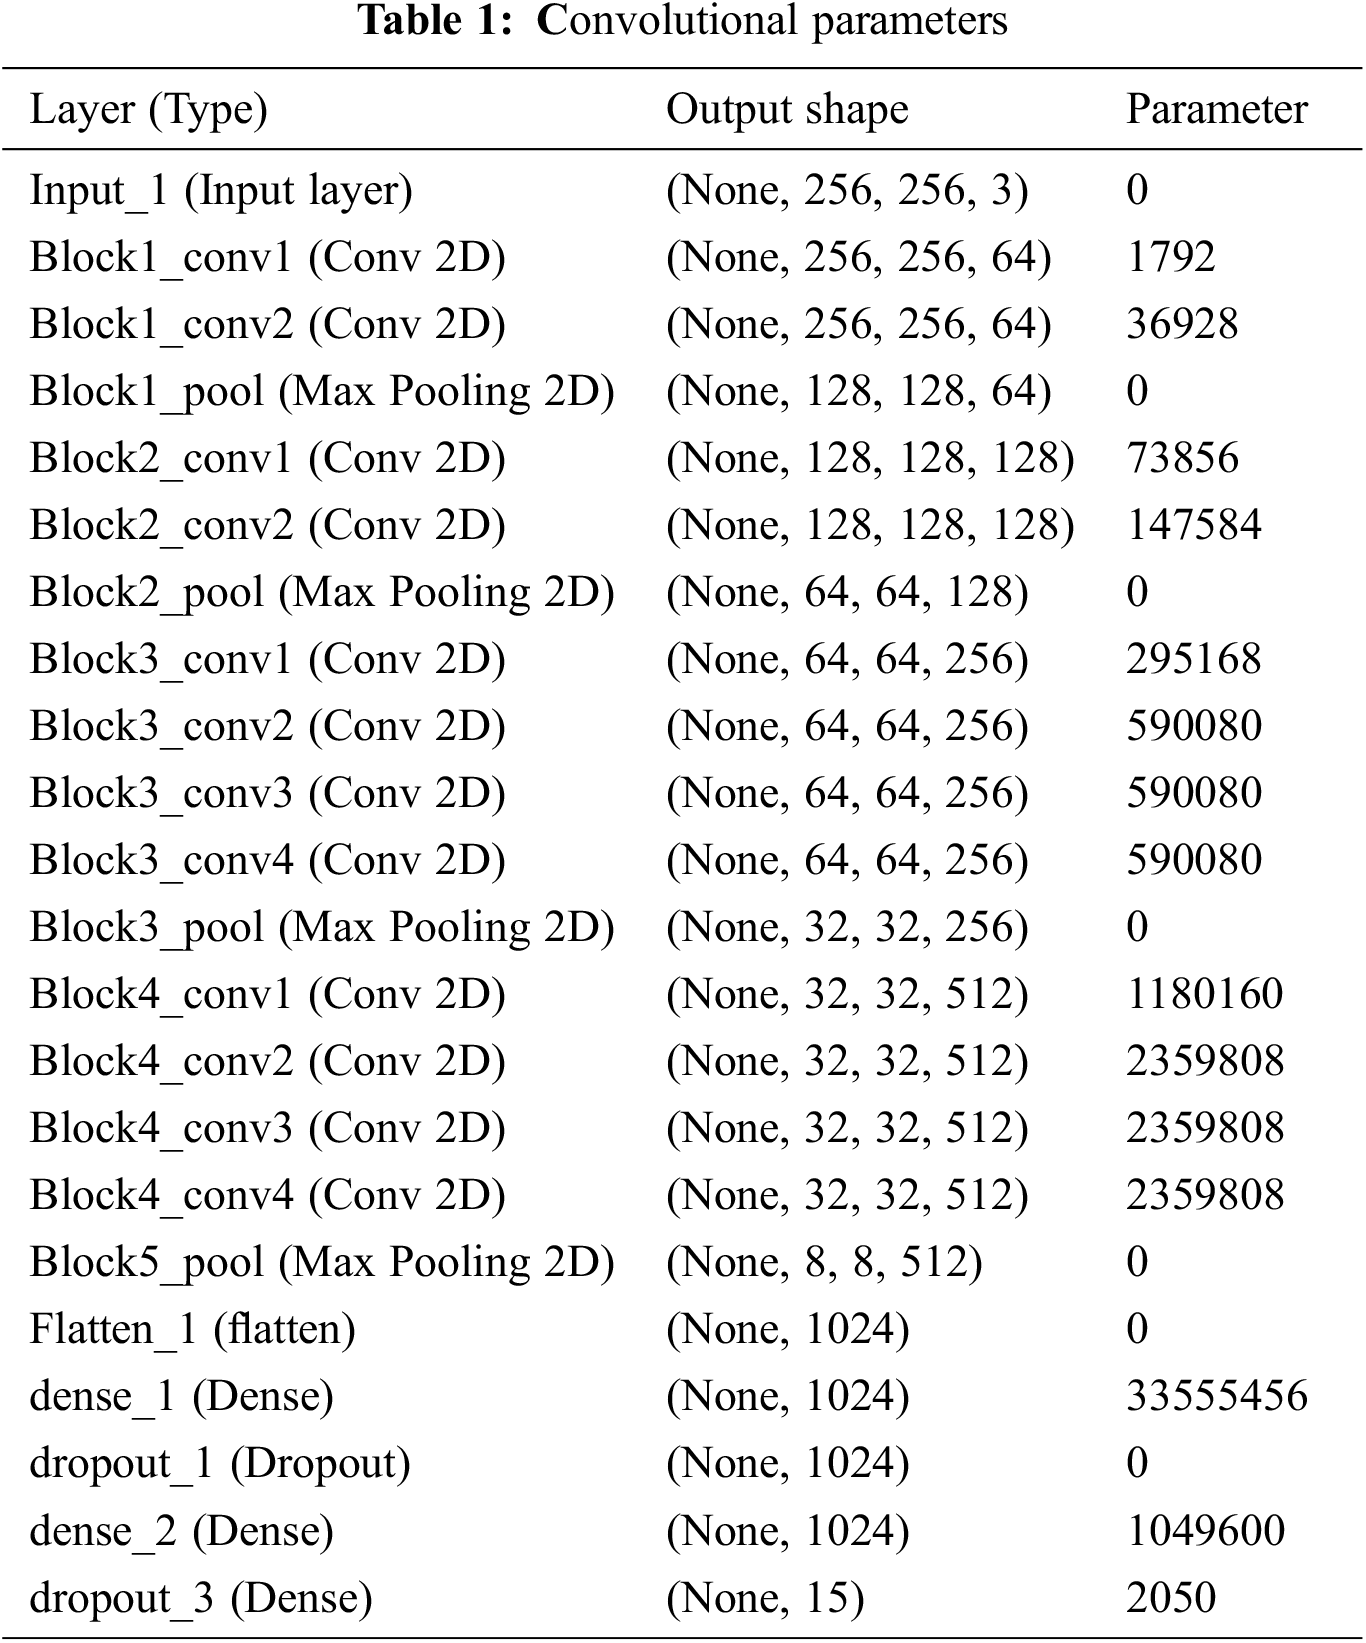
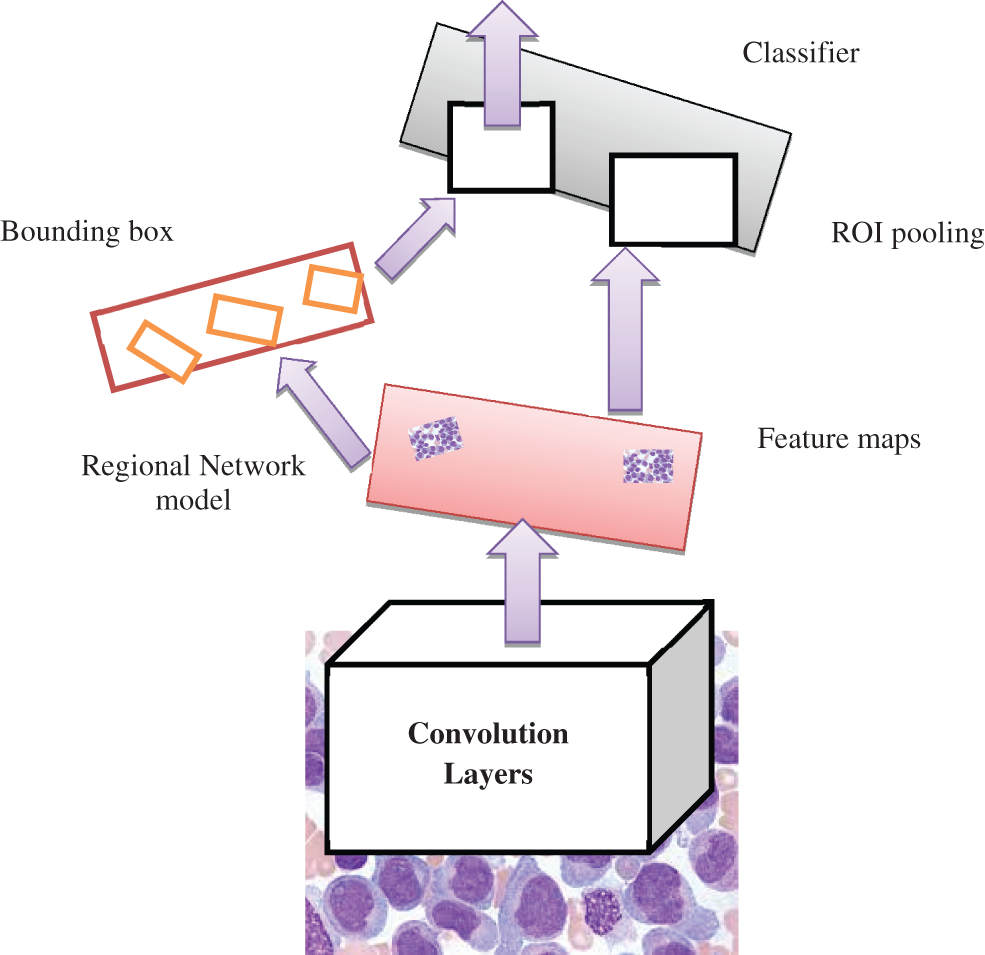
Figure 3: Faster R-CNN model
The output shape is acquired as 1024 and zero parameters in flattening one. In dense one along with the zero parameters output 33555456. In dropout one, the parameters are zero to get the output size as 1024. In dense two along with the 1049600 parameters output attaint as 1024. In dropout, two parameters are taken as 2050 to get the output size as 15. The hyperparameter considers the 32 optimized batch size values in training the dataset. The dropout value is optimized as 0.2. The loss is analyzed with the categorical cross-entropy. The ReLu implies the activation function for convolution layers. Figs. 4a and 4b depicts the training and validation accuracy and training and validation loss.
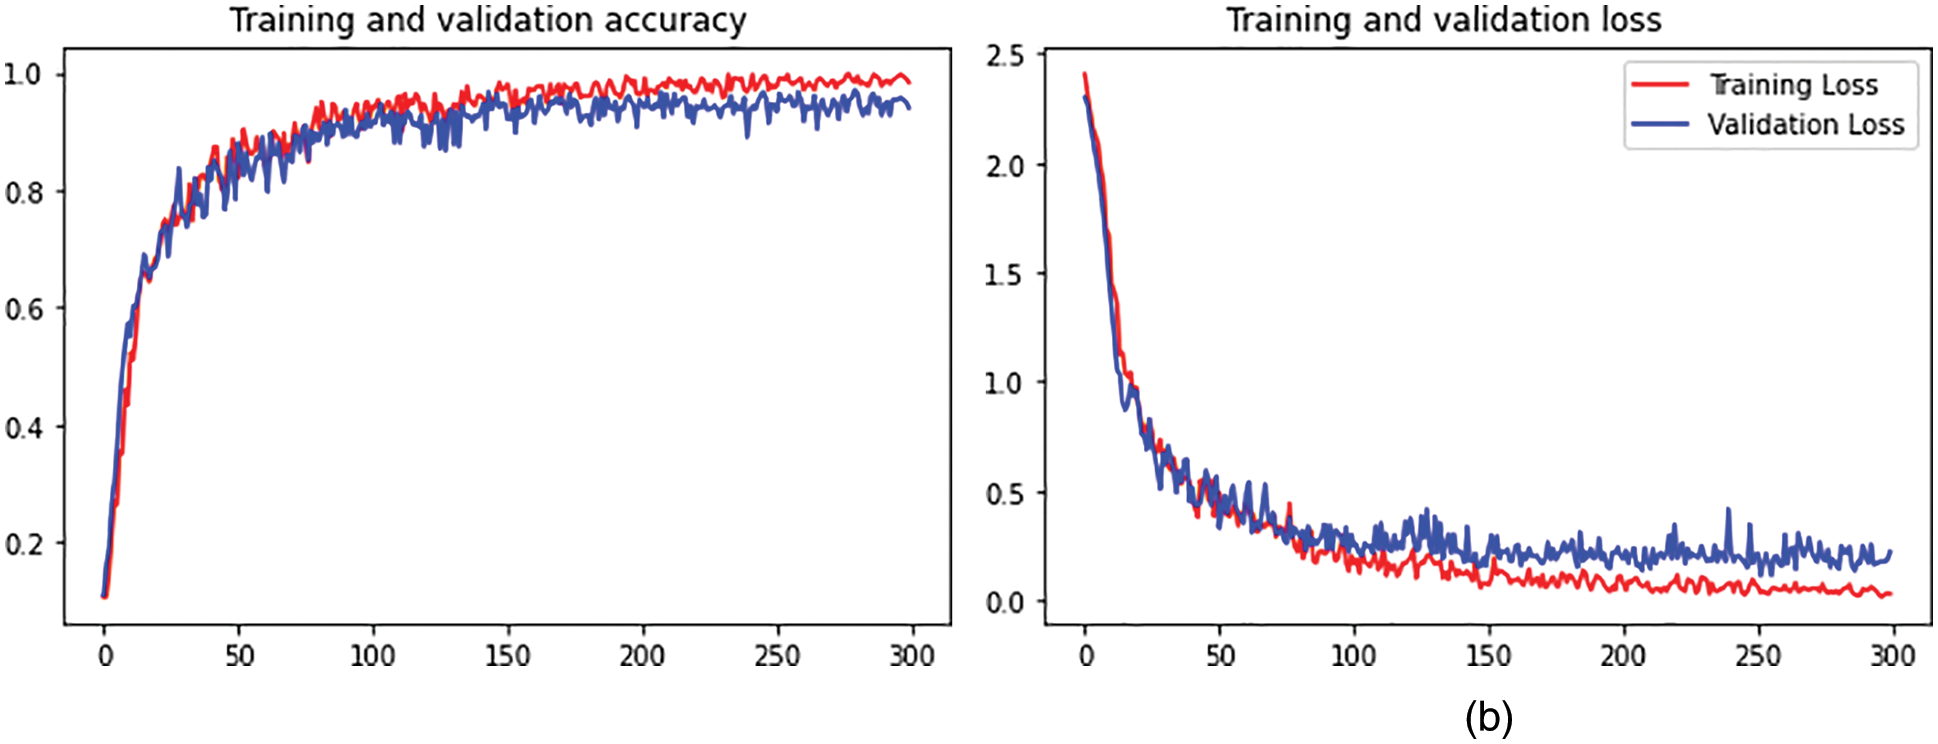
Figure 4: (a) Training and validation accuracy. (b) Training and validation loss
The proposed model provides a novel regional network with superior computational efficiency and performance. The proposed detection network is a single network that shares the convolutional features, and the convolutions are shared during the testing time. The anticipated model is proposed to predict the AML. The fully convolutional network indicates the objectless and object bounds at every position. The functionality of the network is initiated by considering the convolutional base network, which is fed as an input image, i.e., resized image. The convolutional layer’s output depends on the NN stride. The sliding window is utilized to generate the region proposal over convolutional feature mapping by the network layer (last). The proposed network is used during feature mapping to learn whether an object is provided and its location and dimensions in the input image. The anchors carry it out, and it is centered at the sliding window and related to the aspect ratio and scaling. The classifier layer is utilized to provide probabilities whether or not points over the feature map contains an object within the anchors at the point.
The input image is initially passed via the input network to attain feature mapping. The bounding box coordinates pool the features from the mapped feature. The ROI pooling layer performs it. This ROI layer helps to 1) measure the region related to the feature map; 2) partition the regions to the fixed output size. After passing it to the fully connected layers, the classification provides the features. The proposed model is trained independently, and the CNN is initialized with weights from the trained network and fine-tuned to perform region-based classification task. The anticipated network model is trained independently. The backbone CNN weight is initialized from the trained network for classification, and it is fine-tuned for the detection task. It does not share the convolutional layers. The network is initialized with weights from the Faster R-CNN model and fine-tuned for the regional task. In the final stage, the detector is fine-tuned, and the unique layers to the detector network are fine-tuned. The standard layers’ weights are fixed, and finally, convolutional layers share the same network to form a unified network model.
4 Numerical Results and Discussion
Researchers must assess the quality of the classification findings before evaluating the classifier’s performance. The classification performance is computed to graphically illustrate the viability of the newly designed algorithm, followed by a comparative study of existing classification algorithms and additional enhancements depending on their inadequacies. Some metrics like accuracy, sensitivity, specificity, and F1-score are commonly employed, and its execution principle will be momentarily introduced underneath.
It is also an error matrix to see if the classification result matches the original ground cover. It is the foundation for several additional assessment criteria. It is expressed in Eq. (1)
where
The overall accuracy is calculated by dividing the number of accurately sampled data points by the entire sample. The formula for the computation is expressed in Eq. (3)
The performance indicators are based on the confusion matrix, with TP denoting a lot of positive instances that are positive, TN representing the number of negative instances that are negative, FP indicating the series of adverse instances that are positive but are intended just to be positive, and FN indicating the number of positive instances that are negative but are designed to be positive. The model’s capacity to handle a real example positively or negatively is solely dependent on the accuracy of the land cover/land use forecast. The fraction of correctly predicted positive instances out of all optimistic predictions supplied by the predictor model is precision. Eq. (4) expresses it as follows:
The recall is represented as the percentage of projected positive events that are always positive. It’s written like this in Eq. (5)
The F1-score is a commonly used metric for classification issues. The recall and accuracy rates are calculated using the average harmonic technique, with the maximal value is 1 and the minimal value is 0. Eq. (6) is a mathematical expression for it:
Specificity is defined as the ability to correctly forecast samples that are not deemed valid, i.e., accurate negative samples. Eq. (7) is a mathematical expression for it:
The different metrics to evaluate the semantic segmentation model are Pixel accuracy, Intersection over union (IoU), Dice coefficient. The IoU is called as Jaccard index. The IoU is calculated as follows.
Dice coefficient: It is analyzed by the given below equation
The dice coefficient is similar to the IoU.
The following Tab. 2 express the comparison of various performance metrics along with the various methods. Figs. 5a and 5b depicts the confusion matrix. Fig. 6 shows the prediction accuracy, and Fig. 7 shows the prediction loss. Fig. 8 illustrates the ROC comparison of TPR (True Positive Rate) and FPR (False Positive Rate). Tab. 2 depicts the comparison of various performance metrics like accuracy, recall, precision, F-measure, ROC, error rate and MCC comparison. The comparison is made among hybrid CNN, standard CNN, CNN with boosting model, D-CNN with data augmentation, CNN with GA and DCNN (See Figs. 9a and 9b). The accuracy of the anticipated 97.30% which is 2.3%, 1.3%, 4.3%, 3.3%, 3.3% and 0.30% higher than other approaches. The precision of the anticipated faster R-CNN model is 94% which is 14%, 32%, 10%, 11% and 12% higher than other approaches.
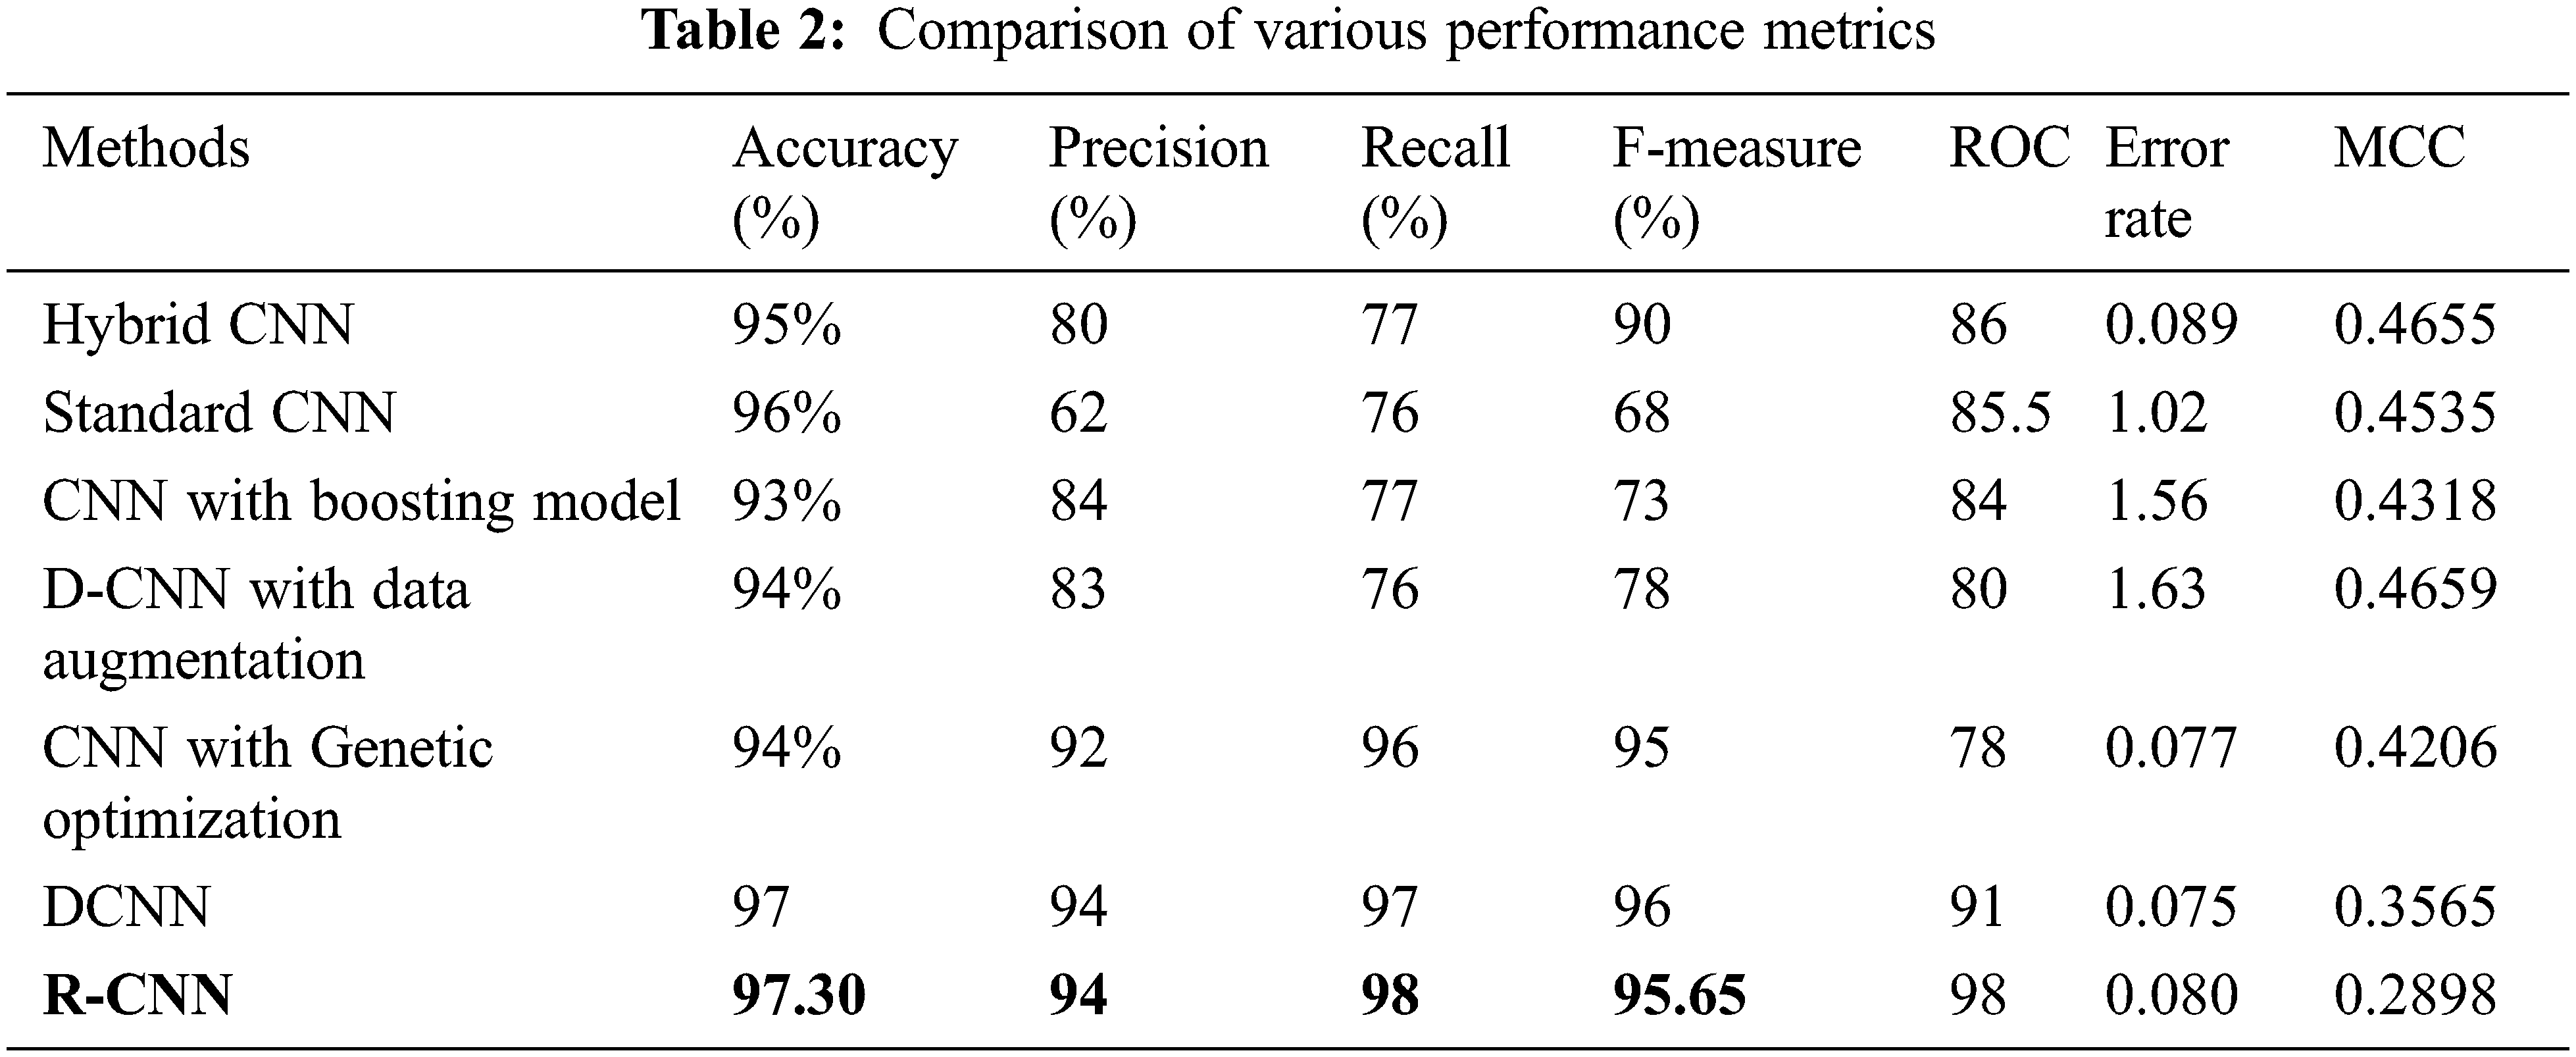
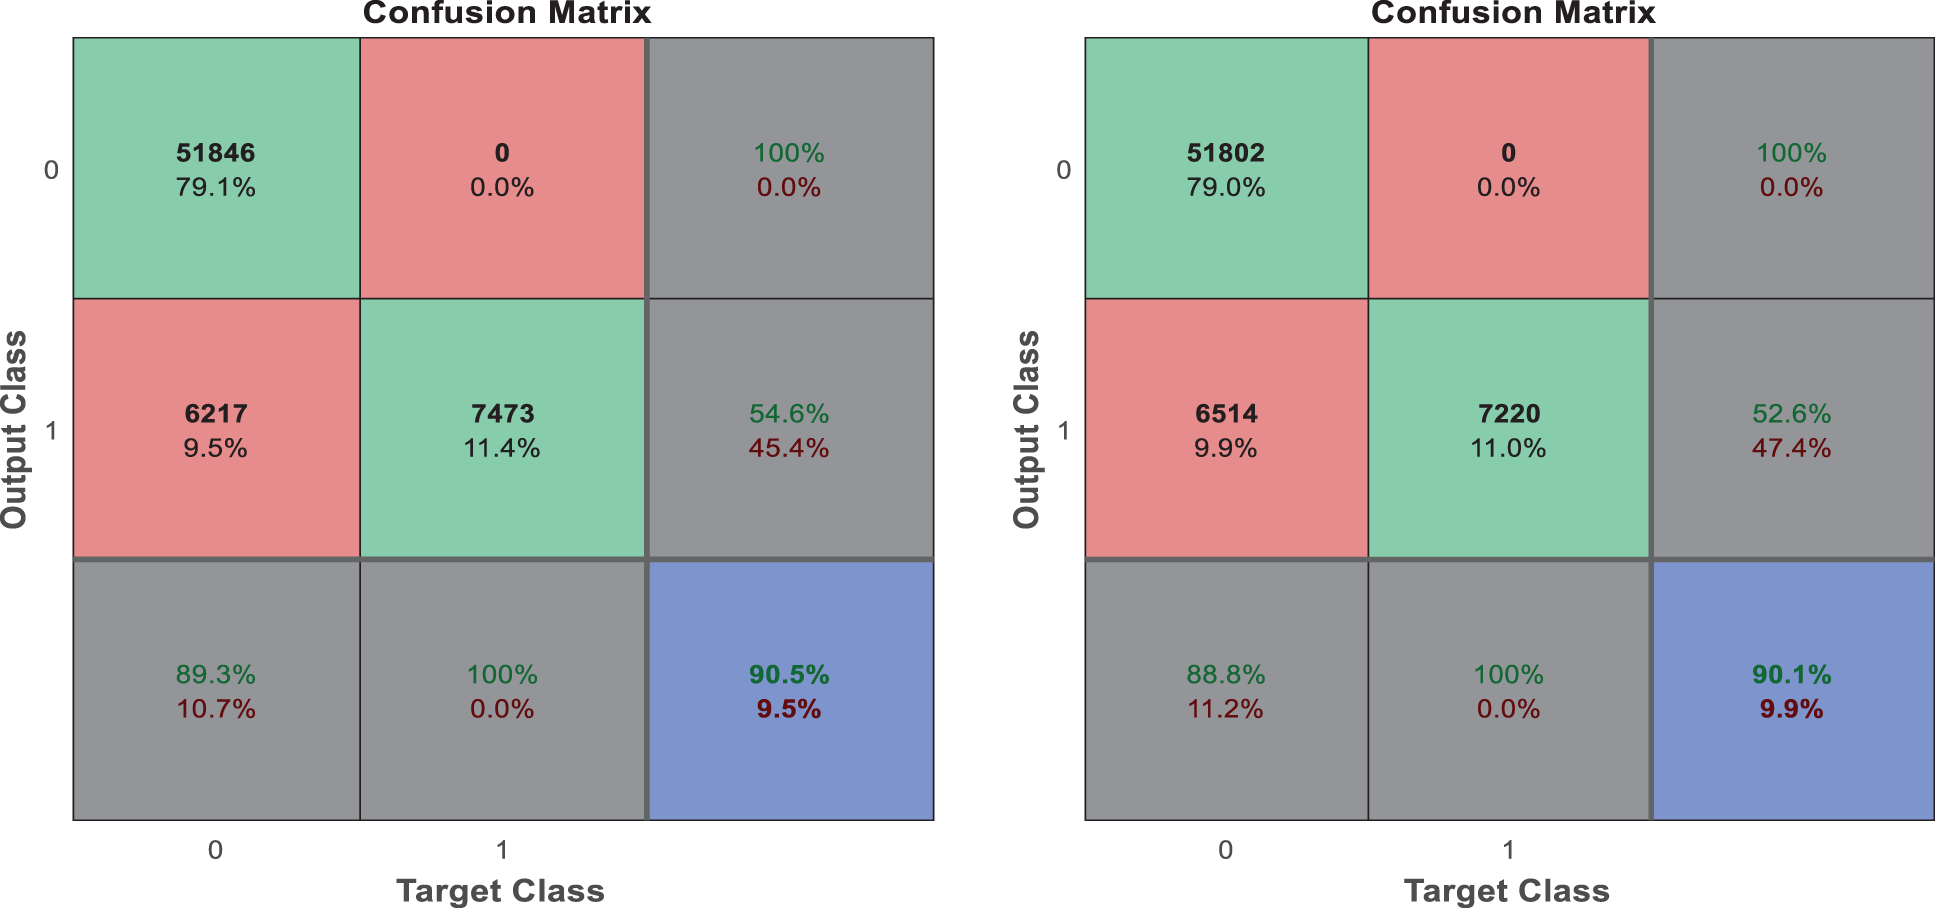
Figure 5: (a) Confusion matrix. (b) Confusion matrix
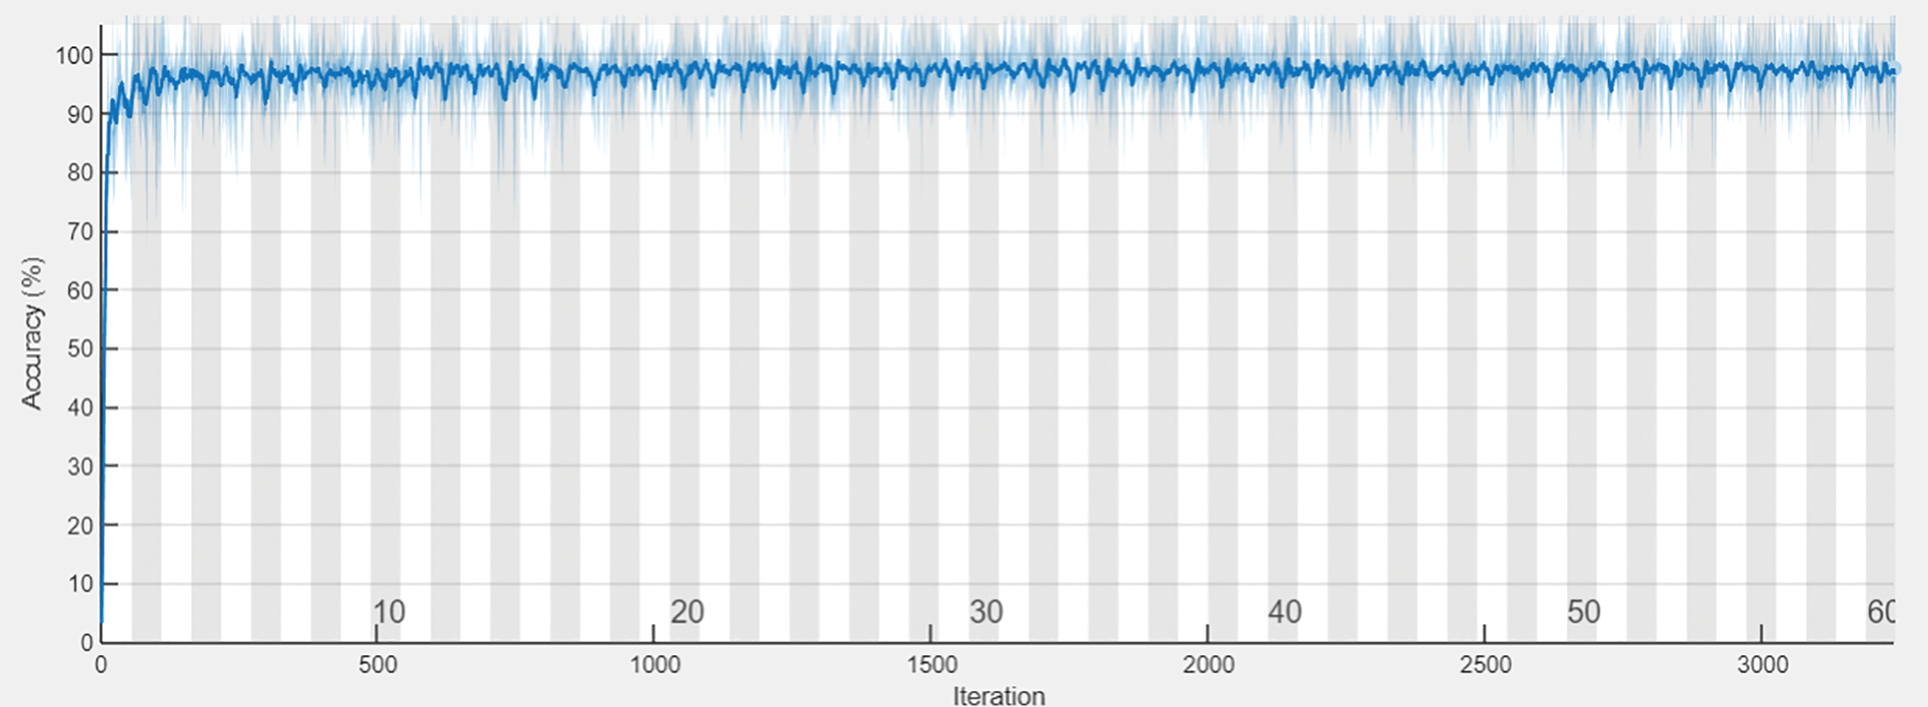
Figure 6: Prediction accuracy
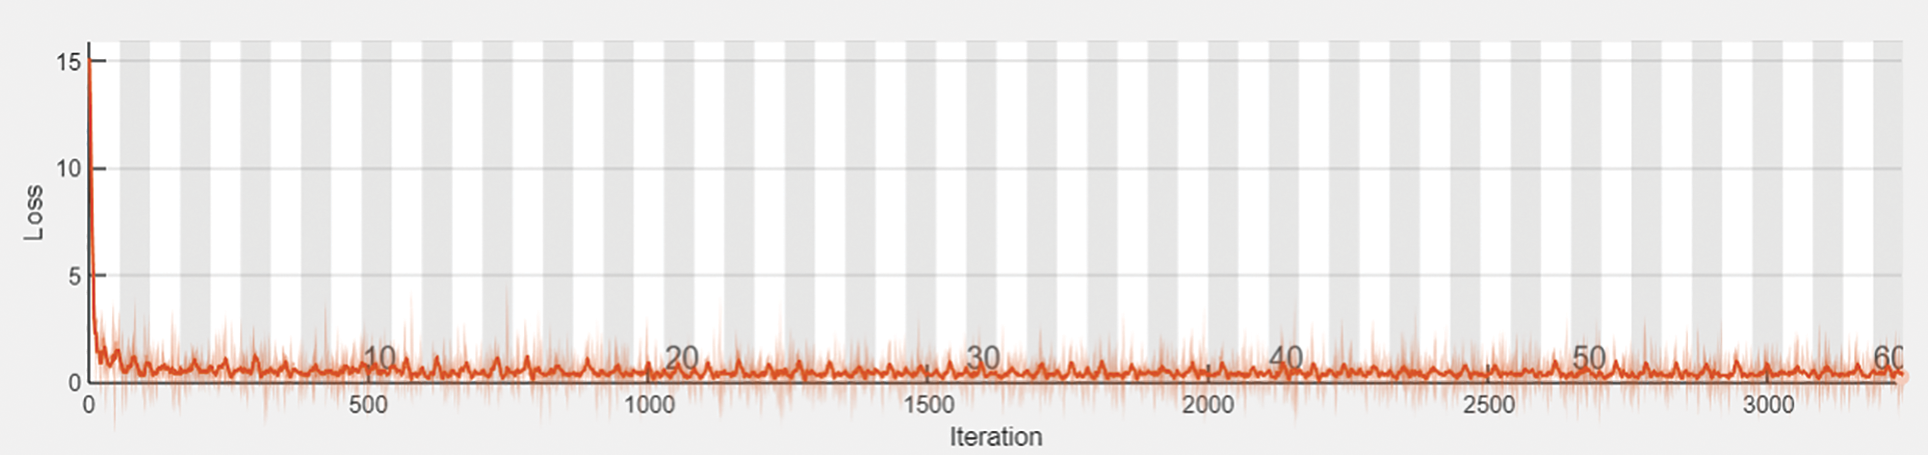
Figure 7: Prediction loss
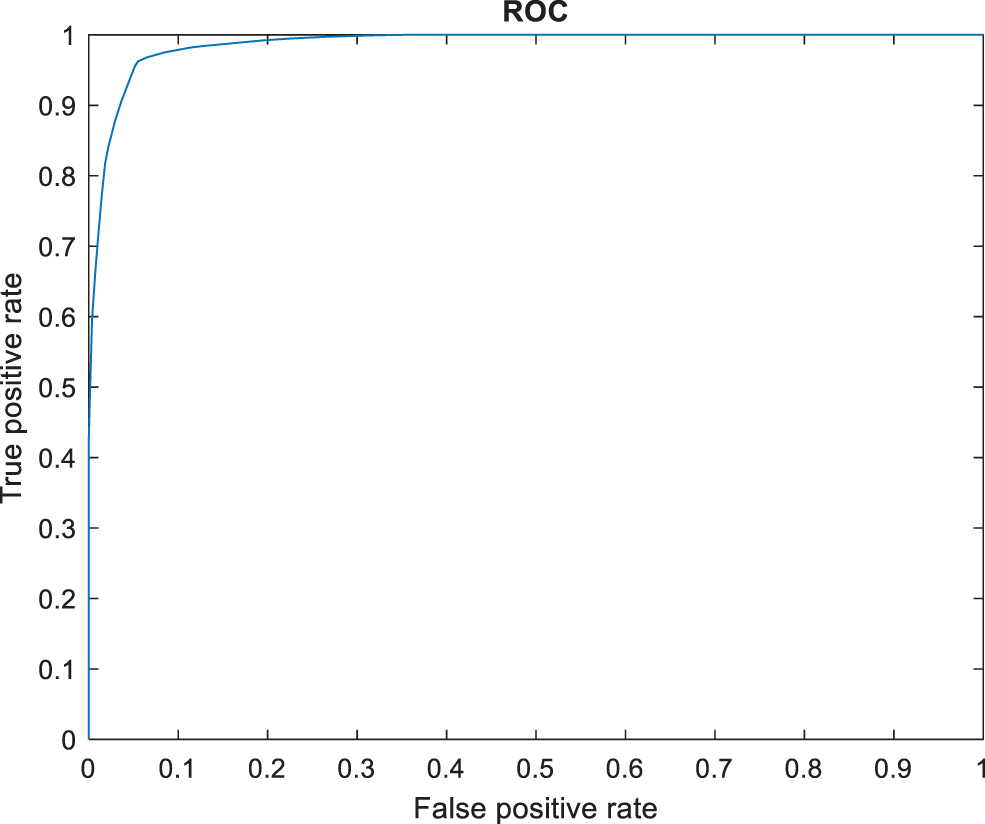
Figure 8: ROC comparison
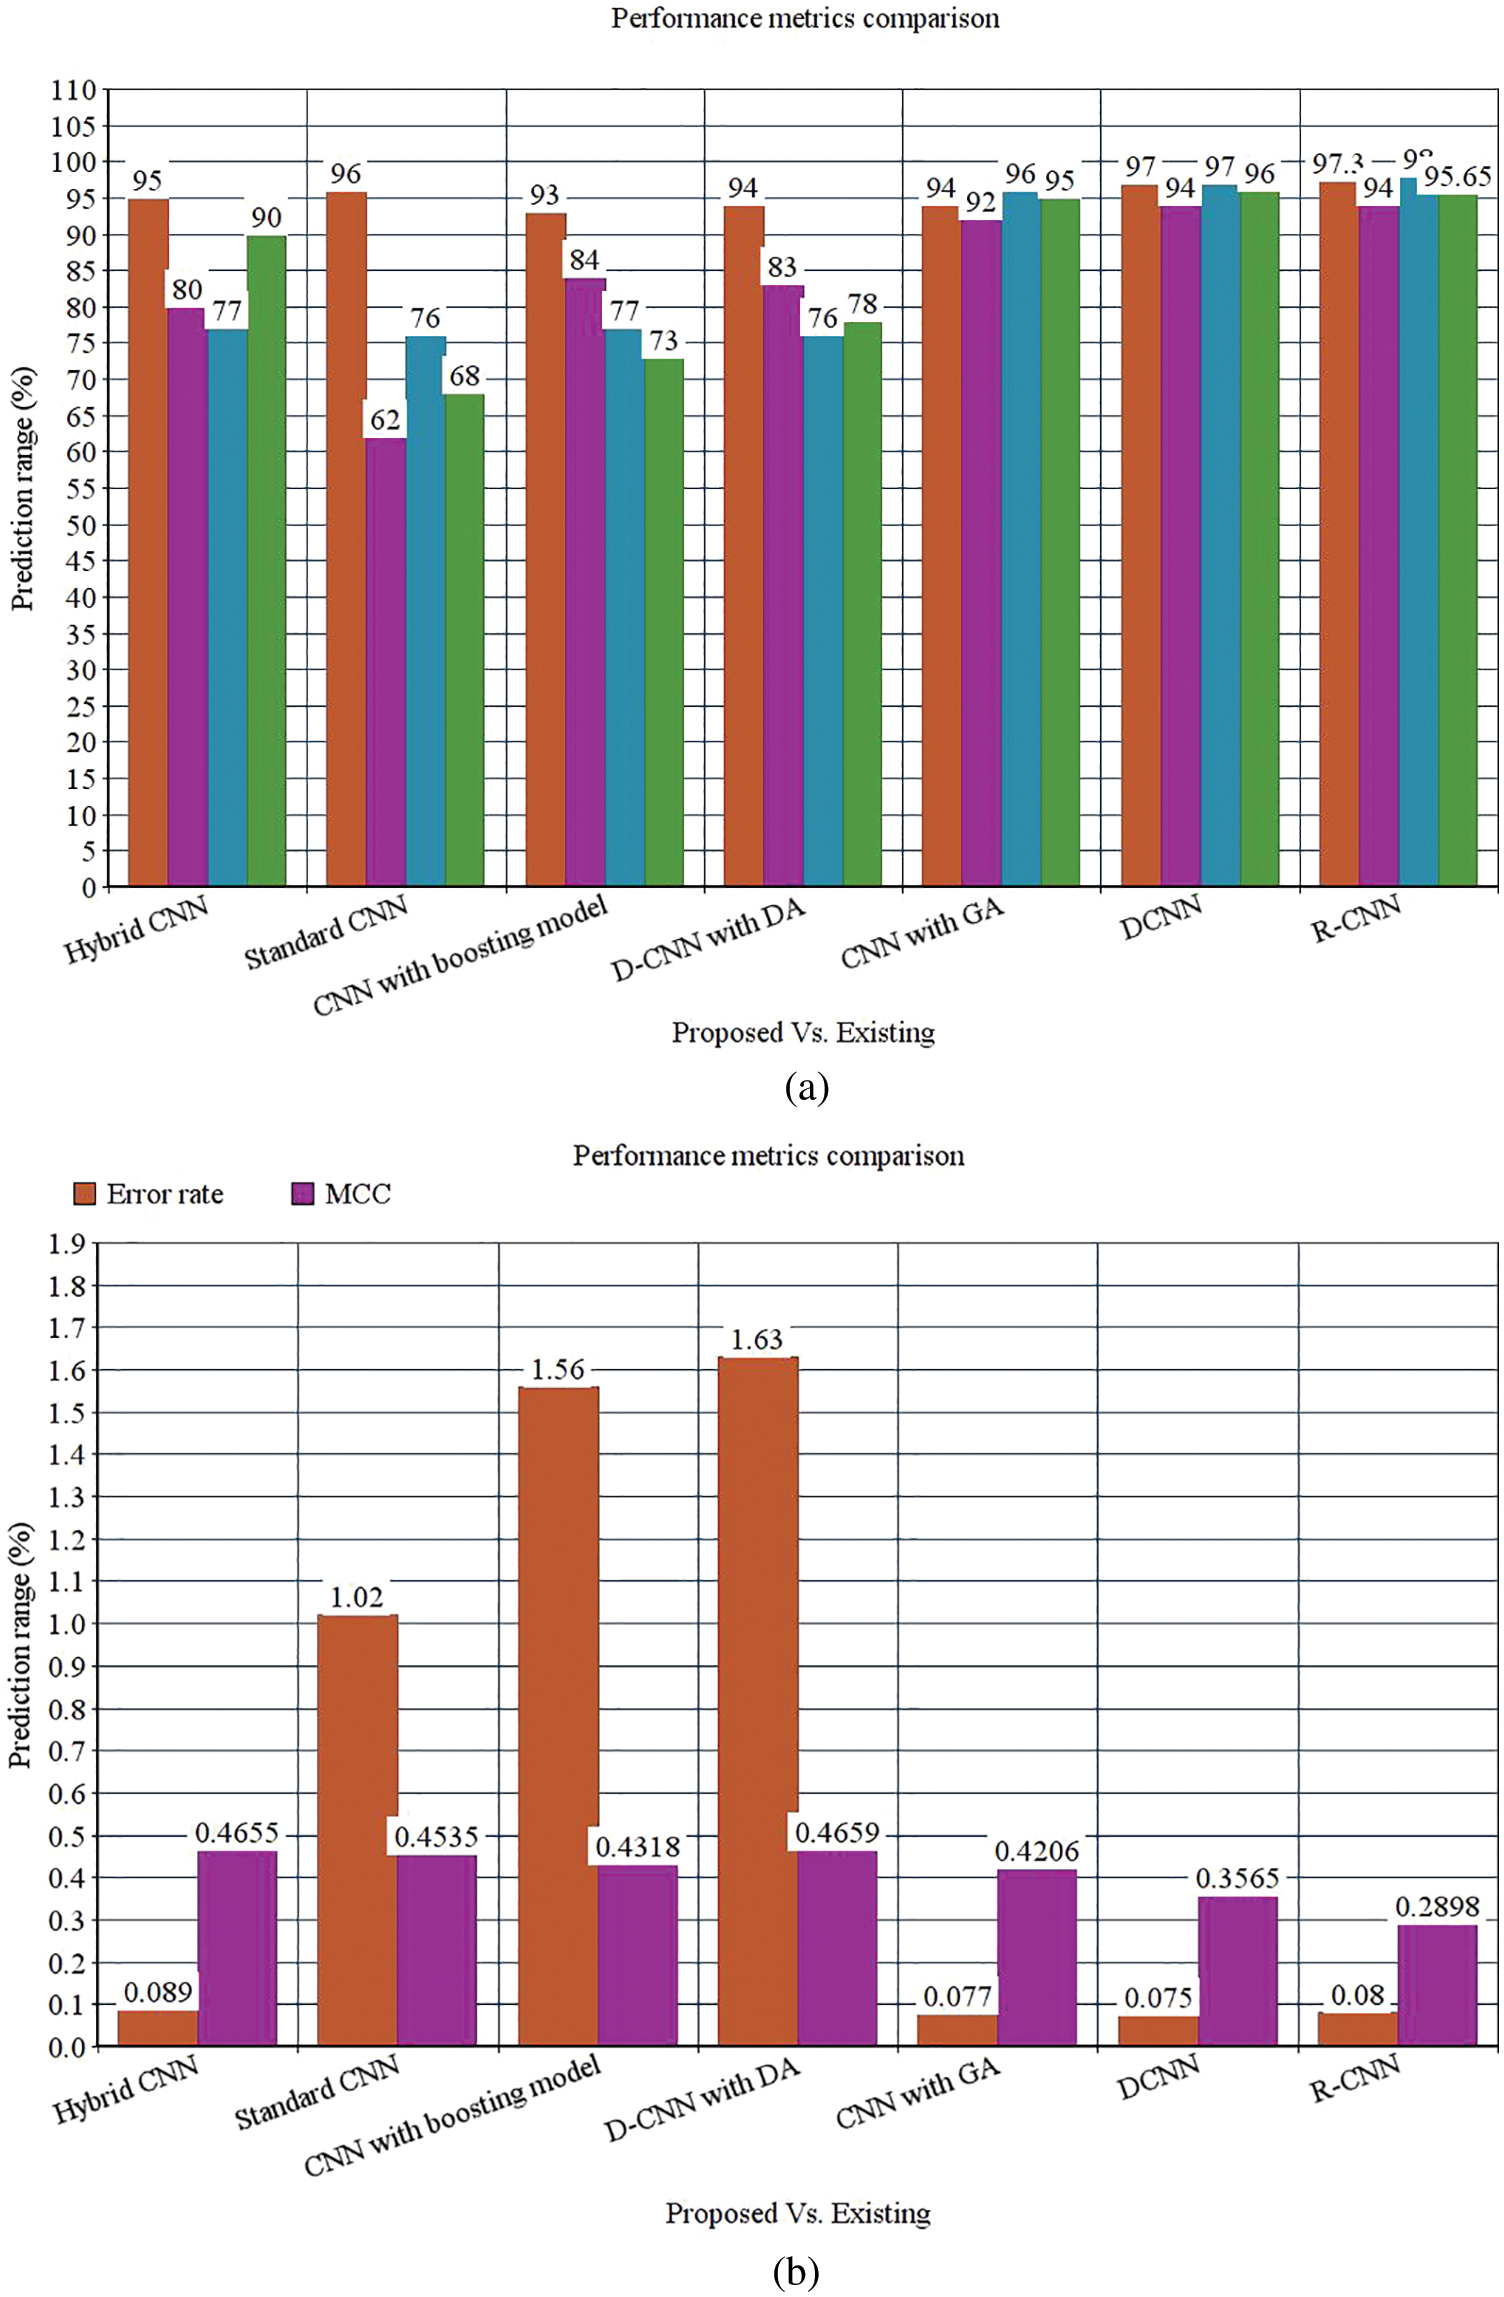
Figure 9: (a) Performance metrics comparison (b) Error rate and MCC
However, the DCNN model shows 94% precision. The recall of the anticipated faster R-CNN model is 98% which is 21%, 22%, 21%, 22%, 2% and 1% higher than other approaches. The F-measure of the anticipated model is 95.65% which is 5.65%, 27.65%, 22.65%, 17.65%, 0.65% higher than other approaches and 0.35% lesser than the DCNN model. The ROC of the anticipated ROC is 98% which is 12%, 11.5%, 14%, 18%, 20% and 7% superior to other methods. The error rate of the anticipated model is 0.080, and the other models are 0.089, 1.02, 1.56, 1.63, 0.077 and 0.075. Generally, the value of the MCC should be lesser than 1. When the model gives a lesser value than 1, then the model is said to be superior. The MCC of R-CNN is 0.2898, DCNN is 0.3565, CNN with GA is 0.4206, D-CNN with DA is 0.4659, CNN with boosting model is 0.4318, standard CNN is 0.4535, and hybrid CNN is 0.4655. Fig. 8 shows the ROC comparison.
Tab. 3 depicts the overall comparison of various existing approaches with the proposed model. While analyzing the Kaggle dataset, the proposed model gives 95.8% accuracy, 93% precision, 95% recall, 95% F1-score, and 97.78% AUROC. The accuracy of the anticipated model is 95.8% which is 3.3%, 8%, 6.9%, 9.1%, 8%, and 2.7% higher than other approaches. The precision of the anticipated model is 93% which is 18%, 15%, 21%, 18%, 7% and 2% higher than other approaches. The recall of the anticipated model is 95% which is 23%, 25%, 23%, 22%, 5%, and 2% higher than other approaches. The F1-score of the anticipated model is 95% which is 7%, 27%, 24%, 17%, 2% and 4% higher than other approaches. The AUROC (Area Under the Receiver Operating Characteristics) of the anticipated model is 97.78% which is 3.98%, 4.42%, 2.92%, 5.38%, and 0.89% higher than other approaches.
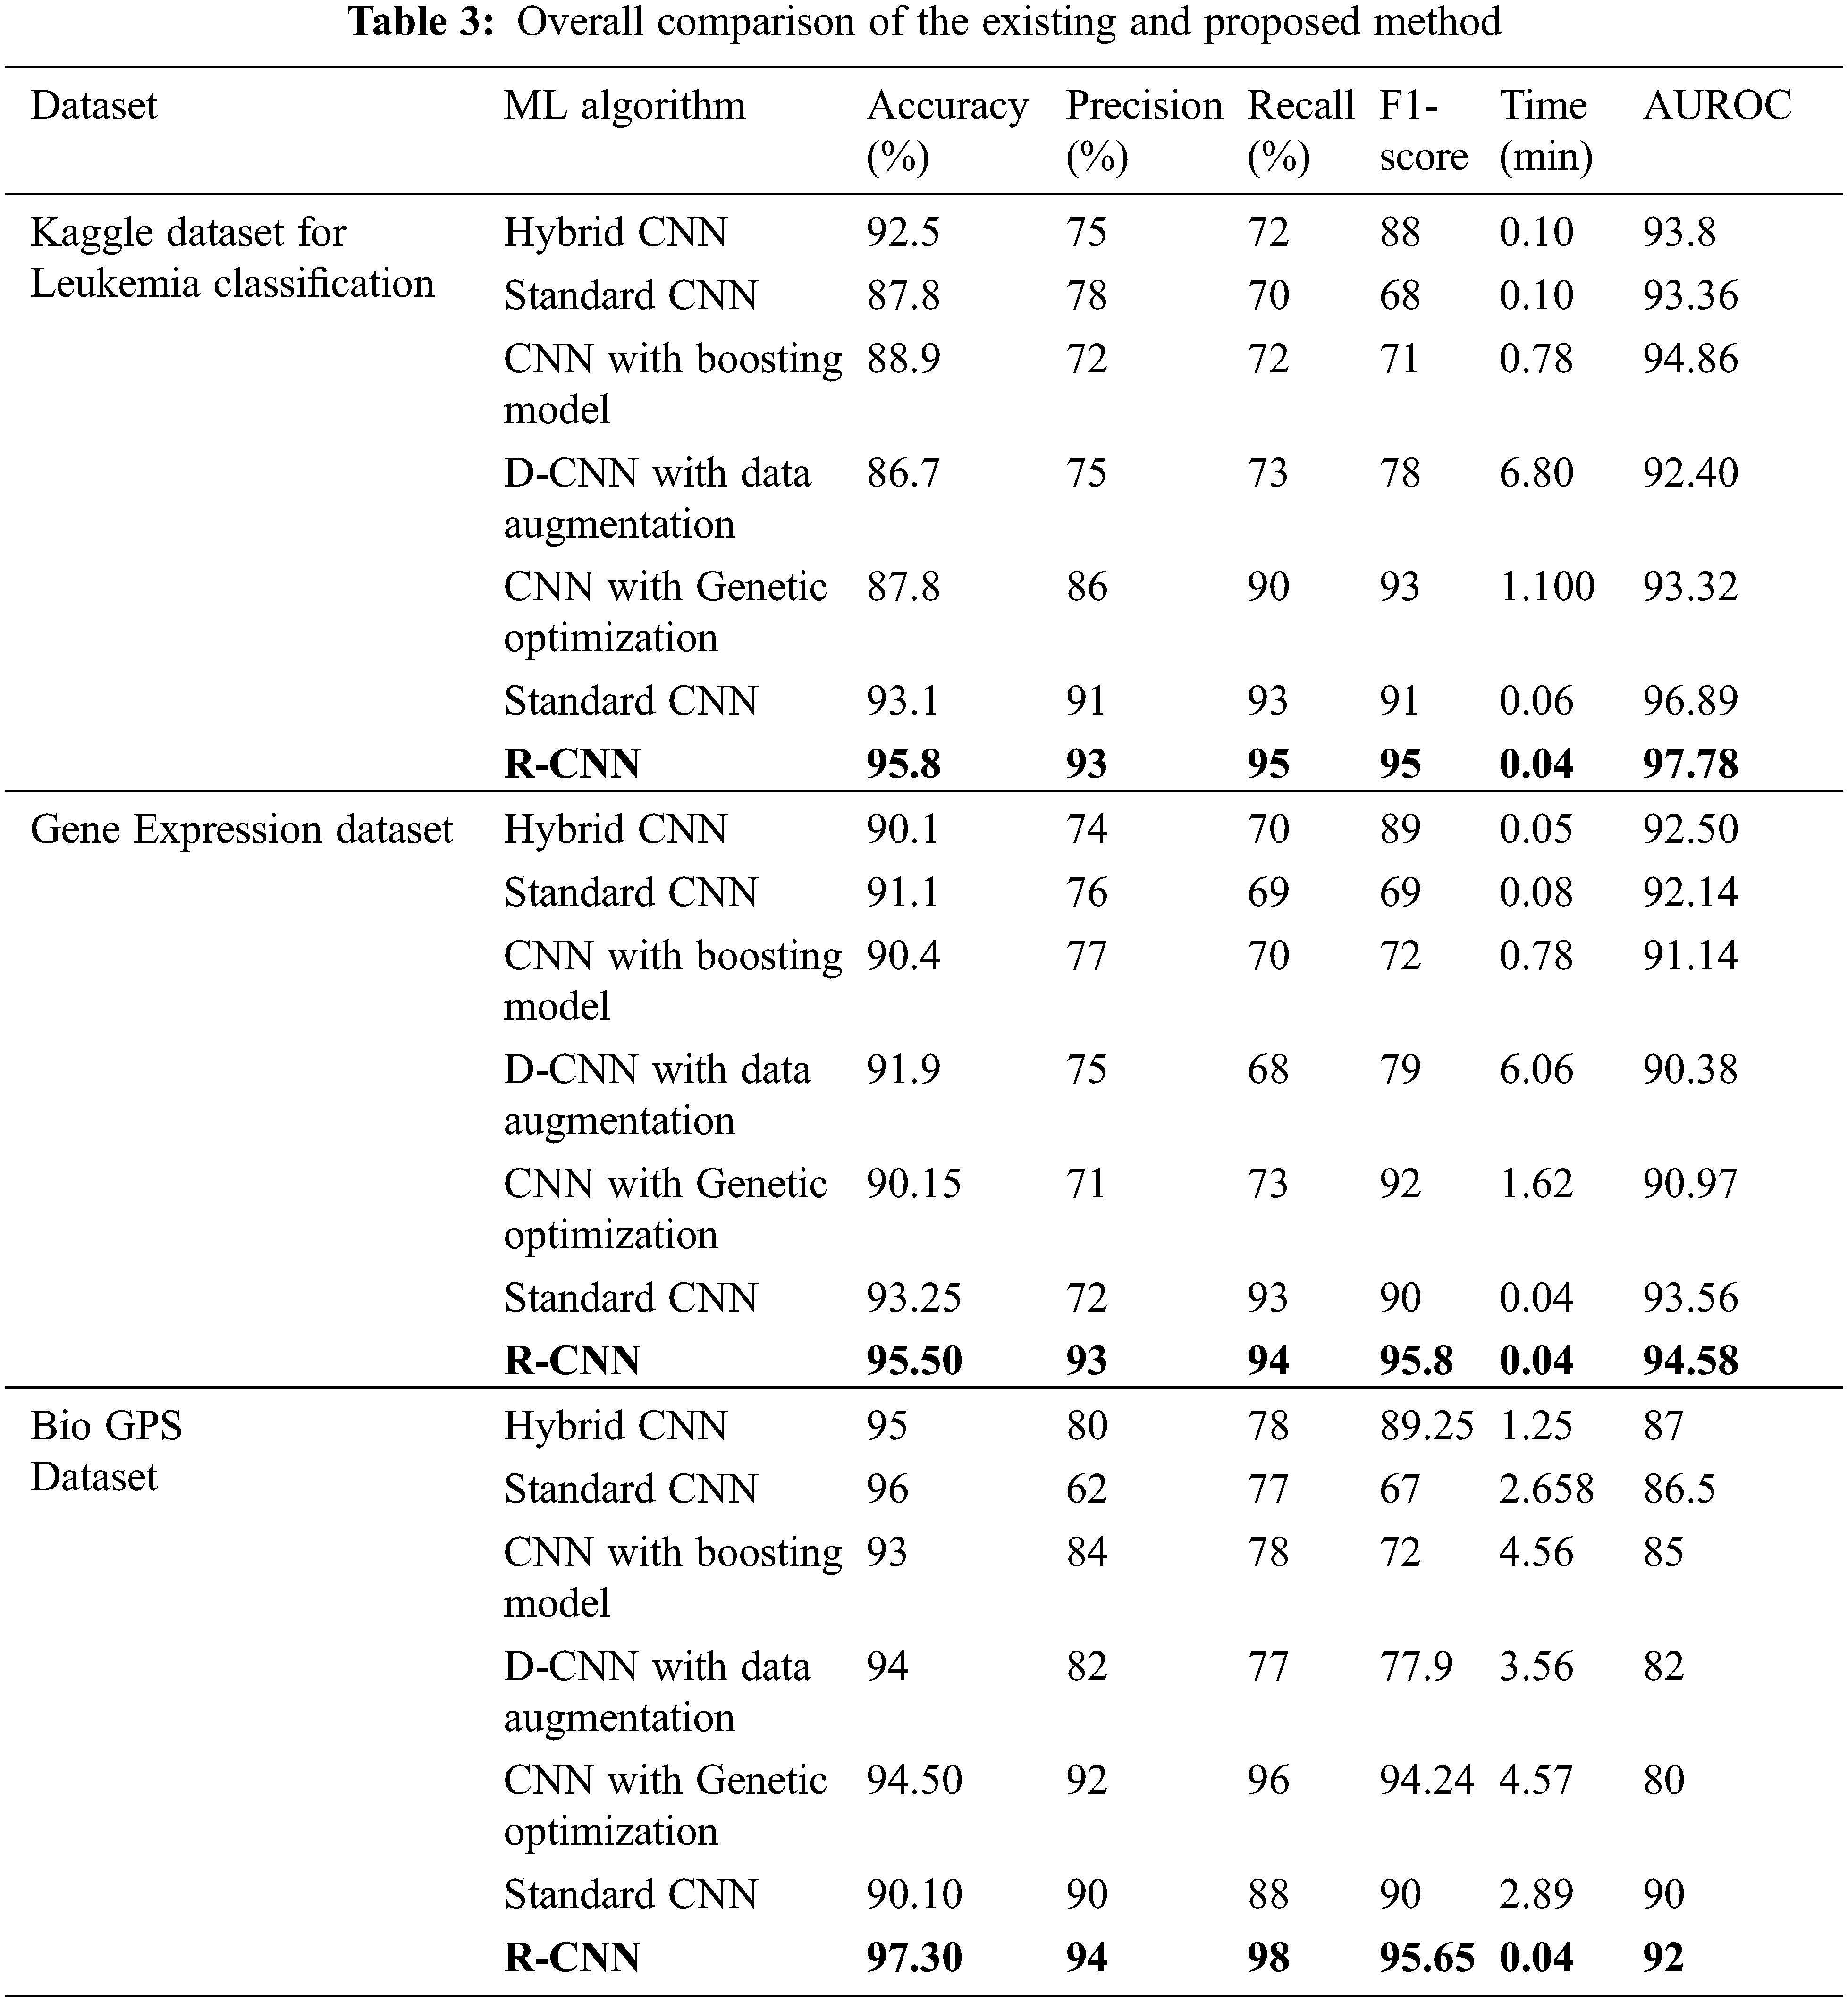
While performing the analysis with the Gene expression dataset, the model provides 95.50%, 93%, 94%, 95.8%, and 94.58% for accuracy, recall, precision, F1-score, and AUROC. The accuracy of the anticipated model is 95.50% which is 5.4%, 4.4%, 5.1%, 3.6%, 5.35% and 2.25% higher than other approaches. The precision of the anticipated model is 93% which is 19%, 17%, 16%, 22%, and 21% higher than other approaches. The recall of the anticipated model is 94% which is 24%, 25%, 24%, 21%, 21% and 1% higher than other approaches. The F1-score of the anticipated model is 95.8% which is 6.8%, 26.8%, 23.8%, 16.8%, 3.8% and 5.8% higher than other approaches. The AUROC of the anticipated model is 94.58% which is 2.08%, 2.44%, 3.44%, 4.2%, 4.2%, 3.61% and 1.02% higher than other approaches. In the case of the Bio GPS dataset, the accuracy of the anticipated model is 97.30, which is 2.3%, 1.3%, 4.3%, 3.3%, 2.8% and 7.2% higher than other approaches. Fig. 9 shows the performance metrics comparison.
The precision of the anticipated model is 94% which is 14%, 32%, 10%, 12%, 2% and 4% higher than other approaches. The recall of the anticipated model is 98% which is 20%, 21%, 20%, 21%, 2% and 10% higher than other approaches. The F1-score of the anticipated model is 95.65% which is 6.4%, 28.65%, 23.65%, 17.75%, 1.41% and 5.65% higher than other approaches. The AUROC of the anticipated model is 92% which is 5%, 4.5%, 7%, 10%, 12% and 2% higher than other approaches See Figs. 13 to 14.
The research attempts to improve the diagnostic accuracy of AML. We proposed the novel AML detection model using a Deep CNN. The proposed Faster R-CNN models are trained with a Single-cell Morphological Dataset. Based on the experimental results, the pixel accuracy is 98.32% compared with the other CNN algorithms, producing better results. Tab. 4 depicts the comparison of various performance metrics like R-CNN, Fast R-CNN, U-Net, Mask R-CNN and Faster R-CNN model. Here, metrics like pixel accuracy, Intersection over Union and dice coefficient are evaluated and compared with various other approaches. The pixel accuracy of the proposed Faster R-CNN model is 98.32%, IoU is 48.7%, and the dice coefficient is 97.56% See Figs. 10–12. Fig. 15 shows the overall comparison with Bio GPS dataset. Based on these analyses, it is proven that the anticipated model gives superior outcomes and establishes a better trade-off than other approaches.
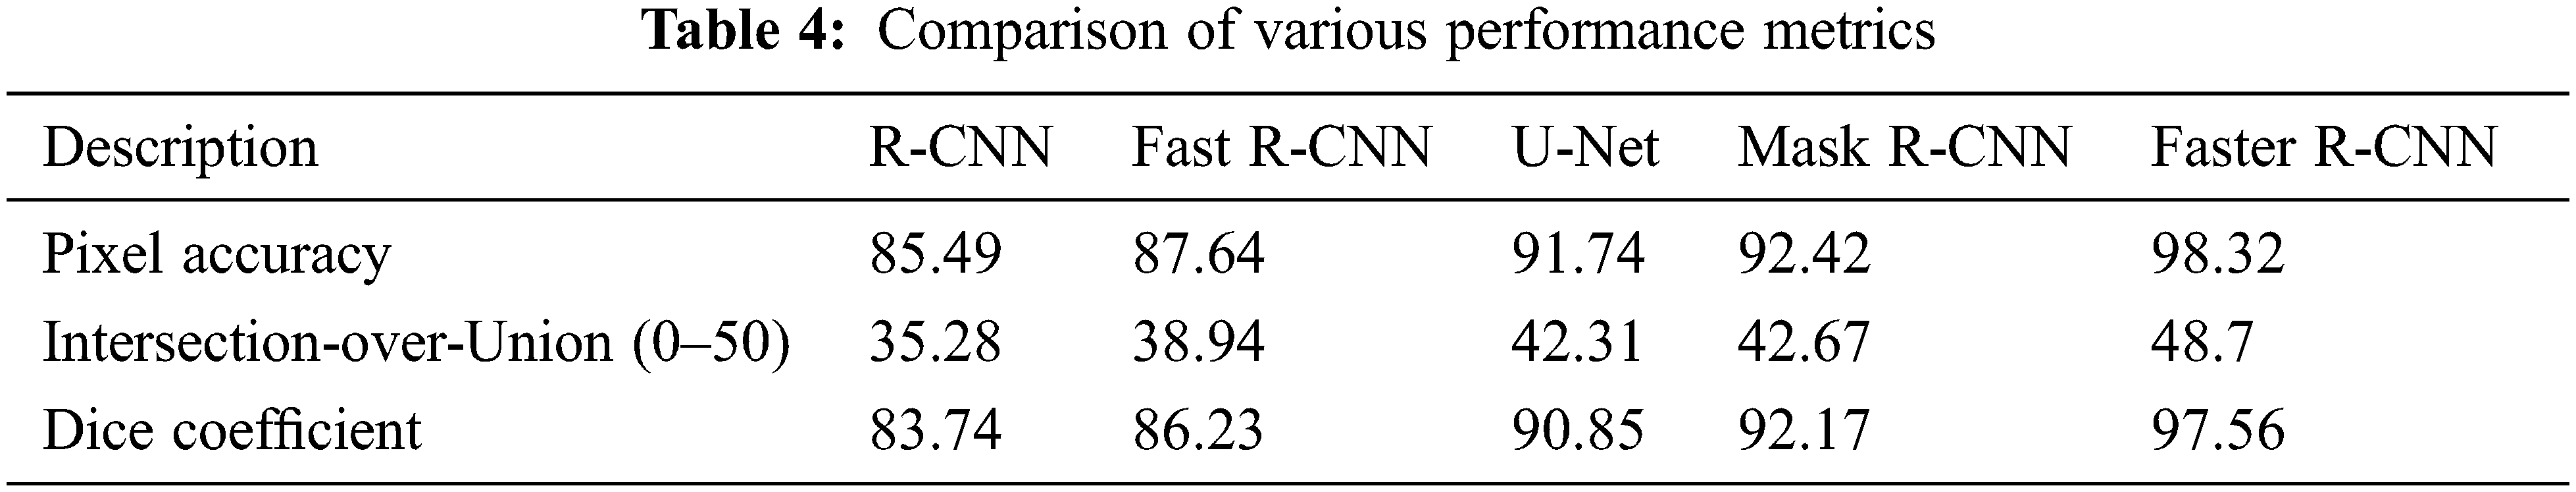
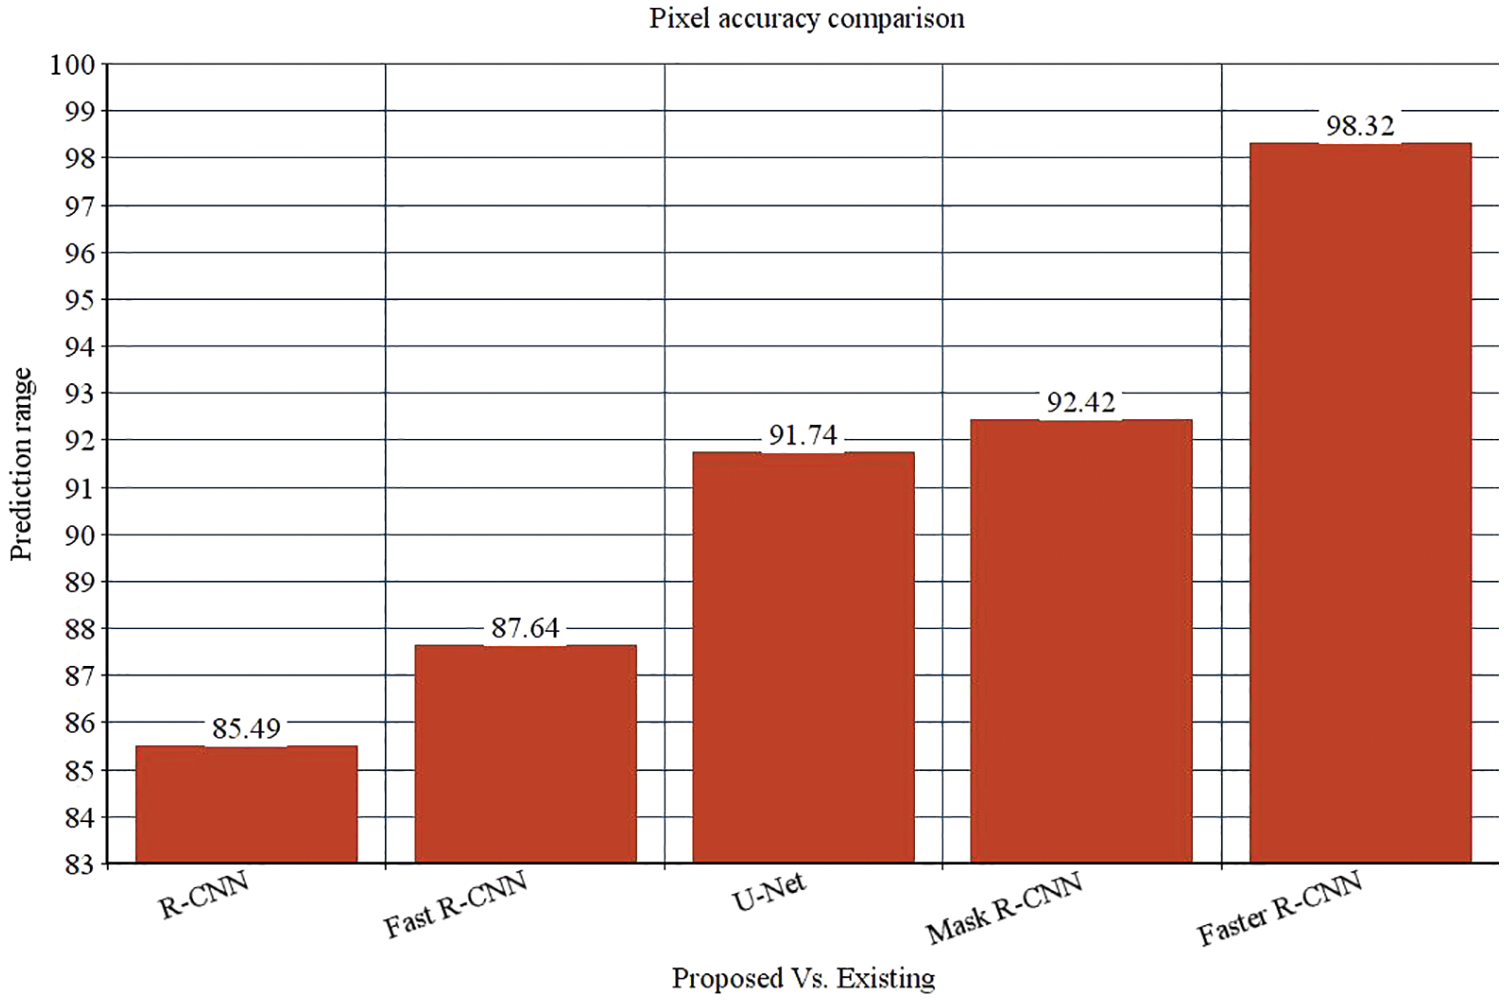
Figure 10: Pixel accuracy comparison
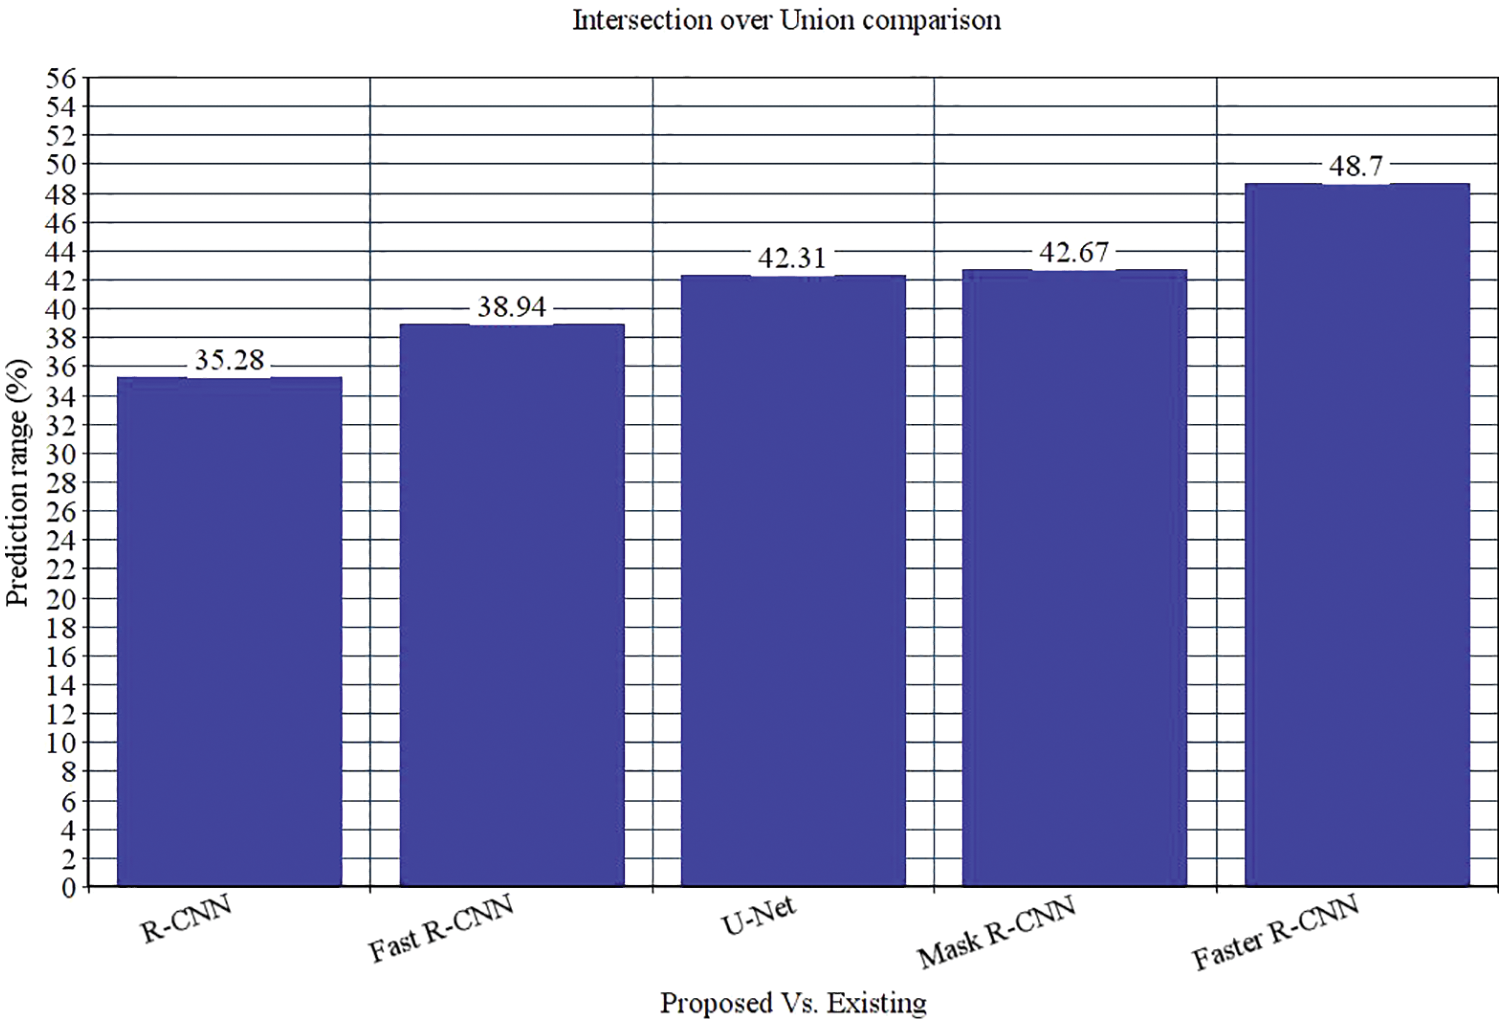
Figure 11: Intersection over Union comparison
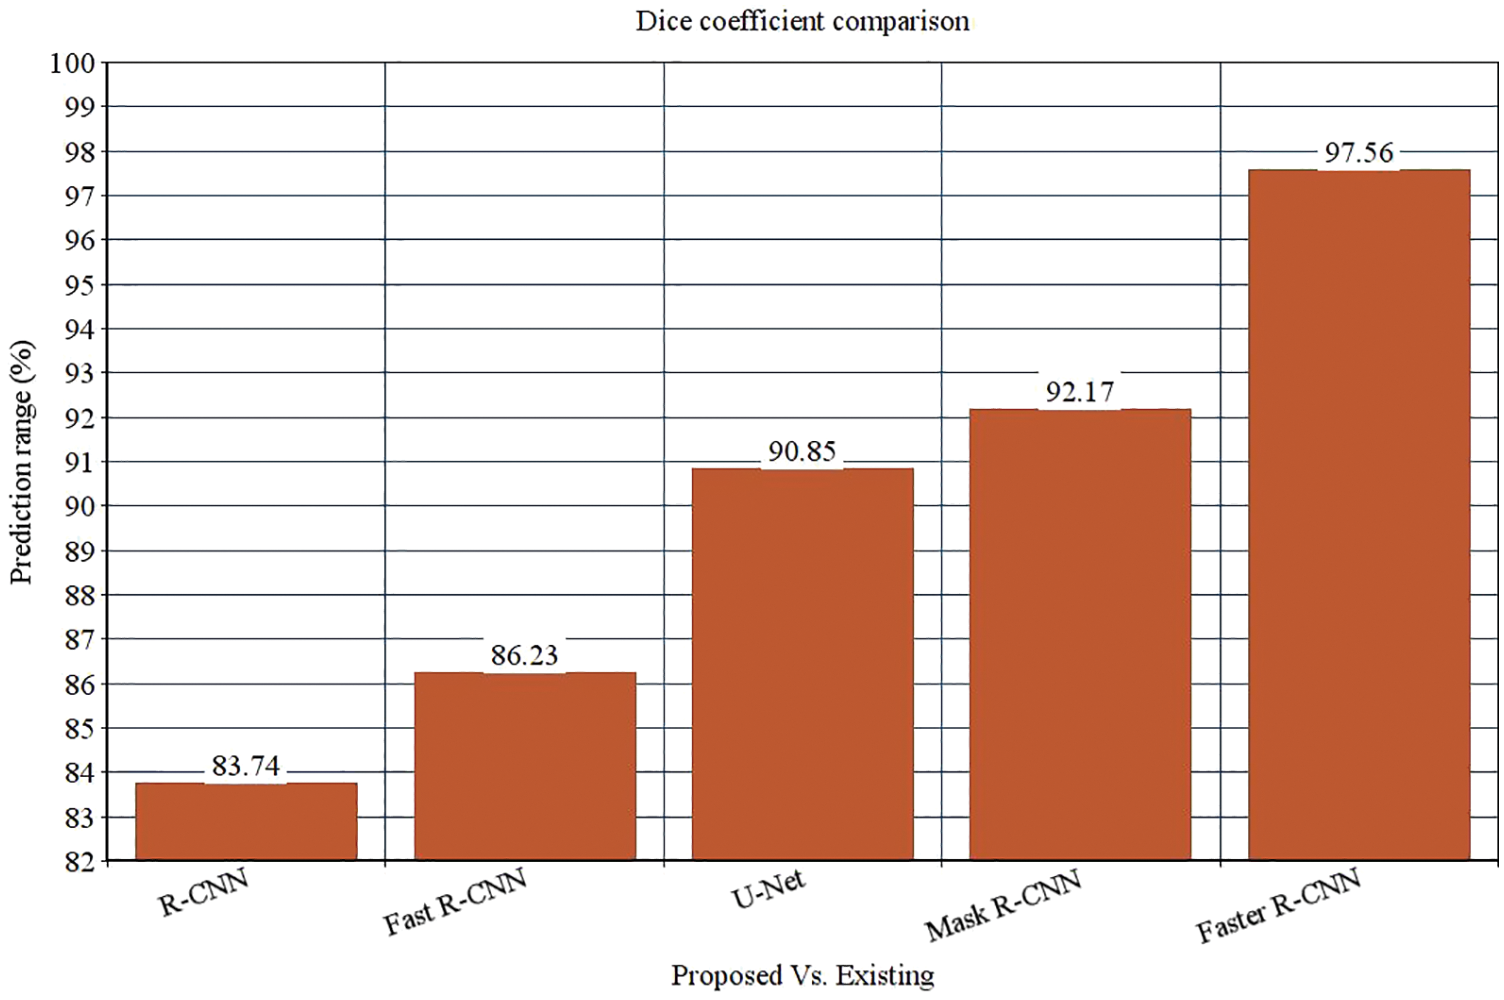
Figure 12: Dice coefficient comparison
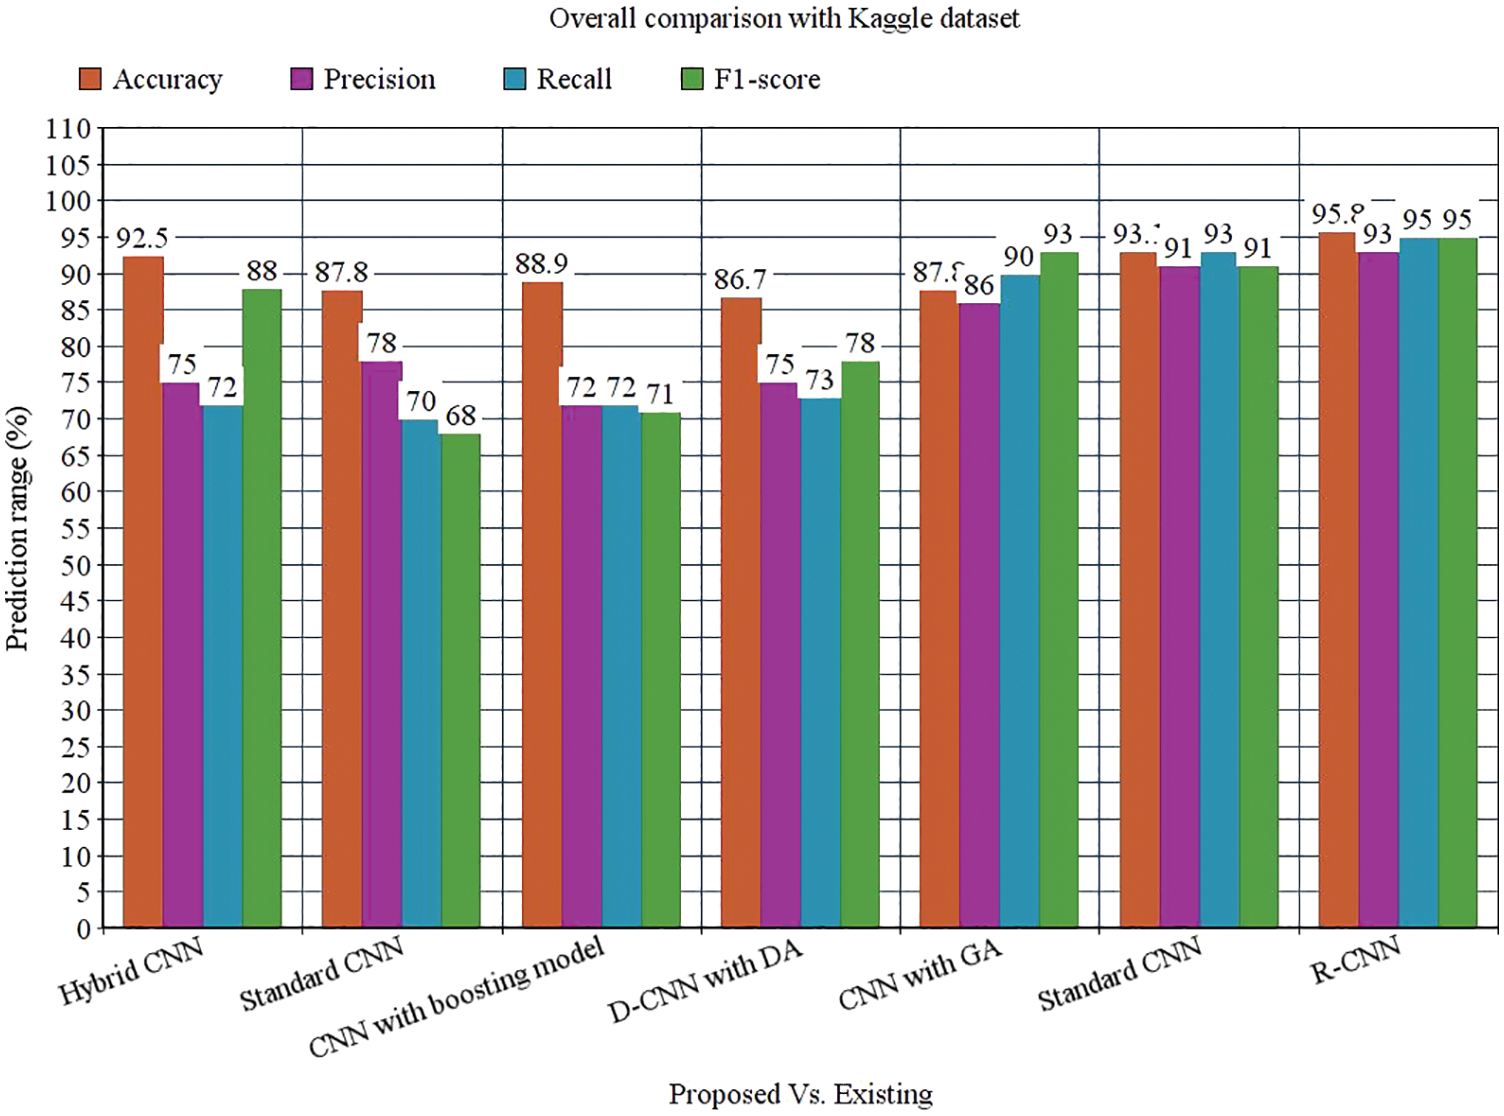
Figure 13: Overall comparison with Kaggle dataset
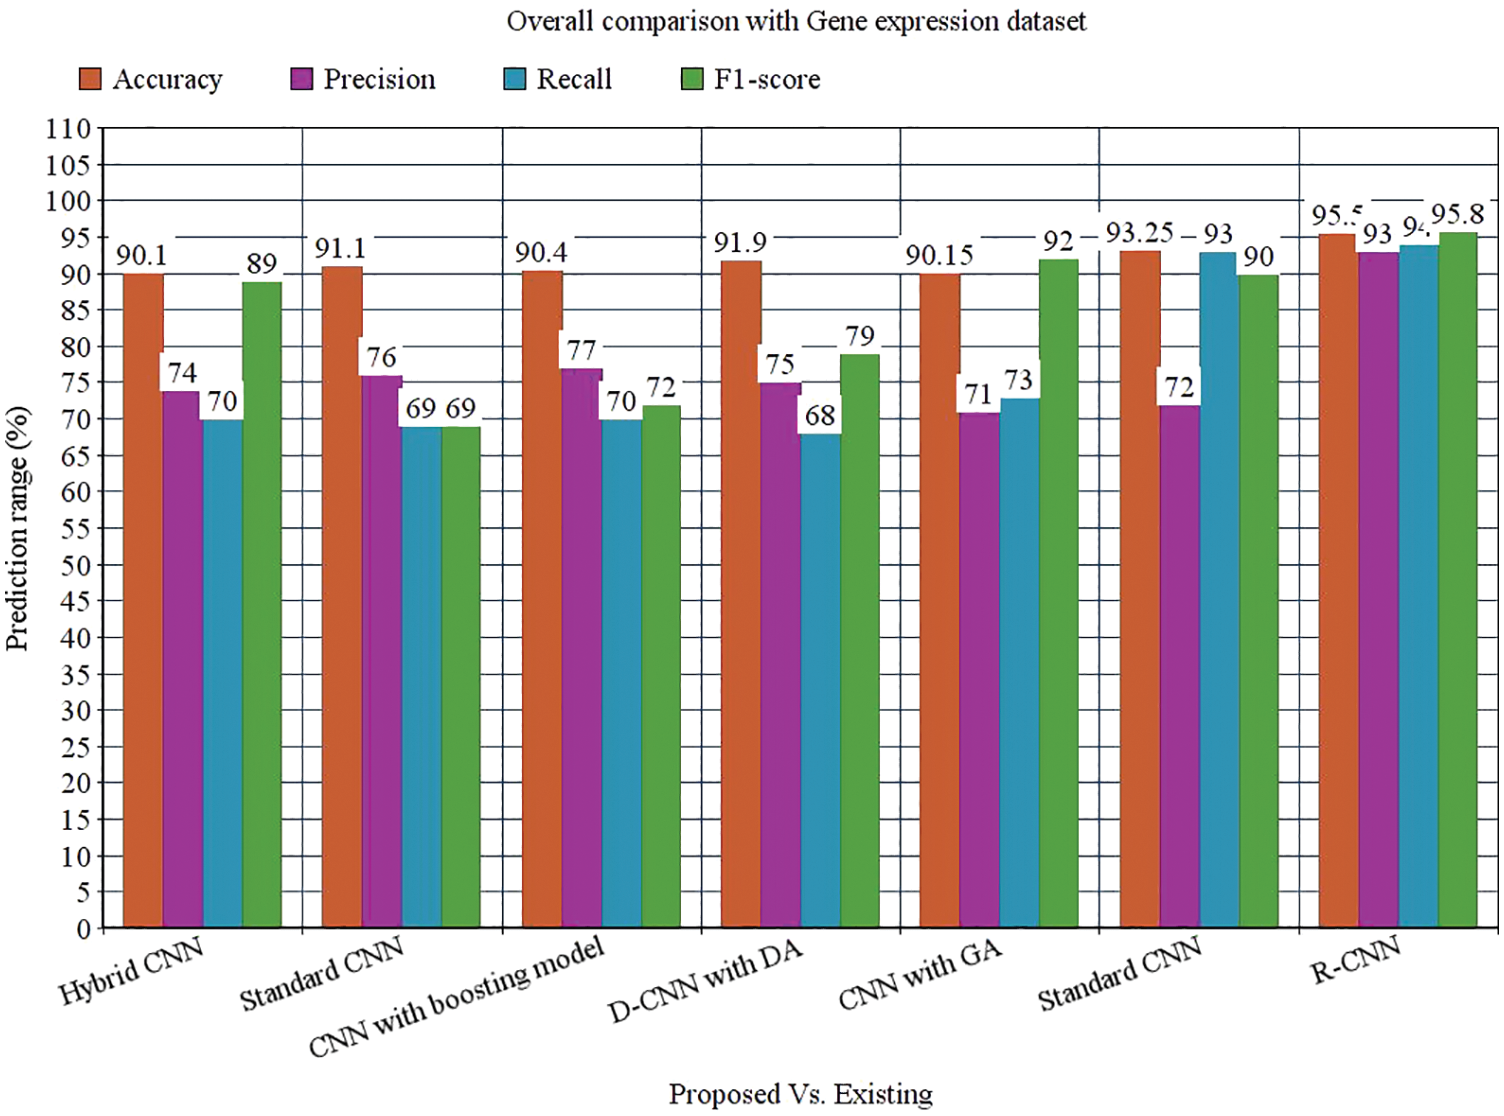
Figure 14: Overall comparison with Gene expression dataset
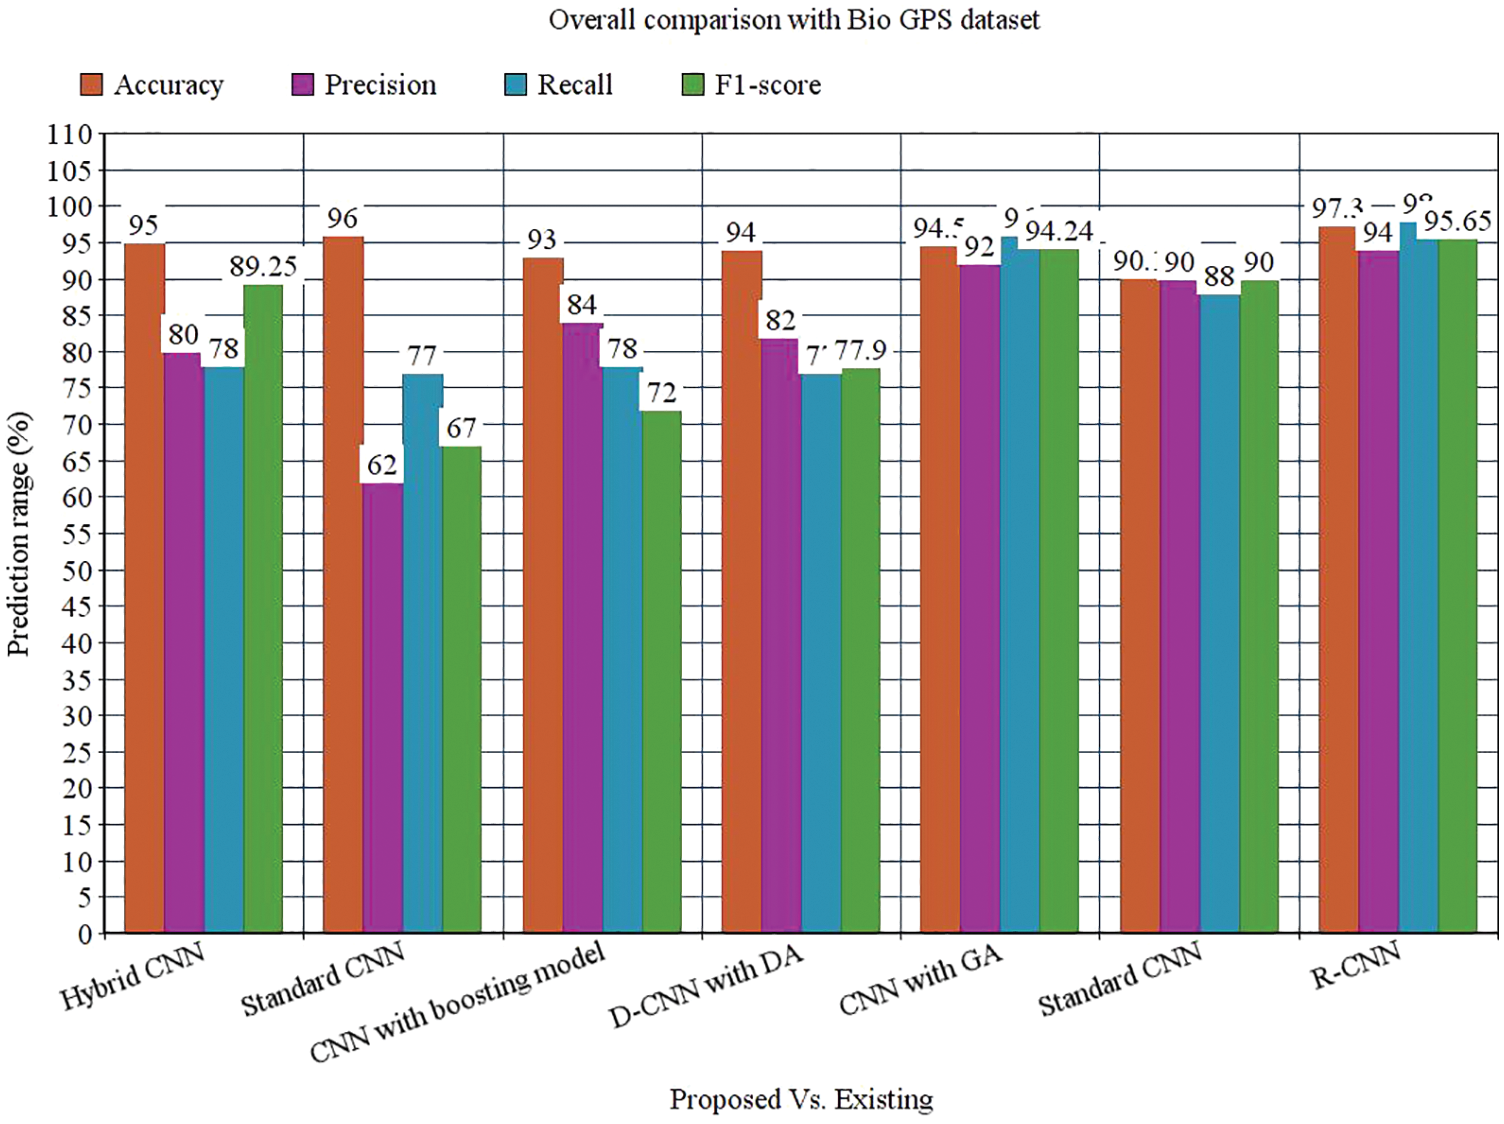
Figure 15: Overall comparison with Bio GPS dataset
Precise and accurate prediction of leukocytes is a complex task. The flexible structure of the nucleus generates a huge problem for the prediction of leukemia. A novel Faster R-CNN is proposed to overcome these issues. The optimal features are chosen to model a feature vector. Here, various metrics like hybrid CNN, standard CNN, boosting model, data augmentation, GA and DCNN model is evaluated with the proposed faster RCNN model. The proposed Faster R-CNN gives 97.30% prediction accuracy, 94% precision, 98% recall, 95.65% F-measure, 0.080 error rate and 0.2898 MCC. Other metrics like pixel accuracy, Intersection over Union and Dice coefficient are compared with other approaches like RCNN, Faster R-CNN, U-Net and mask R-CNN. The pixel accuracy is 98.32%, Intersection over union is 48.7%, and dice coefficient is 97.56%. The proposed model works well in the prediction of acute myeloid leukemia. However, the major limitation of the proposed model is the lack of optimized results. In the future, the proposed model is optimized with the meta-heuristic optimization approach to attain global and local optima.
Acknowledgement: I am extremely thankful to Management, Principal, Head of the department of Computer Science and Engineering, Vel Tech Rangarajan Dr. Sagunthala R&D Institute of Science and Technology for providing me laboratory facility in Vel Tech-AI Research Centre to carry out this work in successful way.
Funding Statement: The authors received no specific funding for this study.
Conflicts of Interest: The authors Mr. K. Venkatesh, Dr. S. Pasupathy, and Dr.S.P. Raja declare that they have no conflict of Interests to report regarding the present study.
References
1. X. Zhang, J. Zhou, W. Sun and S. Jha, “A lightweight CNN based on transfer learning for COVID-19 diagnosis,” Computers, Materials & Continua, vol. 72, no. 1, pp. 1123–1137, 2022. [Google Scholar]
2. A. Moawad, E. Islam, R. Vijayagopal, A. Rousseau and W. WeiBiao, “Explainable AI for a no-teardown vehicle component cost estimation: A top-down approach,” IEEE Access, vol. 2, pp. 258–270, 2019. [Google Scholar]
3. G. Fragkos, C. Minwalla and J. Plusquellic, “Artificially intelligent electronic money,” IEEE Consumer Electronics Magazine, vol. 10, no. 4, pp. 81–29, 2020. [Google Scholar]
4. W. Wang, H. Liu, J. Li, H. Nie and X. Wang, “Using CFW-net deep learning models for X-ray images to detect COVID-19 patients,” International Journal of Computational Intelligence Systems, vol. 14, no. 1, pp. 199–207, 2021. [Google Scholar]
5. E. Ladikou and H. Sivaloganathan, “Moving object segmentation by background subtraction and Temporal analysis,” IEEE Access, vol. 6, no. vol. 5, pp. 312–326, 2020. [Google Scholar]
6. P. Yang, G. Liu, X. Li, L. Qin and X. Liu, “An intelligent tumors coding method based on drools,” Journal of New Media, vol. 2, no. 3, pp. 111–119, 2020. [Google Scholar]
7. D. Zhang, J. Hu, F. Li, X. Ding, A. Sangaiah et al., “Small object detection via precise region-based fully convolutional networks,” Computers, Materials and Continua, vol. 69, no. 2, pp. 1503–1517, 2021. [Google Scholar]
8. J. Wang, Y. Wu, S. He, P. Sharma, X. Yu et al., “Lightweight single image super-resolution convolution neural network in portable device,” KSII Transactions on Internet and Information Systems (TIIS), vol. 15, no. 11, pp. 4065–4083, 2021. [Google Scholar]
9. L. Zhang, J. Zhang, T. Tan and X. Teng, “Deep learning methods for lung cancer segmentation in whole-slide histopathology images—The ACDC@LungHP challenge 2019.” IEEE Journal of Biomedical and Health Informatics, vol. 25, no. 2, pp. 312–321, 2021. [Google Scholar]
10. J. Wang, Y. Zou, P. Lei, R. Sherratt and L. Wang, “Research on recurrent neural network-based crack opening prediction of concrete dam,” Journal of Internet Technology, vol. 21, no. 4, pp. 1161–1169, 2020. [Google Scholar]
11. C. Matek and K. Spiekermann, “Human-level recognition of blast cells in acute myeloid leukemia with convolutional neural networks,” Nat Mach Intelligence, vol. 1, pp. 538–544, 2019. [Google Scholar]
12. J. Yue-HeiNg, M. Hausknecht, S. Vijayanarasimha and G. Toderici, “Beyond short snippets: Deep networks for video classification.” in The IEEE Conf. on Computer Vision and Pattern Recognition (CVPR), Boston, vol. 12, no. 5, pp. 367–373, 2015. [Google Scholar]
13. J. Wang, H. Ding, F. Bidgoli, B. Zhou and P. Baldi, “Detecting cardiovascular disease from mammograms with deep learning,” IEEE Transaction on Medical Imaging, vol. 5, pp. 1172–81, 2019. [Google Scholar]
14. T. Huang, G. Shenand and Z. Deng, “Enhancing long short-term memory for text categorization,” in Proc. of the Twenty-Eighth Int. Joint Conf. on Artificial Intelligence, IJCAI, Macao, vol. 7, pp. 10–16, 2019. [Google Scholar]
15. K. Simonyan and A. Zisserman, “Very deep convolutional networks for large-scale image recognition,” in, 3rd Int. Conf. on Learning Representations, ICLR 2015, San Diego, vol. 23, no. 10, pp. 1637–1650, 2018. [Google Scholar]
16. Y. Guan, J. Jiang and J. Yang, “Developing a cardiovascular disease risk factor annotated corpus of Chinese electronic medical records,” BMC Med Information Decision Making, vol. 17, no. 2, pp. 117–121. 2020. [Google Scholar]
17. X. Mao, Y. Duan and H. Wang, “ Named entity recognition of electronic medical record in ophthalmology based on CRF model,” in Int. Conf. on Computer Technology, Electronics and Communication (ICCTEC), China, vol. 35, no. 1, pp. 42–54, 2019. [Google Scholar]
18. X. Hong, R. Lin, C. Yang and X. Zeng, “Predicting Alzheimer’s disease using LSTM,” IEEE Access, vol. 2, pp. 1–7, 2020. [Google Scholar]
19. W. Song, J. Yang, Q. Wang and T. Yang, “Drug specification named entity recognition based on BILSTM-CRF model,” in 43rd IEEE Annual Computer Software and Applications Conf., China, vol. 2, pp. 429–435, 2019. [Google Scholar]
20. V. Ravi, V. Acharya and T. D. Pham, “Attention deep learning-based large-scale learning classifier for cassava leaf disease classification,” Expert System, vol. 8, no. 5, pp. 411–423, 2020. [Google Scholar]
21. J. F. Tusubira, S. Nsumba, N. Ninsiima and S. Mwebaze, “Improving in-field cassava whitefly pest surveillance with machine learning.” in Proc. of the IEEE/CVF Conf. on Computer Vision and Pattern Recognition Workshops, Seattle, WA, USA, vol. 21, no. 3, pp. 14–19, 2020. [Google Scholar]
22. H. Döhner, S. Amadori, F. R. Appelbaum and T. Büchner, “Diagnosis and management of AML in adults,” ELNRecommendations from an International Expert Panel, USA, pp. 28–33, 2019. [Google Scholar]
23. B. J. Bain and M. C. Béné, “Morphological and immunophenotypic clues to the WHO categories of acute myeloid leukaemia. acta hematol,” in 5th IEEE Int. Conf. on Intelligent Systems, Modeling and Simulation, Malaysia, pp. 235–241, 2018. [Google Scholar]
24. D. Rose, T. Haferlach, S. Schnittger and C. Haferlach, “Specific patterns of molecular mutations determine the morphologic differentiation stages in acute myeloid leukaemia (AML). blood,” IEEE Transactions on Systems, vol. 35, no. 1, pp. 42–54, 2020. [Google Scholar]
25. J. Rodellar, S. Alférez, A. Acevedo and S. Merino, “Image processing and machine learning in the morphological analysis of blood cells,” International Journal of Lab Hematol, USA, vol. 21, pp. 280–287, 2018. [Google Scholar]
26. C. Röllig, M. Kramer, M. Gabrecht and C. Kaiser, “Intermediate dose cytarabine plus mitoxantrone versus standard-dose cytarabine plus daunorubicin for acute myeloid leukemia in elderly patients,” An Oncology, vol. 13, no. 13, pp. 167–172, 2019. [Google Scholar]
27. R. Noppeney, C. Tidow and U. Krug, “Addition of sorafenib versus placebo to standard therapy in patients aged 60 years or younger with newly diagnosed acute myeloid leukaemia a multicentre, phase 2, randomized controlled trial,” Lancet Oncol, vol. 7, pp. 534–540, 2020. [Google Scholar]
28. S. Swerdlow, R. Siebert, R. Radke and B. Roysam, “Image change detection algorithms: A systematic survey,” IEEE Transaction on Image Processing, vol. 14, pp. 294–307, 2019. [Google Scholar]
29. G. Bebis, A. Gyaourova, and I. Pavlidis, “Face recognition by fusing thermal infrared and visible imagery,” Image and Vision Computing, Malaysia, vol. 21, pp. 235–241, 2020. [Google Scholar]
30. J. Mori, S. Kaji and H. Kawai, “A survey on image data augmentation for deep learning,” Journal of Big Data, vol. 6, no. 1, pp. 60–66, 2019. [Google Scholar]
Cite This Article
 Copyright © 2023 The Author(s). Published by Tech Science Press.
This work is licensed under a Creative Commons Attribution 4.0 International License , which permits unrestricted use, distribution, and reproduction in any medium, provided the original work is properly cited.
 Downloads
 Citation Tools