
 Submit a Paper
 Propose a Special lssue
 Open Access
ARTICLE
A Boosted Tree-Based Predictive Model for Business Analytics
1 Department of Business Information Technology, Princess Sumaya University for Technology, Amman, Jordan
2 Department of Information Technology, College of Computer and Information Technology, Taif University, P.O. Box. 11099, Taif, 21994, Saudi Arabia
3 Department of Computer Science, College of Computers and Information Technology, Taif University, P.O. Box 11099, Taif 21944, Saudi Arabia
* Corresponding Author: Mehedi Masud. Email:
Intelligent Automation & Soft Computing 2023, 36(1), 515-527. https://doi.org/10.32604/iasc.2023.030374
Received 24 March 2022; Accepted 15 June 2022; Issue published 29 September 2022
 View Full Text
 Download PDF
Abstract
Business Analytics is one of the vital processes that must be incorporated into any business. It supports decision-makers in analyzing and predicting future trends based on facts (Data-driven decisions), especially when dealing with a massive amount of business data. Decision Trees are essential for business analytics to predict business opportunities and future trends that can retain corporations’ competitive advantage and survival and improve their business value. This research proposes a tree-based predictive model for business analytics. The model is developed based on ranking business features and gradient-boosted trees. For validation purposes, the model is tested on a real-world dataset of Universal Bank to predict personal loan acceptance. It is validated based on Accuracy, Precision, Recall, and F-score. The experiment findings show that the proposed model can predict personal loan acceptance efficiently and effectively with better accuracy than the traditional tree-based models. The model can also deal with a massive amount of business data and support corporations’ decision-making process.Keywords
The role of analytics is crucial for helping corporations survive and achieve their business goals, and support decision-makers. Business Analytics (BA) uses data analysis methods such as statistical methods and Data Mining (DM) techniques used for analyzing business data, discovering new patterns and insights, and predicting new business outcomes [1]. The dramatic revolution of technology and the emergence of the Internet of Things have radically changed how we carry out our businesses, where massive amounts of business data are stored daily. These data are one of the core assets of any corporation. They must be analyzed efficiently and effectively to support decision-makers with the final objective of fostering the corporation’s performance [2]. Machine Learning (ML) techniques have an important role in analyzing these data, providing reliable information on how the business operates, and predicting corporations’ future performance.
Predictive Analytics (PA) is one of the common branches of BA in which ML techniques such as Decision Trees (DT) can be utilized. DT are among the most popular predictive models used in PA that fall under supervised learning [3,4]. Within tree-based classifications, a predictive model is built to predict a particular class. It can, for example, predict whether bank clients will accept or reject a personal loan offer. For each node in the tree, decisions are made till the last node is obtained in which the class (i.e., accept or reject personal loan) is identified [1].
Massive business data, consisting of both structured and unstructured data with different dimensions, are stored daily in the corporations’ data centers. Moreover, the number of business features that reflect each business transaction can affect the prediction accuracy and performance, especially when all business features are included in the analysis process. Thus, the need for reliable and efficient predictive models for BA is significant for many corporations to seek competitive advantage and survival.
This paper develops a tree-based predictive model for BA using a proposed business features ranking approach and boosted trees. The model seeks to make more accurate predictions and make BA computation less complex, and make the following contributions to this field of research:
• A tree-based predictive model for BA is proposed to support decision-makers efficiently.
• The model is developed by considering the ranking of business features using a selection and ranking approach.
• A boosting approach is developed using the gradient-boosted tree algorithm.
• The proposed model is applied to an actual data set with 5000 records for Universal bank data to evaluate it based on predefined evaluation metrics, compared to the traditional tree-based model.
The rest of this paper is organized as follows: The most recent work for predictive business models is discussed in Section 2. In Section 3, the tree-based predictive model for BA is proposed and designed, considering the ranking of business features and the gradient-boosted tree algorithm. In Section 4, experiments are presented to evaluate the model. The final section is the conclusion which summarizes possible developments of this work.
In the late 20th century, there was an apparent interest in BA from researchers and corporations. In order to be efficient and effective, data-driven corporations rely heavily on high-quality data for decision-making. However, big business data can affect the analysis process, leading to inefficient and ineffective decisions [5]. Therefore, analysts resort to DM and ML techniques as they can play a significant role in dealing with this massive amount of business data for supporting decision-making [6]. The application of ML techniques in business could bring a catalytic change in business [7]. A considerable number of studies investigate the application of ML techniques in BA [8–17]. In their study, Singh et al. [7] stated that Decision tree-based algorithms and support vector machine algorithms are the most utilized supervised learning algorithm in Customer Relationship Management. These algorithms can be utilized for customer identification, customer attraction, and customer retention. Al-Zuabi et al. [18] applied different ML algorithms to the age and gender of consumers based on mobile phone data to target potential customers for particular marketing campaigns. Based on different classification algorithms such as DT and Random Forests, Wassouf et al. [19] proposed a predictive model to build an accurate predictive model for classifying new SyriaTel Telecom Company users by loyalty. The researchers stated that the proposed model was capable of handling and processing a bulk of information quickly and efficiently. Corporations are currently generating a massive amount of business data. This is one of the biggest challenges that corporations’ decision-makers could encounter in processing and analyzing these data.
Other studies have also investigated the application of ML techniques in different sectors such as Health Care, Manufacturing, Supply Chain, etc. For instance, Sharma et al. [20] applied two classification algorithms to data collected in India about COVID-19 with the aim of aiding healthcare professionals to make decisions about how to deal with the pandemic. By the same token, Antosz et al. [21] sought to bring the operating costs down for manufacturers by using DT to implement the concept of lean maintenance. Moreover, Panjwani et al. [22] implemented DT to predict the safe level of pathogens present during the processes involved in biological manufacturing to support streamlining the drug process development. In the supply chain context, Magalhães [23] utilized DT in final decision-making for online grocery to predict customer purchase trends. Similarly, Qian et al. [24] applied DT using the CHAID algorithm to predict air pollutant emissions and supply chain in China to help the government implement green supply chain management. Meire [25] examined different predictive and classification models, including DT (i.e., Random Forests) and Support Vector Machines (SVMs) to analyze the customer comeback rate and identify the main criteria and challenges of the customer comeback. The study revealed that social media data are significant determinants and predictors of customer comeback [25].
Last but not least, PA has wide applications in transportation as well. Pappalardo et al. [26] proposed a tree-based method to analyze the Performance of Lane Support Systems, which can help reduce crash accidents. ML techniques are an integral part of BA. Moreover, efficient and effective predictive models are essential for any business to survive and compete as these models deal with and process the enormous business data to support data-driven decisions and improve the corporations’ overall performance.
The current paper presents a tree-based predictive model for BA and is based on our previous work in [27], which introduced a valuable cyber security tool in the form of an intrusion detection model. It was developed using DT, considering the ranking of security attributes to predict cyber-attacks efficiently and effectively. This paper expands the capability of this model by incorporating the concept of boosted trees to improve the prediction accuracy. However, the model is adapted to process and analyze business data and is applied to a dataset of 5000 records of the Universal Bank to validate its prediction accuracy. The model can, thus, deal with enormous business features with different dimensions and identify the most significant features by ranking them before the prediction process.
In this section, the proposed model is introduced and discussed in detail, highlighting the main processes involved in it.
The structure of our predictive model for BA consists of three major parts, the first of which includes the processes of data exploration, preprocessing, and standardization, which are of the utmost importance in building the predictive approach founded on feature ranking and selection. The other parts are about training, testing, and building our classification model that can predict a particular business outcome. Fig. 1 shows the suggested model, the steps of which are subsequently set forth in detail.
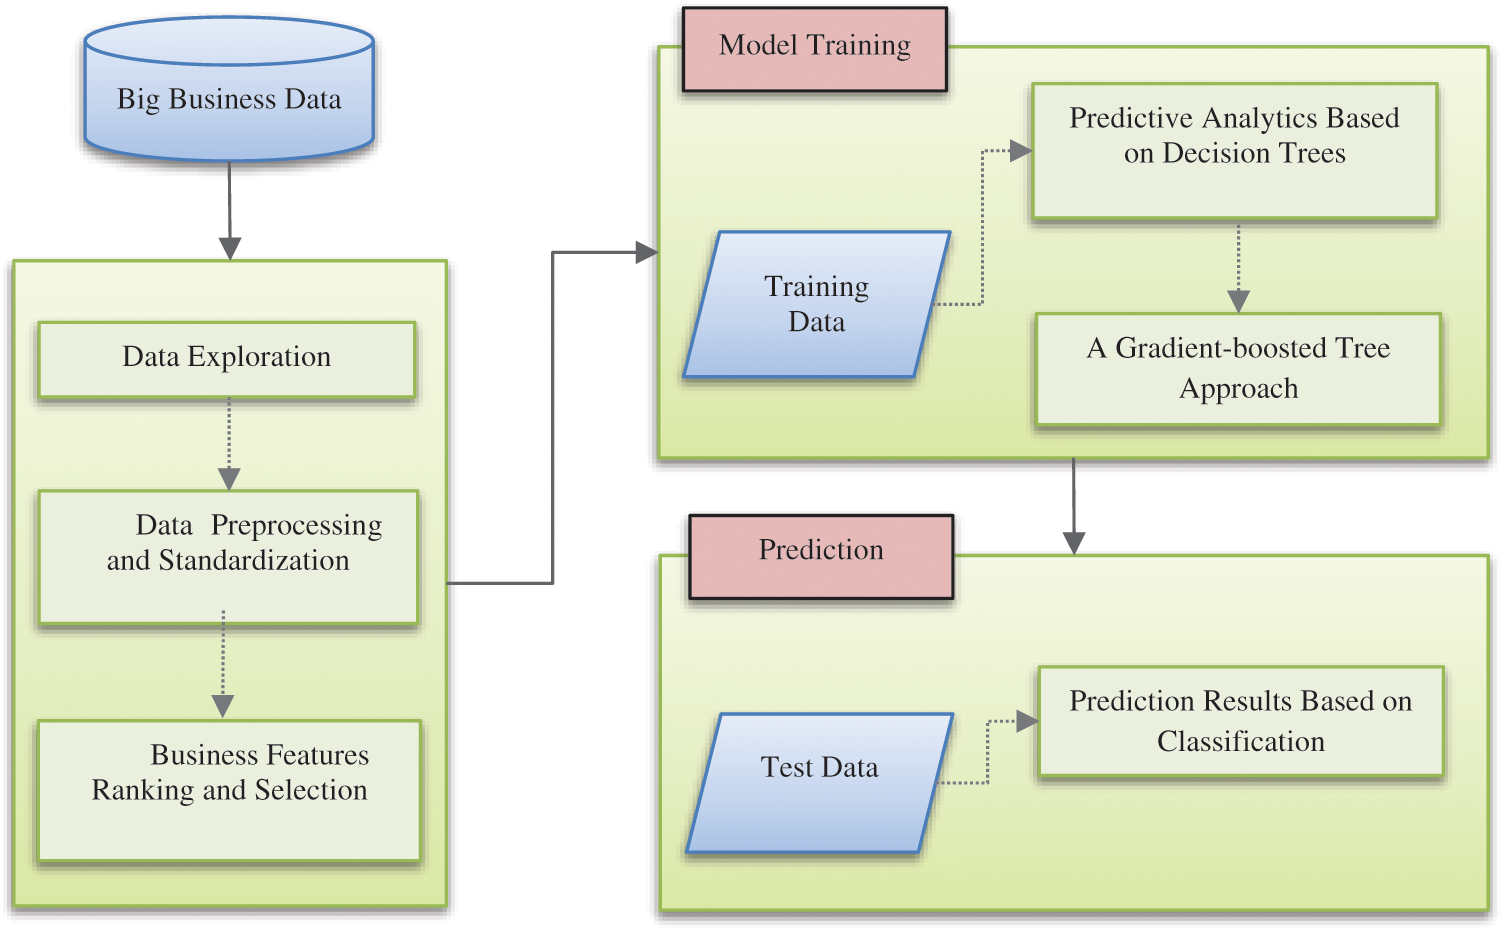
Figure 1: The proposed structure
It is crucial that the data used is of high quality since poor data could seriously affect prediction accuracy. Therefore, we have created a data exploration process which examines the features of the data, highlights any integrity issues, and cleans the data where necessary. Furthermore, feature types are categorized as being either numerical or categorical as part of this process, which is crucial if we are to accurately apply prediction metrics and form useful conclusions regarding the data. This paper uses a dataset with 5000 records from the universal bank which is open to examination by the public on the Kaggle website [28]. It consists of 14 columns which can be called business features. The dataset’s features “id” and “Zipcode” are dropped and excluded from the analysis process. The last business feature in the dataset is “personal_loan”, the class feature used to determine whether a bank client will accept a personal loan. Once the data exploration process has been carried out, the remaining 11 features will be included in the analysis, as presented in Tab. 1.
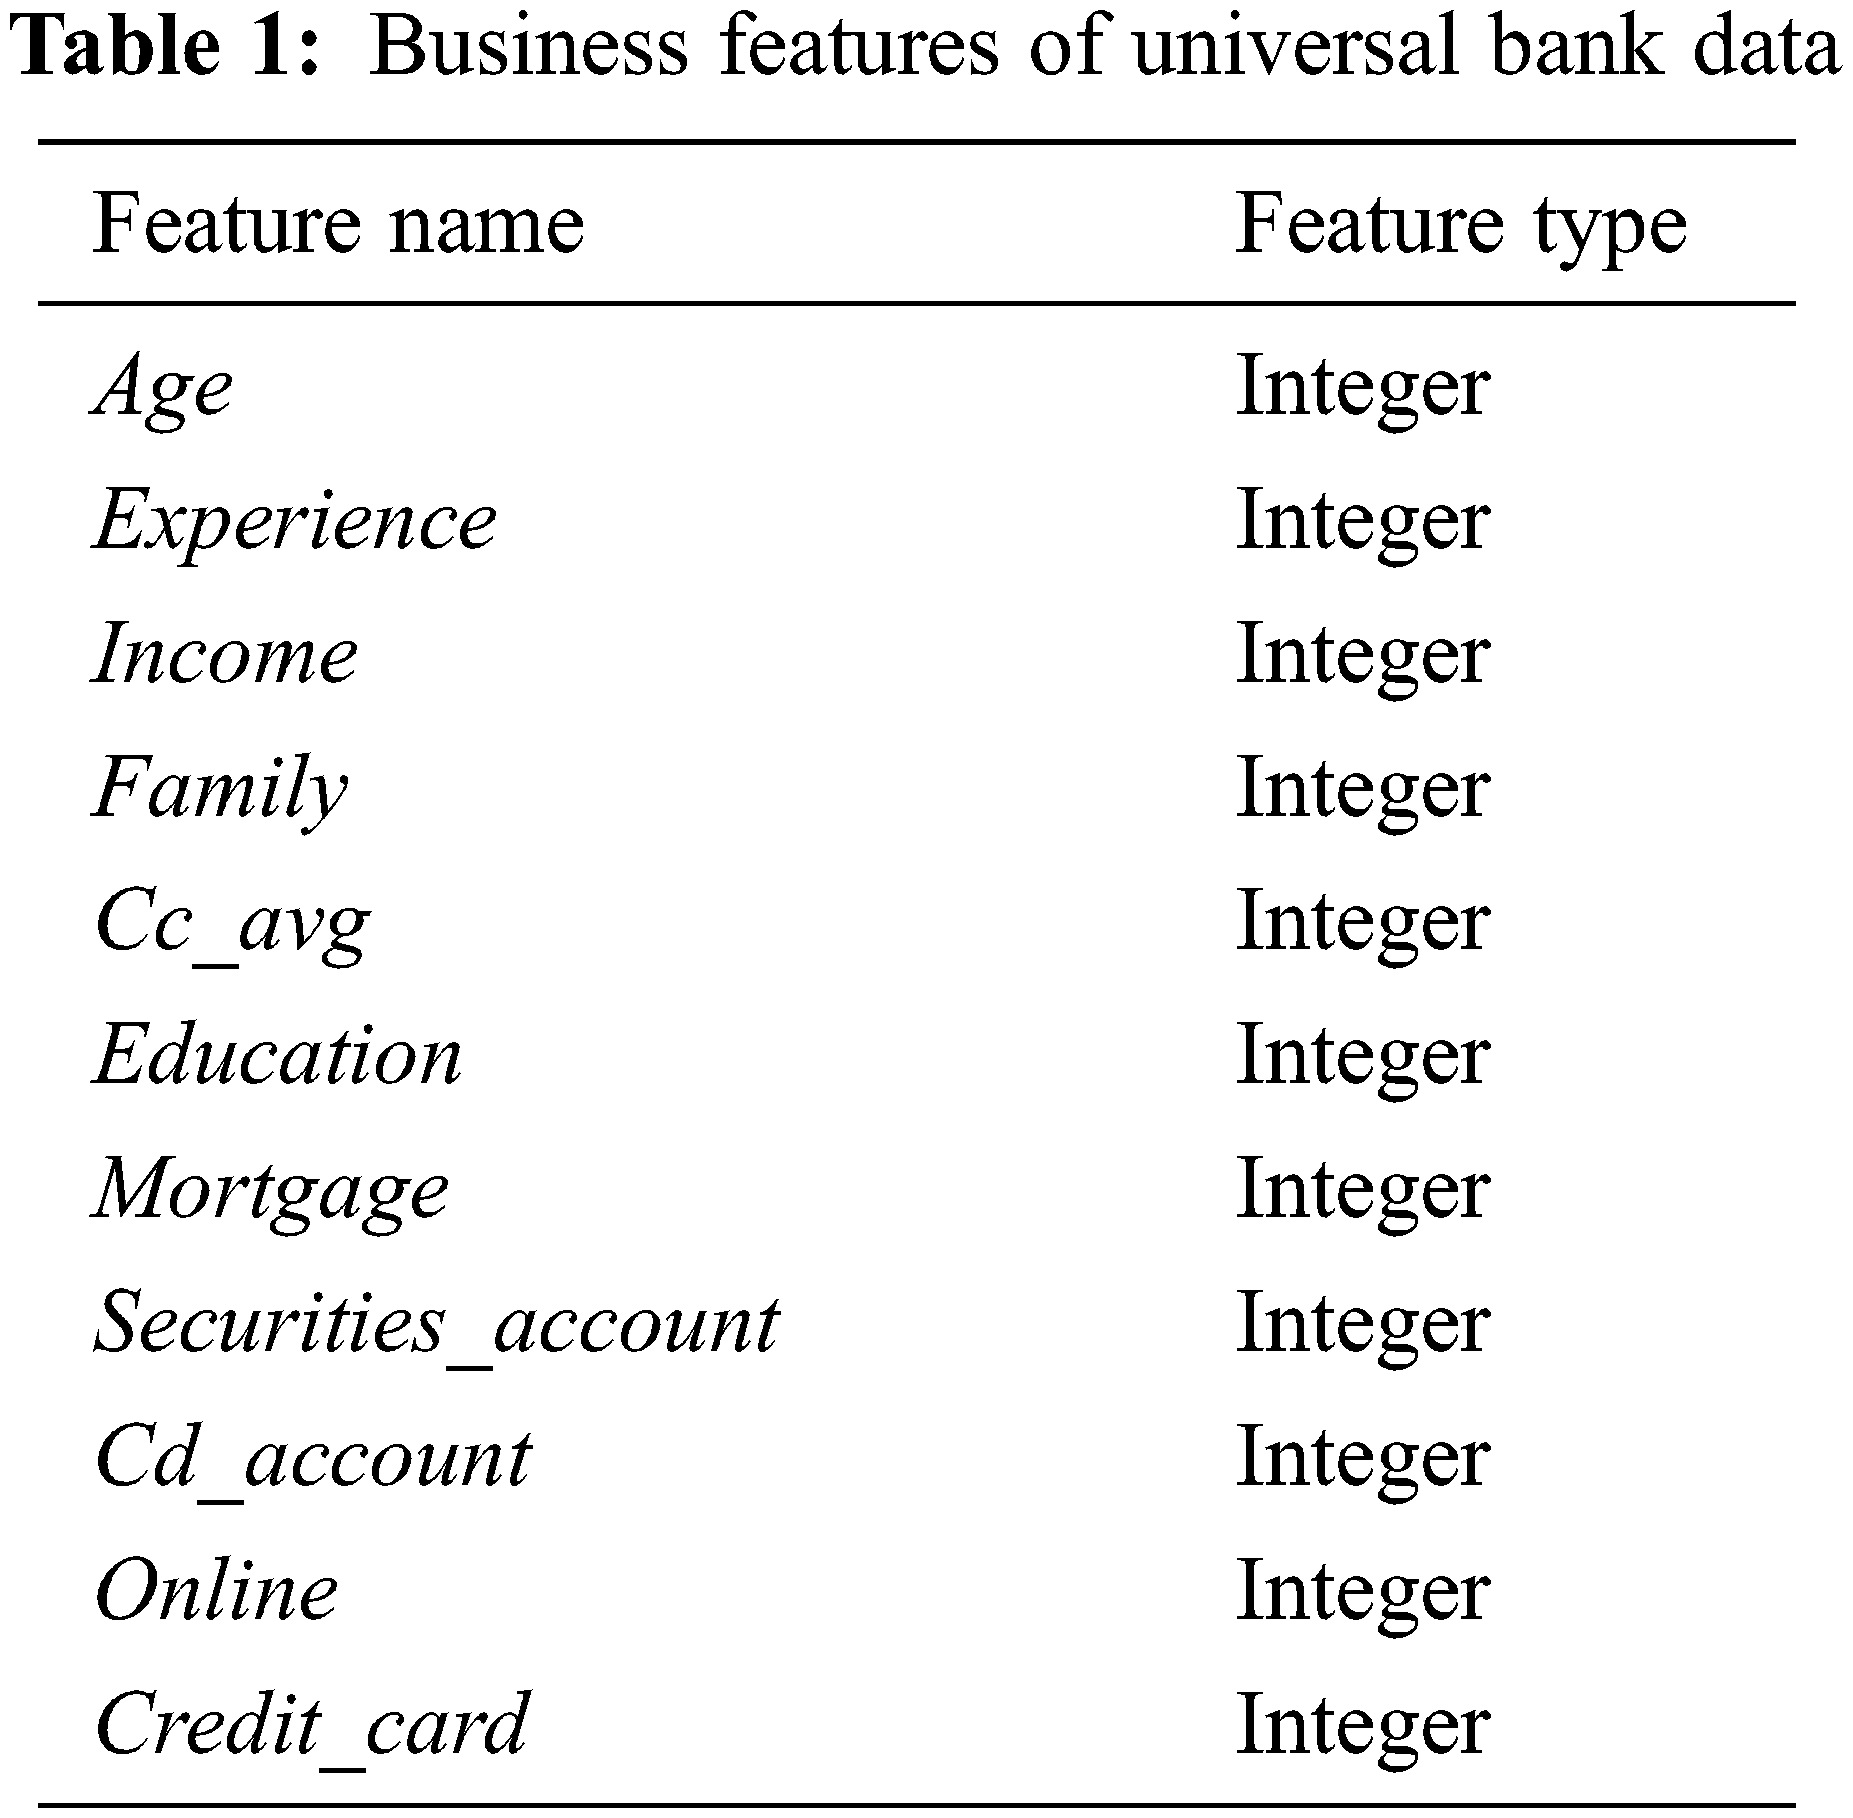
It is evident from Tab. 1 that all features are quantitative. However, other data could be nominal and must be subjected to Feature Encoding to fit in the proposed model. The purpose of Feature Encoding is to turn nominal values into numerical values. We must also consider the important aspect of Data Standardization, which is the process of adjusting the distribution of feature values 1. This process is essential when the feature values are disparate. A detailed discussion of feature encoding and standardization is to be found in the following section.
3.3 Preprocessing and Standardization
In this critical ML step, business Feature Encoding and business Feature Standardization are achieved as follows:
3.3.1 Business Feature Encoding
As mentioned above, it is essential to encode all nominal business features prior to starting the analysis process. Two methods are available to meet this aim. One Hot Encoding and Label Encoding. In general, the former can serve to multiply the feature dimensions as it creates new features based on the unique values to be found in each nominal feature [29]. Conversely, the latter method converts all feature values to numeric values. For example, if a business feature state such as gender has the values [Male, Female, Other, Female, Female], they can be transformed into a vector v = [0,1,2,1,1]. The Label Encoding method was selected and implemented in Python for all nominal business features.
3.3.2 Business Feature Standardization
Another vital step that needs to be undertaken prior to entering the data into the proposed model is feature standardization, which involves preprocessing features with different value distributions or scales. All data features with a crucial difference in value distributions are adjusted in the dataset using the formula in Eq. (1).
where Xscaled indicates the new-scaled value of the feature, Xoriginal indicates the original value of the feature,
All features’ values with different value distributions are analyzed in Python. The density plot can be used to comprehend the distribution of values for each business feature. Fig. 2 displays the various density plots for a range of the features set forth in Tab. 1.
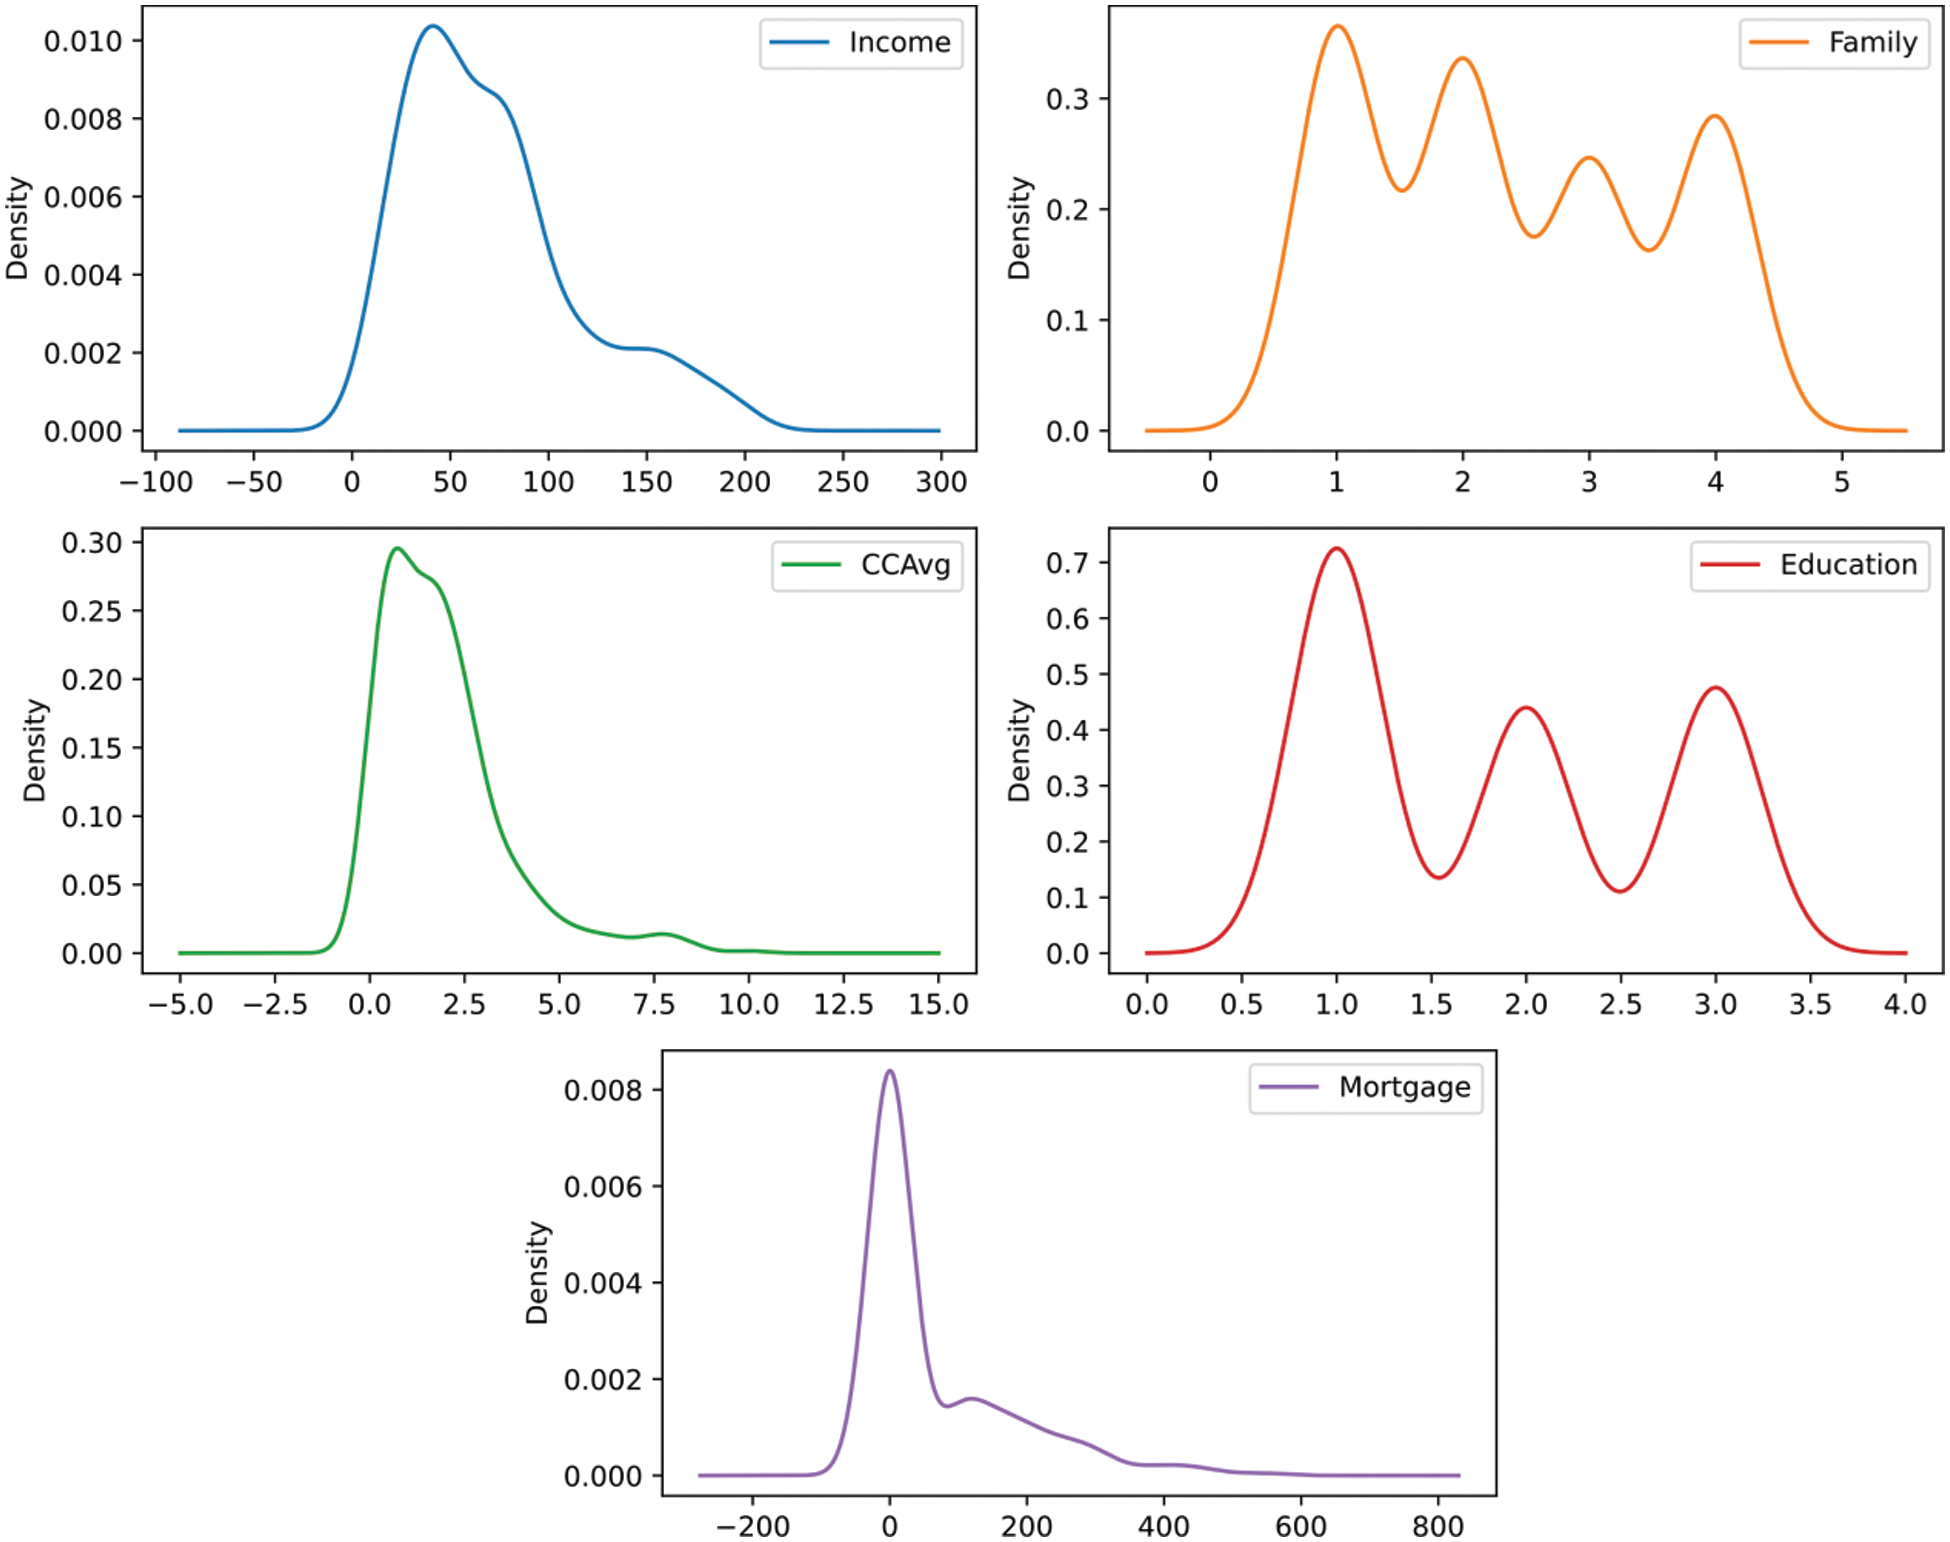
Figure 2: Density plots
From the density plots above, it is evident that these business features have different distributions. For this purpose, the complete range of features are normalized when needed to prepare the data for the feature ranking and selection process.
3.3.3 Business Features Ranking and Selection
When utilizing ML methods like DT, we can choose one of two standard methods to clarify which features carry most weight in the decision-making process. In this context, there are two standard approaches: Information Gain and the Gini Index. While the Information Gain approach selects the feature with the greatest information gain to use as the root for the construction of a particular decision tree, the Gini Index takes the lowest feature on the index to make a binary split, which implies two decisions resulting from each node [1]. The Gini index is common in Classification algorithms and is easy to implement in Python, particularly for more extensive distributions. In this paper, we use the Gini index approach to identify the features’ impurity before building the proposed model. We can then construct the predictive approach using the lowest Gini index features. The Gini index is obtained by subtracting the squared probabilities of each class from one. The greater the influence carried by a feature, the more it lowers the impurity. According to [1], the Gini index is computed using Eq. (2).
where Pi represents the probability of a tuple in n belonging to a specific business class. Tab. 2 presents the features in order of importance.
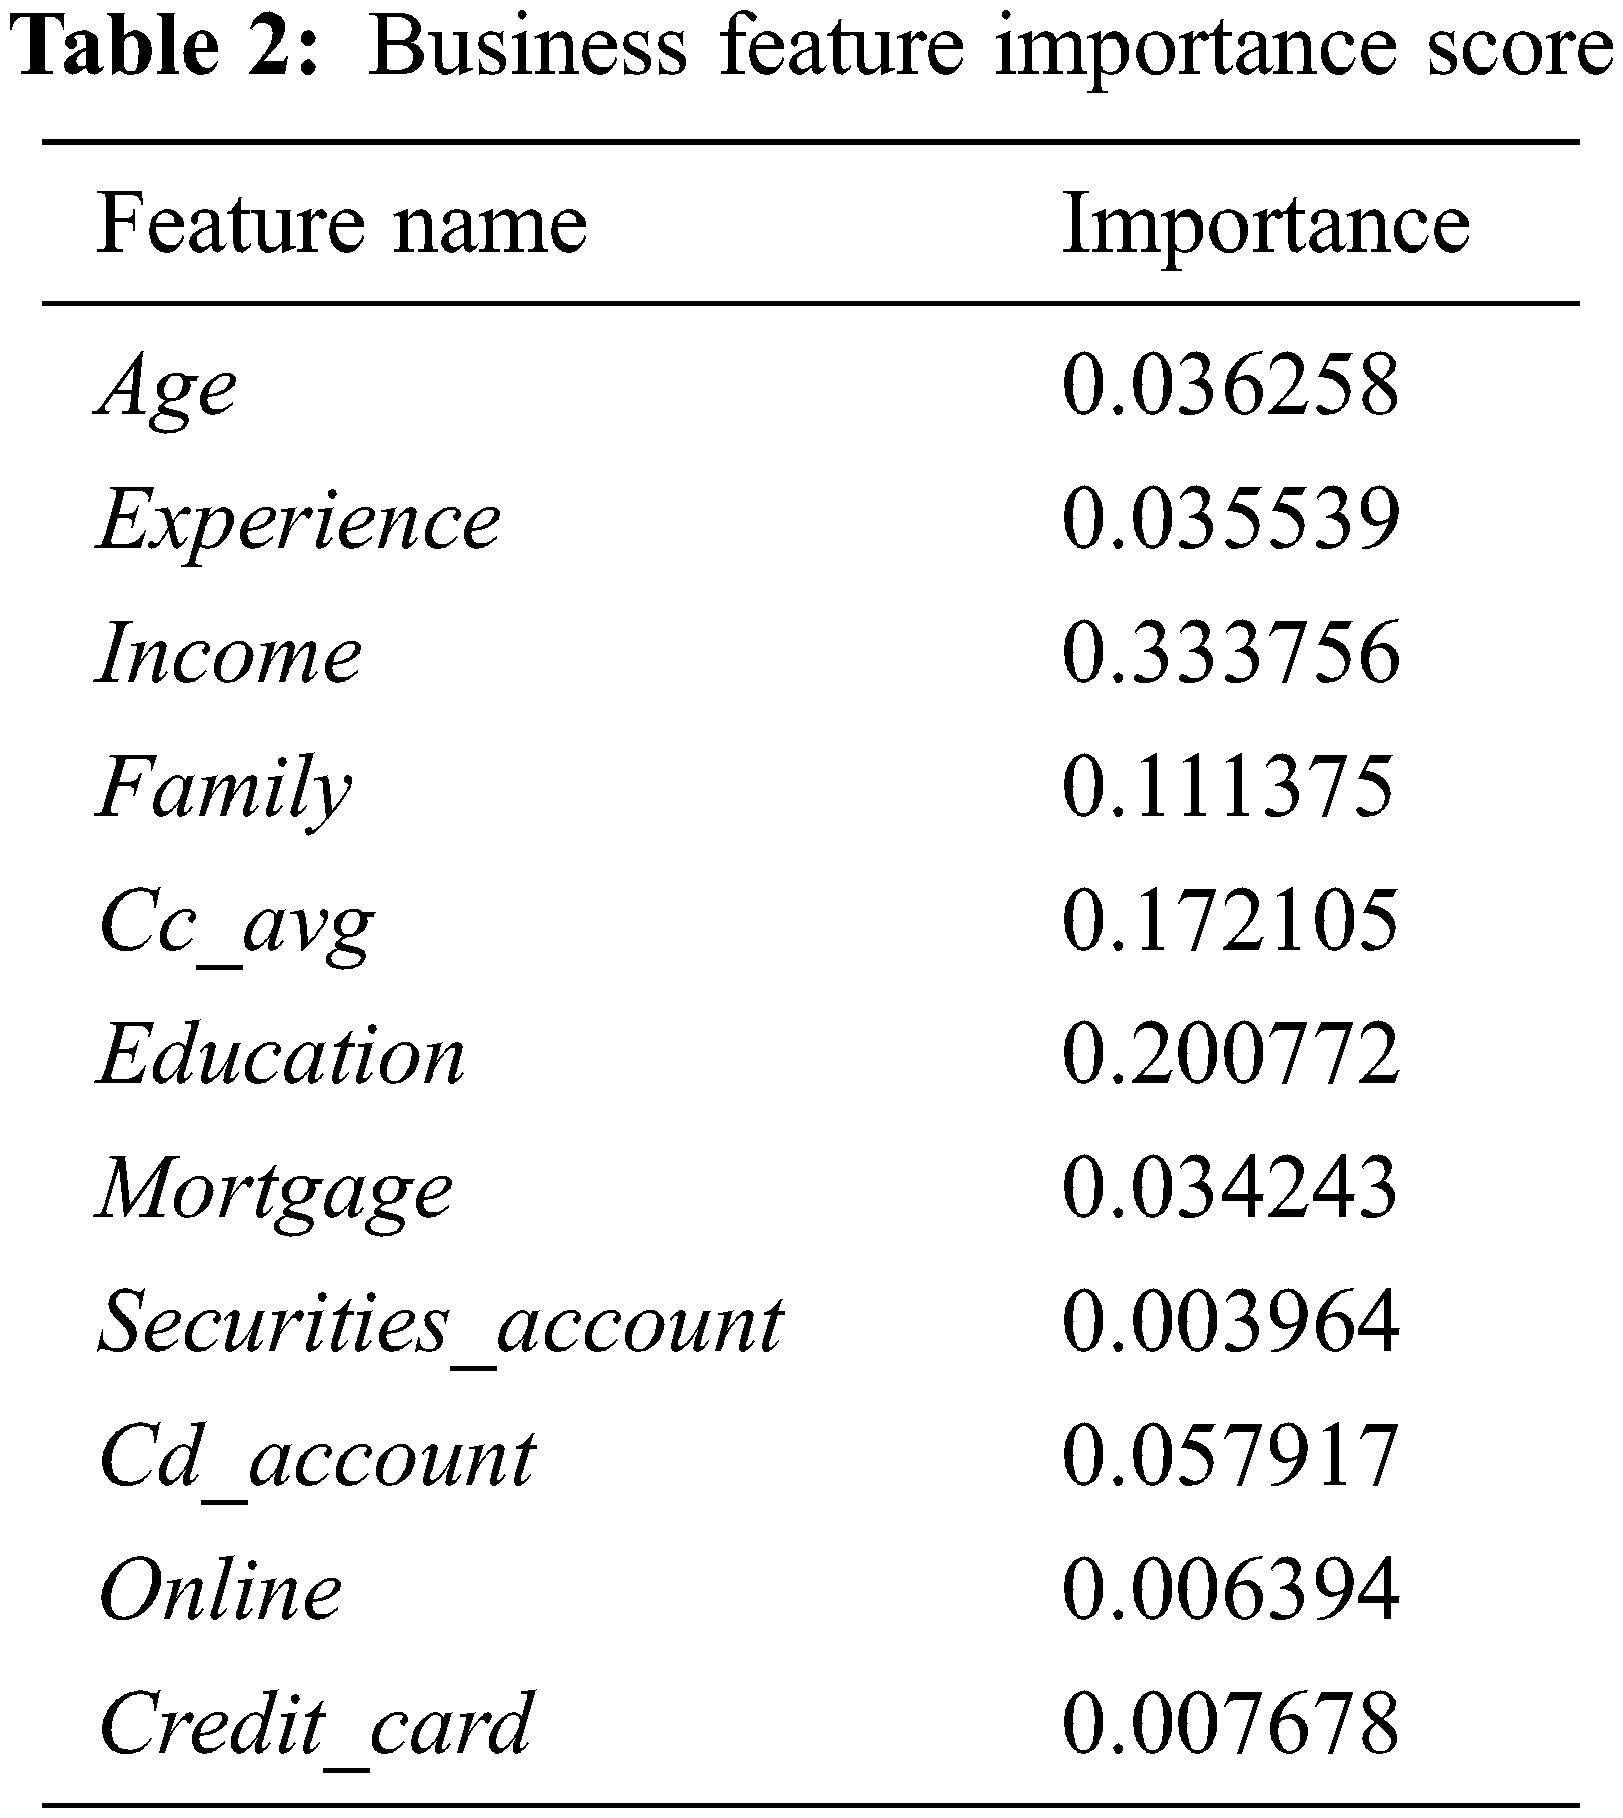
In this work, a threshold value that is greater than 0.01 (i.e., t >= 0.01) is set to identify those features considered of greatest importance to be entered into the proposed model for processing. Notably, this value is changeable depending on the dataset being processed. Thus, the remaining features are 8; the features securities_account, online, and credit_card will be excluded in the proposed model.
For this purpose, the data can be analyzed by the proposed predictive model, considering 8 features with the most important scores instead of all of the 12 features. The current research seeks to make the computation process less complex when constructing a tree-based predictive model and boost its prediction accuracy concerning PA, as the selected feature significantly influences the decision-making process. The next section introduces the prediction boosting methods.
The prediction and classification accuracy can be improved when dealing with DT. There are two common methods used in this regard, namely Random Forests and Boosted Trees. These methods can bring results together from multiple trees to strengthen predictive power. Random Forests are a special case of bagging, a method for improving predictive power using multiple classifiers or prediction algorithms [1,30]. However, this approach is slower than Boosted Trees in terms of overall performance as it is based on multiple classifiers [1]. Boosted Trees involves formulating and fitting a sequence of trees, each of which focuses on any records that were misclassified by the previous one [1]. In this research, the concept of boosted trees is implemented in the proposed model to achieve the objective of this study. In the following section, our experiments are presented and discussed.
In this section, we summarize our experiments of this study using the universal bank dataset. Besides, we validate the model based on Accuracy, Precision, Recall, and Fscore metrics which are discussed in the following section.
Accuracy, Precision, Recall, and Fscore are essential measurements for assessing the predictive model’s efficiency. These metrics are adapted and computed using the following definitions [1,4]:
• True Positives (TP): The number of records that are truly predicted as “loan acceptors” at the end of the prediction process.
• True Negatives (TN): The number of records that are truly predicted as “non-acceptors” at the end of the prediction process.
• False Positives (FP): The number of records that are “non-acceptors” and predicted as “acceptors” at the end of the prediction process.
• False Negatives (FN): The number of records that are “acceptors” and predicted “non-acceptors” at the end of the prediction process.
The Accuracy metric is calculated using the formula in Eq. (3).
The Precision metric is calculated using the formula in Eq. (4).
The Recall metric is calculated using the formula in Eq. (5).
The Fscore metric combines the issues of precision and recall into a single figure, which is reached by following the steps laid forth in Eq. (6).
It has already been mentioned that a real dataset of the universal bank data is used to validate the proposed model. It consists of 5000 records about the bank clients. In addition, it has 12 features except for the class label, which can be employed to predict the likelihood of a client accepting a personal loan. This dataset can be accessed by the public on the Kaggle website [28]. To this end, it is crucial to clarify the experiments’ design to reach the final goal of this study.
Section 3 laid out the processes that had to be carried out prior to beginning our experiments. Upon completing these processes, we divided the dataset into a training set and a test set. The former contained 70% of the records held in the dataset, which were selected at random, and this set was utilized to train the proposed model. The remaining 30% of the records were held in the test set, which was used to validate the proposed model. The first of three experiments involved the application of the traditional decision tree algorithm to the dataset without considering the ranking and selection approach expounded in Section 3. The second experiment involved applying our previously proposed model in [27] with adapting it to the business context. The last experiment involved applying the proposed model in this study, considering the ranking of security features and the concept of Boosted Trees, as discussed in Section 3. All experiments were implemented in Python using a laptop with Intel Core i7 1.5 GHz processor speed and 16 GB RAM.
Experiment 1:
The traditional Decision Tree model is applied to the dataset in the first experiment. The predictive model is built without taking the order of the selected business features into account. As previously stated in this study, the evaluation metrics such as Accuracy, Precision, Recall, and F-score were used to evaluate each experiment. The accuracy metric is a commonly used performance metric in classification algorithms; it refers to the percentage of accurate predictions. Tab. 3 displays the results for each of these metrics.
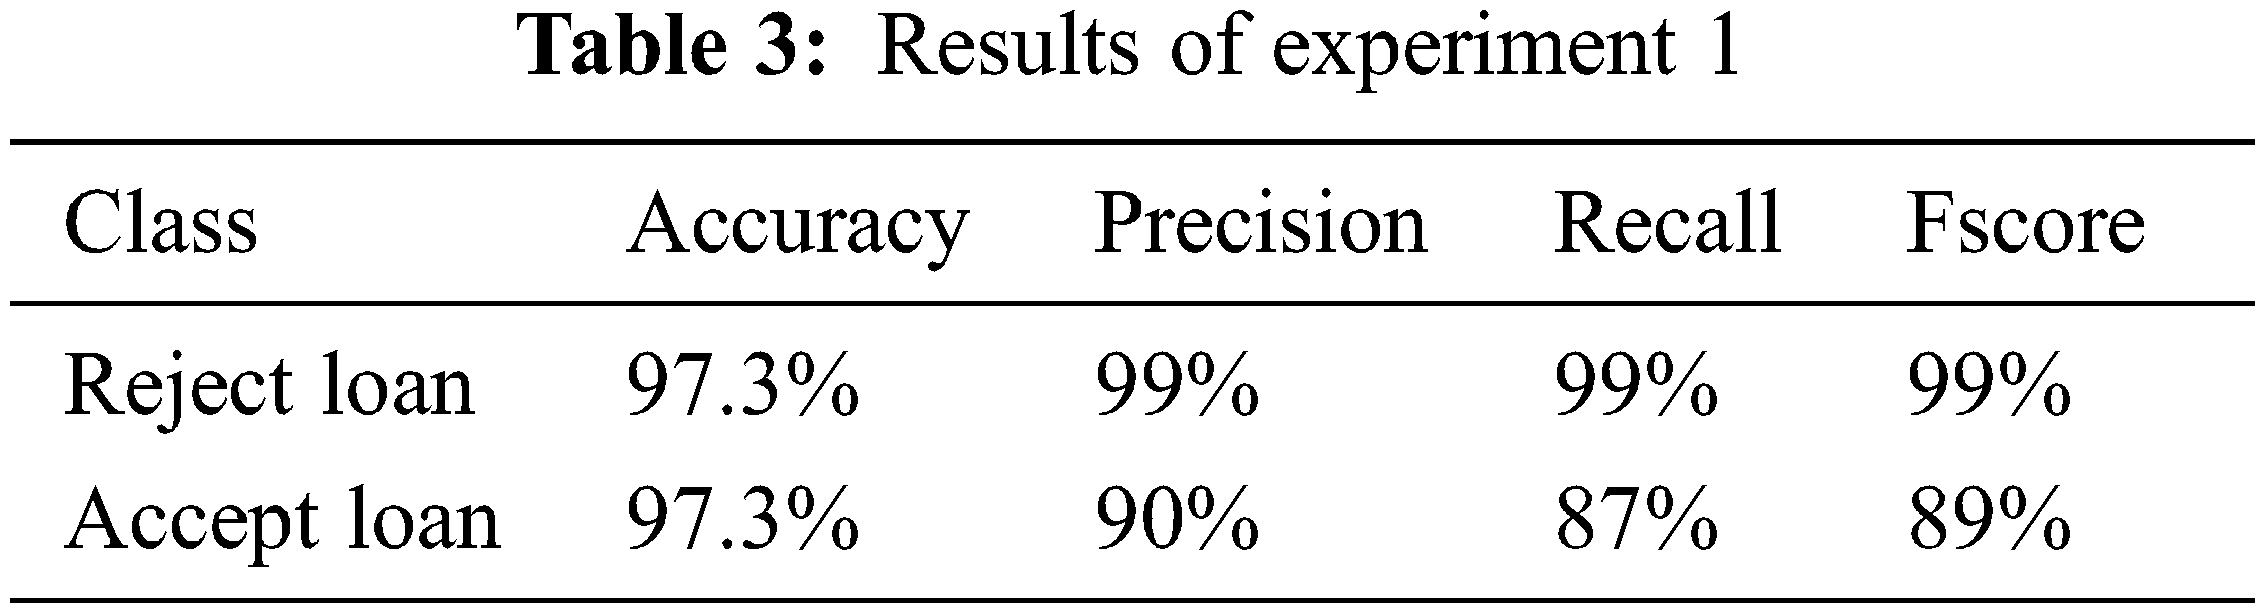
The metrics for each class are shown in Tab. 3 above. As explained earlier in Section 4.1, the Accuracy metric is the percentage of test samples accurately classified by the model with a value of 97.3%. Precision is defined as the proportion of true positives to the sum of true and false positives. The Recall metric quantified the number of positive class predictions made from the dataset’s positive examples. The F-score metric generates a score that accounts for precision and recall values.
Experiment 2:
This experiment uses our previously proposed model in [27] with some modifications for the business context. The ranking and selection approach is used to select the business features that are most important and should be taken into account during the prediction process. Tab. 4 displays the results for each of these metrics.
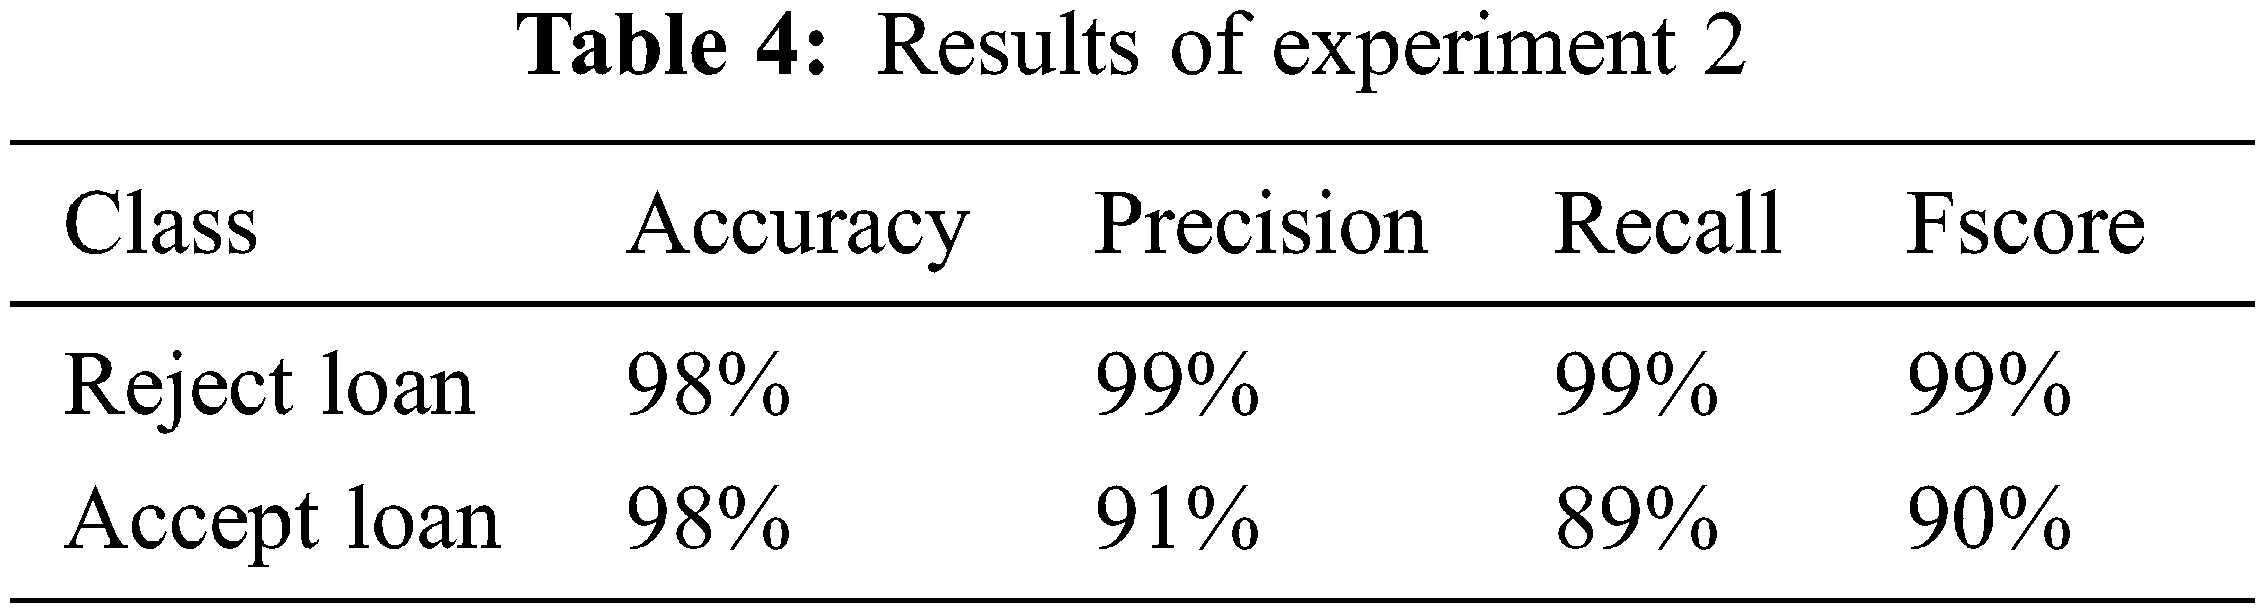
The results in Tab. 4 above clearly demonstrate that they have improved compared to the results obtained in the first experiment. This experiment demonstrates improved performance in terms of Accuracy. Furthermore, the number of business features processed in this experiment is reduced by taking the ranking and selection approach into account. As a result, this process can reduce computation complexity in DT, mainly when dealing with large amounts of business data with numerous features.
Experiment 3:
The final experiment involves the use of the proposed model in this study. As stated in this paper, the proposed model incorporates both the ranking and selection approach and the boosted trees method. Tab. 5 displays the results of this experiment for each of the evaluation metrics. It is clear that the accuracy metric has improved compared to the first and second experiments. Fig. 3 depicts the Python implementation of the proposed model.
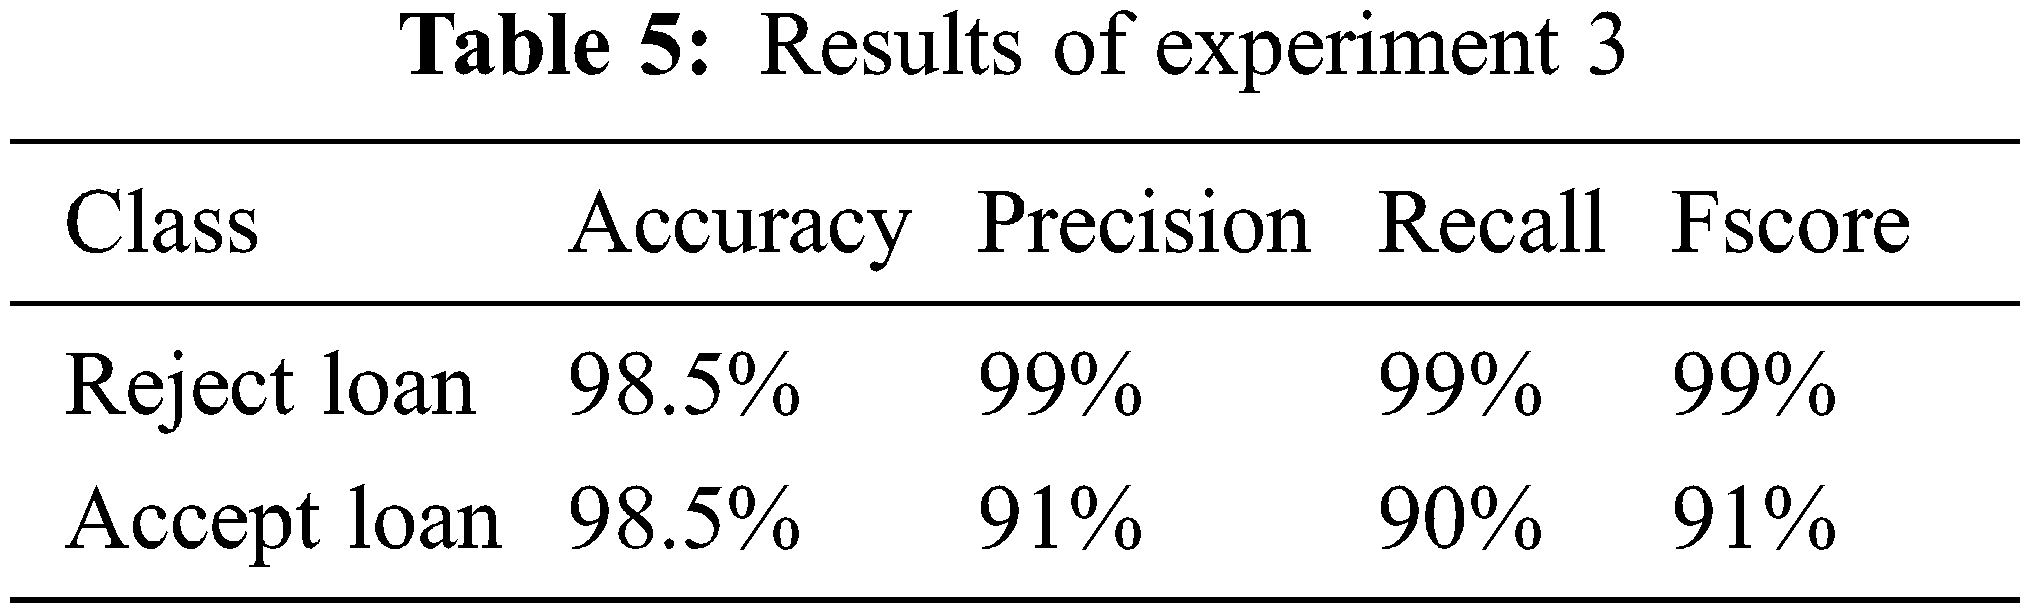
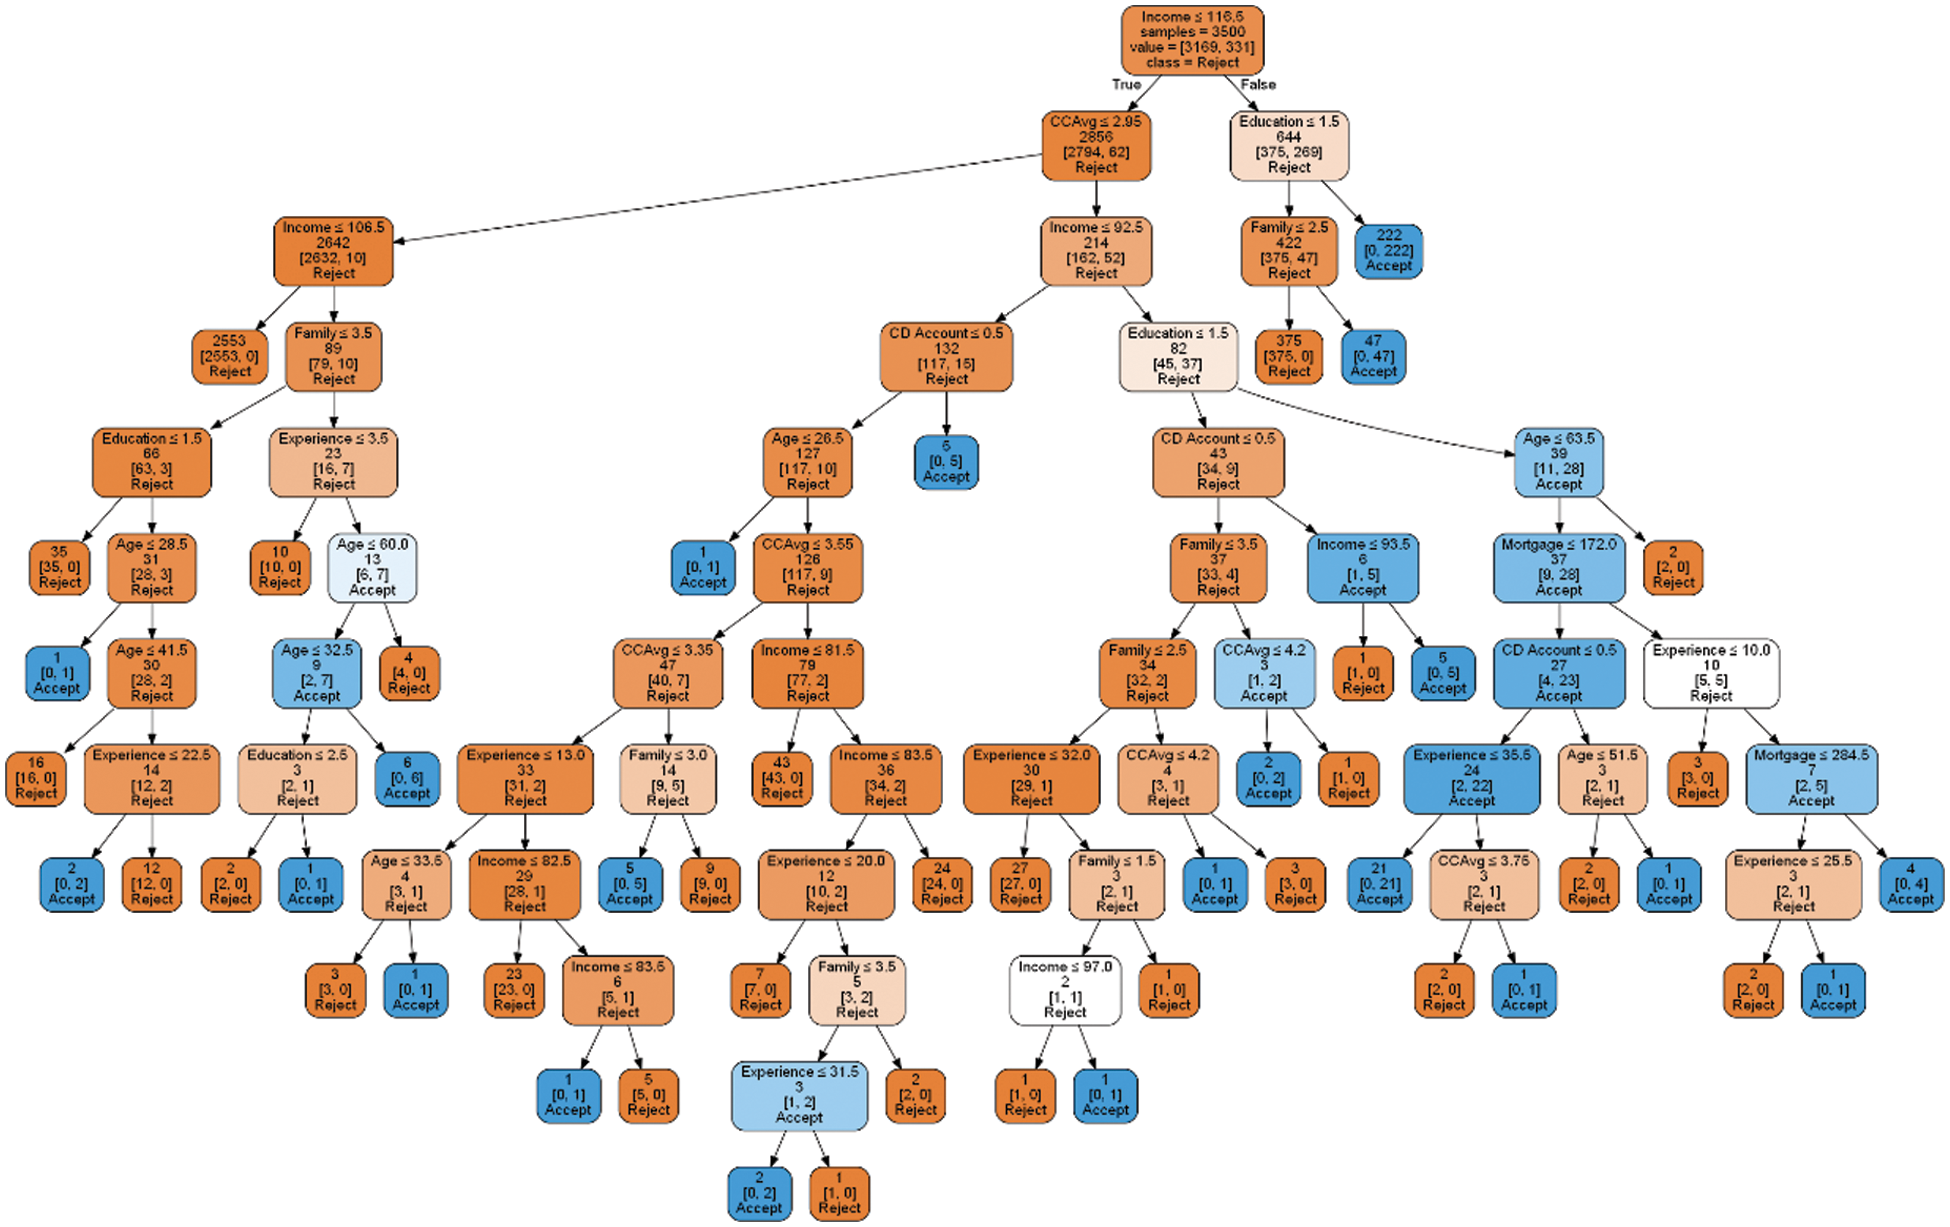
Figure 3: The implementation of the proposed model in Python
A further performance metric that is useful in the evaluation of the proposed model is the Receiver Operating Curve (ROC), which demonstrates how well the predictive model distinguishes between business classes (i.e., Accept or Reject the personal loan). It is calculated by comparing the True Positive Rate (TPR) to the False Positive Rate (FPR). The FPR is calculated by dividing the number of false positives by the number of false positives and true negatives. The greater the Area under the Curve (AUC), the more accurate the predictive model. Fig. 4 depicts the ROC curve of the proposed model, which has an AUC of 0.94.
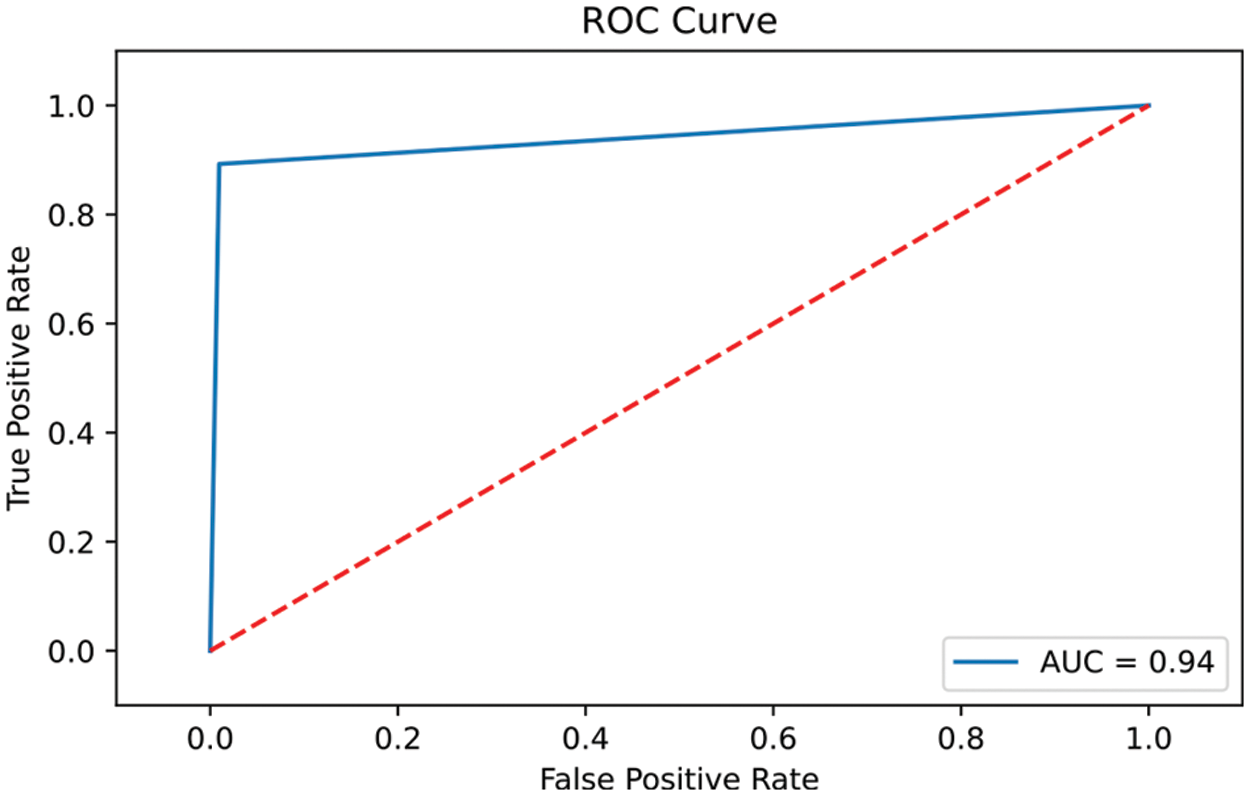
Figure 4: The ROC curve of the proposed model
To this end, the experiments conducted in this study reveal an improved predictive model that is able to assist corporations in making effective decisions. The final experiment involved employing the proposed model in this study, taking into account the ranking of security features and the concept of Boosted Trees. The prediction accuracy obtained is 98.5% compared to 97.3% and 98% in experiments 1 and 2. Based on their historical data, the bank dataset used in this work can assist decision-makers in targeting clients who are most likely to take out a personal loan. As a result, this process can control the design and distribution of marketing campaigns for future loan acceptors while minimizing cost and effort.
This research proposed a boosted tree-based predictive model for BA that can provide better prediction accuracy in the business context. Therefore, a business features ranking approach was developed based on the Gini Index to assess the impurity of the business features. Furthermore, the concept of boosted trees was used and incorporated into the proposed model to improve its prediction accuracy. Only the highly ranked business features with boosted trees were applied in the training and testing of the proposed model to achieve efficient and accurate results. The research conducted three experiments to prove how the proposed predictive model can generate better prediction accuracy than the traditional tree-based model. The model can be applied to various business sectors to support corporations’ decision-making process. Although it can handle large datasets with numerous business features and dimensions, more experiments are needed to reach more accurate conclusions about its performance. Our future work will involve expanding the capability of the proposed model by incorporating the concept of Random Forests and other ML classification algorithms.
Acknowledgement: We would like to give special thanks to Taif University Research supporting Project Number (TURSP-2020/10), Taif University, Taif, Saudi Arabia.
Funding Statement: Taif University Researchers Supporting Project number (TURSP-2020/10), Taif University, Taif, Saudi Arabia.
Conflicts of Interest: The authors declare that they have no conflicts of interest to report regarding the present study.
References
1. G. Shmueli, P. C. Bruce, P. Gedeck and N. R. Patel, “Prediction and classification methods,” in Data Mining for Business Analytics, 3rd ed., Hoboken, New Jersey, USA: John Wiley & Sons Inc, pp. 140–304, 2020. [Google Scholar]
2. R. E. Bawack and M. O. Ahmad, “Understanding business analytics continuance in agile information system development projects: An expectation-confirmation perspective,” Information Technology & People, vol. 34, no. 6, pp. 1551–1569, 2021. [Google Scholar]
3. I. H. Sarker, “Machine learning: Algorithms, real-world applications and research directions,” SN Computter Science, vol. 2, no. 3, pp. 1–21, 2021. [Google Scholar]
4. R. Punithavathi, K. Venkatachalam, M. Masud, M. A. AlZain and M. Abouhawwash, “Crypto hash based malware detection in IOMT framework,” Intelligent Automation & Soft Computing, vol. 34, no. 1, pp. 559–574, 2022. [Google Scholar]
5. H. Kao, M. Yu, M. Masud, W. Wu, L. Chen et al., “Design and evaluation of hospital-based business intelligence system (HBISA foundation for design science research methodology,” Computers in Human Behavior, vol. 62, no. 1, pp. 495–505, 2016. [Google Scholar]
6. M. Ghosh, M. Raihan, L. Akter, A. K. Bairagi, S. Alshamrani et al., “A comparative analysis of machine learning algorithms to predict liver disease,” Intelligent Automation & Soft Computing, vol. 30, no. 3, pp. 917–928, 2021. [Google Scholar]
7. N. Singh, P. Singh and M. Gupta, “An inclusive survey on machine learning for CRM: A paradigm shift,” Decision, vol. 47, no. 4, pp. 447–457, 2021. [Google Scholar]
8. O. Yaman, H. Yetis and M. Karakose, “Decision tree based customer analysis method for energy planning in smart cities,” in 2020 Int. Conf. on Data Analytics for Business and Industry: Way Towards a Sustainable Economy (ICDABI), Sakheer, Bahrain, pp. 1–4, 2020. [Google Scholar]
9. G. Saranya, G. Geetha and M. Safa, “E-Antenatal assistance care using decision tree analytics and cluster analytics based supervised machine learning,” in 2017 Int. Conf. on IoT and Application (ICIOT), Nagapattinam, India, pp. 1–3, 2017. [Google Scholar]
10. J. Pamina, J. Raja, S. Peter, S. Soundarya, S. Bama et al., “Inferring machine learning based parameter estimation for telecom churn prediction,” in Int. Conf. On Computational Vision and Bio Inspired Computing, Coimbatore, India, pp. 257–267, 2019. [Google Scholar]
11. S. Y. Kim and A. Upneja, “Majority voting ensemble with a decision trees for business failure prediction during economic downturns,” Journal of Innovation & Knowledge, vol. 6, no. 2, pp. 112–123, 2021. [Google Scholar]
12. S. Kim and H. Lee, “Customer churn prediction in influencer commerce: An application of decision trees,” Procedia Computer Science, vol. 199, no. 2, pp. 1332–1339, 2022. [Google Scholar]
13. D. Appelbaum, A. Kogan, M. Vasarhelyi and Z. Yan, “Impact of business analytics and enterprise systems on managerial accounting,” International Journal of Accounting Information Systems, vol. 25, no. 2, pp. 29–44, 2017. [Google Scholar]
14. A. Koli and S. Shinde, “Parallel decision tree with map reduce model for big data analytics,” in 2017 Int. Conf. on Trends in Electronics and Informatics (ICEI), Tirunelveli, India, pp. 735–739, 2017. [Google Scholar]
15. X. Hu, Y. Yang, L. Chen and S. Zhu, “Research on a customer churn combination prediction model based on decision tree and neural network,” in IEEE 5th Int. Conf. on Cloud Computing and Big Data Analytics (ICCCBDA), Chengdu, China, pp. 129–132, 2020. [Google Scholar]
16. E. Basti, C. Kuzey and D. Delen, “Analyzing initial public offerings’ short-term performance using decision trees and SVMs,” Decision Support Systems, vol. 73, no. 4, pp. 15–27, 2015. [Google Scholar]
17. D. Shah, S. Patel and S. K. Bharti, “Heart disease prediction using machine learning techniques,” SN Computer Science, vol. 1, no. 6, pp. 1–6, 2020. [Google Scholar]
18. I. M. Al-Zuabi, A. Jafar and K. Aljoumaa, “Predicting customer’s gender and age depending on mobile phone data,” Journal of Big Data, vol. 6, no. 1, pp. 1–16, 2019. [Google Scholar]
19. W. N. Wassouf, R. Alkhatib, K. Salloum and S. Balloul, “Predictive analytics using big data for increased customer loyalty: Syriatel telecom company case study,” Journal of Big Data, vol. 7, no. 1, pp. 1–24, 2020. [Google Scholar]
20. S. Sharma and Y. K. Gupta, “Predictive analysis and survey of COVID-19 using machine learning and big data,” Journal of Interdisciplinary Mathematics, vol. 24, no. 1, pp. 175–195, 2021. [Google Scholar]
21. K. Antosz, Ł. Paśko and A. Gola, “The use of artificial intelligence methods to assess the effectiveness of lean maintenance concept implementation in manufacturing enterprises,” Applied Sciences, vol. 10, no. 21, pp. 7922–7930, 2020. [Google Scholar]
22. S. Panjwani, I. Cui, K. Spetsieris, M. Mleczko, W. Wang et al., “Application of machine learning methods to pathogen safety evaluation in biological manufacturing processes,” Biotechnology Progress, vol. 37, no. 3, pp. 1–10, 2021. [Google Scholar]
23. D. J. A. V. de Magalhães, “Analysis of critical factors affecting the final decision-making for online grocery shopping,” Research in Transportation Economics, vol. 87, no. 3, pp. 101088–101098, 2021. [Google Scholar]
24. Y. Qian, Z. Li and R. Tan, “Sustainability analysis of supply chain via particulate matter emissions prediction in China,” International Journal of Logistics Research and Applications, vol. 25, no. 4, pp. 1–14, 2021. [Google Scholar]
25. M. Meire, “Customer comeback: Empirical insights into the drivers and value of returning customers,” Journal of Business Research, vol. 127, no. 1, pp. 193–205, 2021. [Google Scholar]
26. G. Pappalardo, S. Cafiso, A. Di Graziano and A. Severino, “Decision tree method to analyze the performance of lane support systems,” Sustainability, vol. 13, no. 2, pp. 846–855, 2021. [Google Scholar]
27. M. Al-Omari, M. Rawashdeh, F. Qutaishat, M. Alshira and N. Ababneh, “An intelligent tree-based intrusion detection model for cyber security,” Journal of Network and Systems Management, vol. 29, no. 2, pp. 1–18, 2021. [Google Scholar]
28. “Kaggle,” 2022. [Online]. Available: https://www.kaggle.com/. [Google Scholar]
29. M. Masud, P. Singh, G. S. Gaba, A. Kaur and R. Alroobaea, “CROWD: Crow search and deep learning based feature extractor for classification of Parkinson’s disease,” ACM Transactions on Internet Technology (TOIT), vol. 21, no. 3, pp. 1–18, 2021. [Google Scholar]
30. H. Y. Kao, M. C. Yu, M. Masud, W. H. Wu and L. J. Chen, “Design and evaluation of hospital-based business intelligence system (HBISA foundation for design science research methodology,” Computers in Human Behavior, vol. 62, no. 1, pp. 495–505, 2016. [Google Scholar]
Cite This Article
 Copyright © 2023 The Author(s). Published by Tech Science Press.
This work is licensed under a Creative Commons Attribution 4.0 International License , which permits unrestricted use, distribution, and reproduction in any medium, provided the original work is properly cited.
 Downloads
 Citation Tools