
 Submit a Paper
 Propose a Special lssue
 Open Access
ARTICLE
Optimal Energy Forecasting Using Hybrid Recurrent Neural Networks
1 Department of Computer Science and Engineering, Vel Tech Rangarajan Dr. Sagunthala R&D Institute of Science and Technology, Chennai, 600062, India
2 Department of Electrical and Electronics Engineering, Agni College of Technology, Chennai, 600130, India
3 Department of Information Science and Technology, Anna University, Chennai, 600025, India
* Corresponding Author: Elumalaivasan Poongavanam. Email:
Intelligent Automation & Soft Computing 2023, 36(1), 249-265. https://doi.org/10.32604/iasc.2023.030101
Received 28 March 2022; Accepted 21 June 2022; Issue published 29 September 2022
 View Full Text
 Download PDF
Abstract
The nation deserves to learn what India’s future energy demand will be in order to plan and implement an energy policy. This energy demand will have to be fulfilled by an adequate mix of existing energy sources, considering the constraints imposed by future economic and social changes in the direction of a more sustainable world. Forecasting energy demand, on the other hand, is a tricky task because it is influenced by numerous micro-variables. As a result, an macro model with only a few factors that may be predicted globally, rather than a detailed analysis for each of these variables, is required. In this work, a hybrid approach is proposed for identifying the optimal generation-based mix of electricity systems in India. This approach is developed by combing Recalling-Enhanced Recurrent Neural Network (RERNN) and Giza Pyramids Construction (GPC). RERNN possesses selective memory features whereas GPC is a meta-heuristic algorithm that deals with different sets of problems. The goal of this approach is to assess the present load requirements and production profile to understand the current requirement and its production methods. Data on regards to electricity load profile involving the generation of all power plants, capacity factors and transmission limits were gathered from different sources including the Indian National Load Dispatch Centre, Central Electricity Authority database, annual reports of India and regional load dispatching centers. The proposal has introduced the RERNN technique to analyze the optimal time series whereas the GPC technique is involved in the optimization of RERNN parameters. The present work is simulated in MATLAB and the performance assessed with different parameters. The present technique gives an effective results in terms of accuracy, computational efficiency and feasibility.Keywords
A drastic increase experienced across the globe in terms of power usage and this phenomenon has posed a few challenges such as minimizing the utilization of energy resources, extra delivery capabilities, and environmental issues like global warming [1]. The amount of power consumed is primarily influenced by four major factors such as climate, construction structure, power devices, and the income of users. Within the next two decades, the power usage in the fabricated environment is expected to increase by 34% at a rate of 1.5% every year [2–4]. In 2030, it is predicted that 67% of the power generated will be used for domestic purposes whereas the non-domestic sector will consume 33%. Power usage is described as a fraction of the whole usage incurred upon the environment [5,6]. Energy usage is recorded as time-series information. Therefore, the information regarding the function of electrical applications is complex to gather as the former is incorporated with random forms of power consumption [7].
The majority of the time-series distribution methods have been introduced in the past two decades. These studies mostly used the basic techniques such as Auto-Regressive Integrated Moving Average (ARIMA) method, Seasonal ARIMA, machine learning models, grey-box models, and fuzzy logic. [8,9]. These models are utilized to conclude in terms of economics, engineering, and power usage [10]. One of the main advantages of these techniques is their easiness and possession of adjustable features when applied. These techniques are linear methods in real-world applications and process time-series distribution. It provides linear and nonlinear temporal patterns [11]. However, a single Machine Learning (ML) should not provide linear and nonlinear patterns together since it is considered a misunderstanding or under or over-fitting. Down the line, basic time series models and ML methods have evolved with increased accuracy and speed [12,13].
In general, up-down models analyze the need of power by collecting information on load deficit requirements. These models provide ownership which utilize power-consuming appliances and assume the end-user technology from an engineering viewpoint. The research works conducted earlier displayed the limited capability of cost strategies in delivering the trending technologies. Some of the studies are reviewed in this section which is shown in Fig. 1.
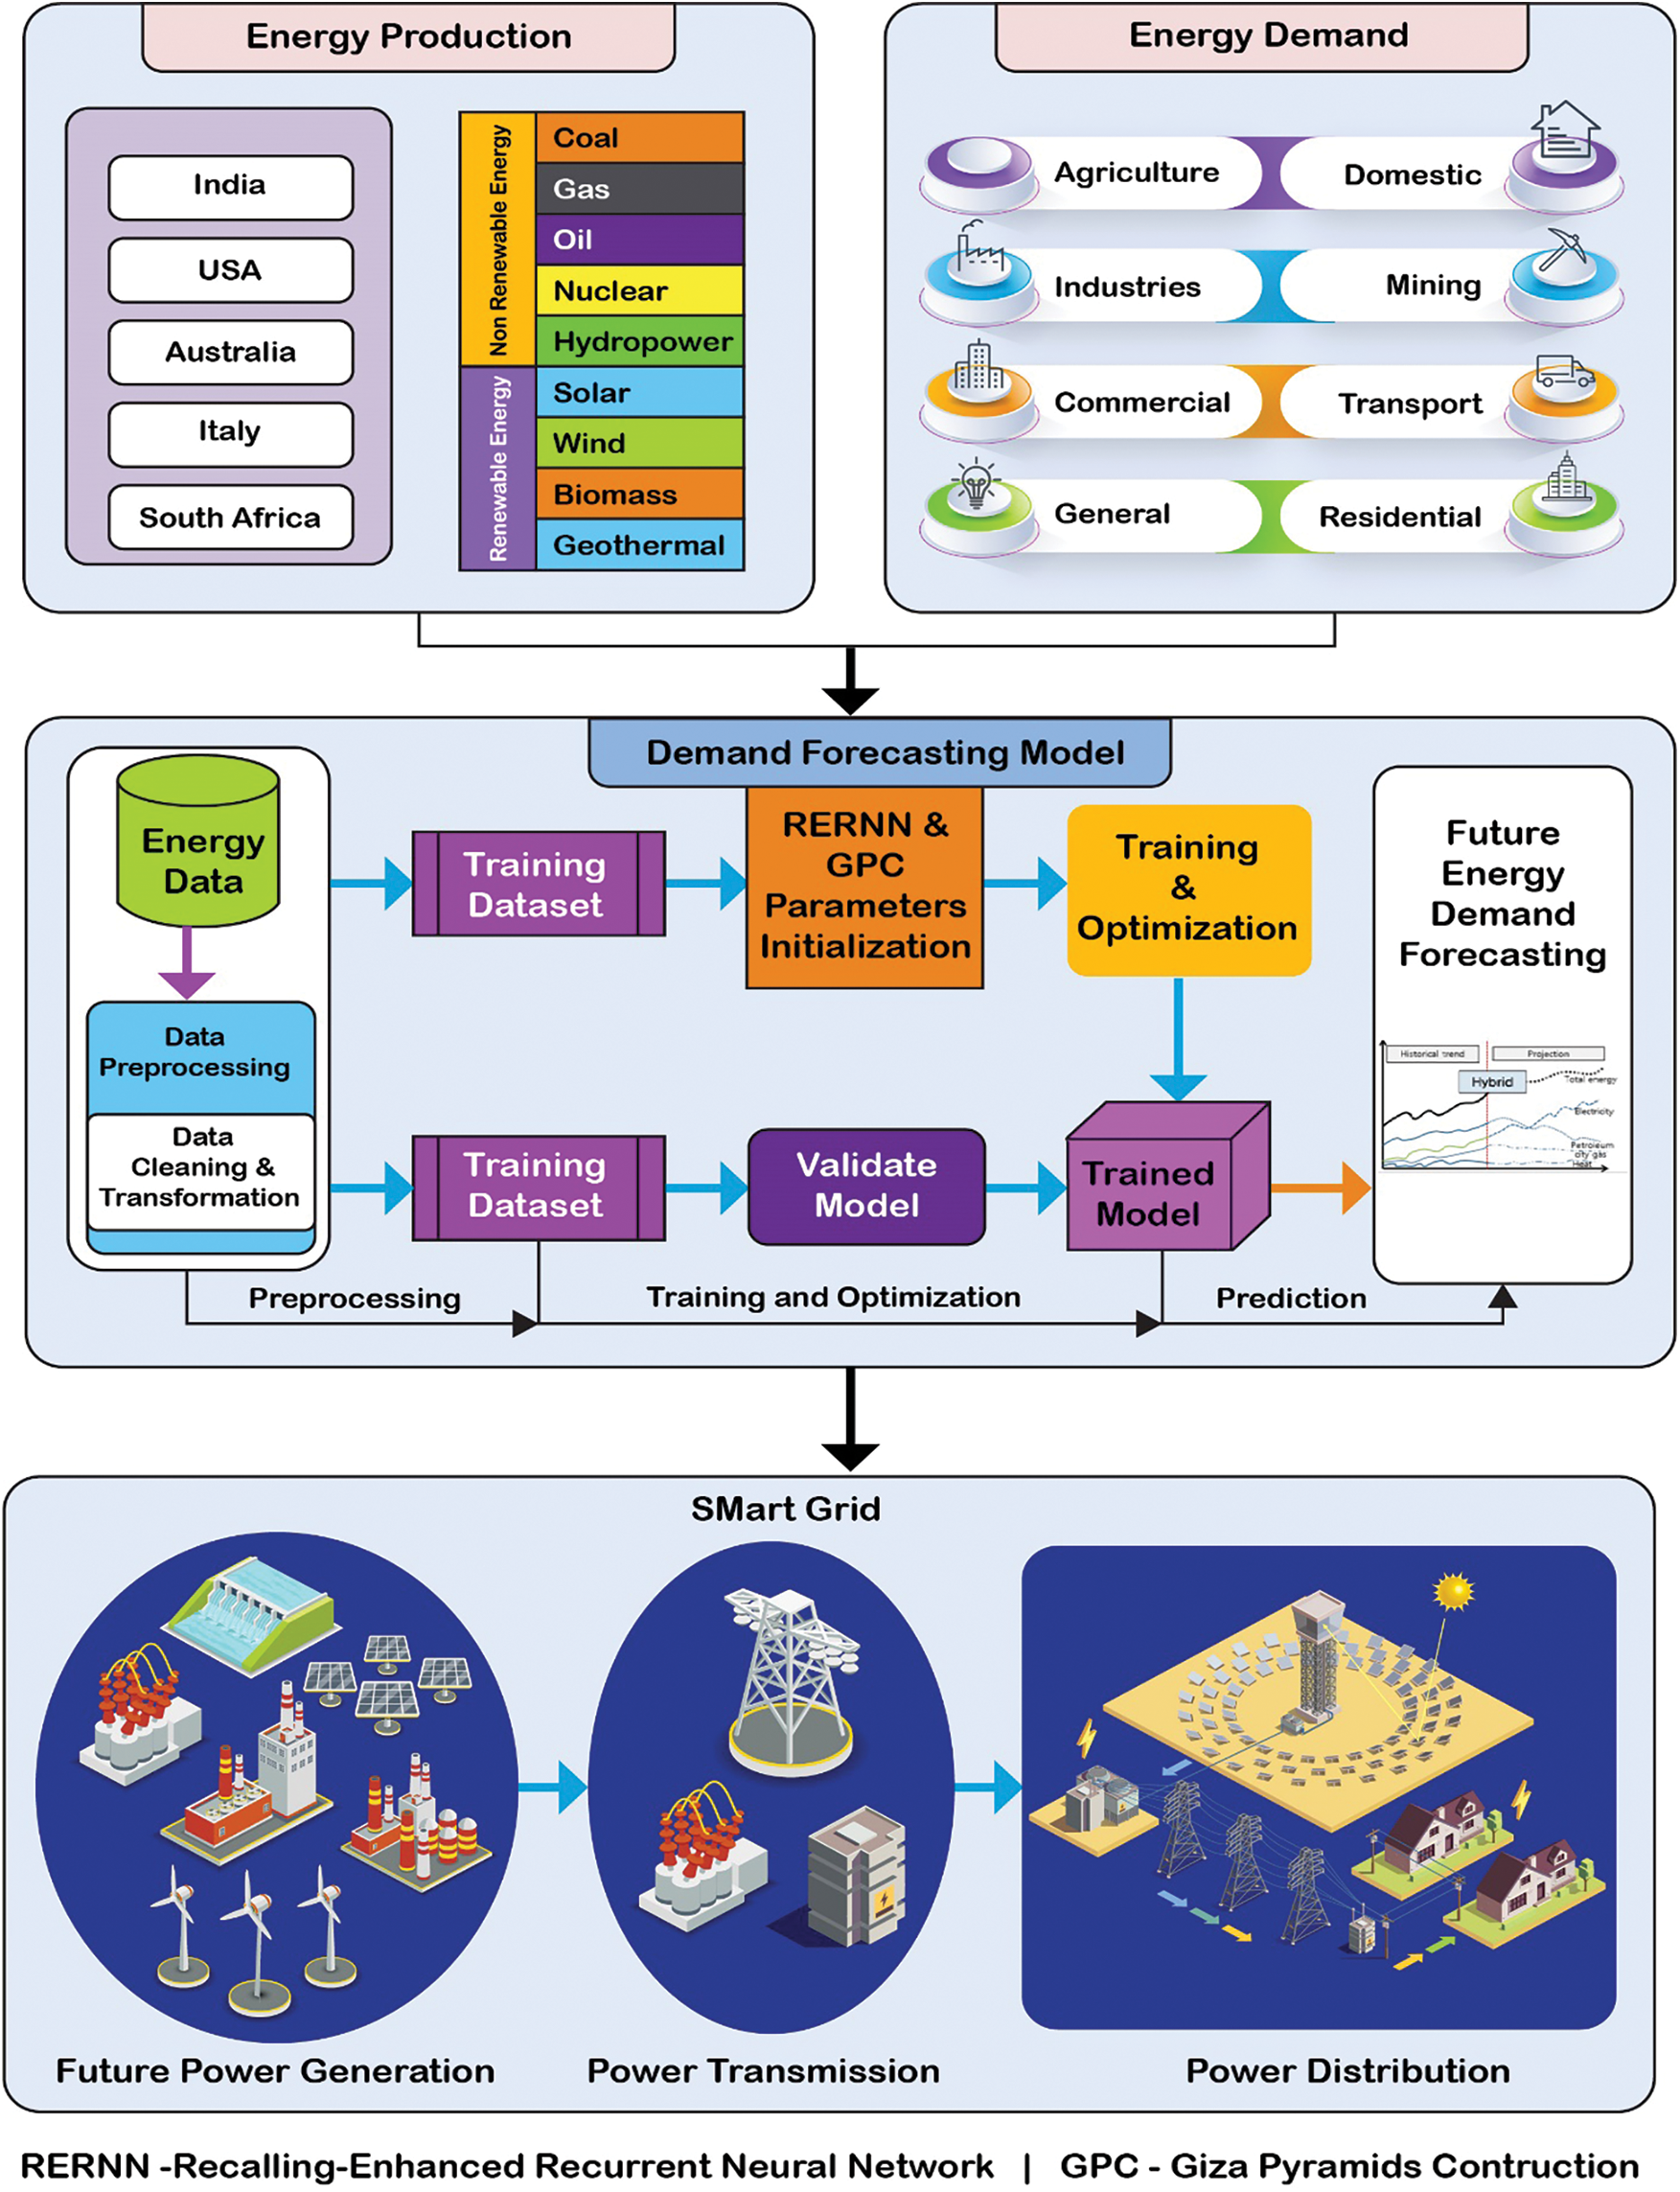
Figure 1: Overview-flow diagram
In the study conducted earlier [14], the optimum capacity establishment of renewable energy sources was evaluated with the help of the existing configuration. The configuration consists of a multi-objective optimization mode connected with a constant mode. This study considered tentatively resolved power mode to explore nine bigger states of India. Pareto frontiers, large onshore wind share, effective photovoltaic energy, and hydro-electric source were confirmed by this study as the highest-ranking solutions. In the literature [15], the researchers investigated three factors Energy Consumption (EC), Gross Final Energy Consumption (GFEC), and Renewable Energy Sources (RES). A new model was introduced in the name of Optimized Fractional Non-linear Grey Bernoulli which is abbreviated as OFANGB (1,1). In this model, three criteria were considered such as fractional-order value r, background value λ, and power index value represented as γ, fractional-order value can be enhanced by a Genetic Algorithm (GA). The researcher [16] detailed the costs incurred from RES and its advantages in power generation at remote places in addition to externality price calculation. The presented method related five distribution-side functions to identify the best player in business activities. The study analyzed the relativity of power production from usual business functions which is five times more than wind, solar, and hydel functions.
Das et al. [17] discussed the present condition of the Indian power system, controlling norms followed by the governments, and its future goals. According to the researchers, a comparative analysis is required to achieve a major paradigm shift. A low-term transmission adjustable device can be developed with a focus on the infrastructure development of the switching process, hydro storage voltage capacity, and previous coal-fired power plants. The market gets influenced by dynamic changes when delivering adjustable resources, viz., Demand-Side Response (DSR), and storage. It is inevitable to model a transition schedule with the help of enhanced scheduling techniques so that the interconnection, of various sector-specific strategies, can be concentrated. Akintande et al. [18] elucidated the consumption pattern of renewable energy through time-series data analysis spanning between 1996 and 2016. The researcher classified the driving factors into three categories. With the identification of 34 criteria, all these prediction factors were incorporated. The paper introduced the Bayesian Model Averaging (BMA) technique, which is based on the assumption that the couple-mode option for the criterion chosen is unstable. The outcome of the process of growth, urban population, power usage, and human capital are significant factors that increase the usage of renewable energy in optional cities. The study mentioned that when these appliances are enhanced, it improves the usage of renewable energy. Murshed et al. [19] provided knowledgeable insights on the non-applicability of trade up-gradation, foreign capital inflows, and the significance of stimulated utilization of Renewable Energy Sources. The Sustainable Development Goals of the United Nations, which have a deadline of 2030, aim to reduce costs associated with the transition from non-renewable energy (NRE) to renewable energy (RE). In this scenario, trade, as well as financial procedures, are aimed at foremost importance so that switching to RE is achieved in South Asian countries. According to the results attained from the cost analysis’s function, a large degree of trade function and better foreign currency
inflows will continue to play vital roles in augmenting the share the renewable energy at the consumption of overall energy levels in the South Asian region. So, these outcomes demand vital policy implementation to attain energy sustainability across South Asia. Mendonca et al. [20] verified the impact of Gross Domestic Product (GDP) using population growth and production of renewable energies concerning CO2 emissions in 50 world’s largest economies from 1990 to 2015. A hierarchical regression design was assessed with ‘country’ as a broad level while ‘year’ as a specific one. The smart grid uses computer technology to improve the communication, automation, and connectivity of the various components of the power network. This allows us an example of bulk transmission of power gathered from multiple generation plants.
2.1 Background of the Research
This section provides a systematic review of literature in which policy frameworks and peer-reviewed journal articles related to energy were considered. The current study highlights RES as the core technique for transforming the future energy generation plants into sustainable only. International Renewable Energy Agency (IRENA) predicted the global share of this RES to be 25% by 2030. In the case of India, RES is predicted to contribute the nation’s electricity requirement by up to 73% by 2050. In India, shell experts estimated that the Compound Annual Growth Rates (CAGR) of photovoltaics, solar energy, and wind in the range of 16.1%, 12.0%, and 12.8% respectively between the years 2025 and 2030. Investigators have utilized several methods and explored the feasibility of integrating RES into traditional power utility setups. The existing studies lack in considering a single objective function since it seeks to delineate the total cost of generating a unique solution on an annual basis. This solution might be combined with local minima to create multi-objective-based solutions that bring a global perspective to the approach. A prediction is a computation or estimation that uses data from previous events, as well as recent trends, to predict the outcome of a future event. A forecast, on the other hand, is the act of signaling that something will happen in the future, with or without prior knowledge.
The electrical system should be analyzed on an hourly basis though it is challenging to capture information from an annual estimate. With the lack of maximal temporal resolution modeling, many questions remain unanswered, especially for the maximal incorporation of dynamic RES. So, it is important to assess the sustainability indices to recognize the choice of sustainable energy. There is no studies that evaluated the priorities for the Indian electricity system while sustainability indicators were developed focusing on different objectives and for hourly resolution covering an entire year. Therefore, an optimal scheme is required for an innovative forecasting model that enhances time-series data and recognizes the energy consumption pattern of India. The studies conducted earlier and the methodologies followed in such studies lack an established framework for the proposed issue. The basic ideology considered in the research methodology is to analyze the current load and generation profile to gain an understanding of the present demand and production pattern. With this motivation, the current study is conducted.
2.2 Future Generation of Electricity
Power plants are installed in various parts of a country while electricity generation technologies have met huge energy demands in the past and need to be upgraded. Short-term energy demands, at home, in business, and in cars, are still met by burning fossil fuels [21]. In general, there is a limitation that exists for most industrial and transportation equipment which depends on its combustion engines for producing energy and electricity. With technology enhancement, electrification is the need of the hour to meet the growing energy demands and replace the fossil-fuel-powered combustion engine [22].
One of the finest examples of this scenario is the car. Until recently, all the cars have been powered with their fuel pistons i.e., Internal Combustion Engine (ICE). ICE is one such miniature fuel-based electricity plant, fixed in cars, for energy generation required for transportation [23]. With the enhancement in power storage capacities, Electric Vehicles (EV) has grown as a preferable and feasible choice to replace gasoline-powered vehicles across the globe. The demand for energy across the world is constantly rising. This increased demand is caused in part by the increase in population, and by economic development. It is because these areas experienced large-scale economic development, their original energy sources were fossil fuels. As predicted, the share of renewable in meeting global energy demand will grow to reach 12.4% in 2023. The share of fossil fuels in the total primary energy supply is expected to include around 81% of the total in 2023. By 2050, renewable energy will approximately account for 30% of energy structure in the world. India’s population is projected to increase to 1.52 billion by 2036. India’s population was 1.21 billion as per the Census of 2011 and the projections now estimate that the population will grow by 311 million by 2036.
There is a paradigm shift experienced in recent years in which people started preferring electric cars instead of ICE-based fuel engine cars to be productive, sustainable, and ahead of the competition [24]. Cho et al. [25] proposed an Interconnecting and detecting electric appliances as part of a home energy management system. This technique can be used in our proposed model for electric generation in India. In this paper, chosen the countries like Australia, Italy, South Africa, and the USA for comparison concerning India because we have chosen the countries from the best continents and these countries have many facilities compared to other countries, and the growth of population is high compared to other countries. The future generation of electrical energy demand to be predicted by the following parameters are Gross Domestic Product (GDP), kWh per capita, CO2 emissions (metric tons per capita), and access to electricity based on a percentage of the population.
3 Hybrid Optimal RERNN and GPC for Energy Management System
The current study introduces a hybrid approach integrating Recalling-Enhanced Recurrent Neural Network (RERNN) and Giza Pyramids Construction (GPC) and is abbreviated as the RERNN-GPC technique. While RERNN possesses selective memory features, GPC is a meta-heuristic algorithm that deals with several issues. The main goal of this proposed approach is to assess the present load requirements and production profile to consider the future requirement and production capacity. This metaheuristic algorithm is used to find the best solution out of all possible solutions in the shortest time possible and also speed in convergence, accuracy, and problem-solving ability at high dimensions. A step-by-step explanation of the proposed method is given herewith.
RERNN is a type of artificial neural network that evaluates radial functions in the field of mathematical modeling. Elman Recurrent Neural Network has three known layers whereas RERNN consists of six layers and is incorporated with selective memory characteristics. Moreover, the conjugate algorithm was modified to train the RERNN using an Armijo-based search approach thus enhancing the speed of convergence [26,27]. Elman Neural Network exhibits slow convergence. To overcome this disadvantage, RERNN was introduced. The architecture of RERNN is shown in Fig. 2. It has the input layer, the state layer, the memory layer, summing, hidden, delay, and output layers. The inputs are sent from the input layer to the state layer for state management, whose outputs are sent to the memory and sum layers for handling delay, and they are sent to the hidden layer. The outputs layer receives the processed data from the hidden layer and provides suitable output based on components.
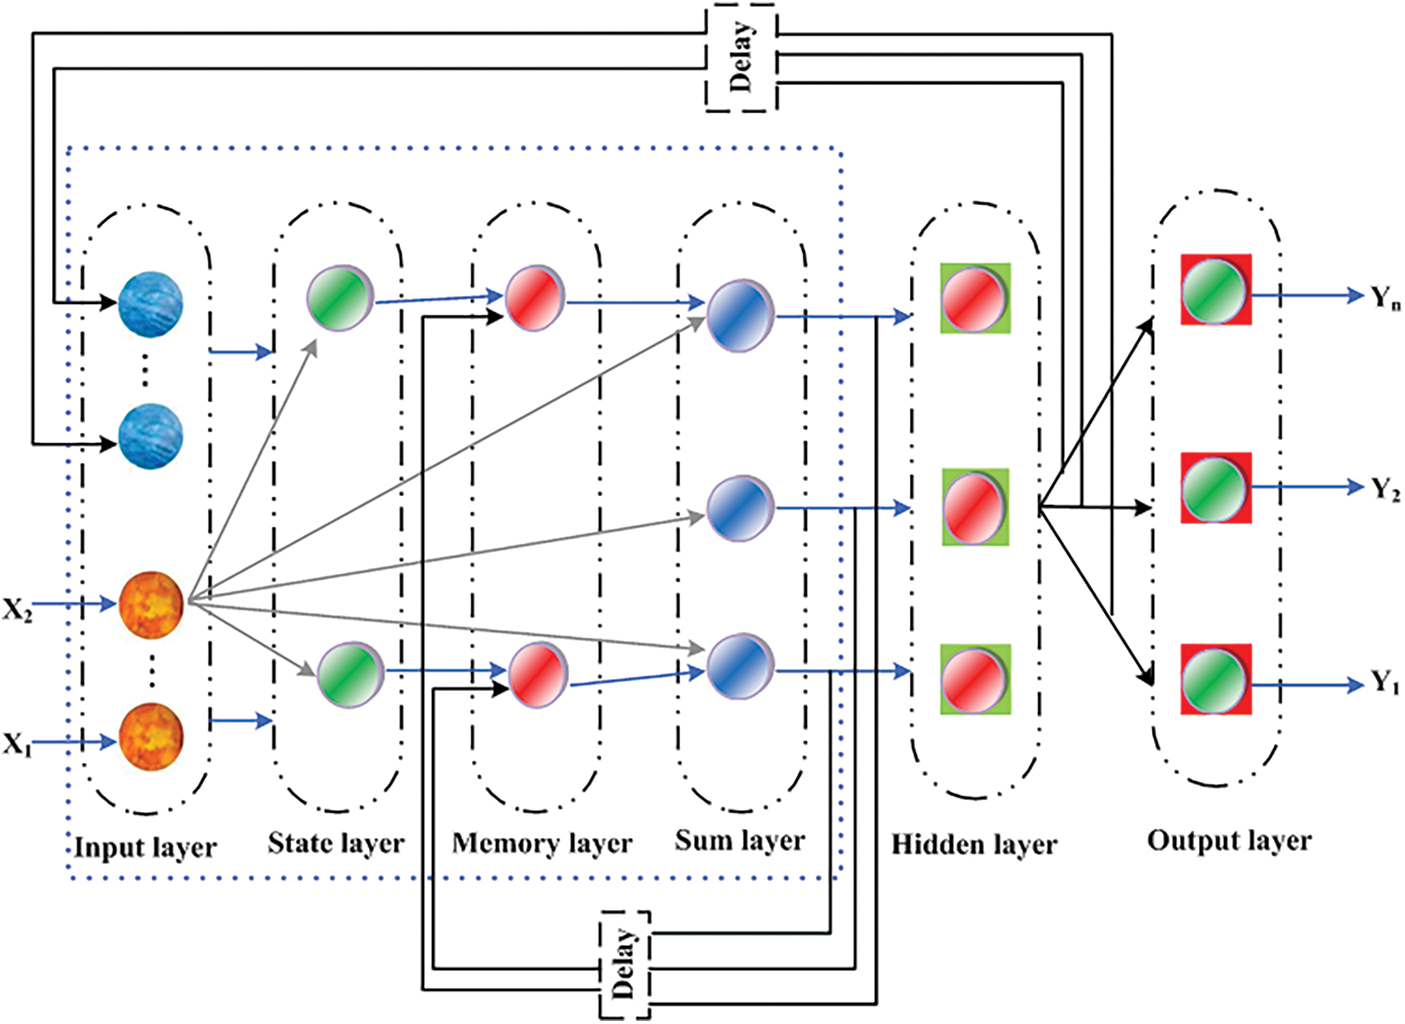
Figure 2: Structure of RERNN
RERNN networks with Long Short-Term Memory (LSTM) are an extension of RERNN. The layers of a RERNN are built using LSTM as the building block. LSTMs assign “weights” to data, allowing RNNs to either let new information in, forget it, or give it enough importance to affect the output.
3.1.1 RERNN–Step-by-Step Procedure
Step 1: Initialization
Initialize the parameters about Energy vectors namely the number of nodes and weight vectors
Step 2: Random Generation
Generate the input vectors on a random basis after the initialization process. Here the randomly-generated Energy vectors system parameters namely battery power, engine, and EM (Electromagnetic) torque with speed and battery State of Charge (SoC) are taken as input parameters.
Step 3: Analyse Iterations
If the current iteration does not converge, perform the next iteration.
Step 4: Find the Learning Rate
Compute the learning rate using the generalized Armijo search method for which the search condition is checked using Eq. (1).
Learning rate is a hyper-parameter that controls the weights of the networks with respect to the loss gradient. The lower the value, the slower will be the travel along with the downward slope.
Step 5: Computation of new weight
Compute weights with the help of the gradient descent method as given in Eq. (2).
Step 6: Check the Maximum Iteration
If the algorithm converges or it reaches the maximum number of iterations then stop, else repeat.
Step 7: Compute the direction
Compute the conjugate gradient descents and determine the direction of the learning as follows in Eqs. (3) and (4)
If the difference between the current and previous iteration is greater than E then go to step 4. Fig. 3 shows the working of RERNN.
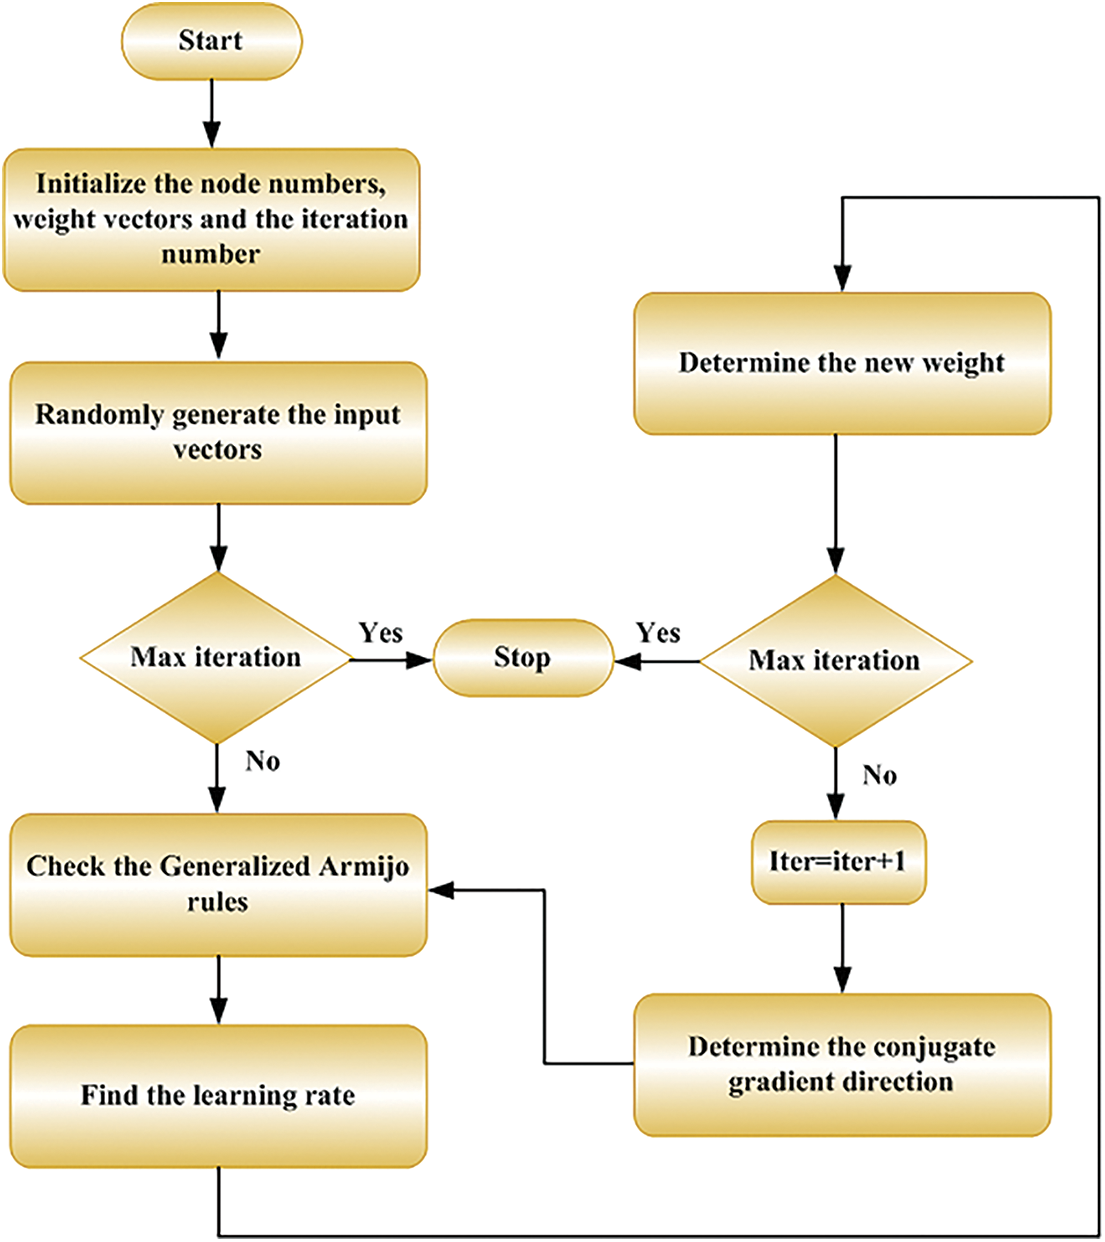
Figure 3: Flowchart for working of RERNN
GPC is a meta-heuristic algorithm that deals with several issues [28]. Metaheuristic algorithms strive to identify the optimal solution out of all available possibilities with less computation time. It has speed in convergence, accuracy, and problem-solving ability in high dimensions. The main goal of the proposed approach is to assess the current load including the production profile to gain knowledge about current requirements and production form. A step-by-step procedure of the proposed method is shown in Fig. 4.
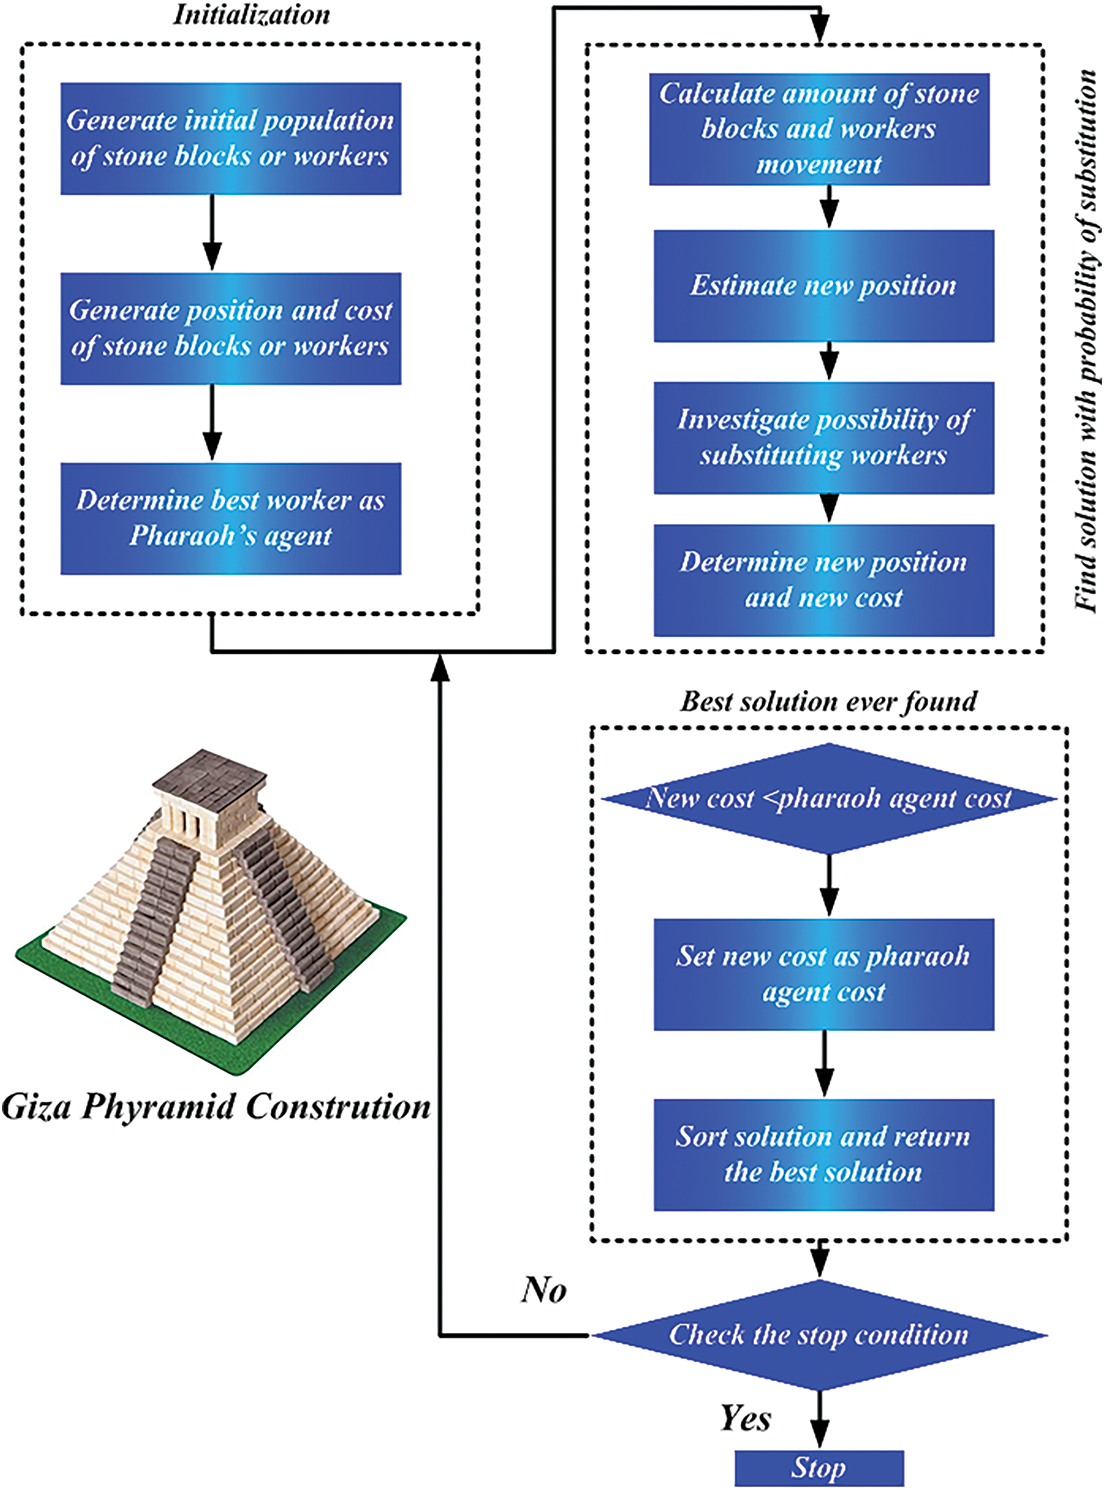
Figure 4: Flow chart of Giza Pyramid Construction
Step 1: Initialize Values
Start the population of the Giza pyramid to find the demand and iterations of this system.
Step 2: Random Generation of Inputs
Generate the input vectors as shown in Eq. (5)
Here,
Step 3: Fitness Function
To assess the current load and production profile to gain consideration about the current requirement with production form, the fitness function is used.
Step 4: Generation
Generate the initial population, their position, and the cost of workers (stone blocks).
Step 5: Determination
Determine the best worker as Pharaoh’s agent.
The workers are slaves, coolies, masons, metalworkers, and carpenters, led by an expert agent. This expert agent is a foreman called Pharaoh’s agent. Workers carry stone blocks. This is done under the direct supervision of the Pharaoh’s agent. There may be different workers each responsible for carrying a stone block. The task report should be regularly given to Pharaoh’s special agent. This task is performed by a worker. The idea is how these factors do the job, namely the simple worker, and the Pharaoh’s special agent.
Step 6: Calculation
Calculate the number of stone blocks displaced and the volume of worker movement.
Step 7: Estimation
Estimate the new position of workers.
Step 8: Investigation
Investigate the possibility of substituting the workers and determining the new position as well as the new cost.
The proposed technique was experimentally validated and the results and discussion are detailed in this section. The study intends to find the optimum product mix for future electricity schemes in India. The introduced hybrid approach is a combination of RERNN and GPC. RERNN is used for the selective memory feature while GPC is a meta-heuristic algorithm that deals with different sets of problems. The results show the optimal product mix that meets the demands of the future electricity system in India. The hybridization of RERNN with GPC shows the outputs such as CO2 emission, electricity generation, energy demand prediction, computation time, and accuracy. The source of the dataset is taken from this link https://www.iea.org/countries.
Fig. 5 shows the actual and forecasting demands of India. During 1990, the actual demand was 200 tons which increased to 400 tons and 800 tons in 2000 and 2010 respectively. The forecasting demand stood at 800 tons for the year 2010 while it increased to 1380 tons for the year 2020.
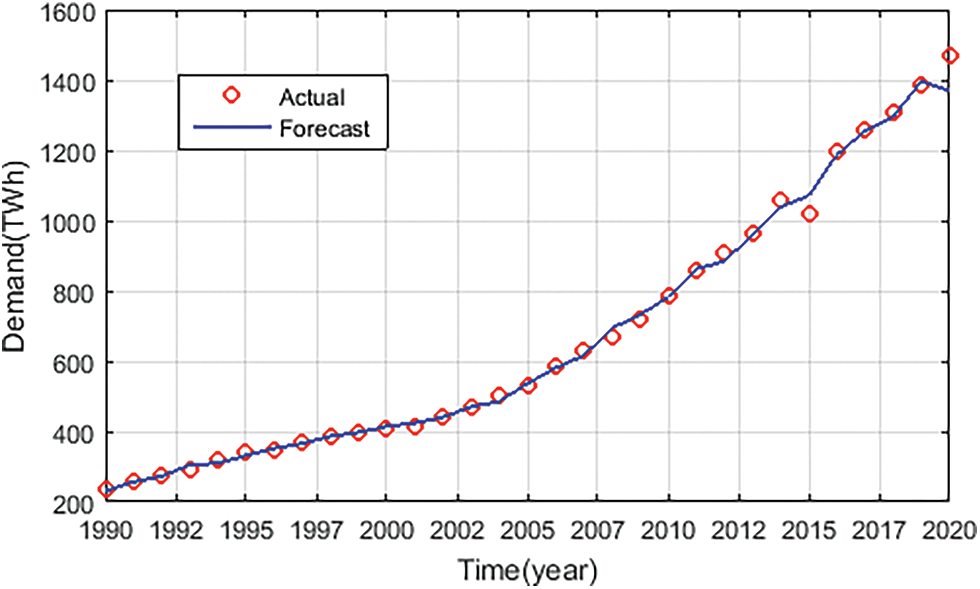
Figure 5: Demand forecasting in India
Fig. 6 shows the actual and forecasting demands for Australia, Italy, South Africa, and USA. In subplot 8(a), the actual demand for Australia is presented. The actual demand for the years 1990, 2000 and 2010 was 145 tons, 190 tons and 238 tons whereas it will be 257 tons for the year 2020. In subplot 8(b), the actual demand for Italy is presented. The actual demands for the years 1990, 2000 and 2010 were 237 tons, 300 tons and 325 tons whereas it will be 337 tons for the year 2020. Subplot 8(c) shows the actual demand for South Africa. During 1990, the actual demand was 75 tons which increased to 155 tons in 2000. For the years 2010 and 2020, the actual demand increased to 240 tons and 280 tons respectively. In subplot 8(d), the actual demand for the USA is presented. During 1990, 2000, and 2010, the actual demands were 2950 tons, 3850 tons, and 4200 tons respectively, whereas it will be 4380 tons for the year 2020.
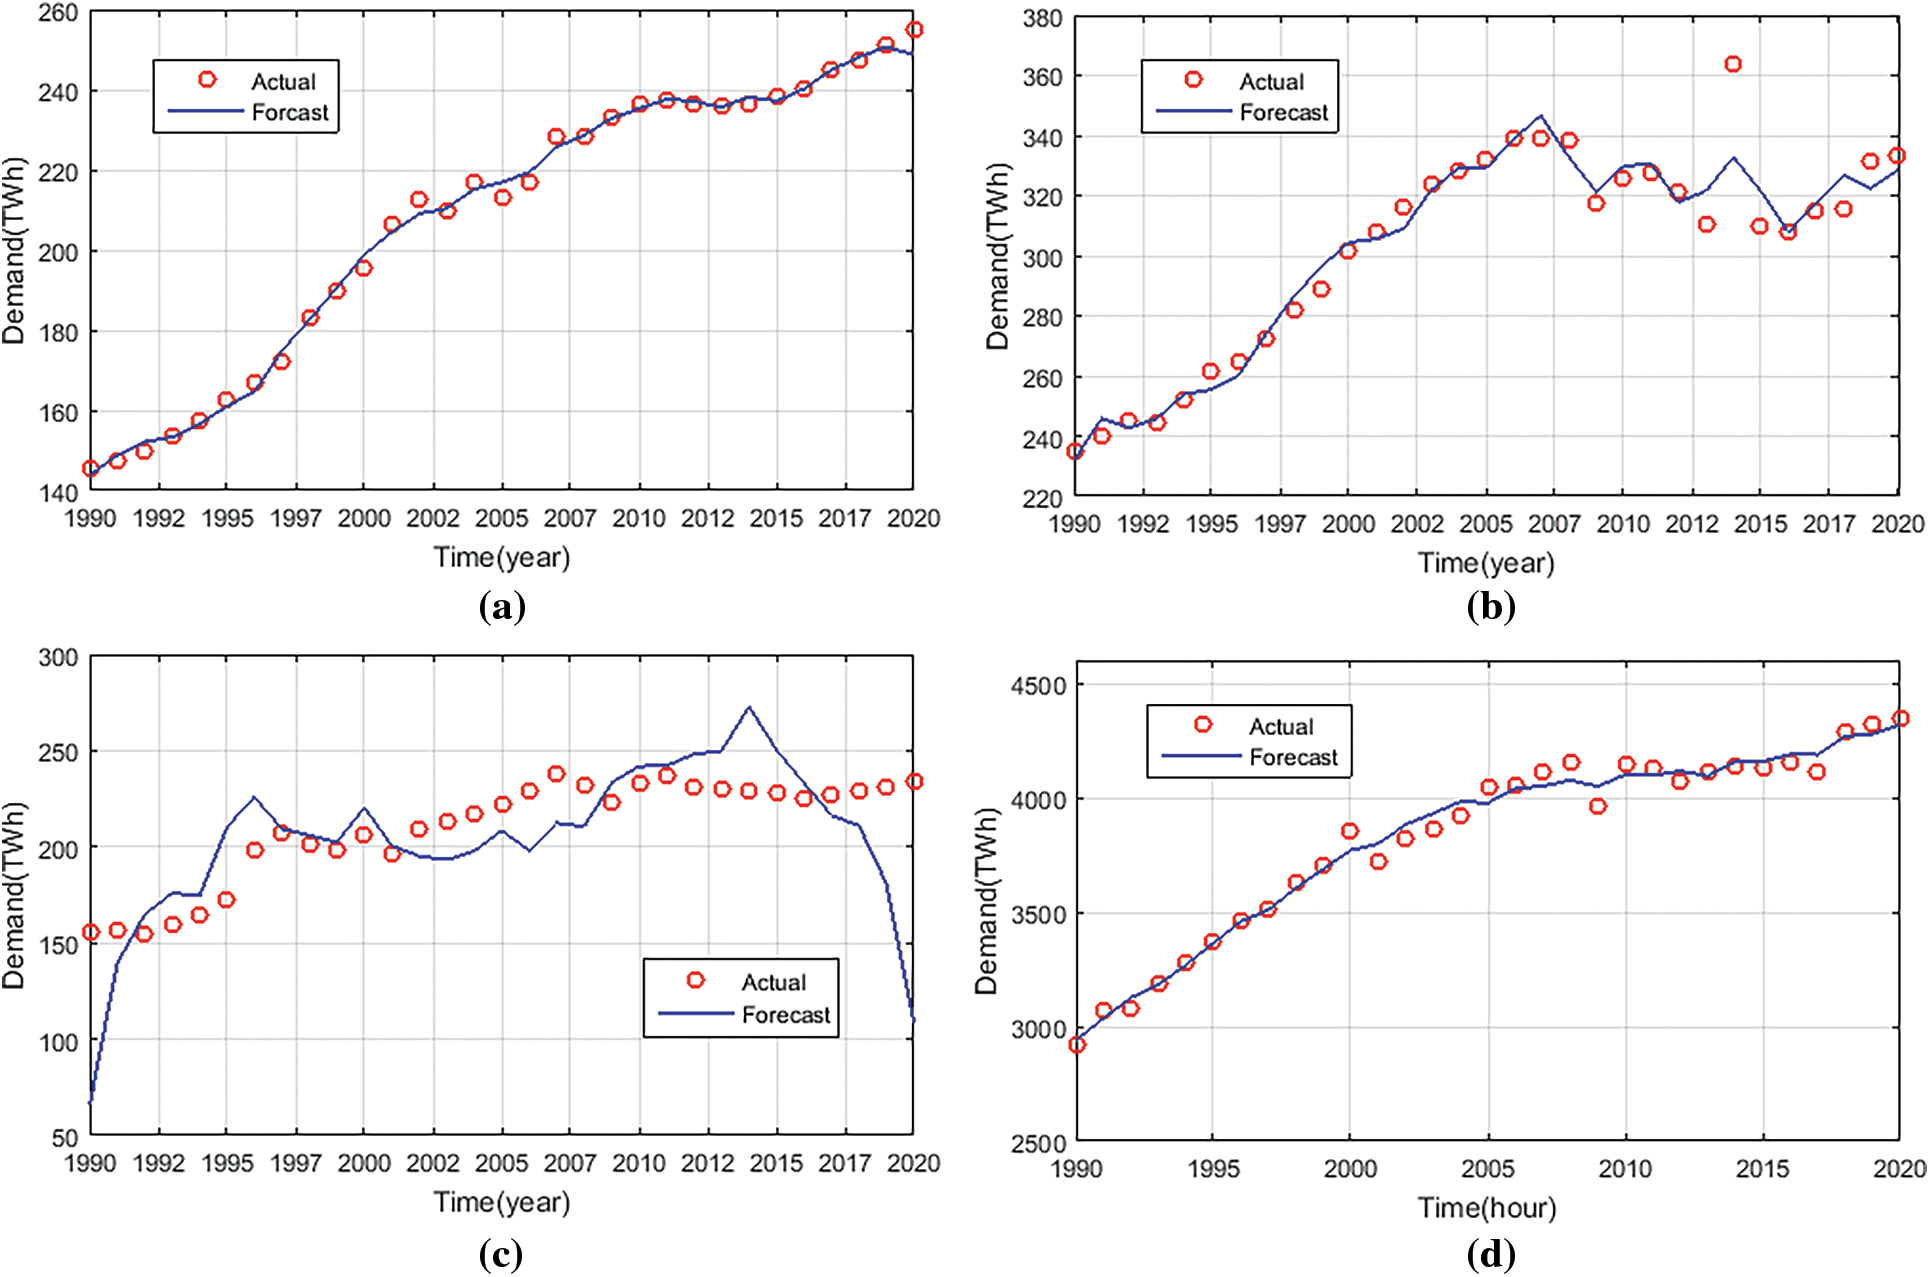
Figure 6: Demand forecasting in (a) Australia (b) Italy (c) South Africa (d) USA
Fig. 7 shows the generation of photovoltaic (PV) electricity across the globe. The actual PV-based electricity generation was 0 GWh between the years from 1990 to 2009 whereas the range from 0.07 GWh to 0.6 GWh between the years from 2010 to 2020, the range from 0.65 GWh to 1.18 GWh between the years from 2021 to 2030, the range from 1.2 GWh to 1.61 GWh between the years from 2031 to 2040. However, the generation of PV electricity is predicted the range from 1.54 GWh to 2 GWh between the years 2041 to 2050.
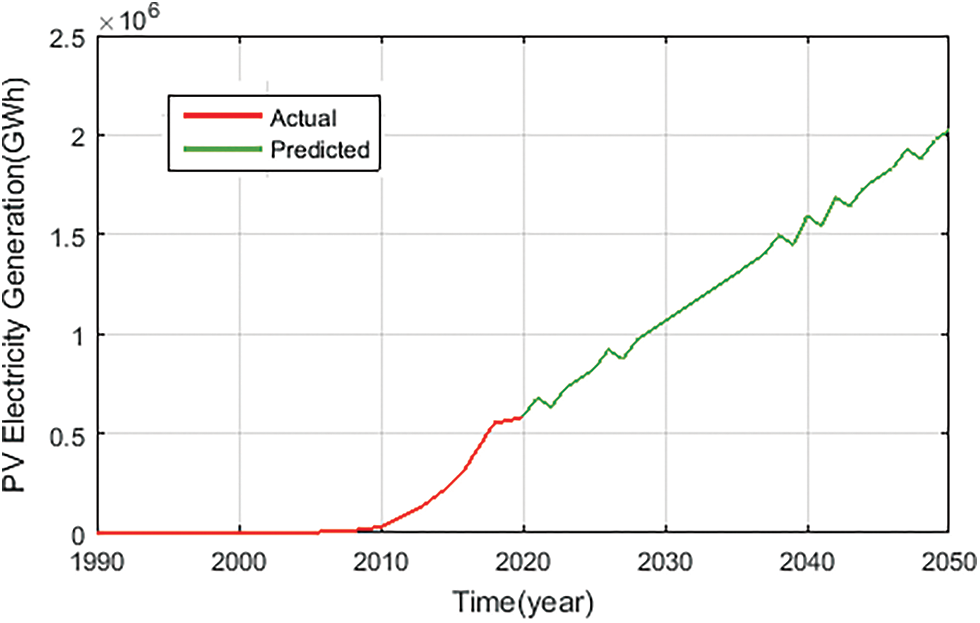
Figure 7: Generation of PV electricity generation across the globe
Fig. 8 shows a comparison of actual demands for five countries namely India, Italy, South Africa, the USA, and Australia. The actual energy demand ranges from 0 TWh to 375 TWh between the years 1990 to 2050 for the countries Italy, South Africa, and Australia, whereas USA actual energy demand is 3000 TWh to 4400 TWh between the years 1990 to 2021 and 4400 TWh to 5200 TWh between the years 2022 to 2050. However, India’s actual energy demand is 0 TWh to 1650 TWh between the years 1990 to 2021 and 1700 TWh to 11000 TWh between the years 2022 to 2050.

Figure 8: Comparison of actual energy demand for five countries
Fig. 9 shows a comparison of predicted demands for five countries namely India, Italy, South Africa, the USA, and Australia. The predicted energy demand ranges from 0 TWh to 375 TWh between the years 1990 to 2050 for the countries Italy, South Africa, and Australia, whereas the USA’s actual energy demand is 3000 TWh to 4400 TWh between the years 1990 to 2021 and 4400 TWh to 5200 TWh between the years 2022 to 2050. However, India’s actual energy demand is 0 TWh to 850 TWh between the years 1990 to 2000, and 800 TWh to 280 TWh between the years 2001 to 2010, 280 TWh to 1100 TWh between the years 2011 to 2020, and 1180 TWh to 9000 TWh between the years 2021 to 2050.
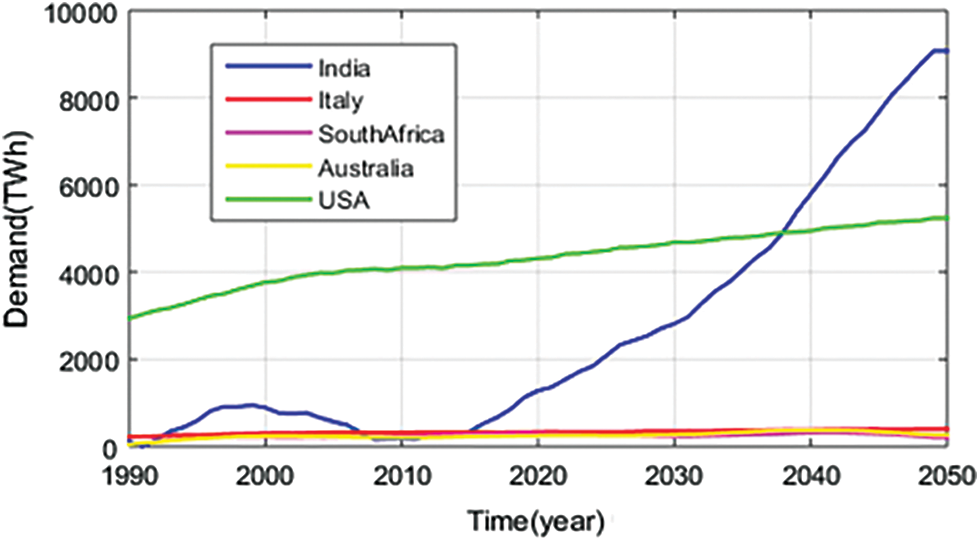
Figure 9: Comparison of predicted energy demand for five countries
Tab. 1 shows the percentage of predicted demand and error for every country with predicted demand and error demands. Tab. 2 shows the usage of electricity based on the category of demand under the consumer category and total electricity.


Tab. 3 shows the consumption pattern of global electricity from 2019 to 2050. Tab. 4 shows the generation of nuclear power capacity across the globe. Tab. 5 shows the capacity of power stations in India. We found the various capacity of power stations for coal, gas, nuclear, hydro, and renewable to the country of India.


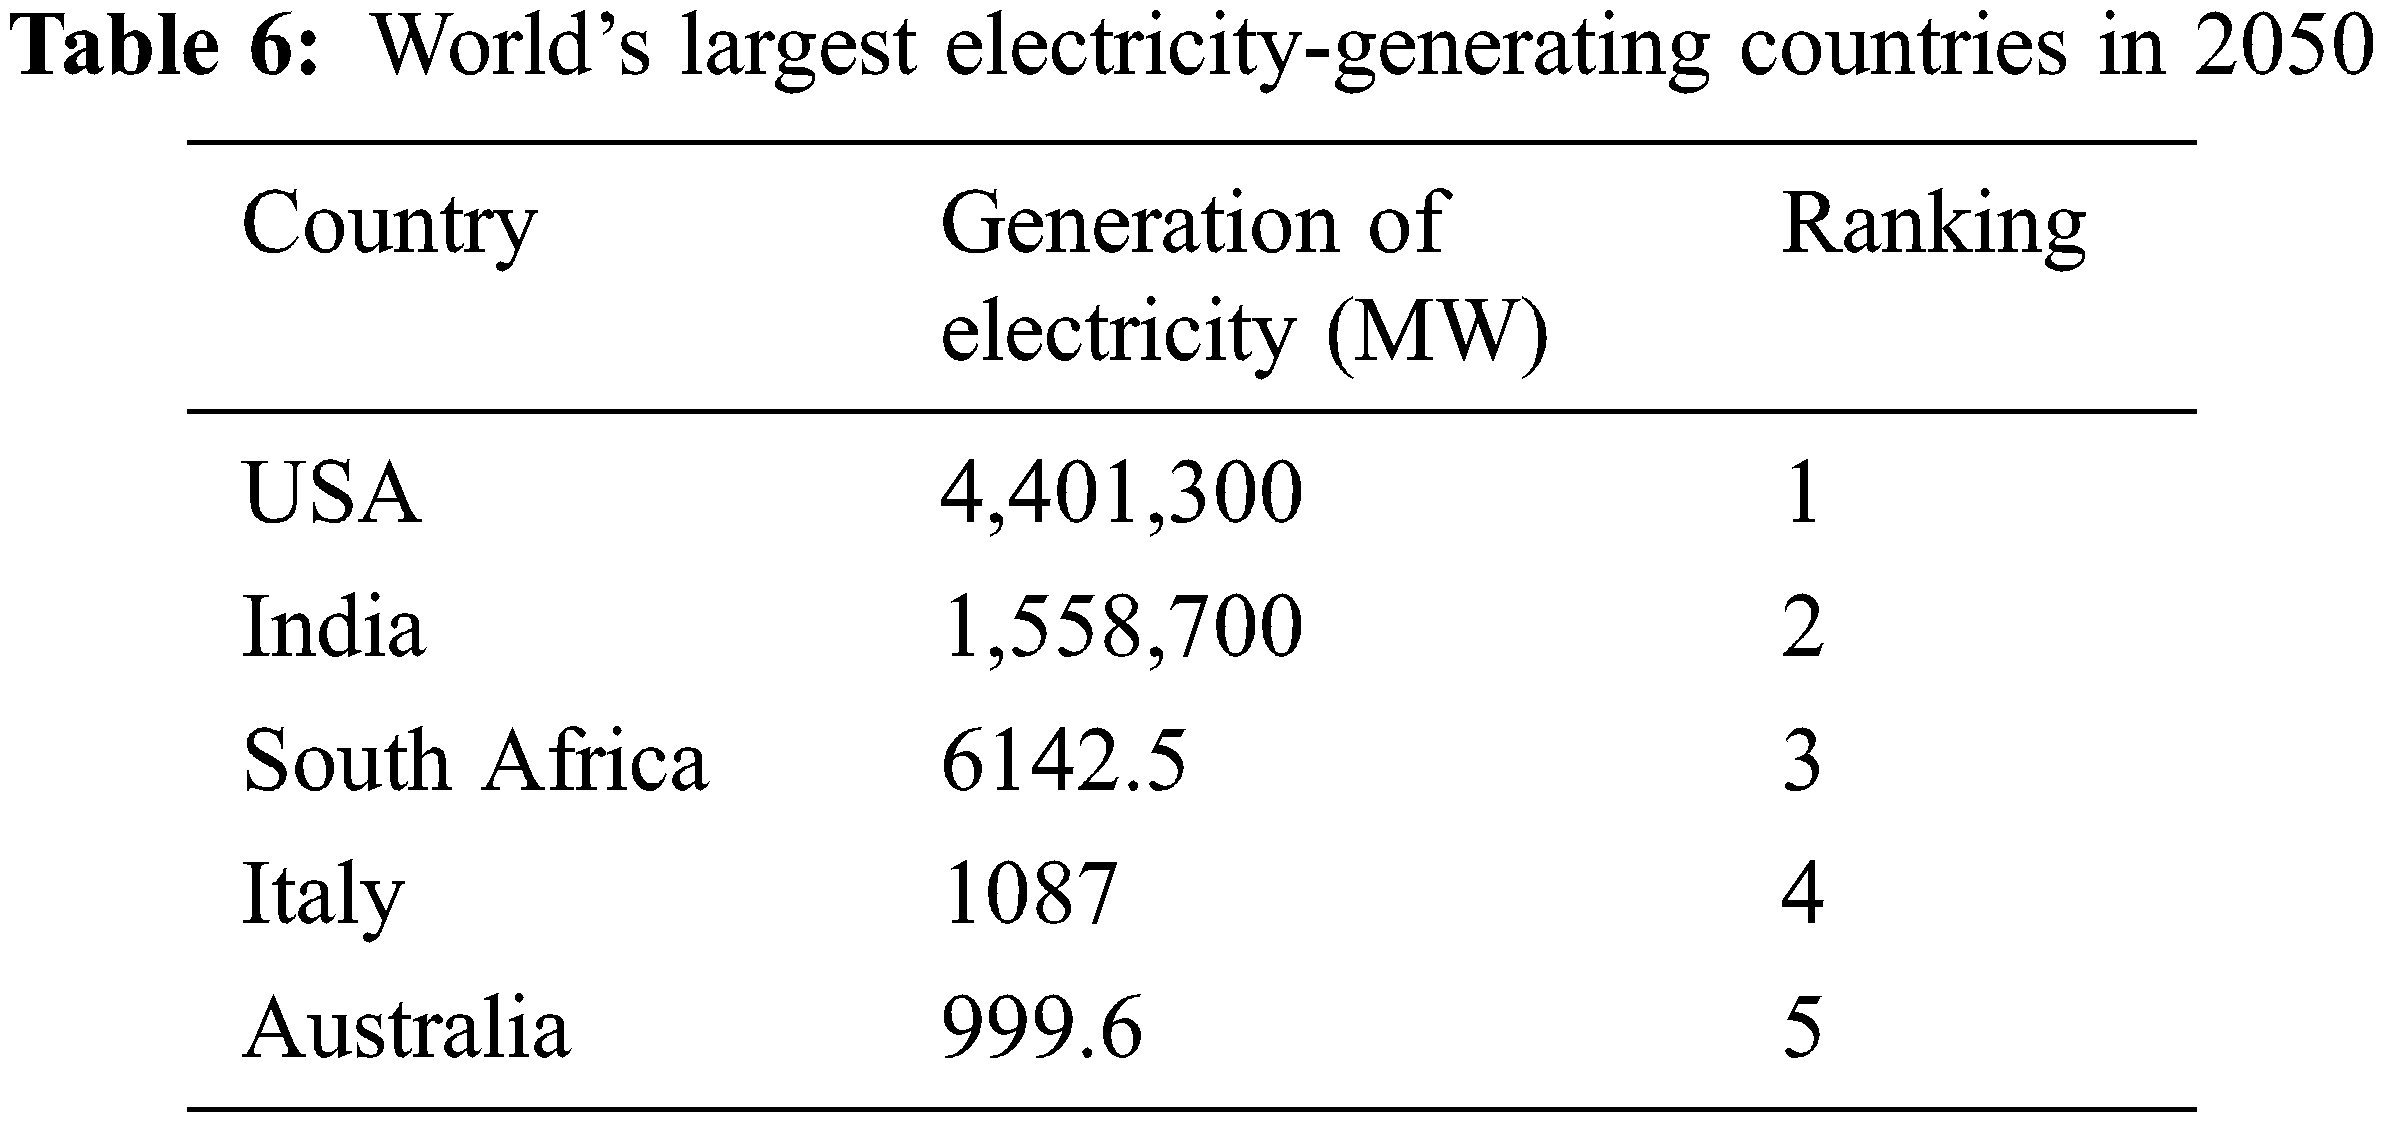
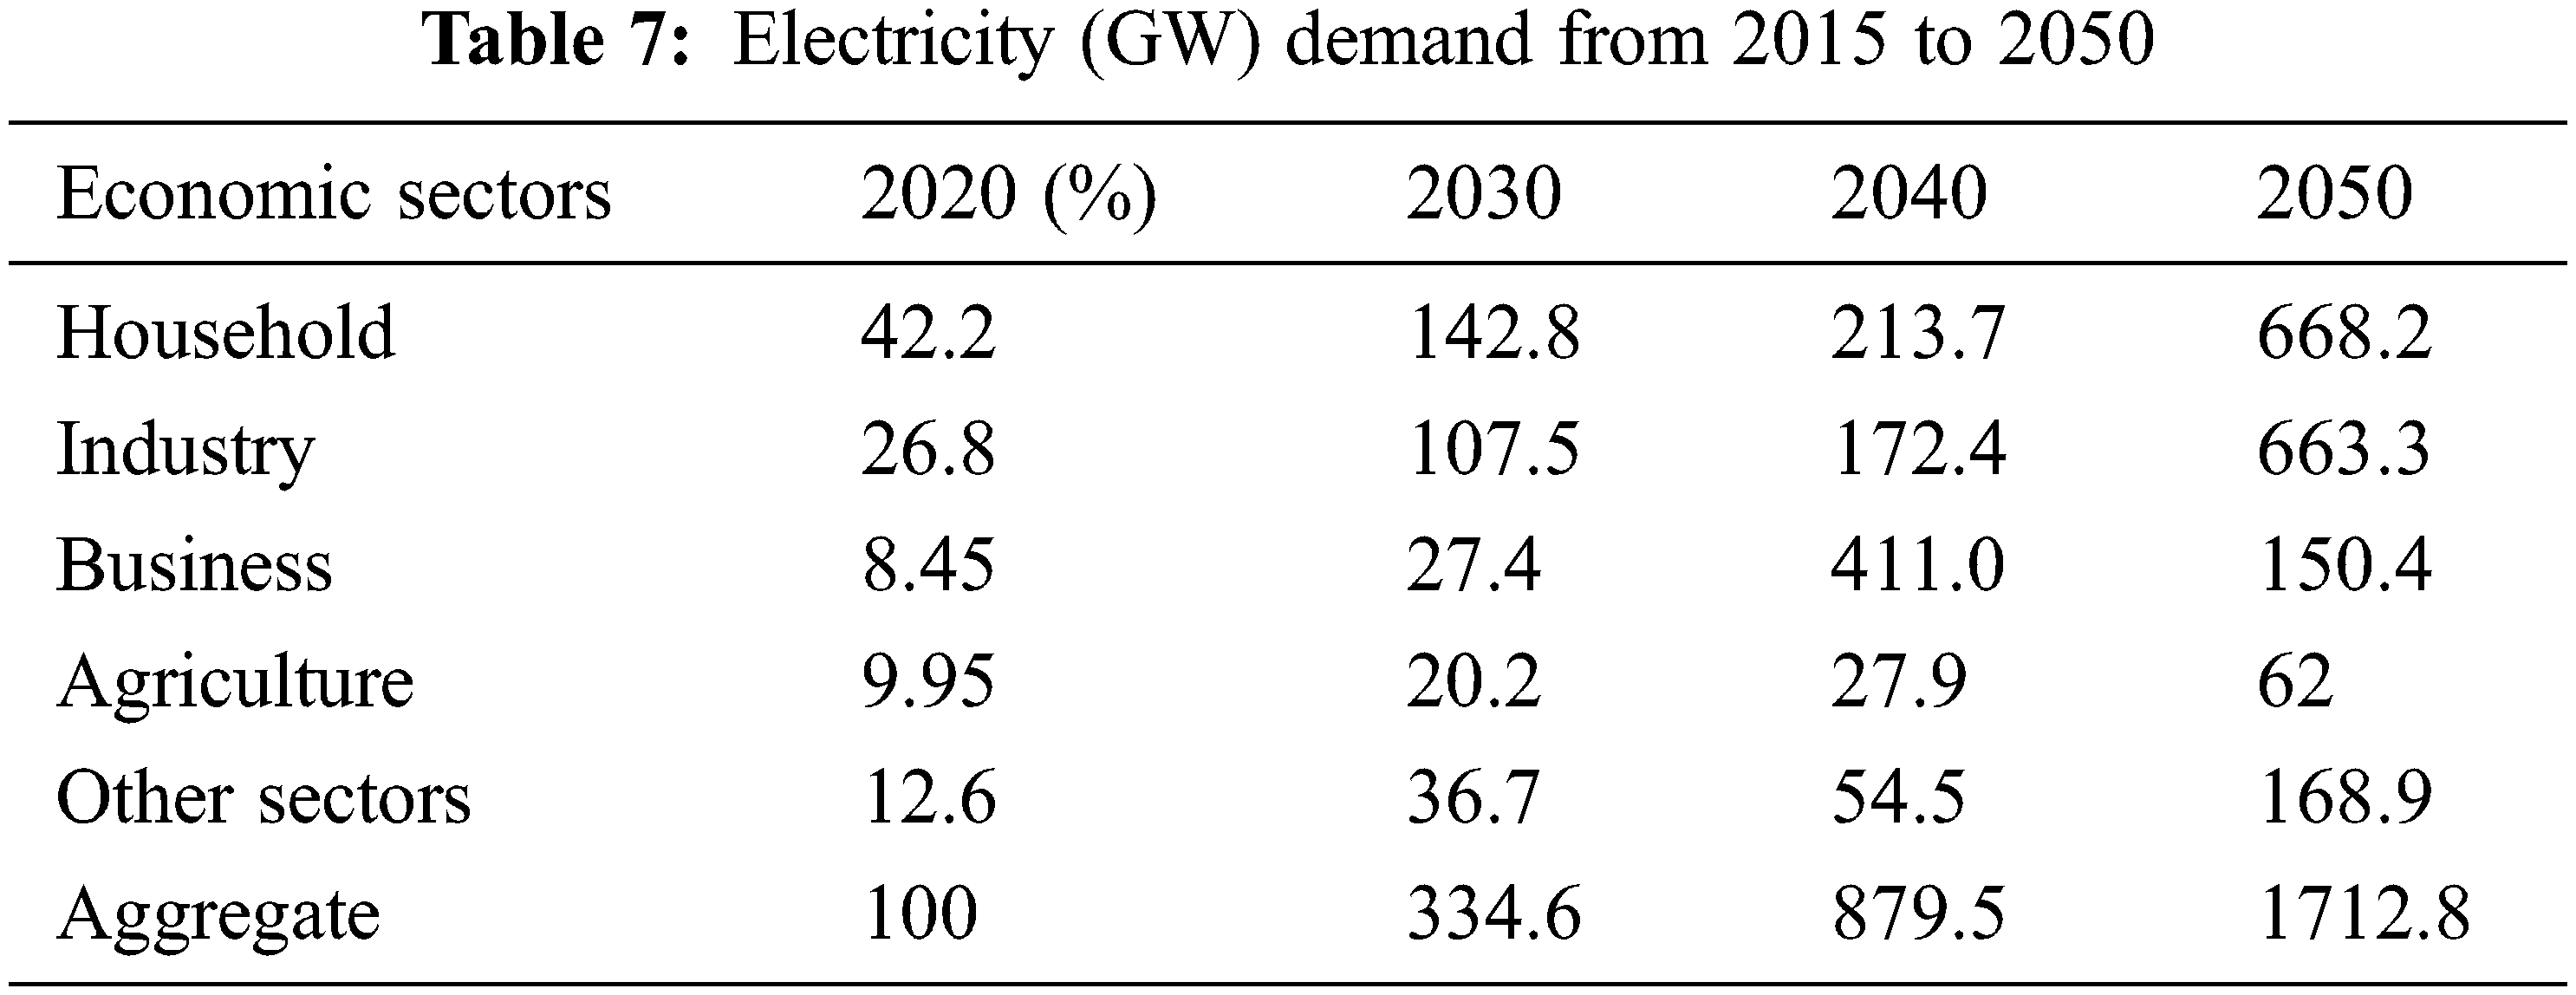
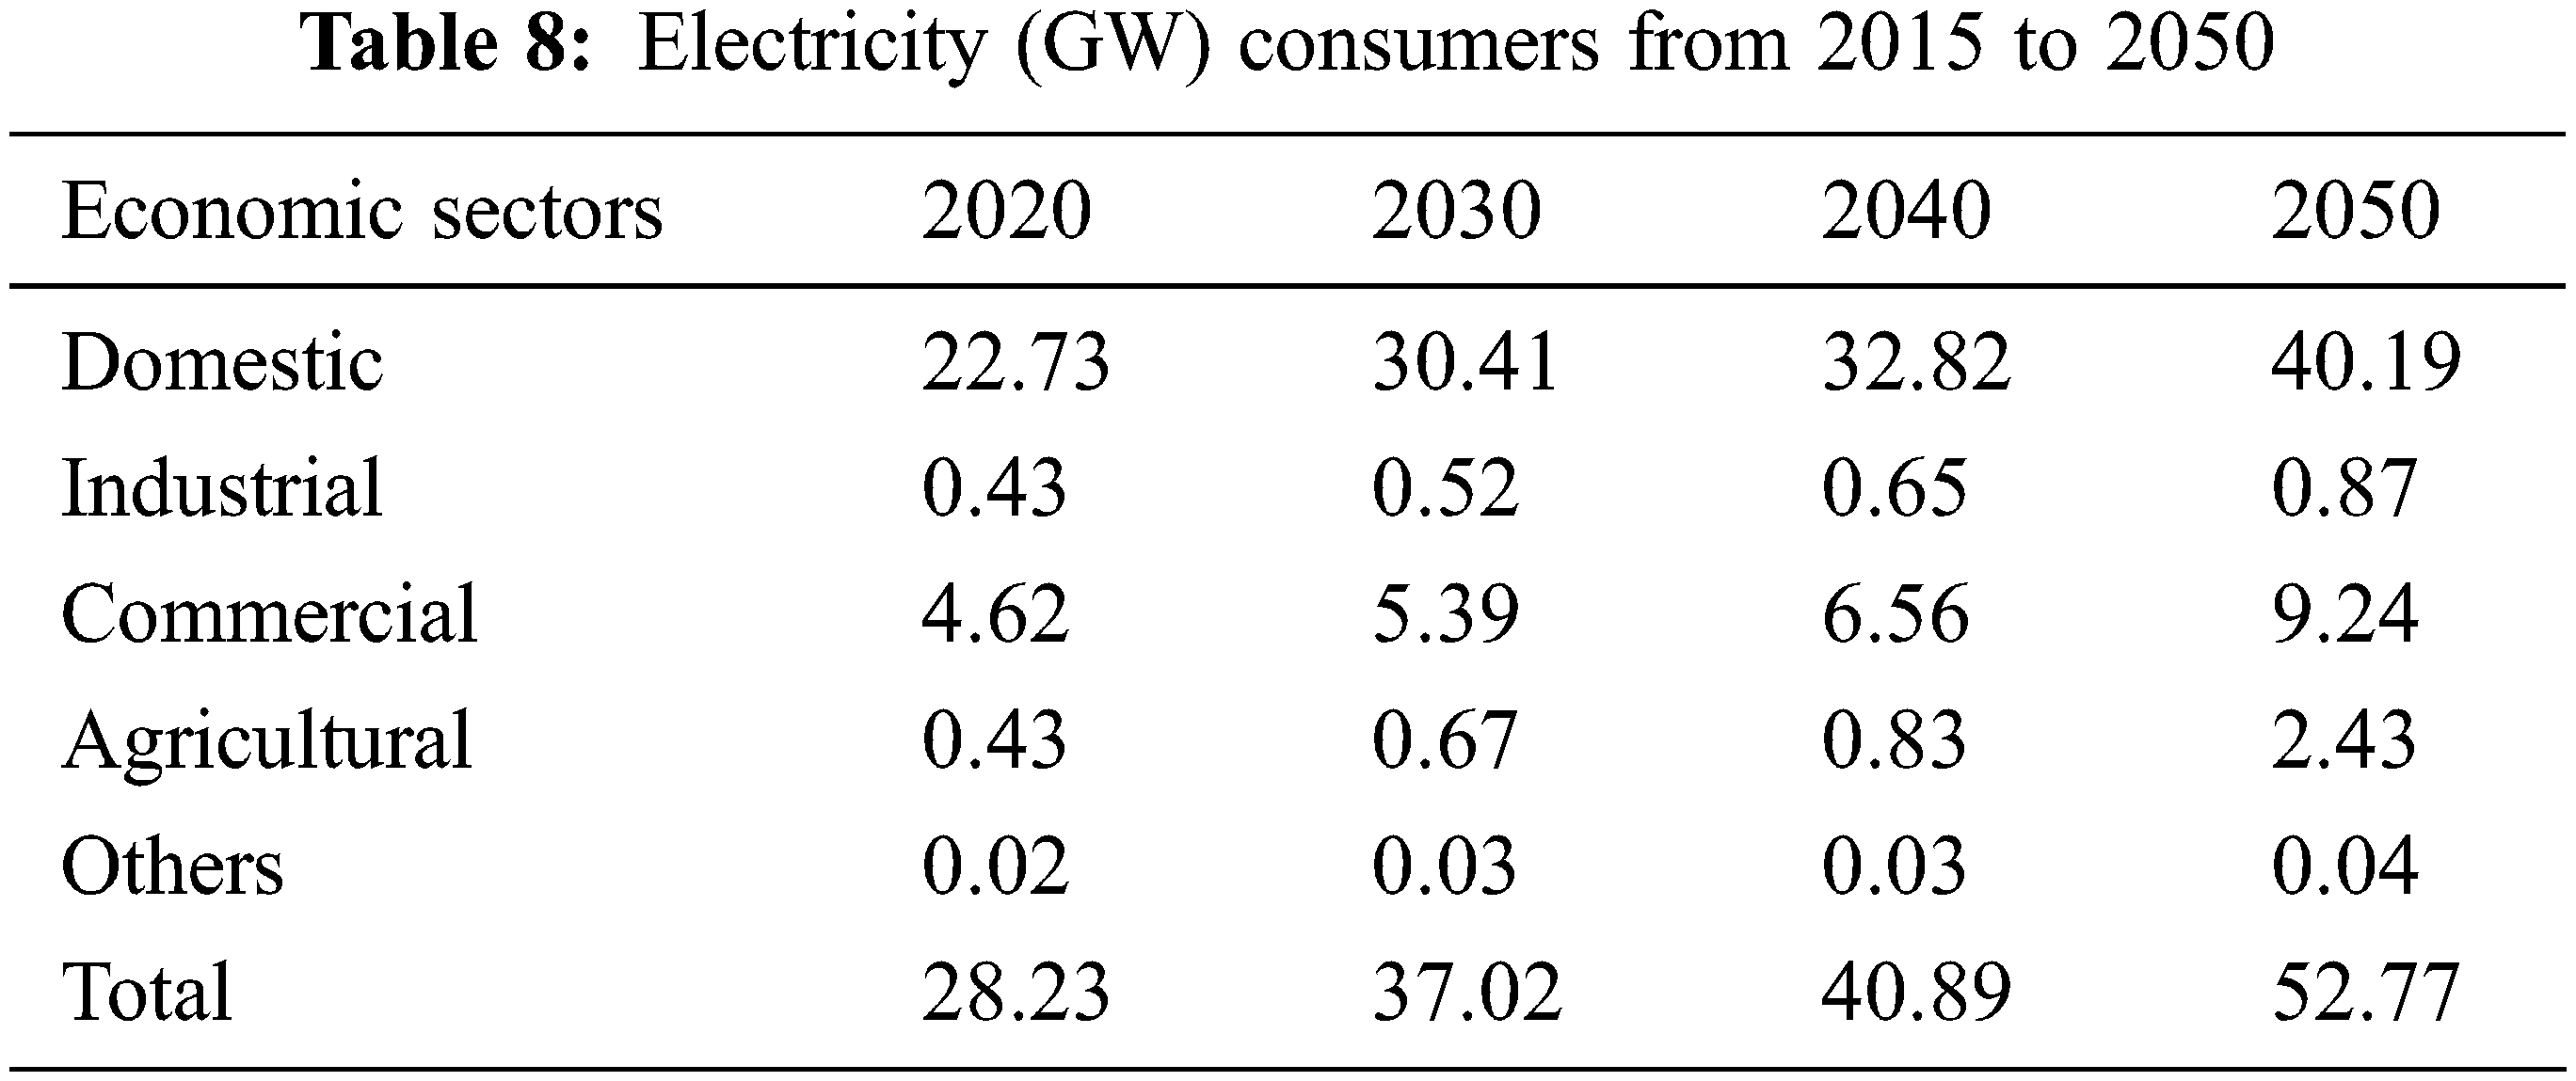
Tab. 6 shows the world’s largest electricity-generating countries in 2050. India is the third rank in the generation of electricity all over the world. Tab. 7 shows the demand for electricity from 2015 to 2050. Tab. 8 shows the pattern of electricity consumers from 2015 to 2050.
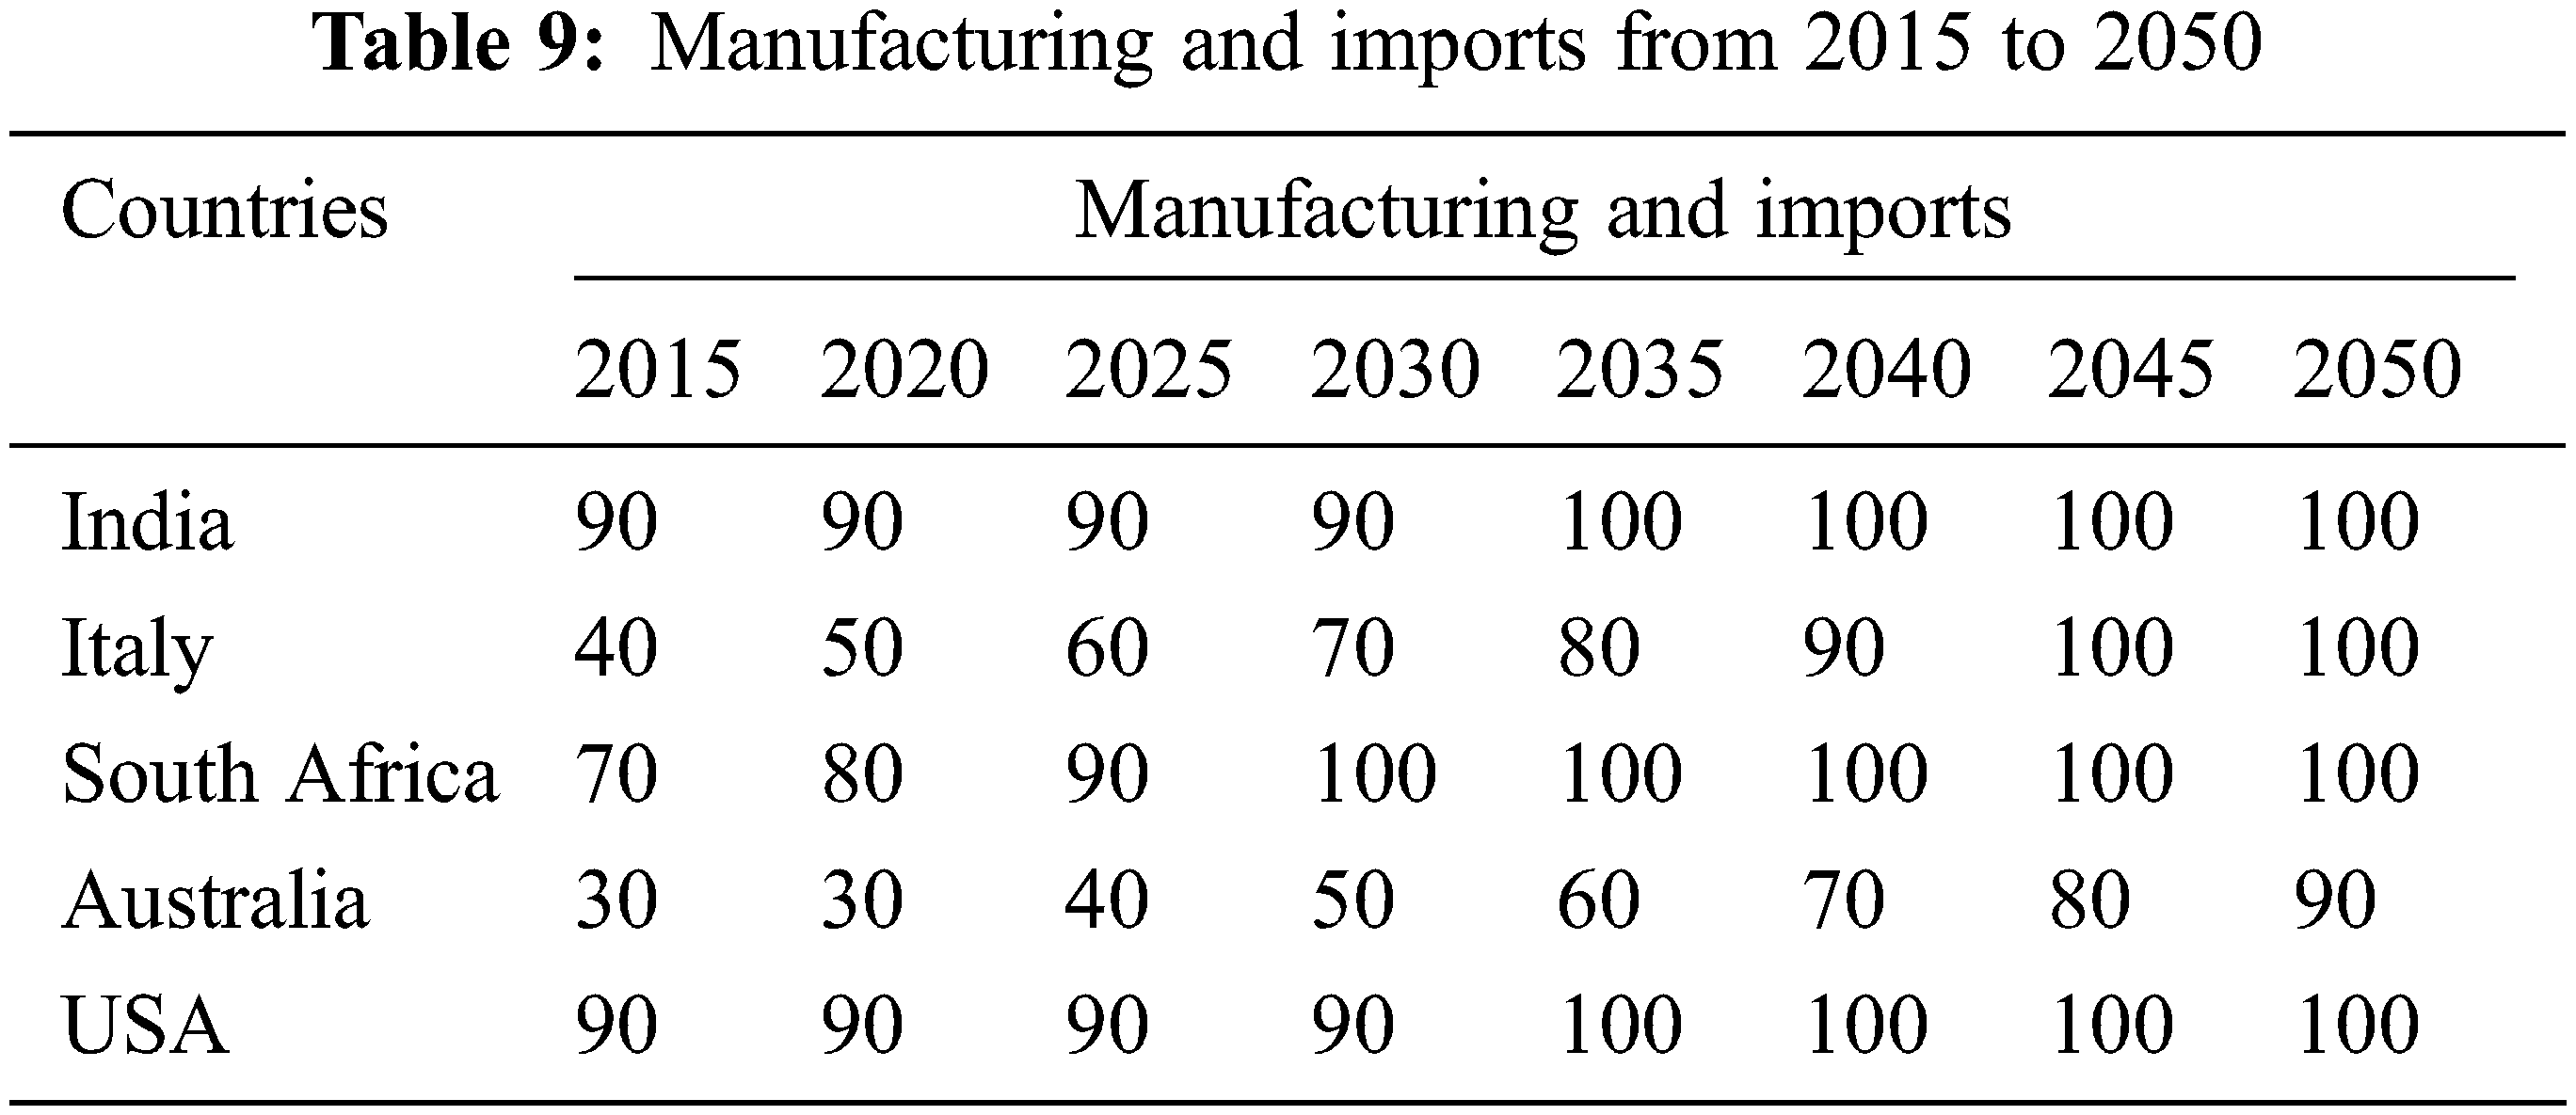
Tab. 9 shows the manufacturing and imports from 2015 to 2050. Tab. 10 shows the computation time using various trials with less computation time of 6880 s. Tab. 11 shows the performance of every country for 50 and 100 trials, the accuracy of 90% has been obtained by using the RERNN-GPC technique.


A hybrid technique is proposed in this paper to find the optimal product mix that meets the demands of the future electricity system in India. This hybrid approach is introduced by integrating RERNN and GPC. RERNN has a selective memory feature while GPC is a meta-heuristic algorithm that deals with several problems. The actual PV-based electricity generation was 0 GWh between the years from 1990 to 2009 whereas the range from 0.09 GWh to 0.6 GWh between the years from 2010 to 2021. However, PV electricity generation is predicted the range from 0.6 GWh to 2 GWh between the years 2021 to 2050 respectively. The predicted energy demand 0 TWh to 1.5 TWh between the years 1990 to 2050 in the countries of Italy, South Africa, and Australia, whereas the demand of 5200 TWh and 9000 TWh in the year 2050 in the countries of the USA and India respectively. With the help of the proposed hybrid technique, the system identified an optimal solution that consumes less computation time. The proposed method was simulated using MATLAB, while the outcomes were compared with their existing techniques to establish the supremacy of the proposed system. The results with regards to future electricity generation, across the globe, are also displayed and discussed. In comparison with existing methods, the proposed hybrid approach achieved the best result of 90% accuracy with less computation time of 6880 s. Future researchers can attempt to implement the proposed model in real-time environments.
Funding Statement: The authors received no specific funding for this study.
Conflicts of Interest: The authors declare that they have no conflicts of interest to report regarding the present study.
References
1. L. Pérez-Lombard, J. Ortiz and C. Pout, “A review on buildings energy consumption information,” Energy and Buildings, vol. 40, no. 3, pp. 394–398, 2008. [Google Scholar]
2. L. Cheng and T. Yu, “A new generation of AI: A review and perspective on machine learning technologies applied to smart energy and electric power systems,” International Journal of Energy Research, vol. 43, no. 6, pp. 1928–1973, 2019. [Google Scholar]
3. J. Chou and N. Ngo, “Time series analytics using sliding window metaheuristic optimization-based machine learning system for identifying building energy consumption patterns,” Applied Energy, vol. 177, pp. 751–770, 2016. [Google Scholar]
4. D. de O. Santos Júnior, J. de Oliveira and P. de Mattos Neto, “An intelligent hybridization of ARIMA with machine learning models for time series forecasting,” Knowledge-Based Systems, vol. 175, pp. 72–86, 2019. [Google Scholar]
5. C. Zhou, L. Ding, Y. Zhou, H. Zhang and M. Skibniewski, “Hybrid support vector machine optimization model for prediction of energy consumption of cutter head drives in shield tunneling,” Journal of Computing in Civil Engineering, vol. 33, no. 3, pp. 4019019,1–17, 2019. [Google Scholar]
6. E. D'Andrea, B. Lazzerini and S. L. del Rosario, Neural network-based forecasting of energy consumption due to electric lighting in office buildings. In: 2012 Sustainable Internet and ICT for Sustainability (SustainIT), IEEE, pp. 1–5, 2012. [Google Scholar]
7. R. Z. Homod, H. Togun, H. J. Abd and K. S. Sahari, “A novel hybrid modeling structure fabricated by using Takagi-Sugeno fuzzy to forecast HVAC systems energy demand in real-time for Basra city,” Sustainable Cities Soc., vol. 56, pp. 102091,1–32, 2020. [Google Scholar]
8. J. J. Guo, J. Y. Wu and R. Z. Wang, “A new approach to energy consumption prediction of domestic heat pump water heater based on grey system theory,” Energy Build, vol. 43, no. 6, pp. 1273–1279, 2011. [Google Scholar]
9. G. Demirezen, A. S. Fung and M. Deprez, “Development and optimization of artificial neural network algorithms for the prediction of building specific local temperature for HVAC control,” International Journal of Energy Research, vol. 44, no. 11, pp. 8513–8531, 2020. [Google Scholar]
10. D. O. Faruk, “A hybrid neural network and ARIMA model for water quality time series prediction,” Engineering Applications of Artificial Intelligence, vol. 23, no. 4, pp. 586–594, 2010. [Google Scholar]
11. G. P. Zhang, “Time series forecasting using a hybrid ARIMA and neural network model,” Neuro Computing, vol. 50, pp. 159–175, 2003. [Google Scholar]
12. H. do Nascimento Camelo, P. S. Lucio, J. B. V. L. Junior and P. C. M. de Carvalho, “A hybrid model based on time series models and neural network for forecasting wind speed in the Brazilian northeast region,” Sustainable Energy Technol Assess, vol. 28, pp. 65–72, 2018. [Google Scholar]
13. S. Panigrahi and H. S. Behera, “A hybrid ETS-ANN model for time series forecasting,” Engineering Applications of Artificial Intelligence, vol. 66, pp. 49–59, 2017. [Google Scholar]
14. P. Laha and B. Chakraborty, “Low carbon electricity system for India in 2030 based on multi-objective multi-criteria assessment,” Renewable and Sustainable Energy Reviews, vol. 135, pp. 1–19, 2021. [Google Scholar]
15. U. Şahin, “Future of renewable energy consumption in France, Germany, Italy, Spain, Turkey and UK by 2030 using optimized fractional nonlinear grey Bernoulli model,” Sustainable Production and Consumption, vol. 25, pp. 1–14, 2021. [Google Scholar]
16. M. Shahid, K. Ullah, K. Imran, I. Mahmood and A. Mahmood, “Electricity supply pathways based on renewable resources: A sustainable energy future for Pakistan,” Journal of Cleaner Production, vol. 263, pp. 1–23, 2020. [Google Scholar]
17. P. Das, P. Mathuria, R. Bhakar, J. Mathur, A. Kanudia et al., “Flexibility requirement for large-scale renewable energy integration in Indian power system: Technology, policy and modeling options,” Energy Strategy Reviews, vol. 29, pp. 1–17, 2020. [Google Scholar]
18. O. Akintande, O. Olubusoye, A. Adenikinju and B. Olanrewaju, “Modeling the determinants of renewable energy consumption: Evidence from the five most populous nations in Africa,” Energy, vol. 206, pp. 117992,1–12, 2020. [Google Scholar]
19. M. Murshed, K. Abbass and S. Rashid, “Modelling renewable energy adoption across south Asian economies: Empirical evidence from Bangladesh, India, Pakistan and Sri Lanka,” International Journal of Finance & Economics, vol. 26, no. 4, pp. 5425–5450, 2021. [Google Scholar]
20. A. Mendonça, G. de Andrade Conradi Barni, M. Moro, A. Bornia, E. Kupek et al., “Hierarchical modeling of the 50 largest economies to verify the impact of GDP, population and renewable energy generation in CO2 emissions,” Sustainable Production and Consumption, vol. 22, pp. 58–67, 2020. [Google Scholar]
21. A. Kondo, “Impact on air quality by increase in air pollutant emissions from thermal power plants,” International Journal of Geomate, vol. 12, no. 32, pp. 50–56, 2017. [Google Scholar]
22. P. Laha and B. Chakraborty, “Low carbon electricity system for India in 2030 based on multi-objective multi-criteria assessment,” Renewable and Sustainable Energy Reviews, vol. 135, pp. 110356,1–19, 2021. [Google Scholar]
23. P. Das, P. Mathuria, R. Bhakar, J. Mathur, A. Kanudia et al., “Flexibility requirement for large-scale renewable energy integration in Indian power system: Technology, policy and modeling options,” Energy Strategy Reviews, vol. 29, pp. 100482,1–17, 2020. [Google Scholar]
24. K. Gyanwali, R. Komiyama and Y. Fujii, “Representing hydropower in the dynamic power sector model and assessing clean energy deployment in the power generation mix of Nepal,” Energy, vol. 202, pp. 117795,1–16, 2020. [Google Scholar]
25. W. T. Cho, C. F. Lai, Y. M. Huang, W. T. Lee and S. M. Huang, “Home energy management system for interconnecting and sensing of electric appliances,” KSII Transactions on Internet and Information Systems (TIIS), vol. 5, no. 7, pp. 1274–1292, 2011. [Google Scholar]
26. S. Balasubramanian and P. Balachandra, “Effectiveness of demand response in achieving supply-demand matching in a renewables dominated electricity system: A modelling approach,” Renewable and Sustainable Energy Reviews, vol. 147, pp. 111245,1–17, 2021. [Google Scholar]
27. T. Gao, X. Gong, K. Zhang, F. Lin, J. Wang et al., “A recalling-enhanced recurrent neural network: Conjugate gradient learning algorithm and its convergence analysis,” Information Sciences, vol. 519, pp. 273–288, 2020. [Google Scholar]
28. S. Harifi, J. Mohammadzadeh, M. Khalilian and S. Ebrahimnejad, “Giza pyramids construction: An ancient-inspired metaheuristic algorithm for optimization,” Evolutionary Intelligence, vol. 14, no. 4, pp. 1743–1761, 2021. [Google Scholar]
Cite This Article
 Copyright © 2023 The Author(s). Published by Tech Science Press.
This work is licensed under a Creative Commons Attribution 4.0 International License , which permits unrestricted use, distribution, and reproduction in any medium, provided the original work is properly cited.
 Downloads
 Citation Tools