
 Submit a Paper
 Propose a Special lssue
 Open Access
ARTICLE
Grey Wolf Optimizer Based Deep Learning for Pancreatic Nodule Detection
1 Department of ECE, Universal College of Engineering and Technology, 627117, Tamil Nadu, India
2 Department of ECE, CSI Institute of Technology, Thovalai, 629302, Tamil Nadu, India
* Corresponding Author: T. Thanya. Email:
Intelligent Automation & Soft Computing 2023, 36(1), 97-112. https://doi.org/10.32604/iasc.2023.029675
Received 09 March 2022; Accepted 09 May 2022; Issue published 29 September 2022
 View Full Text
 Download PDF
Abstract
At an early point, the diagnosis of pancreatic cancer is mediocre, since the radiologist is skill deficient. Serious threats have been posed due to the above reasons, hence became mandatory for the need of skilled technicians. However, it also became a time-consuming process. Hence the need for automated diagnosis became mandatory. In order to identify the tumor accurately, this research proposes a novel Convolution Neural Network (CNN) based superior image classification technique. The proposed deep learning classification strategy has a precision of 97.7%, allowing for more effective usage of the automatically executed feature extraction technique to diagnose cancer cells. Comparative analysis with CNN-Grey Wolf Optimization (GWO) is carried based on varied testing and training outcomes. The suggested study is carried out at a rate of 90%–10%, 80%–20%, and 70%–30%, indicating the robustness of the proposed research work. Outcomes show that the suggested method is effective. GWO-CNN is reliable and accurate relative to other detection methods available in the literatures.Keywords
Pancreatic cancer is the most common type which has a terrible prognosis and is generally fatal [1]. Pancreatic tumor diagnosis necessitates immediate treatment and a specific surgical approach. The probability of mortality rises if therapy is delayed; hence an accurate identification of pancreatic tumor is essential. The combination of Computer-Aided Diagnosis (CAD) and Artificial Intelligence (AI) helps to improve image interpretation accuracy and also make diagnostic knowledge more widely available [2]. As the process appears to be difficult, CAD approaches are not widely used in an early stage. The target varies greatly in size, structure, and position. Furthermore, it only takes up a minor percentage of the total Computed Tomography (CT) image.
Currently, effective early diagnosis relies on medical imaging techniques [3]. CT is the most often utilized imaging modality for the early examination of suspected pancreatic cancer, compared to Magnetic Resonance Imaging (MRI), ultrasonography, positron emission tomography, and endoscopic ultrasonography. Images from CT scans are used to assess people at higher risk of getting pancreatic cancer.
(Chang et al.) [4] had suggested a deep learning employing paired histology and immunofluorescence images for image classification in 2017, with a classification accuracy of 91.3%. (Jose et al.) [5] uses U-Net pancreatic lesion using Retina Net which produces the sensitivity of 83.86%. The optimization of pancreatic classification parameters has accuracy of 82.64% [6].
(Pahari et al.) [7], suggested a segmentation approach for pancreatic tumor. In 2015, (Reddy et al.) [8] developed the wavelet transformation technique with improvised classification and segmentation accuracy of 75.2% and 79.2% respectively. In 2013, (Yoshihara et al.) [9] mainly divided the process for tumor detection into two primary categories as benign or malignant.
In 2014, Samala et al. [10] proposed the clustered method of micro classification that often allows topological description. At the time of segmentation [11], the accuracy is 79.84% and categorization is 80.13 percent. It becomes worse when the cell intersects with certain group. FP reduction scheme based on (Jeong et al.) [12] for the identification of MCCs in recreated volumes of DBTs. The usable energy spectrum was created with an intersection that imposes a penalty on the pairwise range of contours. In 2014, (Zhou et al.) proposed a method [13] that necessitates spatial beginning which defines the initial position range.
The majority of the previous related work has been using the MATLAB toolbox to deal with (Elshinawy) 2010 image format algorithm [14]. These methods are focused on tissue type, with 91.7% segmentation accuracy and 92.14% classification accuracy (Jones et al.) [15] utilized a trained CNN, which has 92.15% precision at the classification level and 92.61% segmentation. In 2014, (Woods et al) introduced a pattern approach using a decentralized watershed segmentation multiagent scheme with an accuracy of 84.3% and a classification precision of 91.17% [16]. Hybrid modeling was suggested by (Joseph et al.) in 2015 [17]. In 2016, (Ahmad) [18] suggested the importance of the Static Time series for segmentation. (Zhou et al.) discovered the post-enrichment of cancer cells in 2015 [19] and (Weiss et al.) and colleagues built the method with two quantitative study in the breast MRI technique in 2015 [20]. Therefore, with frequent physicians’ repeated work, it is vital to create a framework that both assists and ameliorates suffering.
Hence, it can be seen that due to increasing medical needs, CAD systems became a new research focus. Deep learning has had a few early breakthroughs in assessing radiology images. Machine learning based classifiers have been employed for pulmonary nodule [21] and other diagnoses. Because pancreatic cancer has a high morbidity, efforts should be undertaken to build CAD systems that can distinguish pancreatic tumors [22,23] from normal tissue. As a result, the research is needed to build an advanced pancreatic cancer classification [24] approach.
The research’s main goal is to use a novel GWO-CNN classifier [25–27] to automatically detect pancreatic tumor in CT images, and the contributions are as follows:
i) The suggested region-based segmentation approach allows a block to be automatically split into sub-regions with specific textures or color patches without knowing the number of regions, whereas the present segmentation method concentrates on texture as stated in [28].
ii) In comparison to other segmentation techniques, region-based segmentation is more accurate, as demonstrated in [29].
iii) Novel GWO-CNN [30] based classification is used to identify the tumor as benign or malignant, which results in better accuracy by minimizing false positives, while most of the current techniques have a high false positive rate.
iv) In order to demonstrate the effectiveness of the suggested strategy, an in-depth comparative study of multiple performance [31] indicators is provided in the case of classification.
v) Robustness of the proposed classifier is proved with different training testing ratios.
This paper is organized as follows: The image acquisition technique specifies how the image is gathered from the biomedical center’s scanners. Where the resizing takes place along with the color conversion, the preprocessing stage is carried out, accompanied by the histogram equalization and modified segmentation accompanied by K-means clustering and region growing is given. With the methodology of Histogram of Oriented Gradients (HOG) based feature extraction and GWO-CNN, the final step of classification is carried out and detailed in Section 2. Performance measures are provided in Section 3, Section 4 explains the results analysis, and Section 5 provides the conclusion.
2 Proposed GWO-CNN Classification Model
The proposed CAD system generally consists of several steps: (1) preprocessing, (2) segmentation of images, (3) extraction of features and (4) classification as in Fig. 1. The input image is subjected to preprocessing techniques with color-based conversion and histogram equalization of image samples. From this output the modified segmentation is carried out which provides high accuracy results. Based on extracted features proper classifications are made depending on the effectiveness of tumor region affected at pancreatic cells.

Figure 1: GWO-CNN based pancreatic tumor classification
2.1 Data Collection and Preparation
A 256-channel multidetector CT scanner is used to perform multiphasic CT (Siemens). The high contrast CT images of 200 gastric cancer patients at a cancer centre are manually annotated as well as separated into two groups: training and validation (125 pancreatic cancer patients) and testing (125 gastric cancer patients) (75 patients with pancreatic cancer). TCIA Pancreatic CT, an open-source dataset with 50 tumour images, is also recorded. After preprocessing, GWO-CNN is trained to identify images as benign or malignant.
The Histogram Equalization (HE) methodology is being used to enhance the contrast of input CT scan images during pre-processing. Because of the brightness intensity, the texture is spatial. Such textural elements contribute determine the perceived value of an image’s region. It basically defines visual regions based on the constrained input observed. The images are read first, then converted to a colour space model (HSV). A color-based histogram equalisation method that has been modified is used to remove the noise. Input example images can be seen in Fig. 2.

Figure 2: Input sample images
Steps involved in preprocessing:
• High pass filter
• Filter mask
• Image enhancement
• Histogram equalization
High pass filter (HPF): After transforming an image into a colour image, an image is given as input to HPF. Various sharpening methods rely on the employment of a high pass filter. The image will sharpen as the contrast between nearby sections is increased. In the high pass filter, the frequency is reduced. HPF is used to boost the brightness of the centre pixel kernel.
Filter mask: To boost the quality of the image, the filter mask technique is used. The image is filtered to highlight certain features by the removal of other irrelevant features. The images on the edges are made transparent and the elements are sharpened
Image Enhancement: The image quality is improved by adding the median filter. The intensity of the pixel distribution was measured and studied by plotting the histogram.
Histogram Equalization: Equalization of histogram is an approach that employs the image’s histogram to control difference modification as well as increase contrast in images.

All of the following preprocessing procedures were used with the purpose of raising contrast of the CT scan image. Furthermore, all of the strategies have been shown to be superior in most of the literatures, and so therefore were used in the study.
2.3 Proposed Region Based Segmentation
In PC Vision, segmentation of images is a mechanism where the digital image is divided into multiple segments.
Modified Region based Segmentation: A method for partitioning an image focused on a specific area is called region based segmentation. It’s also known as a pixel-based image split technique. It divides the image into several localities based on predefined standards. Modified Region based segmentation combines two steps of Modified Color based K-means clustering, which involves grouping image pixels with similar Color pixel values. Depending on nonlinear cluster modules, this results in different Cluster values or stages according on the input image. The following phase involves increasing the region from the seed pixel up to a definite threshold value that is set as the global value. This is completely reliant on the region of interest, as this is the image’s foreground object.
The first step to obtain the (Region of Interest) ROI is to calculate a threshold value for the tumor region. Though the similarity between the pixels is considered, it is absolutely necessary to consider the object similarity with image gradient. It helps to anticipate the patterns at definite values called as mathematical patterns to describe the image representation. This creates accuracy to be increased. After some trials, the threshold for all the images was set at 76, regardless of the tumor size. Once region growing process is completed, the region merging process begin. Region-growing algorithm is a simple technique capable of effectively separating the pixels in an image with similar properties. Region growing segmentation scheme can be described using the properties as shown in Eq. (5)
where
The regions
Any logical predicate P specified over two neighbouring areas is false. In terms of similarity, a connected zone is predicted. The region where the objects are segmented based on related pixel groups called edges is known as the boundary. The boundary allows the items in an image to be separated. This technique takes the input image as well as provides a set of seed pixels that point to the objects to be segmented. is a measure of association that is defined as the difference between the average of pixels.

Initialization of Seed Pixels: Seeded Region Growing (SRG) segmented regions have high textural similarity that do not contain fragments. The concern with seed-point initialization is that distinct sets of initial seed points would have to be substantially similar to their nearby pixels. At least one seed pixel should be generated for each predicted region in the image. There should be no link between the seeds of different places. Seed selection is done in this work depending on the frequency of occurrence as well as merging. The image’s colour levels are first computed and sorted in ascending order. The frequency of each colour level’s occurrence is then computed. The first pixel is then given as the first seed point, and even the pixels are finally combined to obtain the best seed.
Initialization of Threshold: First, search the maximum intensity
The new threshold is given by,
2.4 HOG Based Feature Extraction
In HOG feature extraction, as the image point is first recognized using the Harris detectors. HOG features split the image pixels into small pixel which depends on pixel numbers by the user [25]. These are indicated with the orientations which are unsigned which depends on gradient direction and weighted magnitude. These feature vectors from such trained image is labeled as positive as well as negative and appended to the proposed classifier system.
where,
Next features are extracted by color moment technique. The main advantages of using such an HOG feature are defined as the localized gradient histogram is described based on the HOG description values. It provides specific gradient orientation in localized part of image features. It provides faster detection to point specific object in image.
where the value of the
2.5 Proposed GWO Based CNN Classifier
The Grey Wolf Optimizer (GWO) algorithm optimizes the smart algorithm by simulating the social structure of the grey wolf population and group hunting activity by tracking, encircling, killing, assaulting, and other actions. Simple theory, few adjustable parameters, straightforward to execute, and robust global search functionality are all benefits. On comparison with other optimization algorithm the GWO-CNN provides the fittest solution in searching of the feature vectors in encircling the prey. This optimization method is chosen as it performs faster when compared with other existing algorithms. It uses fixed number of iterations called search agents which operates on average intra and inter cluster spacing values. The final prey’s location is the globally optimal solution for the problem of optimization algorithm deals the distance value is shown in Eq. (18)
where X (t p) represents the location of the prey.
The position of the grey wolf person at the time of the t-th generation is represented by X(t). The swing factor is shown in the Eq. (21) by Constant C.
where, r1 is a random number from 0 to 1. The position updating formula of grey wolf is shown in the Eq. (20)
where, A is the convergence factor is shown in the Eq. (21)
To predict the gray wolf’s hunting behavior, assume that the location of the prey is best known by α wolf, β wolf, and ÿ wolf, so that the gray wolf population can use the position of the three to determine the location of the prey. When the wolves are told of the location of the prey, the leader wolf orders β and δ to hunt. The gray wolf population needs to change its position according to the α, β and δ wolf location data shown in the equation.

The proposed algorithm training technique is discussed as follows:
Step 1: Assign B as input image.
Step 2: Calculate the feature extraction of the different image
Where I
Step 3: After calculating the features, the distance features such as color, texture and shape is determined. Distance calculation equation can be given below:
Step 4: For
For each result k // for each parameter set, (
For each
Loop
calculate the fitness for (
save parameters G best and P best which have the maximum fitness during each epoch.
Loop
save G best in (
Loop
Step 5: Output (
The ‘Image Retrieval Algorithm’ is used to retrieve the pictures from the source picture. The extraction and output can be calculated by adjusting the parameters and determining the extraction and output.
Step 1: If
Step 2: Configure the values with
Step 3: For a query image
Step 4: For each
Step 5: For each
For each
Calculate the parallels
Step 6: Sort the likenesses
Step 7: Output several most similar images in an ascending fashion.
Algorithm 2 is determined as follows
Step 1: Input B.
Step 2: For each subset
For each image
Compute three kinds of features,
where i = 1, 2,….,
Step 3: For each subset
For each picture
Step 4: For each
set (1/3,1/3,1/3) to (
For each
call Image Retrieval (
Loop
compute the fitness for
save parameters.
Loop
save best in
Loop
Step 5: Output Φ0,
where
The modules are segmented into positive or negative. The benign pixels are represented as 224*224, 112*112, 56*56,28*28 and include 32,16,8,4 layers respectively. These representations detect a positive lung nodule with a neural frame work structure in Fig. 3. The malignant pixels are representation as 7*7, 14*14, and include 1280,112 layers respectively. These representations detect a negative lung nodule with a neural frame work structure. Finally, the classification of nodule detection as malignant and benign is the final step. Convolutional Neural Network (CNN) are cutting-edge image recognition technique. The CNN are optimized using GWO in this study to improve classification task in terms of accuracy, precision, and sensitivity.

Figure 3: Topology of proposed CNN for pancreatic tumor detection
An image area is classified as positive or negative depending on the type of data. Furthermore, an evaluation regarding the identified outcome can be valid (true) or erroneous (false). The right solution is the ambiguity diagonal matrix. The performance measures used in the study are listed below.
Accuracy: Accuracy is the classifier’s indicator of having a correct prediction. This gives all of the classifier’s output capability.
Receiver Operating Characteristic (ROC): A well-known method of task identification evaluation is ROC analysis. In medical decision-making, ROC analysis was used. The ROC curve is an operating point graph that, can be used as a true positive rate map.
Area under the ROC curve (AUC): Based on the average of any point on ROC, AUC is used in the medical diagnostic method and offers methodology for testing models. For a classifier output, the AUC score should lies in the range of ‘0’ and ‘1’. A better classifier performance decides based on higher AUC rating.
Precision: The proportion of precisely predicted positive observations to the total number of forecasted positive observations is known as precision. The term low FPR refers to elevated accuracy.
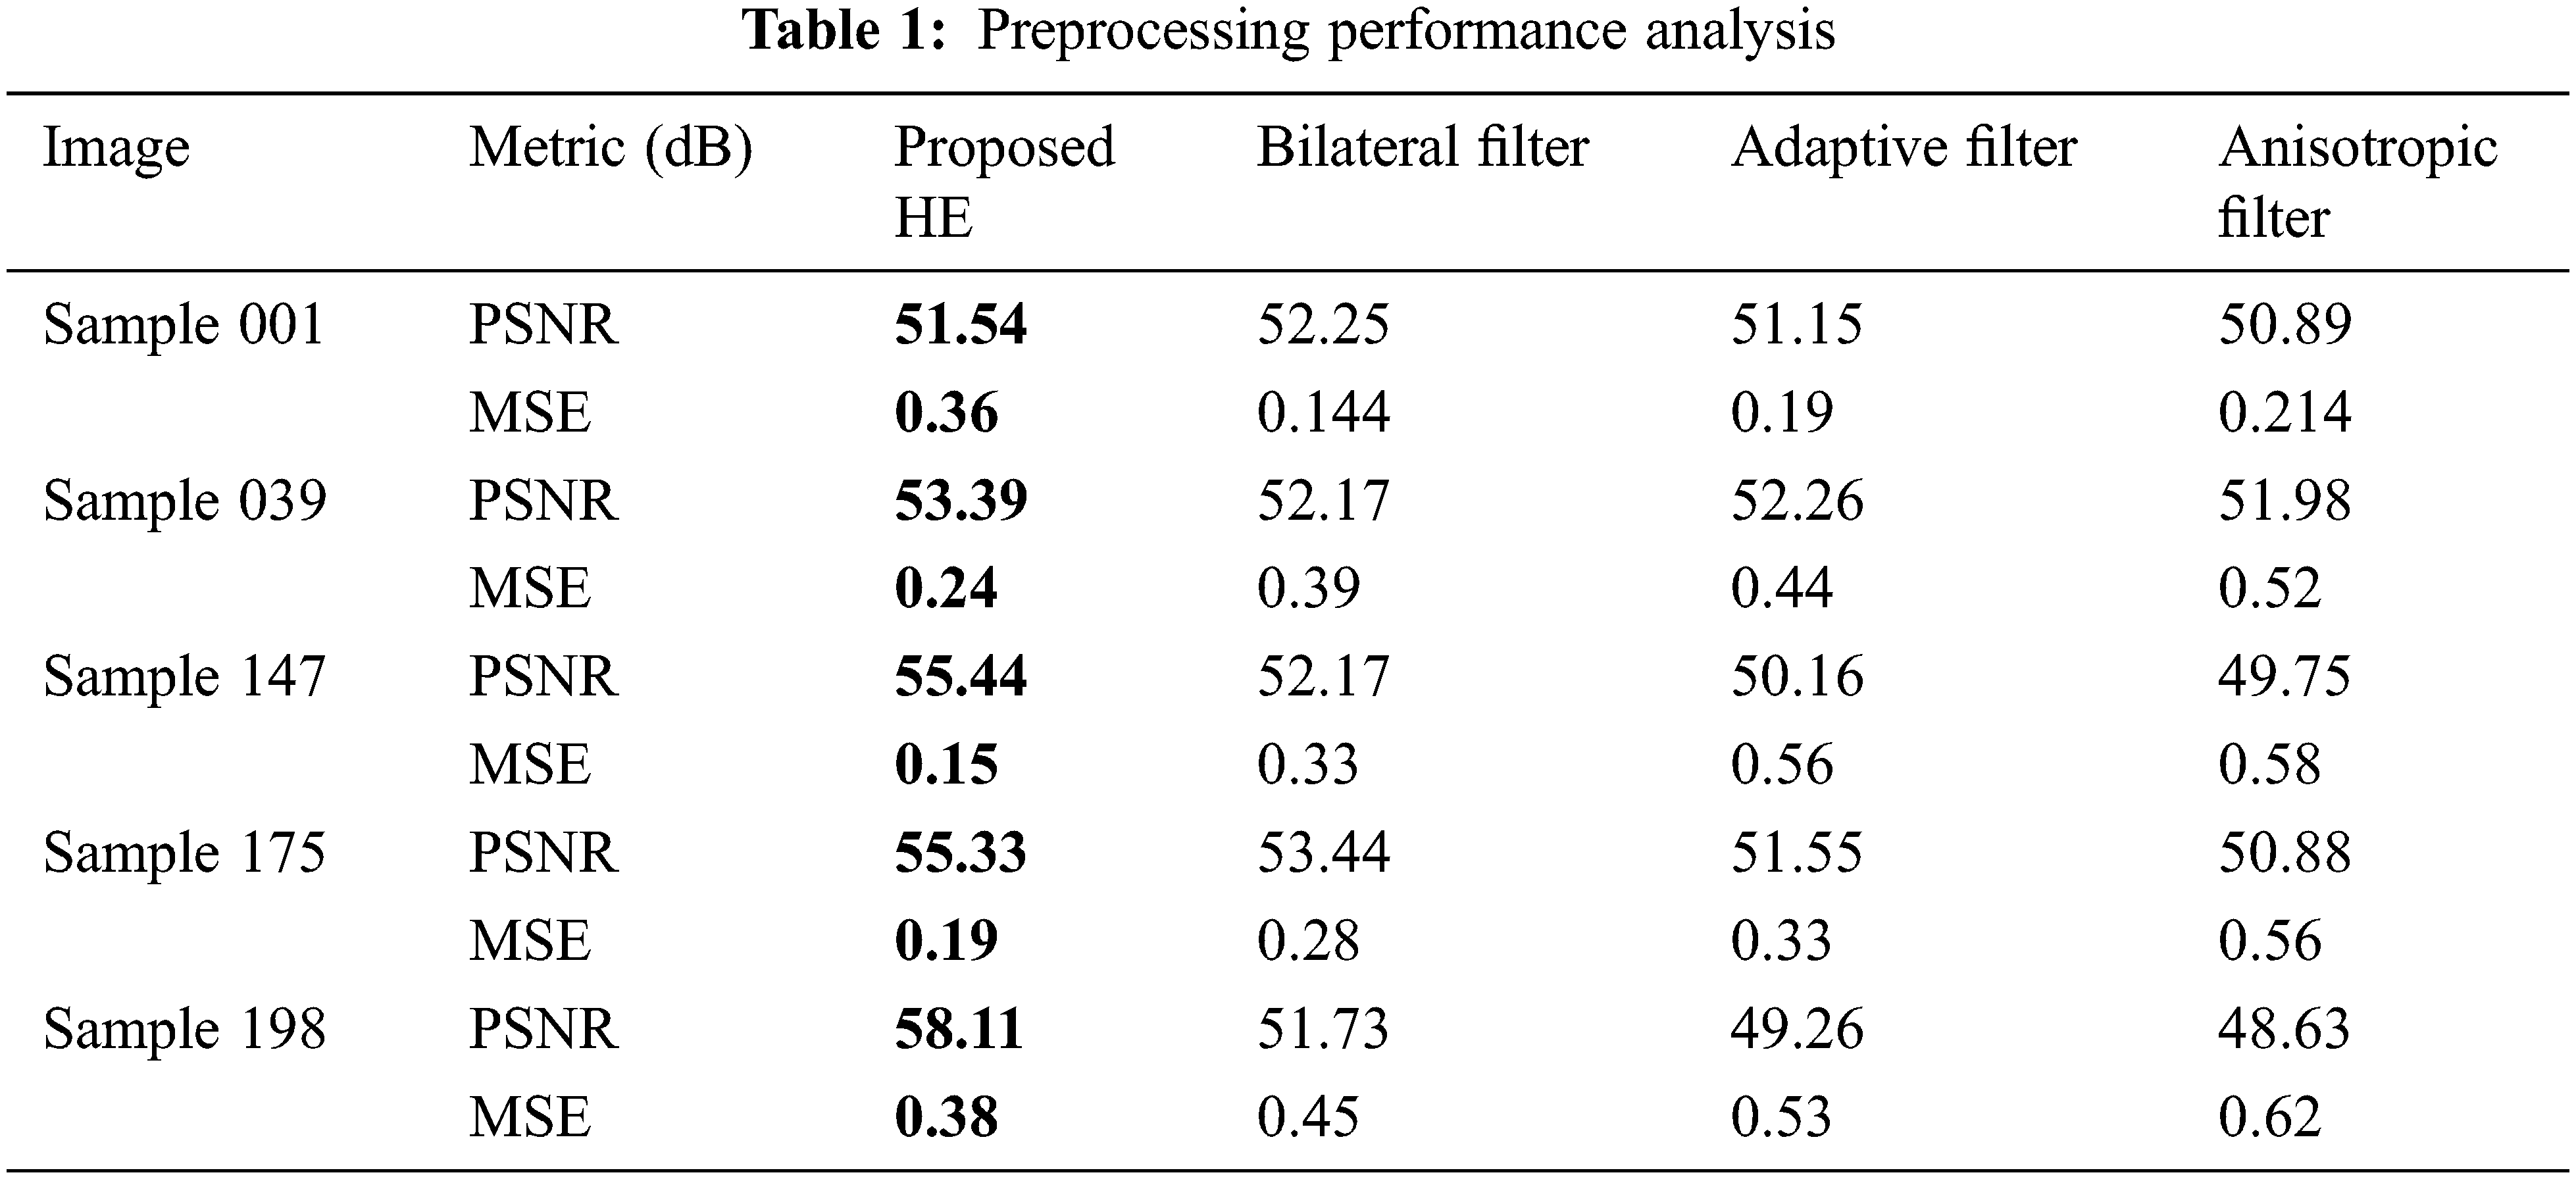
For preprocessing, the performance measures considered are MSE and PSNR.
MSE and PSNR
The Mean Squares Error can be calculated by Eq. (42)
where
4 Experimental Results and Discussions
The suggested method is carried out on PC with 8 GB RAM, an Intel i7 processor, and an Nvidia GeForce 11 GB GPU. The backpropagation neural algorithm is used to train the CNN network, while the GWO method is used to optimize it. For a mini-batch, the optimal learning rate is discovered to be 0.002. In this section, the findings and debates about the study are discussed in depth. Fig. 4 indicates the results obtained by preprocessing and segmentation. Figs. 4a1 and 4a2 indicates the input CT image. Figs. 4b1 and 4b2 indicates the pre-processed image and Figs. 4c1 and 4c2 depicts the proposed modified region growing segmented image.

Figure 4: Experimental result of (a) input image 040 and 129 (b) preprocessed and (c) segmented pancreatic nodule
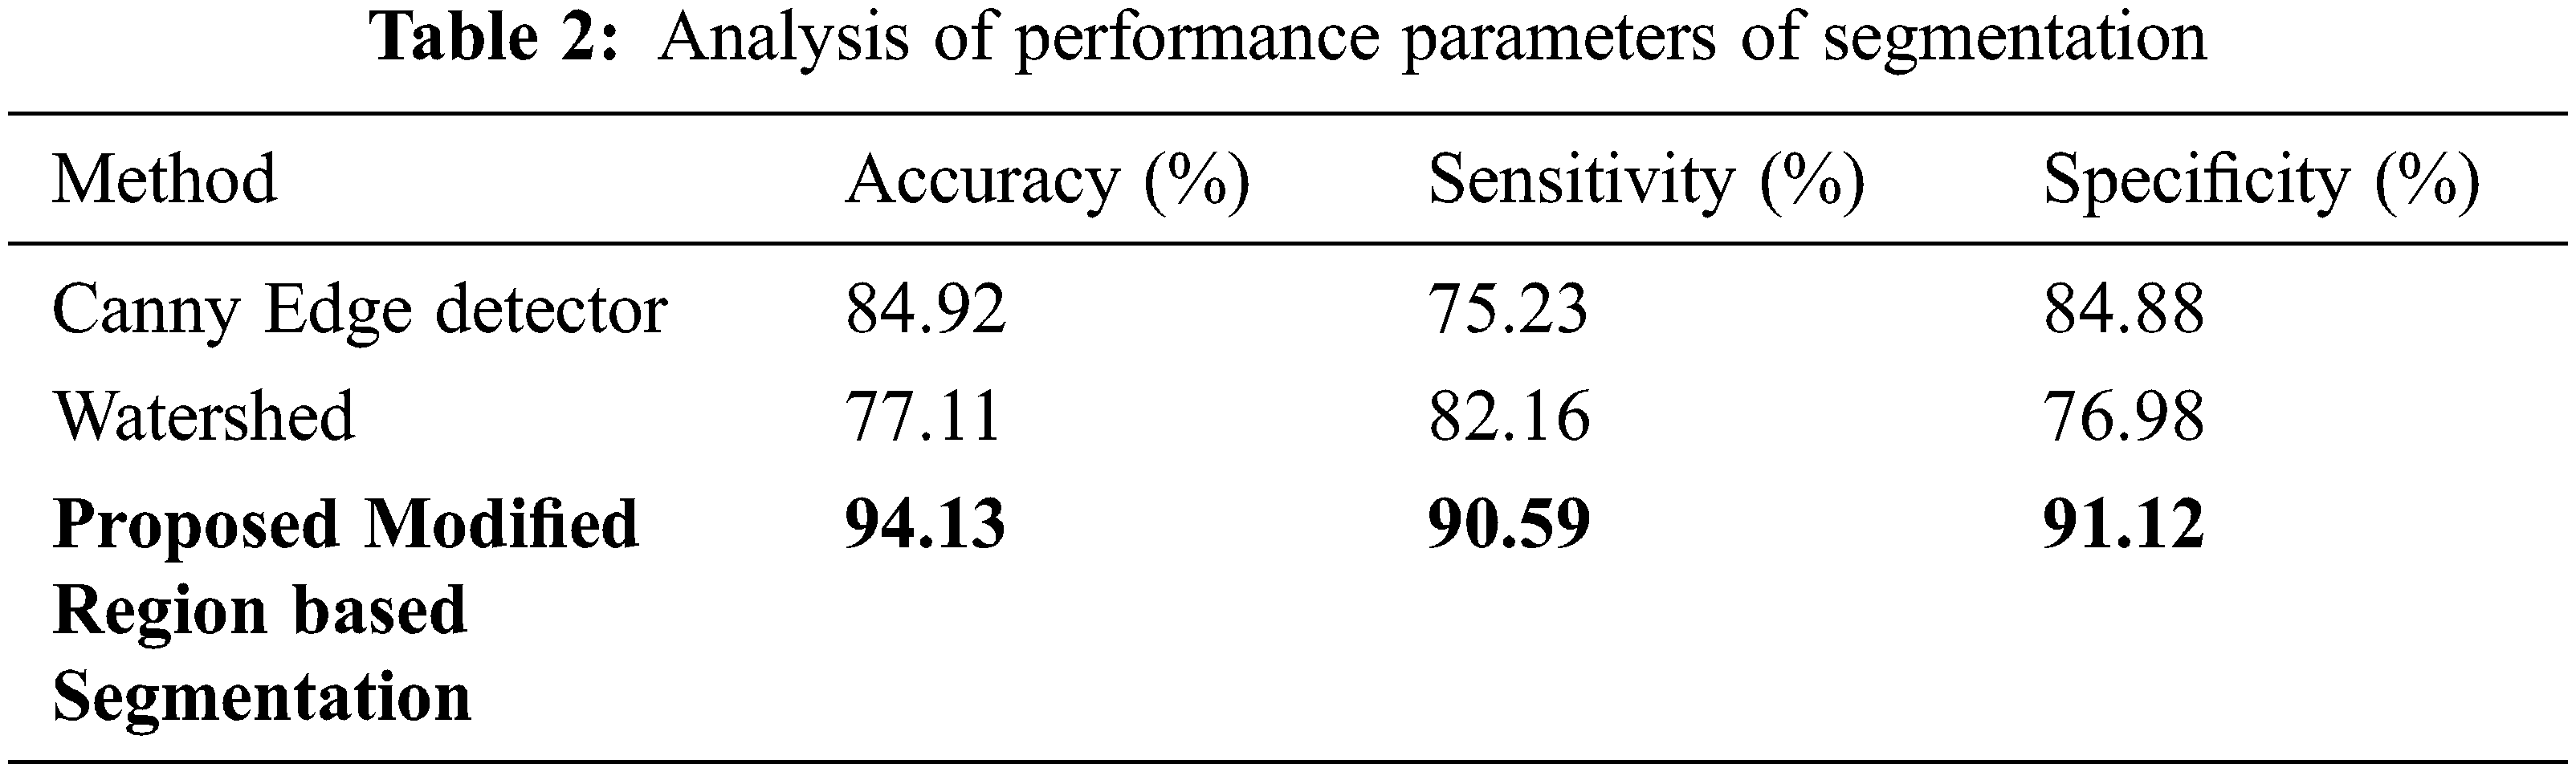
Tab. 1 shows the performance metrics obtained by HE preprocessing technique with that of other techniques. It is evident that HE performs better than other preprocessing algorithms in terms of PSNR and MSE. Tab. 2 shows the results of proposed region-based segmentation with that of existing Canny edge detection and Watershed Segmentation algorithms. Accuracy is an important parameter of a segmentation algorithm. Watershed algorithm has the lowest segmentation accuracy of 77.11% and highest segmentation accuracy of 94.13% is obtained for region growing detector. The accuracy of the canny edge detector is 84.92%.
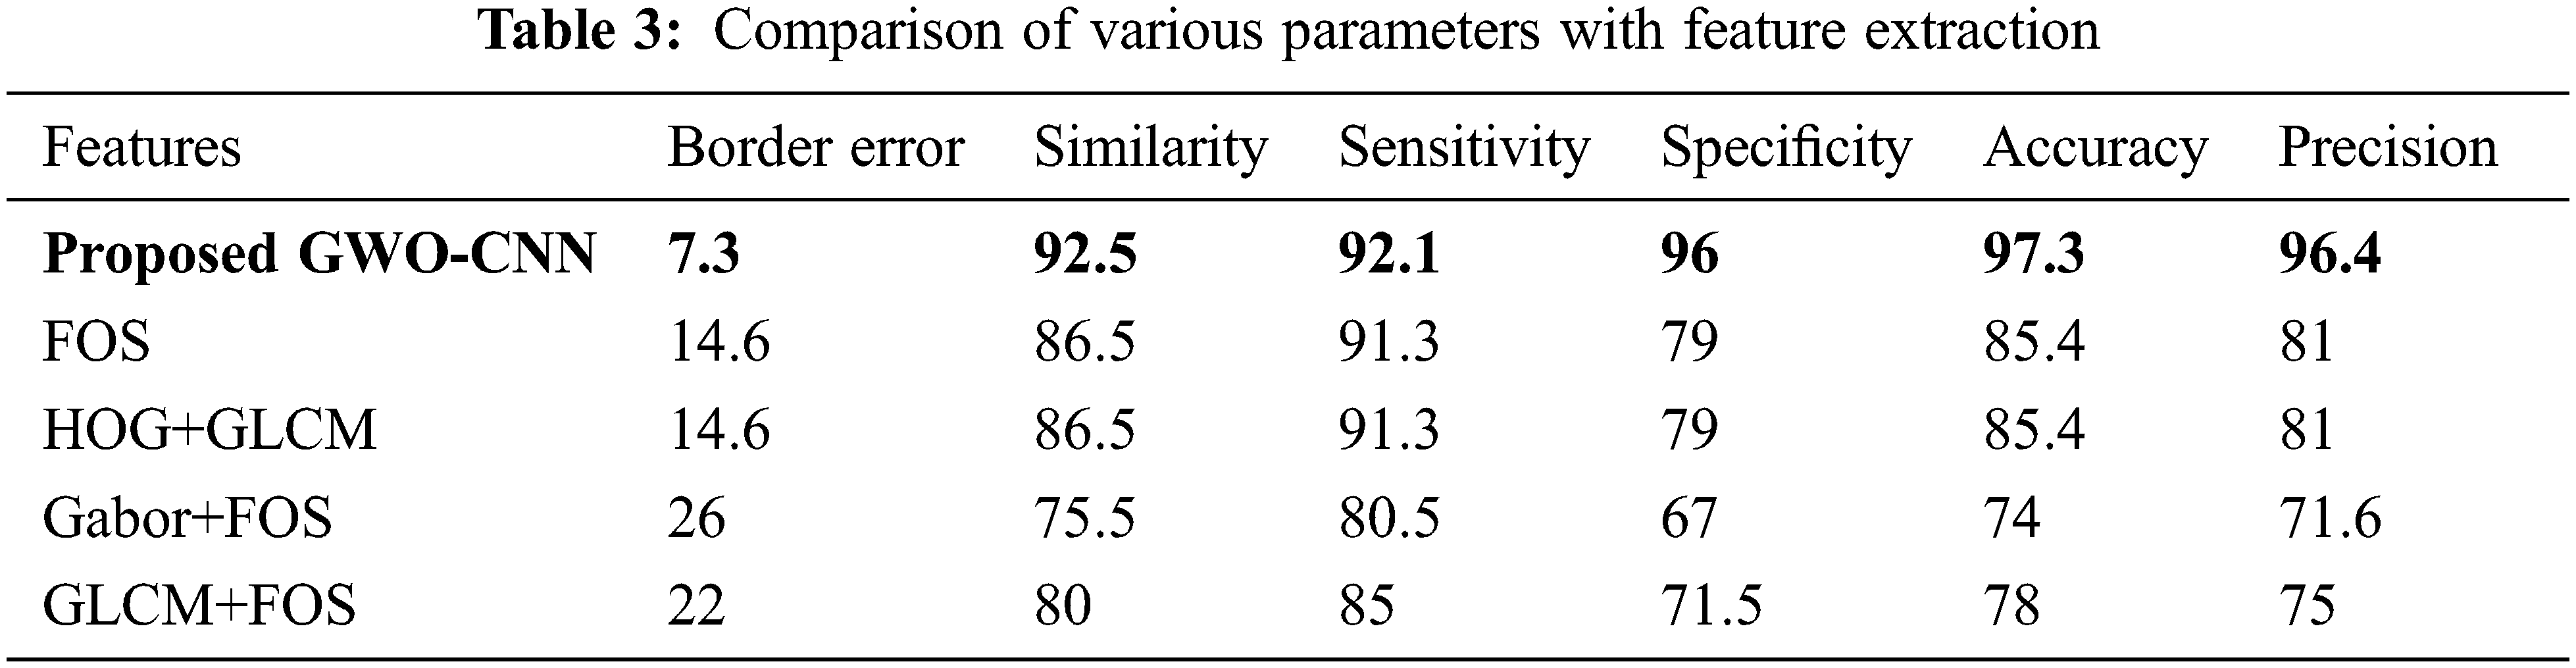
Tab. 3 shows the standard metric values of different characteristics. Border error denotes how many representations of the pancreatic nodule are incorrectly portrayed. Proposed GWO-CNN gives 97.3% higher accuracy. FOS and HOG + Gray-Level Co-Occurrence Matrix (GLCM) provide 85.4% accuracy. Gabor + FOS and GLCM + FOS gives the worst accuracy.
Tab. 4 shows the confusion matrix results obtained with the proposed GWO-CNN Classifier. From the results, it is seen that out of 50 benign images used in testing, GWO-CNN classifier has accurately classified 49 images as benign and 1 image as malignant pancreatic tumor. Moreover, of 25 malignant images used in testing, GWO-CNN classifier has accurately classified 24 images as malignant and 1 image as benign yielding 97.7% accuracy. Accuracy obtained is higher compared to other existing classifiers. This is illustrated in Tab. 5. Error obtained for various classifiers is given and it can be seen that error of 2.7% is obtained with proposed GWO-CNN classifier which is less compared to other techniques.
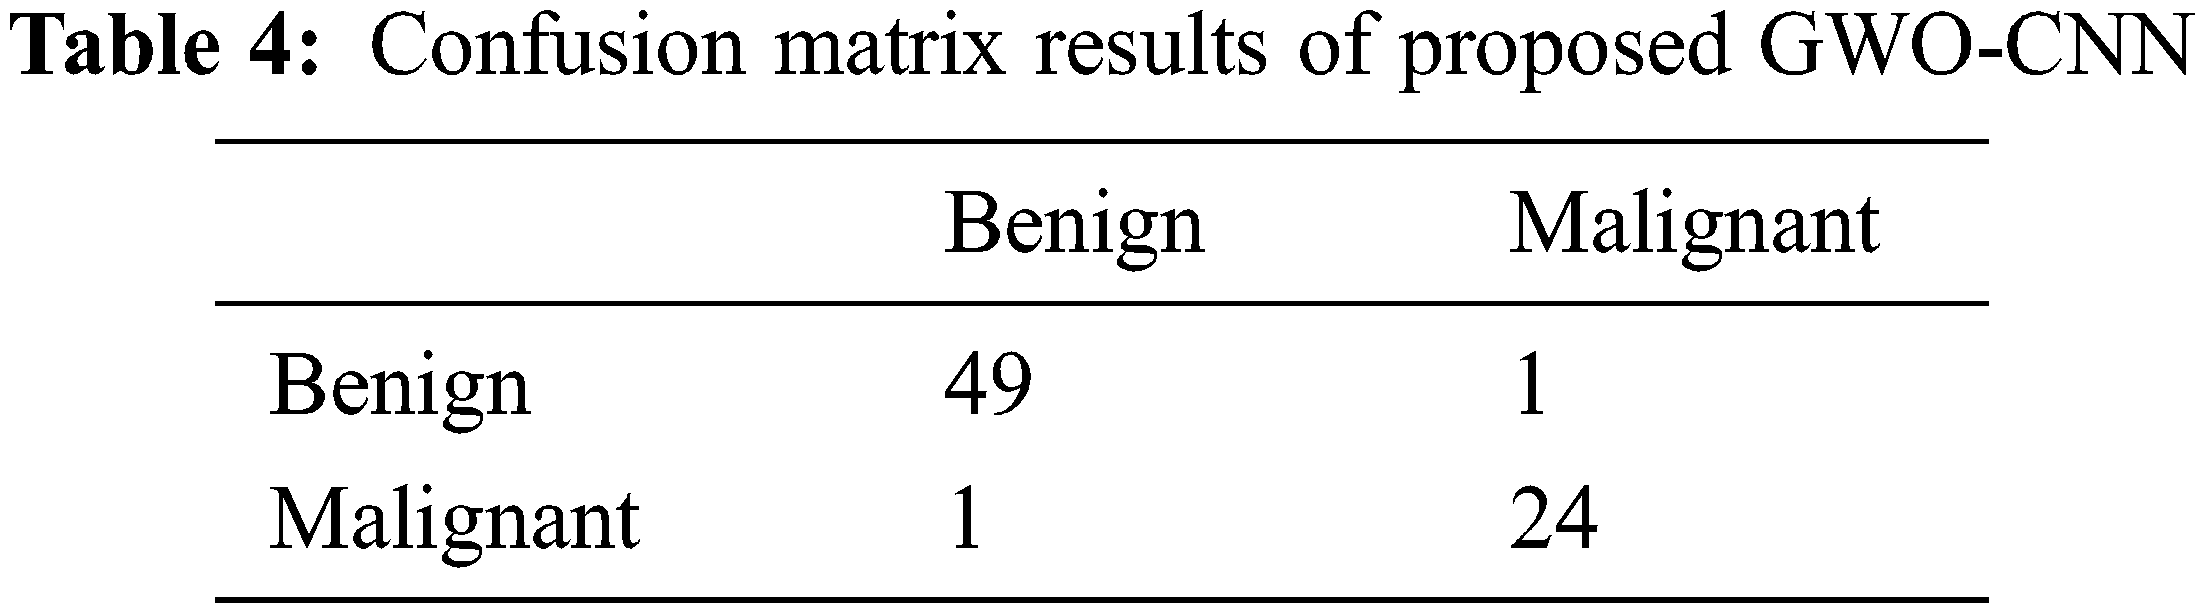
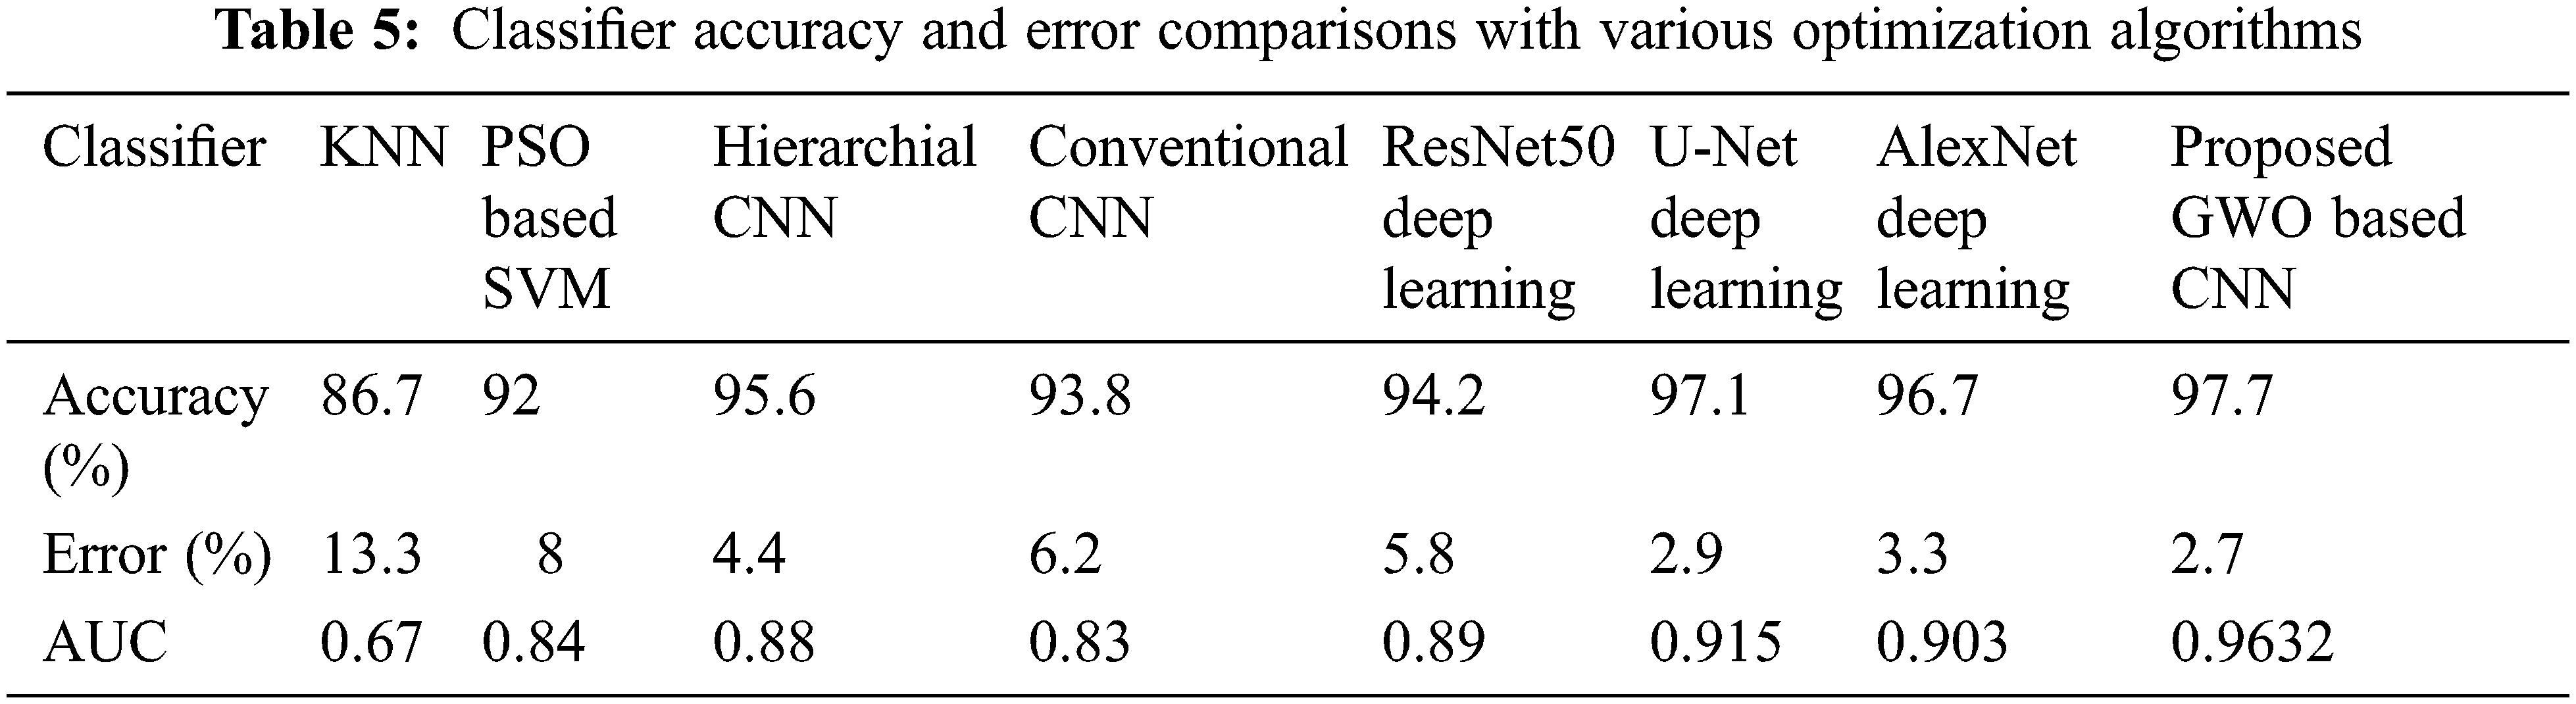
Fig. 5 displays the ROC Curve contrasting the various classifiers to the proposed GWO-CNN Classifier. The True Positive value is high, allowing for accurate identification of cancerous cells.

Figure 5: ROC curve comparison of the proposed GWO-CNN Classifier with existing classifier
Pancreatic cancer is the most challenging to identify because of its hidden nature. It has a low survival rate and a high mortality rate. Because of the thorough implementation, the clinical symptoms have guiding significance for early diagnosis of pancreatic malignant tumors. This study builds an early additive for pancreatic based on existing problems. Researchers can detect a pancreatic tumor early by looking for nodules linked with disease-related abnormalities. This method is highly effective and low-cost method, and the minute tumor may not be seen at the early phase. In the proposed work, an effective GWO-CNN is introduced for classifying the tumor as benign or malignant. This research incorporates the method of HE as preprocessing combined with the modified region-based segmentation algorithm that improves diagnostic performance. The sensitivity, specificity, and accuracy are obtained for each classifier. Experimental results indicate that high accuracy of 97.7% is provided by the proposed GWO-CNN classifier curve shows how the proposed classifier is close to the True Positive Value, which demonstrates the effectiveness of the proposed scheme. With some tweaks, the same network might be utilised in the future for different dataset pancreatitis detection methods.
Acknowledgement: The authors express their heartfelt thanks to the supervisor for his direction and unwavering support during this study.
Funding Statement: The authors did not receive any funding for the research submitted.
Conflicts of Interest: The authors have no known competing interest in the current research.
References
1. A. Vincent, J. Herman, R. Schulick, R. H. Hruban and M. Goggins, “Pancreatic cancer diagnosis,” Lancet, vol. 378, no. 9791, pp. 607–620, 2011. [Google Scholar]
2. J. Xu, K. Xue and K. Zhang, “Current status and future trends of clinical diagnoses via image-based deep learning,” Theranostics, vol. 9, no. 25, pp. 7556–7565, 2019. [Google Scholar]
3. A. S. Takhar, P. Palaniappan, R. Dhingsa and D. N. Lobo, “Recent developments in diagnosis of pancreatic cancer,” British Medical Journal, vol. 329, no. 7467, pp. 668–673, 2004. [Google Scholar]
4. Y. H. Chang, G. Thibault, O. Madin, V. Azimi, C. Meyers et al., “Deep learning-based nucleus classification in pancreas histological images,” in Proc. 2017 39th Annual Int. Conf. of the IEEE Engineering in Medicine and Biology Society (EMBC), Jeju, Korea (Southpp. 672–675, 2017. [Google Scholar]
5. D. L. Jose, B. Luana and L. F. Jon, “An automatic method for segmentation of liver lesions in CT images using deep neural networks,” Expert System with Applications, vol. 180, pp. 115064, 2021. [Google Scholar]
6. H. Jiang, D. Zhao, R. Zheng and X. Ma, “Construction of pancreatic cancer classifier based on SVM optimized by improved FOA,” BioMed Research International, vol. 2015, no. 3, pp. 1–12, 2015. [Google Scholar]
7. P. Pahari, P. Basak and A. Sarkar, “Biomarker detection on pancreatic cancer dataset using entropy based spectral clustering,” in Proc. 2017 Third Int. Conf. on Research in Computational Intelligence and Communication Networks (ICRCICN), Kolkata, India, pp. 208–212, 2017. [Google Scholar]
8. C. K. K. Reddy, G. V. S. Raju and P. R. Anisha, “Detection of pancreatic cancer using clustering and wavelet transform techniques,” in Proc. 2015 Int. Conf. on Computational Intelligence and Communication Networks (CICN), Jabalpur, India, pp. 332–336, 2015. [Google Scholar]
9. K. Yoshihara, M. Shahmoradgoli, E. Martínez, R. Vegesna, H. Kim et al., “Inferring tumour purity and stromal and immune cell admixture from expression data,” Nature Communications, vol. 4, no. 1, pp. 1–11, 2013. [Google Scholar]
10. K. R. Samala, C. H. Ping, L. Yao, M. Lubomir, W. Hadjiiski et al., “Digital breast tomosynthesis: Computer-aided detection of clustered microcalcifications on planar projection images,” Physics in Medicine & Biology, vol. 59, no. 23, pp. 7457–7477, 2014. [Google Scholar]
11. R. K. Samala, H. P. Chan, Y. Lu, L. M. Hadjiiski, J. Wei et al., “Computer-aided detection system for clustered microcalcifications in digital breast tomosynthesis using joint information from volumetric and planar projection images,” Physics in Medicine & Biology, vol. 60, no. 21, pp. 8457–8479, 2015. [Google Scholar]
12. J. Jeong, Ji-wook, C. S. Hoon, E. Y. Chae, H. Kim et al., “Three-dimensional computer-aided detection of microcalcification clusters in digital breast tomosynthesis,” BioMed Research International, vol. 2016, pp. 8, 2016. [Google Scholar]
13. Z. Zhou, Y. Yin, H. Chang, K. Barner and S. Paul, “Classification of histology sections via multispectral convolutional sparse coding,” in Proc. IEEE Conf. on Computer Vision and Pattern Recognition, Columbus, OH, USA, pp. 3081–3088, 2014. [Google Scholar]
14. M. Y. Elshinawy, “Pre-CAD normal mammogram detection algorithm based on tissue type,” Ph.D. dissertation, Howard University, Washington, DC, 2010. [Google Scholar]
15. J. Jones and M. Saeed, “Image enhancement-an emergent pattern formation approach via decentralised multi-agent systems,” Multiagent and Grid Systems, vol. 3, no. 1, pp. 105–140, 2007. [Google Scholar]
16. W. Woods, K. Kevin, J. M. Collins, S. S. Periaswamy and L. R. V. Uitert, “Computer-aided detection of regions of interest in tomographic breast imagery,” U.S. Patent, vol. 634, no. 622, pp. 1–9, 2014. [Google Scholar]
17. B. Joseph, B. Ramachandran and P. Muthukrishnan, “Intelligent detection and classification of microcalcification in compressed mammogram image,” Image Analysis & Stereology, vol. 34, no. 3, pp. 183–198, 2015. [Google Scholar]
18. A. M. Ahmad, “Exploration of computational intelligence techniques for static time-series and imagery bio-signal processing,” Ph. D dissertation, University of Engineering & Technology, Peshawar, 2016. [Google Scholar]
19. J. Zhou and O. G. Troyanskaya, “Predicting effects of noncoding variants with deep learning-based sequence model,” Nature Methods, vol. 12, no. 10, pp. 931–934, 2015. [Google Scholar]
20. W. Weiss and W. William, “Quantitative analysis of high spectral and spatial resolution breast MRI,” PhD dissertation, The University of Chicago, Chicago, IL, 2015. [Google Scholar]
21. C. Moschopoulos, D. Popovic, A. Sifrim, G. Beligiannis, B. D. Moor et al., “A genetic algorithm for pancreatic cancer diagnosis,” in Proc. Int. Conf. on Engineering Applications of Neural Networks, Berlin, Heidelberg, Springer, 384, pp. 222–230, 2013. [Google Scholar]
22. E. Fahssi, K. Khalid, A. Elmoufidi, A. Abenaou, S. Jai-Andaloussi et al., “Feature extraction of the lesion in mammogram images using segmentation by minimizing the energy and orthogonal transformation adaptive,” WSEAS Transactions on Biology and Biomedicine, vol. 11, pp. 88–95, 2014. [Google Scholar]
23. Y. Xu, Z. J. Yan, I. Eric, C. Chang, M. Lai et al., “Weakly supervised histopathology cancer image segmentation and classification,” Medical Image Analysis, vol. 18, no. 3, pp. 591–604, 2014. [Google Scholar]
24. Z. A. Sadeque, T. I. Khan, Q. D. Hossain and M. Y. Turaba, “Automated detection and classification of liver cancer from CT Images using HOG-SVM model,” in Proc. 5th Int. Conf. on Advances in Electrical Engineering (ICAEE), Dhaka, Bangladesh, pp. 357– 366, 2019. [Google Scholar]
25. K. L. Liu, T. Wu, P. T. Chen, M. Y. Tsai, H. Roth et al., “Deep learning to distinguish pancreatic cancer tissue from non-cancerous pancreatic tissue: a retrospective study with cross-racial external validation,” The Lancet Digital Health, vol. 2, no. 6, pp. 303–e313, 2020. [Google Scholar]
26. K. Si, Y. Xue, X. Yu, X. Zhu, Q. Li et al., “Fully end-to-end deep-learning-based diagnosis of pancreatic tumors,” Theranostics, vol. 11, no. 4, pp. 1982–1990, 2021. [Google Scholar]
27. K. Kushnure, T. Devidas and N. Sanjay Talbar, “MS-UNet: A multi-scale UNet with feature recalibration approach for automatic liver and tumor segmentation in CT images,” Computerized Medical Imaging and Graphics, vol. 89, pp. 101885, 2021. [Google Scholar]
28. B. S. Lin, K. Michael, S. Kalra and H. R. Tizhoosh, “Skin lesion segmentation: U-nets versus clustering,” in Proc. 2017 IEEE Symp. Series on Computational Intelligence (SSCI), Honolulu, HI, USA, IEEE, pp. 1–7, 2017. [Google Scholar]
29. D. R. Ramji, C. A. Palagan, A. Nithya, A. Appathurai, E. J. Alex et al., “Soft computing-based color image demos icing for medical image processing,” Multimedia Tools and Applications, vol. 79, no. 15, pp. 10047–10063, 2020. [Google Scholar]
30. A. Nithya, A. Appathurai, N. Venkatadri, D. R. Ramji and C. A. Palagan, “Kidney disease detection and segmentation using artificial neural network and multi-kernel k-means clustering for ultrasound images,” Measurement, vol. 149, no. 1, pp. 106952, 2020. [Google Scholar]
31. R. Sundarasekar and A. Appathurai, “Efficient brain tumor detection and classification using magnetic resonance imaging,” Biomedical Physics & Engineering Express, vol. 7, no. 5, pp. 055007, 2021. [Google Scholar]
Cite This Article
 Copyright © 2023 The Author(s). Published by Tech Science Press.
This work is licensed under a Creative Commons Attribution 4.0 International License , which permits unrestricted use, distribution, and reproduction in any medium, provided the original work is properly cited.
 Downloads
 Citation Tools