
 Submit a Paper
 Propose a Special lssue
 Open Access
ARTICLE
Malicious Activities Prediction Over Online Social Networking Using Ensemble Model
1 Department of Computer Science and Engineering, K. S. R College of Engineering, Thiruchengode, India
2 Centre for Artificial Intelligence, Chennai Institute of Technology, Chennai, India
3 Department of Computer Science and Engineering, S. A. Engineering College, Chennai, India
* Corresponding Author: K. Dinakaran. Email:
Intelligent Automation & Soft Computing 2023, 36(1), 461-479. https://doi.org/10.32604/iasc.2023.028650
Received 15 February 2022; Accepted 10 June 2022; Issue published 29 September 2022
 View Full Text
 Download PDF
Abstract
With the vast advancements in Information Technology, the emergence of Online Social Networking (OSN) has also hit its peak and captured the attention of the young generation people. The clone intends to replicate the users and inject massive malicious activities that pose a crucial security threat to the original user. However, the attackers also target this height of OSN utilization, explicitly creating the clones of the user’s account. Various clone detection mechanisms are designed based on social-network activities. For instance, monitoring the occurrence of clone edges is done to restrict the generation of clone activities. However, this assumption is unsuitable for a real-time environment and works optimally during the simulation process. This research concentrates on modeling and efficient clone prediction and avoidance methods to help the social network activists and the victims enhance the clone prediction accuracy. This model does not rely on assumptions. Here, an ensemble Adaptive Random Subspace is used for classifying the clone victims with k-Nearest Neighbour (k-NN) as a base classifier. The weighted clone nodes are analysed using the weighted graph theory concept based on the classified results. When the weighted node’s threshold value is higher, the trust establishment is terminated, and the clones are ranked and sorted in the higher place for termination. Thus, the victims are alert to the clone propagation over the online social networking end, and the validation is done using the MATLAB 2020a simulation environment. The model shows a better trade-off than existing approaches like Random Forest (RF), Naïve Bayes (NB), and the standard graph model. Various performance metrics like True Positive Rate (TPR), False Alarm Rate (FAR), Recall, Precision, F-measure, and ROC and run time analysis are evaluated to show the significance of the model.Keywords
In the mid-1990s, the internet developed, and it proved that there was a possibility to share the data through many methods that were impossible in earlier years. Still, there is no aspect to sharing personal data [1]. In the 2000s, many people accepted that social networking helps share personal information online [2]. Social networking is the platform to expand the contact of one person with another individual through social media sites such as Twitter, Facebook, LinkedIn, Instagram, and so on [3]. Social networking is helpful for both business and personal purposes [4]. These social networking platforms help to bring people altogether to speak, share their knowledge and interest and form new friends. Primarily, people can communicate using social networking [5]. These platforms always helped people for easy use. Social media sites are expanding tremendously in numbers and popularity due to the aforementioned reasons [6]. Social networking sites help build a career, entertain people, create opportunities in business, improve an individual’s social skills, and build relationships with each other [7]. Since the voluminous population utilizes social media sites online, Facebook and Myspace are the most selected social media platforms that have become remarkable forums for upgrading the business and alertness operations [8].
The importance of protecting personal data stored frequently in the social networking platform is considered for granted because many people think social networking sites are a tool for personal communication. People post their information more on various mediums in the social networks with the time that turns to unparalleled entry to business and people’s data [9,10]. Social networks have stored a lot of information that is very attractive to competitors, who want to hurt others. Those people can destroy work with a large volume of data in their hands. However, social media has become the unique platform for advertisement for traders [11,12]. Even though there are many benefits to using the platforms, the demerits also are there in using these sites [13]. These platforms are unsafe from hacking threats for many reasons. The unwanted person can build a site that looks similar to a Facebook page. In addition, they tend to attract the user to enter their credentials in many methods [14,15].
Attackers find this as an excellent chance to hack their target due to this feature. The attacker forwards the message that contains an abbreviated Uniform Resource Locator (URL) that takes the user to the malicious site [14]. It is difficult to find the abbreviated URL if it is a legal or malicious site. Attackers may extract this benefit and confuse the user with the abbreviated URLs with the malevolent message. Some examples are ‘LinkedIn’, ‘Pinterest’, and ‘Classroom 2.0’ professional social networking websites. Even though the social networking platform has information related to the user’s professional data, including e-mail id, the attacker can utilize that information to forward a personalized email to the victim [15]. Few illegal individuals distribute malicious links misguiding the users to a few hacking sites. Hacking also happens in a conversation medium this way. This work concentrates on predicting the malicious flow over the OSN environment. The following are the significant research contributions:
1) To acquire a dataset from the available online resources, the UCF crime dataset is used, where Gaussian filtering is performed to remove the noise over the dataset.
2) Then, feature extraction is done with statistical feature analysis, which includes color and reflection features fed as an input to the classifier model.
3) Finally, an ensemble classifier model is used for categorizing the malicious activities over the OSN. The evaluation is done with various existing approaches, and the model shows superior performance to the other approaches.
The work is organized as: In Section 2, a comprehensive analysis is made, and the advantages and disadvantages of various existing approaches are analyzed. The methodology is explained extensively in Section 3. The numerical outcomes of the anticipated ensemble model are shown in Section 4, followed by a research summary in Section 5.
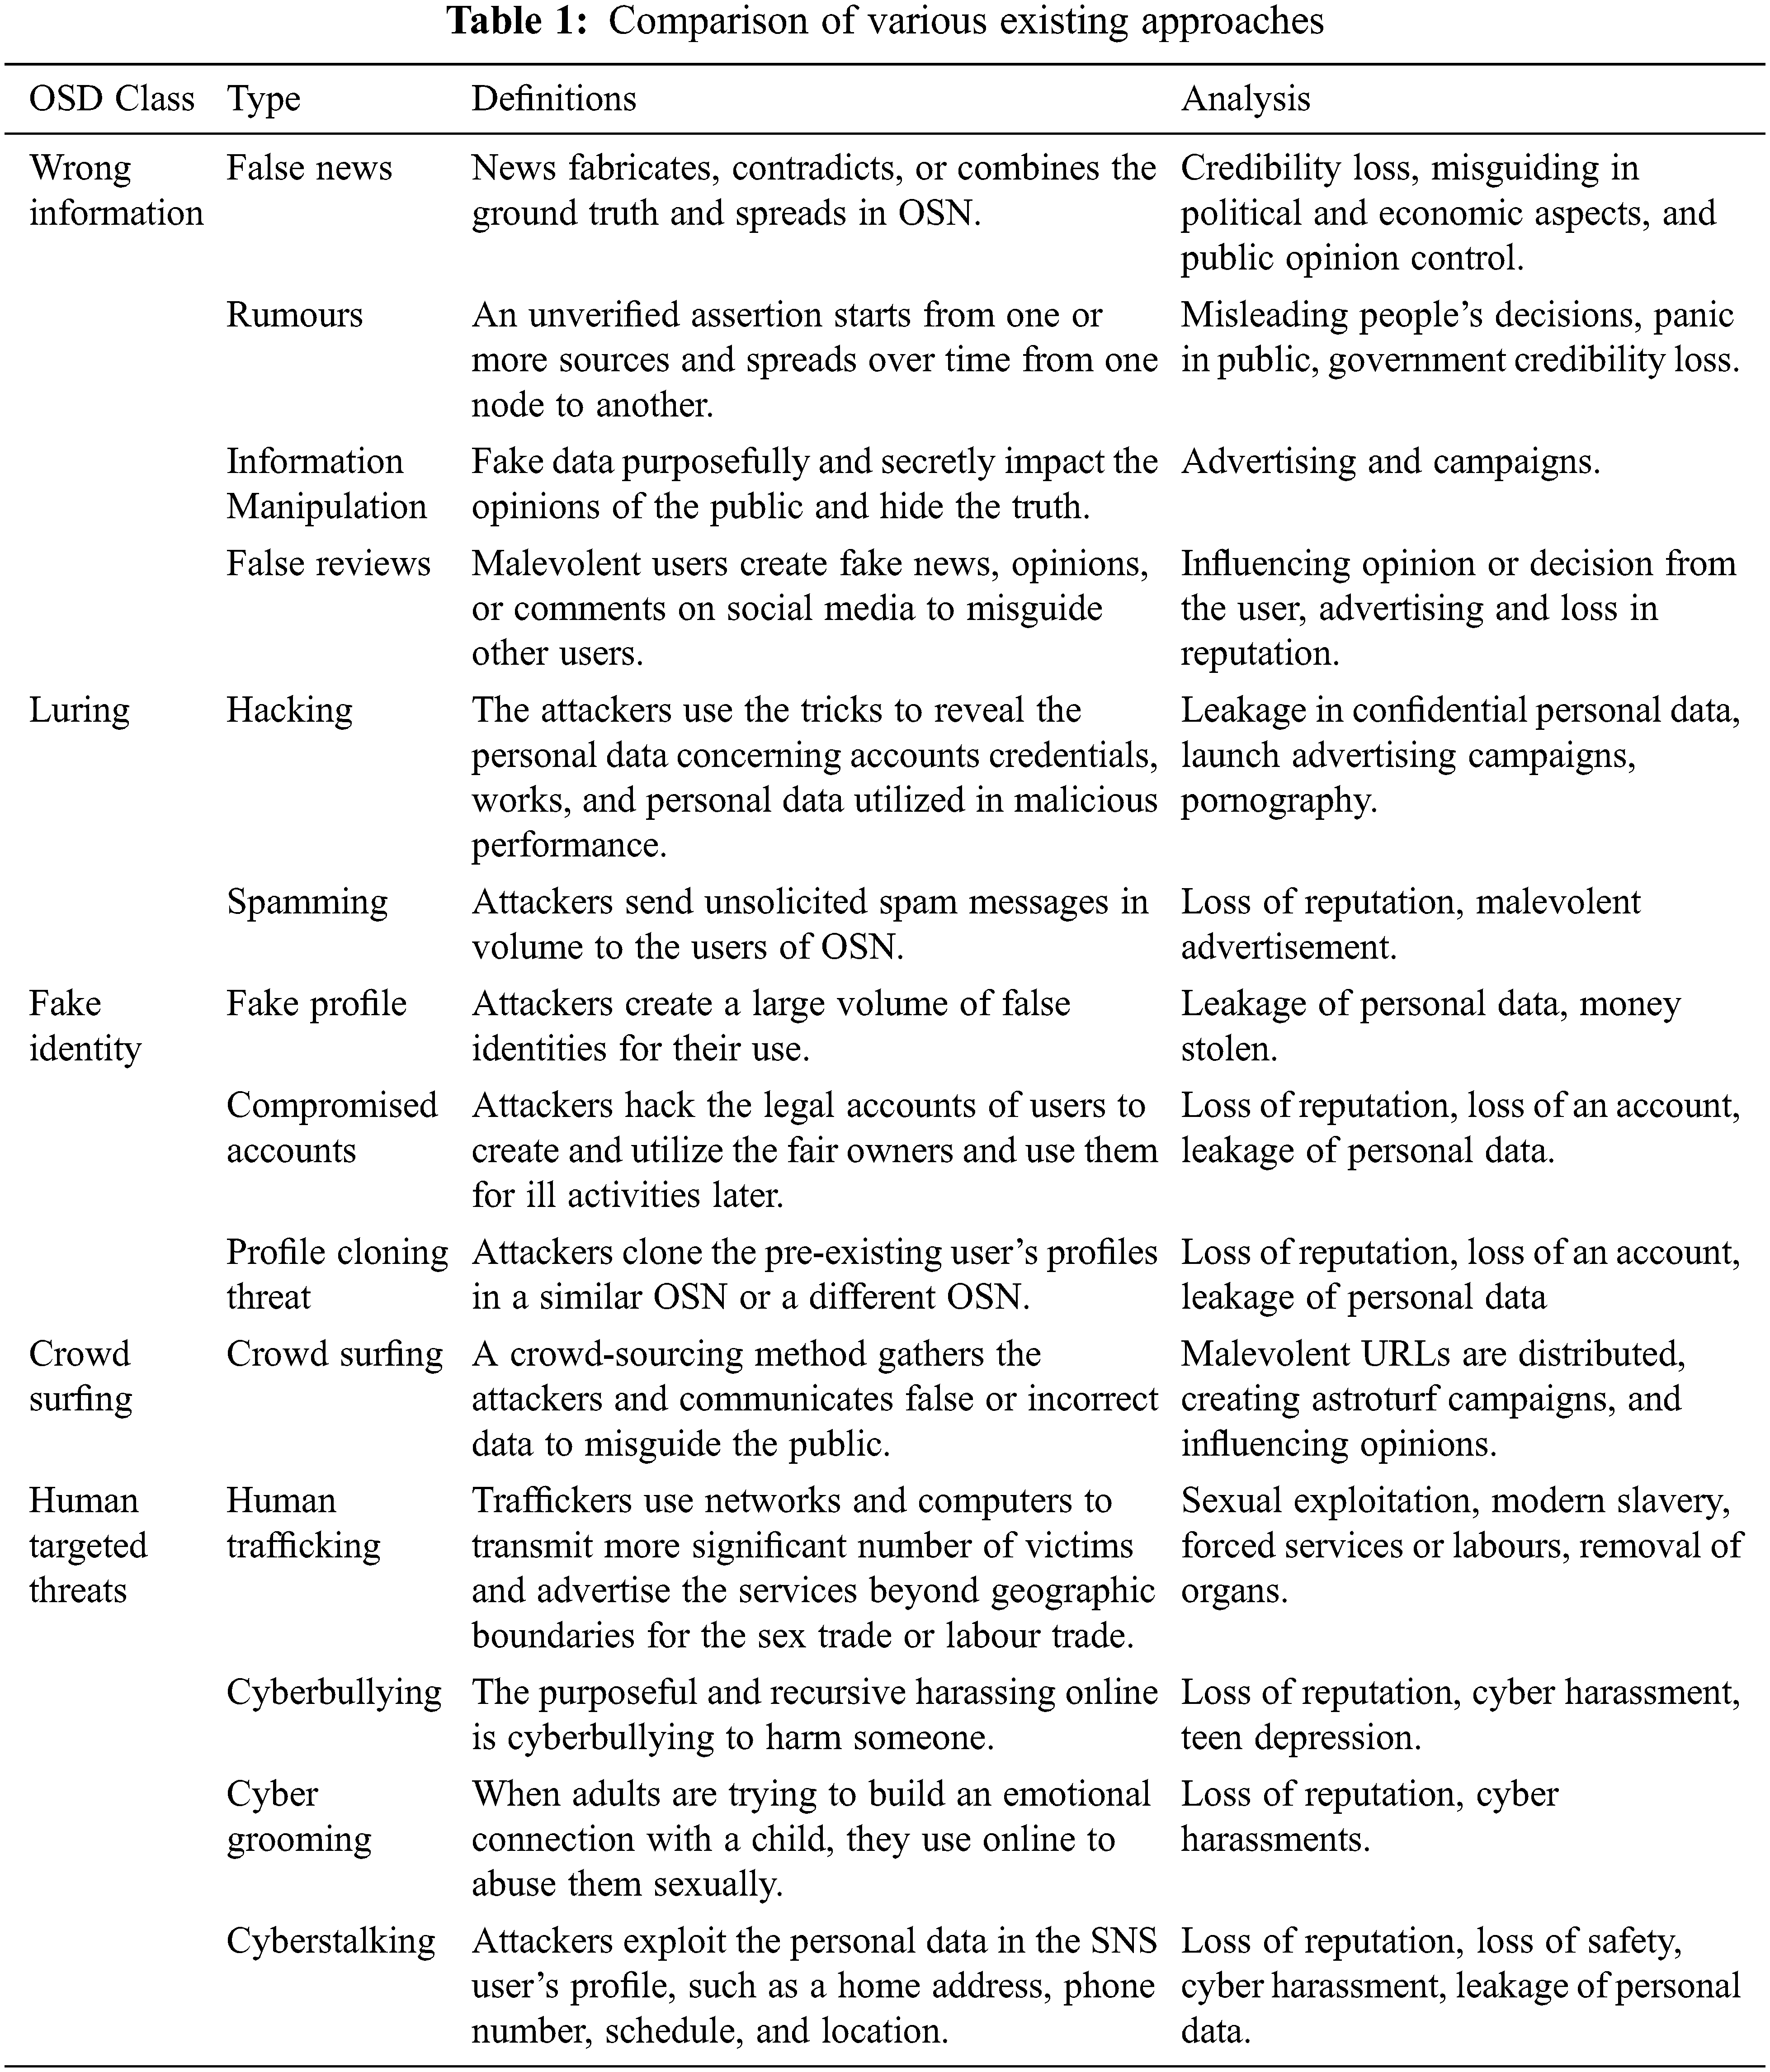
The social networks have inconsistency detection that is taken in numerous ways. Multiple anomalies are found and aimed with results strategically over the years. These results concentrate on the anomaly classifications to fix the problems for the user’s identification. These types of anomalies can influence the utility of social networking. The research has been carried out by Wang et al. [16] on the concept of vehicular anomalies under ClariSense+. Scientists suggested expanding the description method of anomaly and examining the technique in vehicular circumstances. The author’s approach concentrates on the network with sensor capacity and finds the problem concerning the contingency of anomalies in the same circumstance. The crowd anomaly identification and localization in global and local social networks were developed by Moustafa et al. [17]. The authors utilize the scenic dynamics to find the crowd anomaly’s greater correctness. Collaboration is needed to identify the anomalies and define the rules. The weighted graph has abnormalities and designed an algorithm, namely Oddball, to find the infected nodes designed by Peng et al. [18]. The rule-based technique is used by the authors that are used to identify the graph anomalies. The mentioned techniques can locate the specified abnormality in limited circumstances. Gardiner et al. [19] shows that the anomalies in the social networks available online are the other aspects. These aspects are investigated that has compromised accounts. Under the name of COMPA, the scientists designed the technique that can find compromised accounts on all the social media websites [20]. The methods are under analyzing process, and they are tested on the vast data set that consists of 1.4 billion Twitter messages roughly and are available in public. Erfani et al. [21] suggested dividing these approaches into IDS (Intrusion Detection Systems), explicitly detecting an anomaly online in social networks. The utilization of machine learning techniques is to form the IDS to track the anomalies of the network effectively and presented by the authors. The anomalies are restricted to social accounts and harm the network by operating the malevolent source. The exact impacts are considered by Prez et al. [22] for the anomalies in the cellular network. The anomalies are identified with the point of interaction as the solution. These techniques use the ideas of anomaly scores by examining the sources, which are used to interact with the user. Prez et al. [22] developed the change-point detection approach that utilizes the Sequentially Discounting Normalized Maximum Likelihood (SDNML). These experiments are used to get the anomaly scores by the authors to find the link anomalies. The authors suggested another approach called the Group Latent Anomaly Detection (GLAD) technique developed by Zhang et al. [23] that utilizes the point-wise and pair-wise data to determine the last decision of techniques. This technique is more effective; there is a lacking of usefulness in the horizontal anomalies due to its lack of independence for every individual on the group features. Due to the activities of the individual are disregarding the group causes horizontal anomalies where it can fit. The detection of anomalies has problems, and one of the solutions is statistics. Natarajan et al. [24] suggested an effective method using the idea of statistics in the networks for anomaly identification that utilizes the Bayesian technique analysis [25] explicitly. The authors used the two-phase technique to detect the anomaly that minimizes the collection of possible anomaly nodes. The current results depend more on gathering information utilized in learned anomalies only [26,27]. Moreover, the present techniques do not comprise the marking, real-time detection, and warning systems needed to form the practical strategy to detect the horizontal anomaly. Most of the presented methods are general and proved in the previous study explained in this section for the anomalies detection that is not taken for the horizontal anomalies [28–30]. Then practical techniques are needed to find the level of threat generated using the anomalies and solve these issues effectively. Tab. 1 depicts the comparison of various existing approaches.
This section elaborates the idea of the anticipated ensemble model, which is composed of four diverse phases: 1) dataset acquisition, 2) Gaussian filter, 3) feature extraction with statistical, color diversity, and reflection method and 4) classification with ensemble k-NN with Random Subspace (RSS). The evaluation is done with the MATLAB 2020a environment, and a comparison is made with existing approaches like the ranking model, DT (Decision Tree), RF (Random Forest), and NB (Naïve Bayes) approach. Fig. 1 depicts the block diagram of the ensemble model.
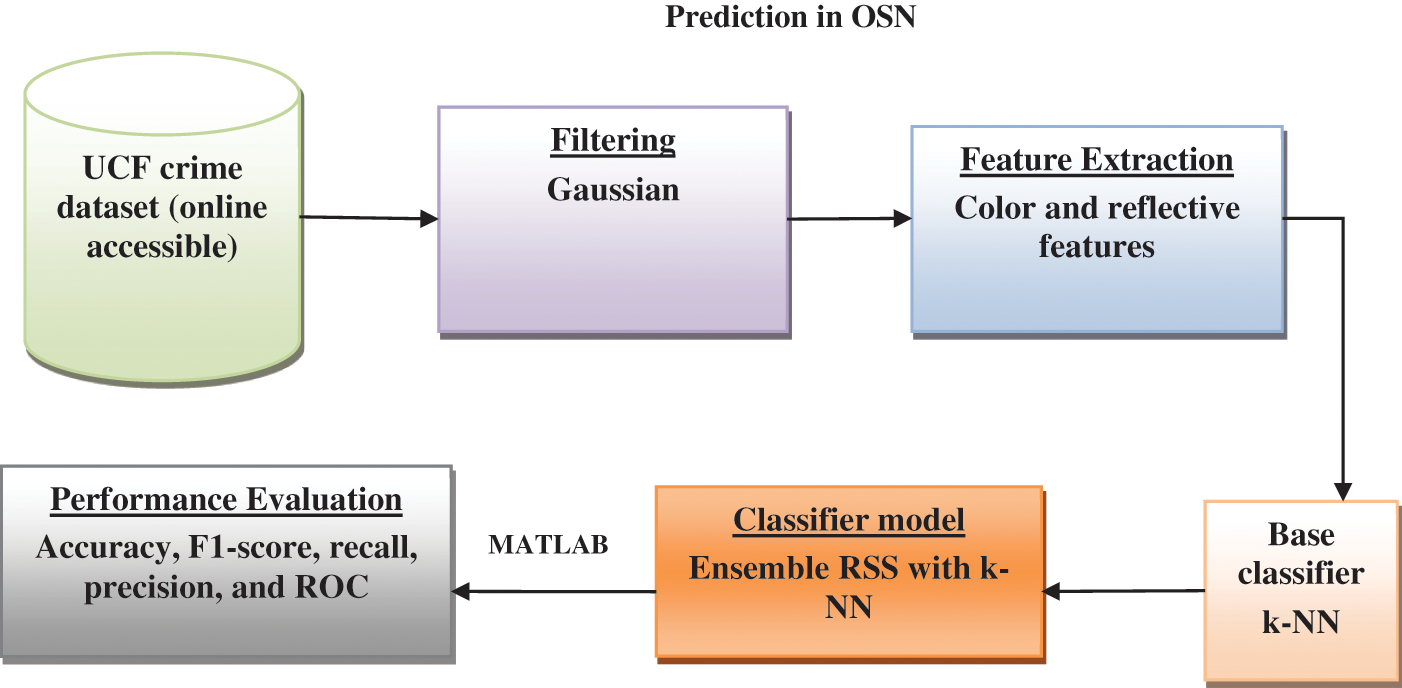
Figure 1: Block of the ensemble model
This work constructs a large-scale UCF crime dataset to measure the ensemble model. It comprises untrimmed surveillance videos covering 13 diverse real-world anomalies like arrest, abuse, arson, assault, burglary, road accident, fighting, robbery, explosion, stealing, shooting, vandalism, and shoplifting. These anomalies are chosen as they show significant influence over public safety. It consists of three sub-folders like detection_splits, recognition_splits, and videos. It is a large-scale dataset of 128 h of videos of 1900 long and untrimmed real-world surveillance videos, 13 realistic anomalies including abuse, arrest, arson, assault, road accident, burglary, explosion, fighting, robbery, shooting, stealing, shoplifting, and vandalism. These anomalies are selected because they have a significant impact on public safety.
The execution of the Gaussian filter is extensively utilized for noise removal and smoothing and needs a lot of computational resources and efficiency during implementation. The convolutional operators and smoothing approaches are mathematically expressed as in Eq. (1):
The smoothing of the image filter is localized in both the frequency and spatial domains, and thus the uncertainty function is satisfied using Eq. (2):
Here,
This work considers statistical feature extraction, which includes color diversity and reflection. Feature extraction is depicted as transforming or converting raw data into numerical features processed while maintaining the original dataset information. It gives superior outcomes while directly applying machine learning approaches to the raw data.
It plays a substantial role to enhance the classification system. Here, global features, i.e., color histogram, are measured as the essential feature for classification and offer color distribution estimation among the images. Compared to the raw image, the color ranges in image spam are constricted as the spammers produce the spam images; however, they are composed of constraint images. It is used for image extraction that relies on composition, and average modeling considers those image features’ size, shape, and location. The preliminary step behind this extraction is image resizing. Here, the image is resized as
Here, the objective is to predict the image regions composed of reflections. Moreover, reflections are minor images that may be anything. It is extremely challenging to predict the reflections from a single image devoid of any priors. Image sequences offer superior information for reflection detection. The aim is to determine the image edge belonging to the reflection by examining the feature point trajectories by tracking the successive image sequence. It derives an estimate for
Here,
Based on the Random Subspace generation model, it is observed that RSS and k-NN are conceptually simple and efficient computational models. It can be adopted for any domain to perform classification purposes. The model undergoes a probabilistic analysis because of its stochastic components. If the created individual subspace is more robust, the lack of diversity among the subspace may degrade the ensemble performance. In this case, the model is viewed as unstable. Random approaches are unsatisfying; in some cases, the model produces highly accurate results, and it is not clear what makes the model more accurate. To handle this issue, an adaptive model is proposed to the random subspace, and its objective is to provide a stable and adaptive model for the RSS model. This section provides a detailed description of the model with various subspace diversity measures and feature quality used as a component. The anticipated model produces an incremental subspace to guide diversity and individual subspaces. The significance of diversity and quality can be adjusted by adopting the hyper-parameters of the algorithm
3.5 Ensemble-Based Diversity Measure
An ensemble process can provide superior predictions and attain better performance than any single classifier model. An ensemble can diminish the dispersion of predictions. Various approaches to evaluate the variety of classifier ensembles are proposed in the prevailing works. Intuitively, increasing the classifier ensemble diversity leads to superior accuracy; however, there is no nominal proof over the dependencies. Moreover, most of the model relies on the prediction done using the classifiers, and the outcomes are expensive computationally. This work anticipates a naïve and faster approach based on evaluating the efficiency of the feature spread between the subspaces. Suppose S specifies the prevailing subspaces and
By reducing the anticipated metrics, it is ensured that the features spread among the sub-spaces contribute toward the generation of a diverse set of learners. The assumption under the large groups of not highly correlated features and the anticipated dissimilarity is simple. In experimental conditions, this would lead to the complete failure of the standard metrics in some cases.
The subspace estimation relies on the strength of every individual predictor. The model uses only the individuals’ most influencing features that are unnecessary to enhance the discriminative subspace power or more for the entire ensemble. Moreover, the model reduces the weak predictor (classifier) occurrences with an average of increased classifier performance. Consider an
It offers some simple metrics conceptually with essential properties of adopting various learners. The model needs training of many classifiers based on the data dimensionality. Here, two diverse alternatives are provided. Initially, mutual information among the target and features
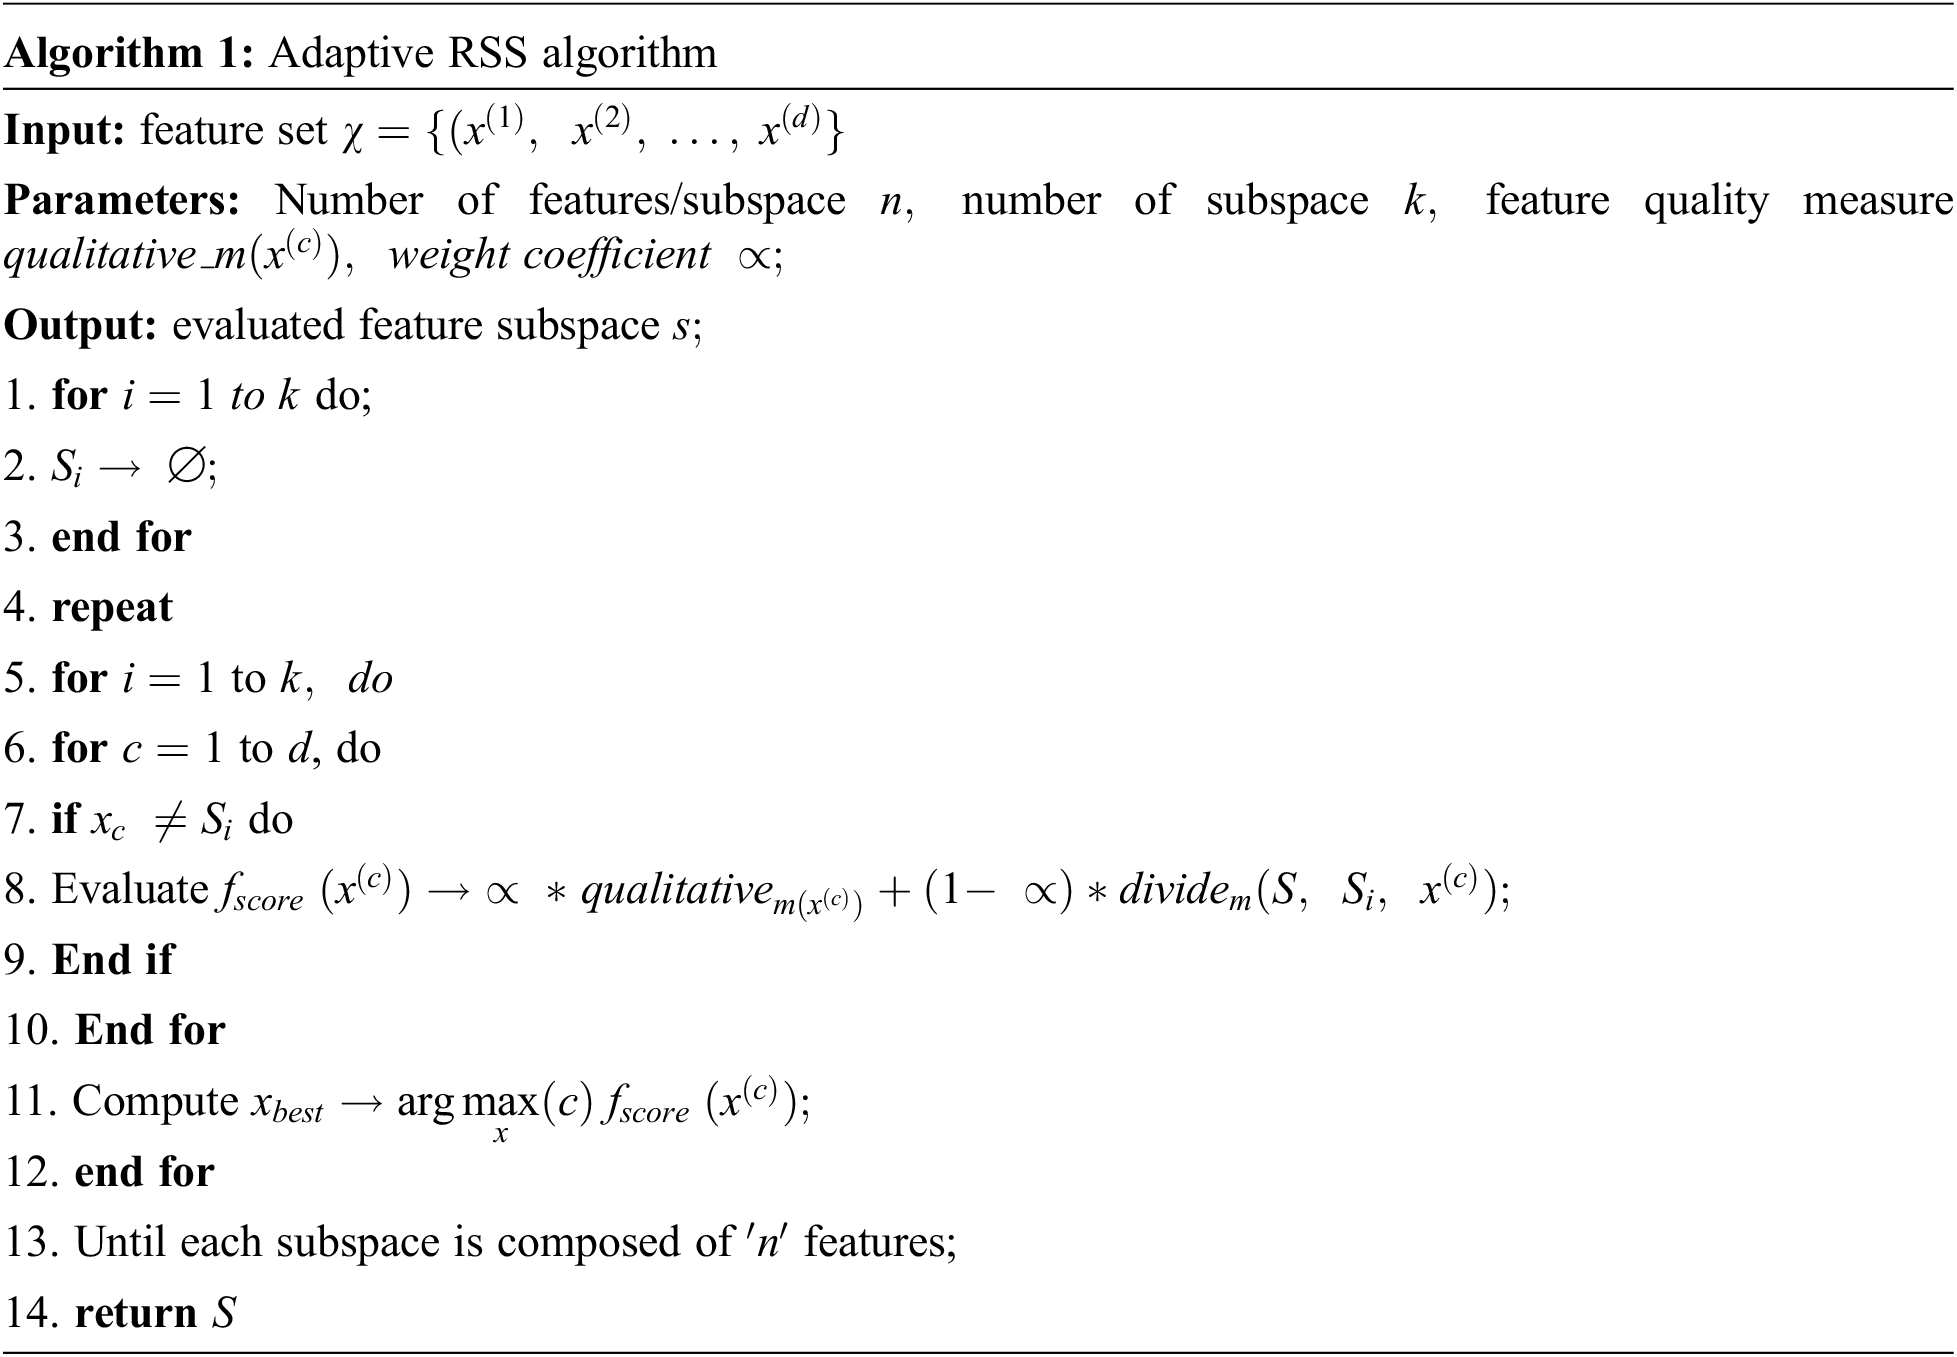
The probabilistic classification characteristics of various tasks are generally unknown. Thus the model adopts an appropriate estimator as the sample correlation coefficient, which is utilized to evaluate the Pearson correlation. The concept behind the anticipated measure is to trigger the learning process devoid of specific accuracy loss. The algorithm for the proposed idea is shown below:
3.7 K-Nearest Neighbor (K-NN) as Base Classifier
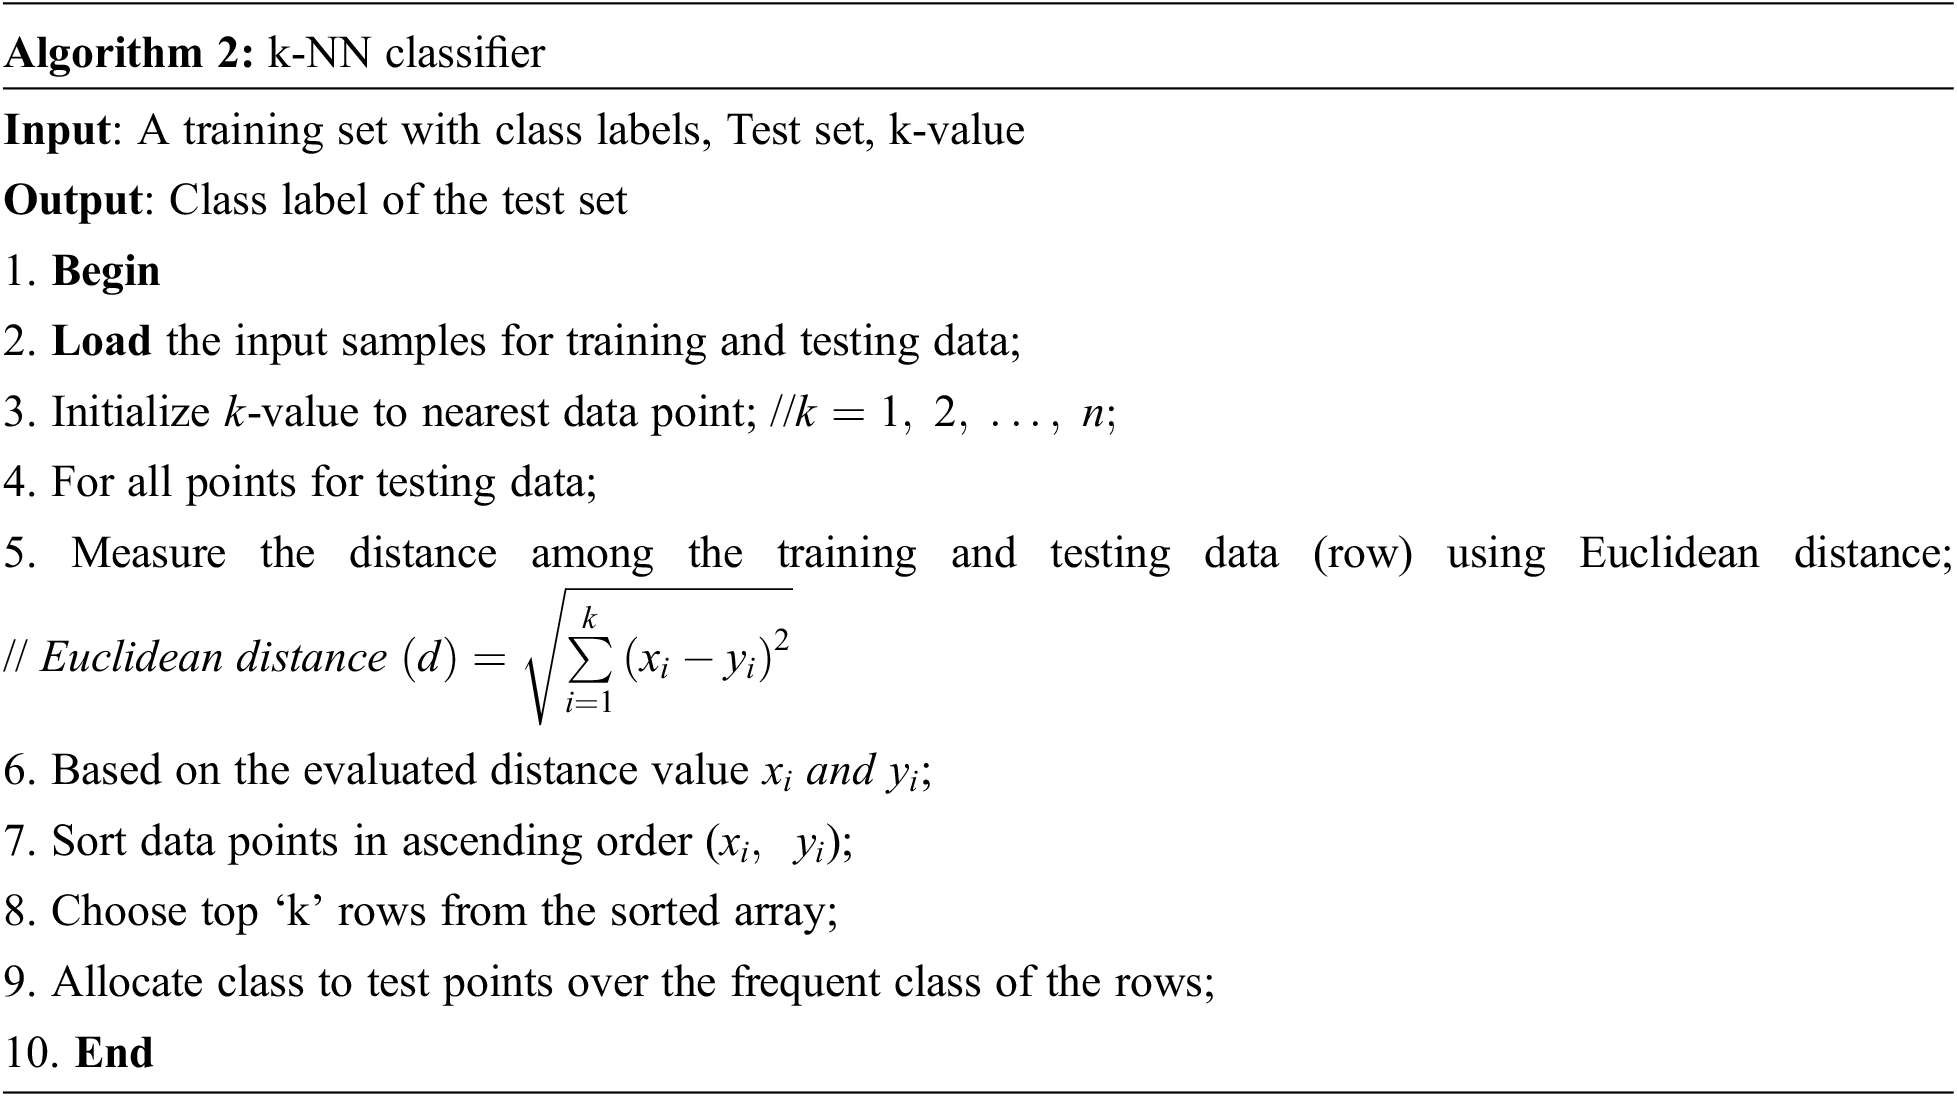
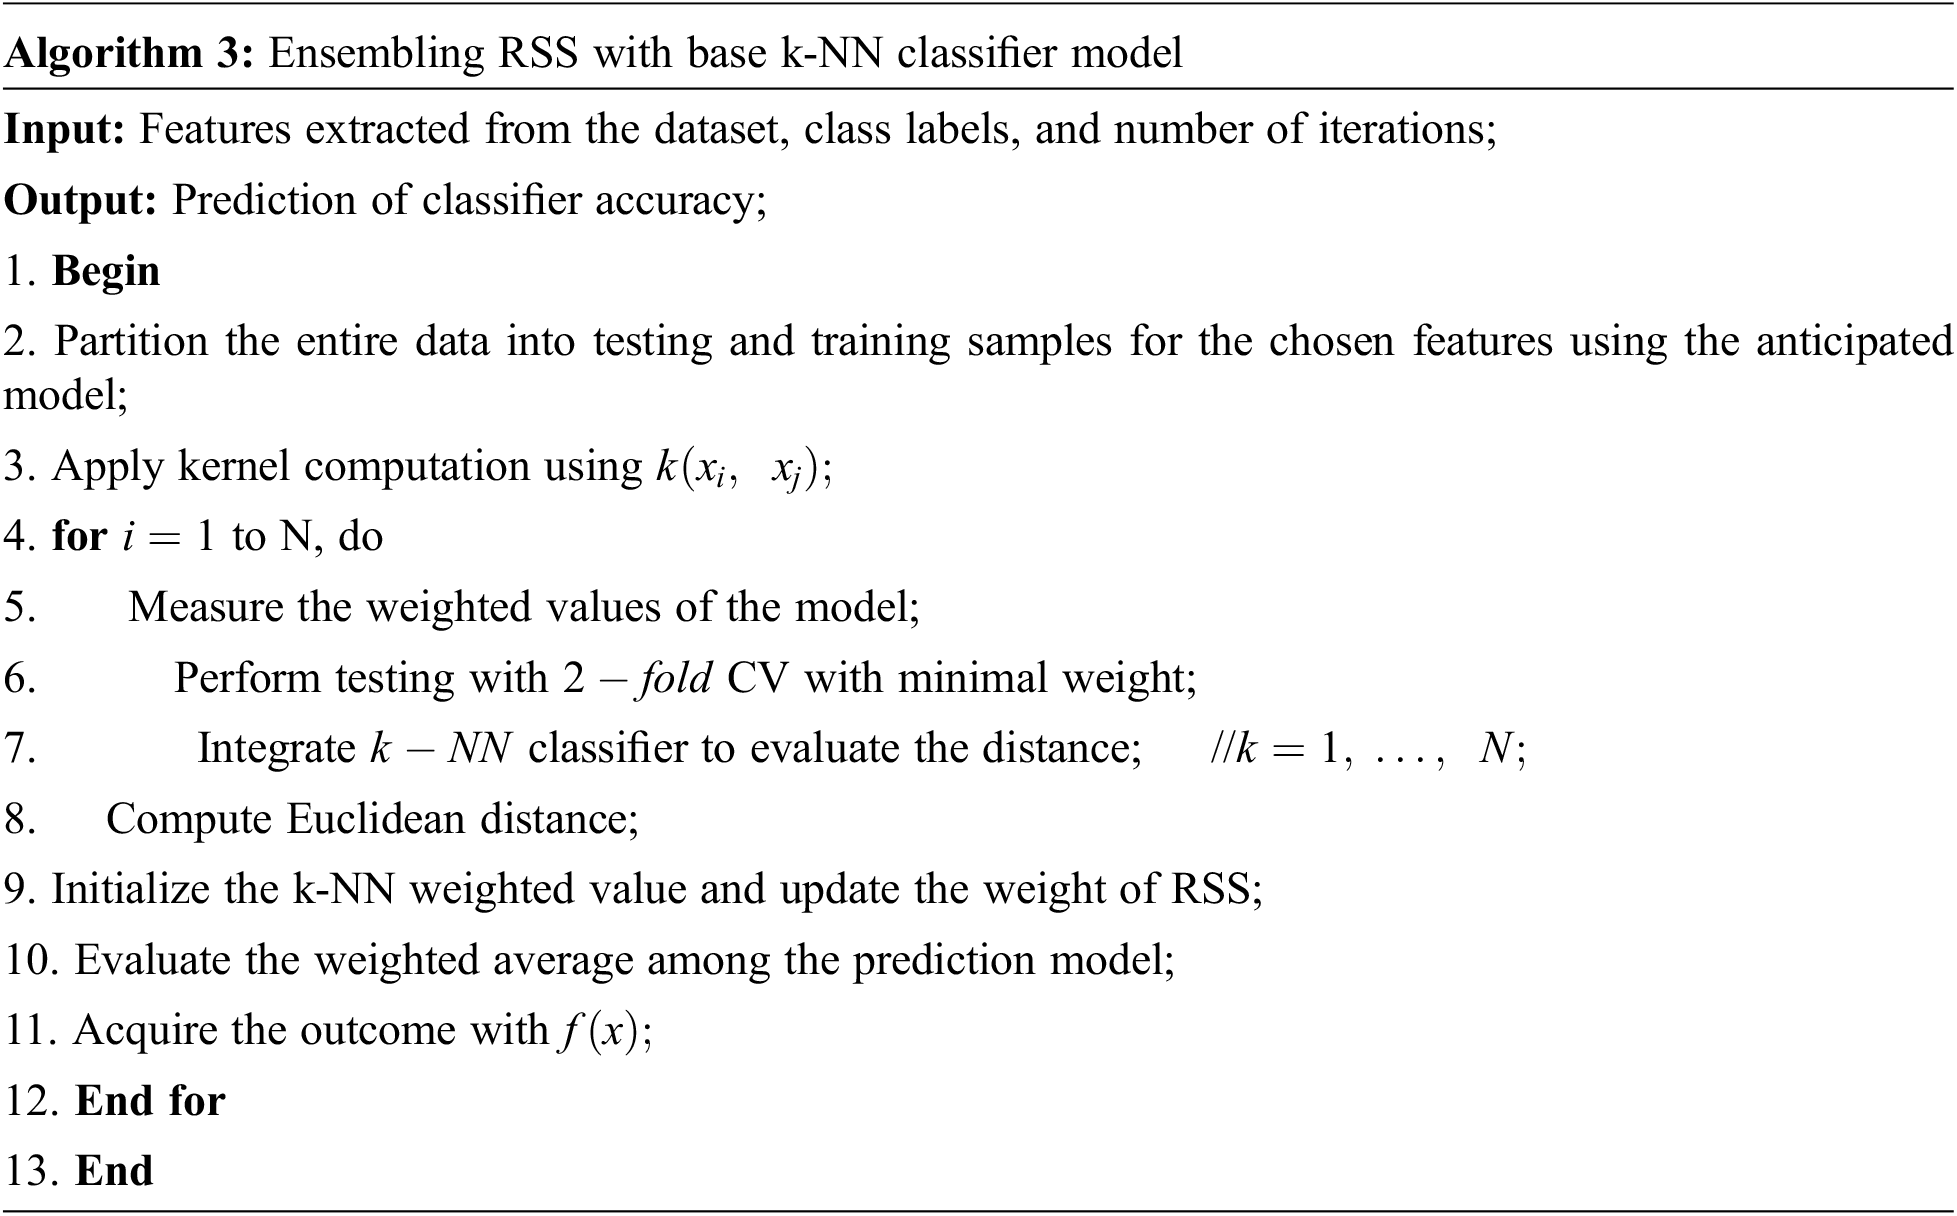
Here, k-NN is a supervised Machine learning algorithm applied specifically for prediction and classification issues. The non-linear decision boundaries are used for regression and classification. It does not explicit training step and works effectually during prediction. It measures feature similarity to predict some new data points’ value to represent unknown data points to allocate value based on how nearer the points match the provided training set. It works effectually for non-linear data when there is no specific assumption based on the data over the algorithm. It is adopted to classify some new objects with a distance to label the samples. Here, the k-value represents the number of nearest neighbors, and it is evaluated as a deciding factor owing to its competency to determine how neural networks (NN) influence the classification process. The neighborhoods are measured from training data objects where appropriate classification is already known. Another factor to be considered is its distance function. As known, the Euclidian distance function is adopted in multiple domains for evaluating the shortest distance among the feature space from the provided dataset. Usually, the interpretation is performed with some numerical data and is provided in Algorithm 2. The Euclidian distance function (d) is mathematically represented as in Eq. (9):
This research concentrates on ensembling k-NN with the RSS model to construct a more robust classifier from the individual performance of RSS and k-NN. The extracted features from the available online dataset are taken as an input for this model. To model an appropriate predictor model, this work considers two essential factors. For enhancing the RSS approach, ‘C’ and ‘γ’ are selected through the trial and error method by applying all the possible values. Subsequently, three critical factors are considered for choosing the optimal parameters like ‘C’ to establish the trade-off among the classification and margin value; gamma (γ) controls the fast of kernel function with growing vectors. Therefore, a grid search is performed over the ranges for C = 2−15 to 210 and γ = 2−10 to 210. The kernel function is mathematically expressed as in Eq. (10):
To make the model stronger, the optimal k value is predicted for applying various values ranging from
4 Numerical Results and Discussion
The proposed model extracts the features to acquire the classifier and predicts the victim. Here, the UCF crime dataset is taken, the sample input is shown in Fig. 2, and the filtered output is shown in Fig. 3. The experimental outcomes demonstrate that the anticipated classifier model is superior to other approaches. The performance of the ensemble model is computed with True Positive Rate (TPR), False Alarm Rate (FAR), precision, recall, F-measure, and accuracy. Here, accuracy depicts the percentage of appropriately predicted outcomes (class labels), precision is depicted as the ratio of appropriately classified victims, recall specifies the coverage proportion of victims, and F-measure is depicted as the weighted harmonic average of recall and precision [31–35]. These performance indicators are used to measure the classifier’s performance. The simulation is done in the MATLAB 2020a environment, where the random samples are taken from the dataset to perform the classification performance. This study chooses various traditional learning approaches for comparison purposes like ranking, RF, NB, and DT.
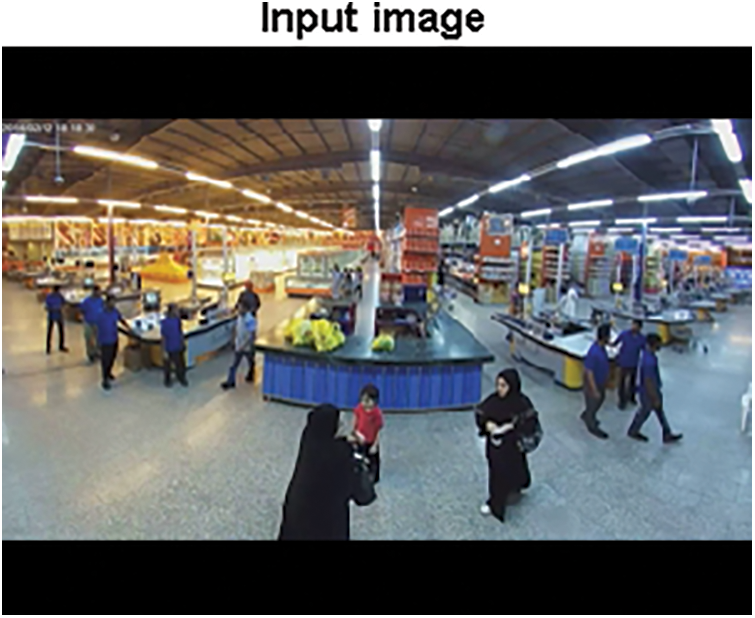
Figure 2: Input sample

Figure 3: Filtered image
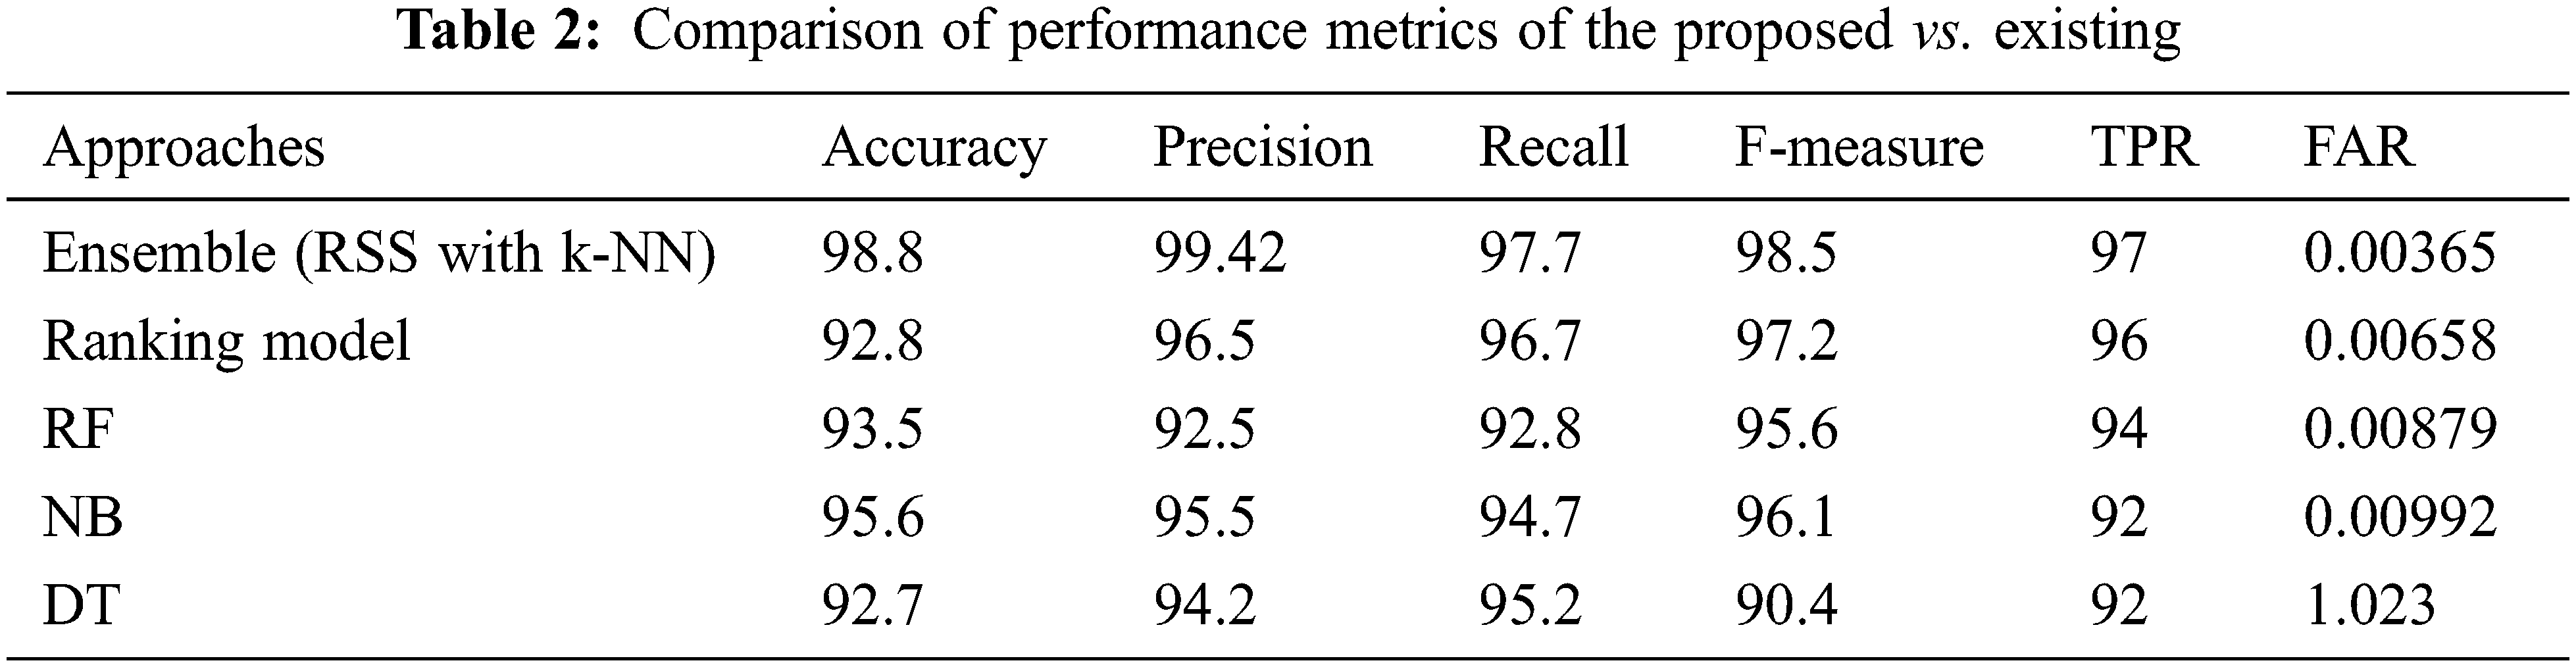
These four classifier models are evaluated with the anticipated ensemble model to provide prediction efficacy. The FAR, TPR, F-measure, recall, precision and accuracy of the ensemble model is 0.00365%, 97%, 98.5%, 97.7%, 99.42% and 98.8% respectively (See Figs. 4–9). It is observed that our proposed model works well with the prediction process with the best classifier outcomes. Tab. 2 depicts the comparison of the anticipated ensemble with the existing approaches like the ranking model, RF, NB, and DT. The accuracy of the ensemble model is 98.8% which is 6%, 5.3%, 3.2%, and 6.1% higher than other approaches. The precision of the ensemble model is 99.42% which is 2.92%, 6.92%, 3.92%, and 5.22% higher than a ranking model, RF, NB, and DT. The recall of the ensemble model is 1%, 4.9%, 3%, and 2.5% higher than ranking, RF, NB, and DT. The F-measure of the ensemble model is 98.5% which is 1.3%, 2.9%, 2.4%, and 8.1% higher than ranking, RF, NB, and DT. The TPR of the ensemble model is 97% which is 1%, 3%, 5%, and 5% higher than the ranking, RF, NB, and DT approach. The FAR of the ensemble model is 0.00365, which is comparatively higher than other approaches where ranking shows 0.00658, RF gives 0.00879, NB gives 0.00992, and DT gives 1.023, respectively.
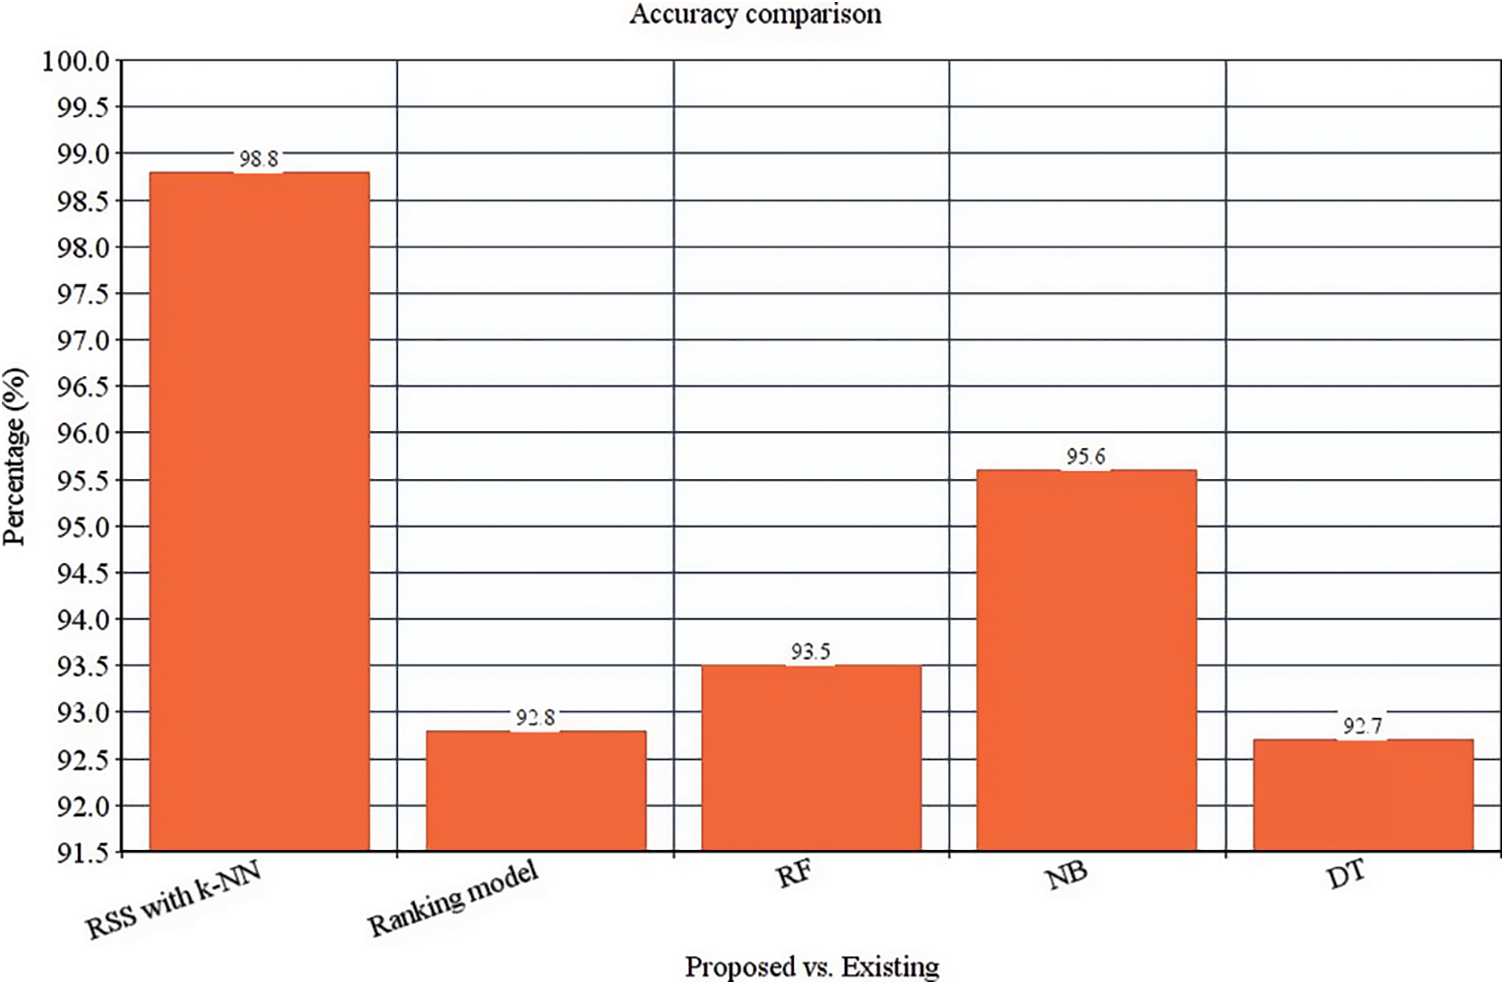
Figure 4: Accuracy computation
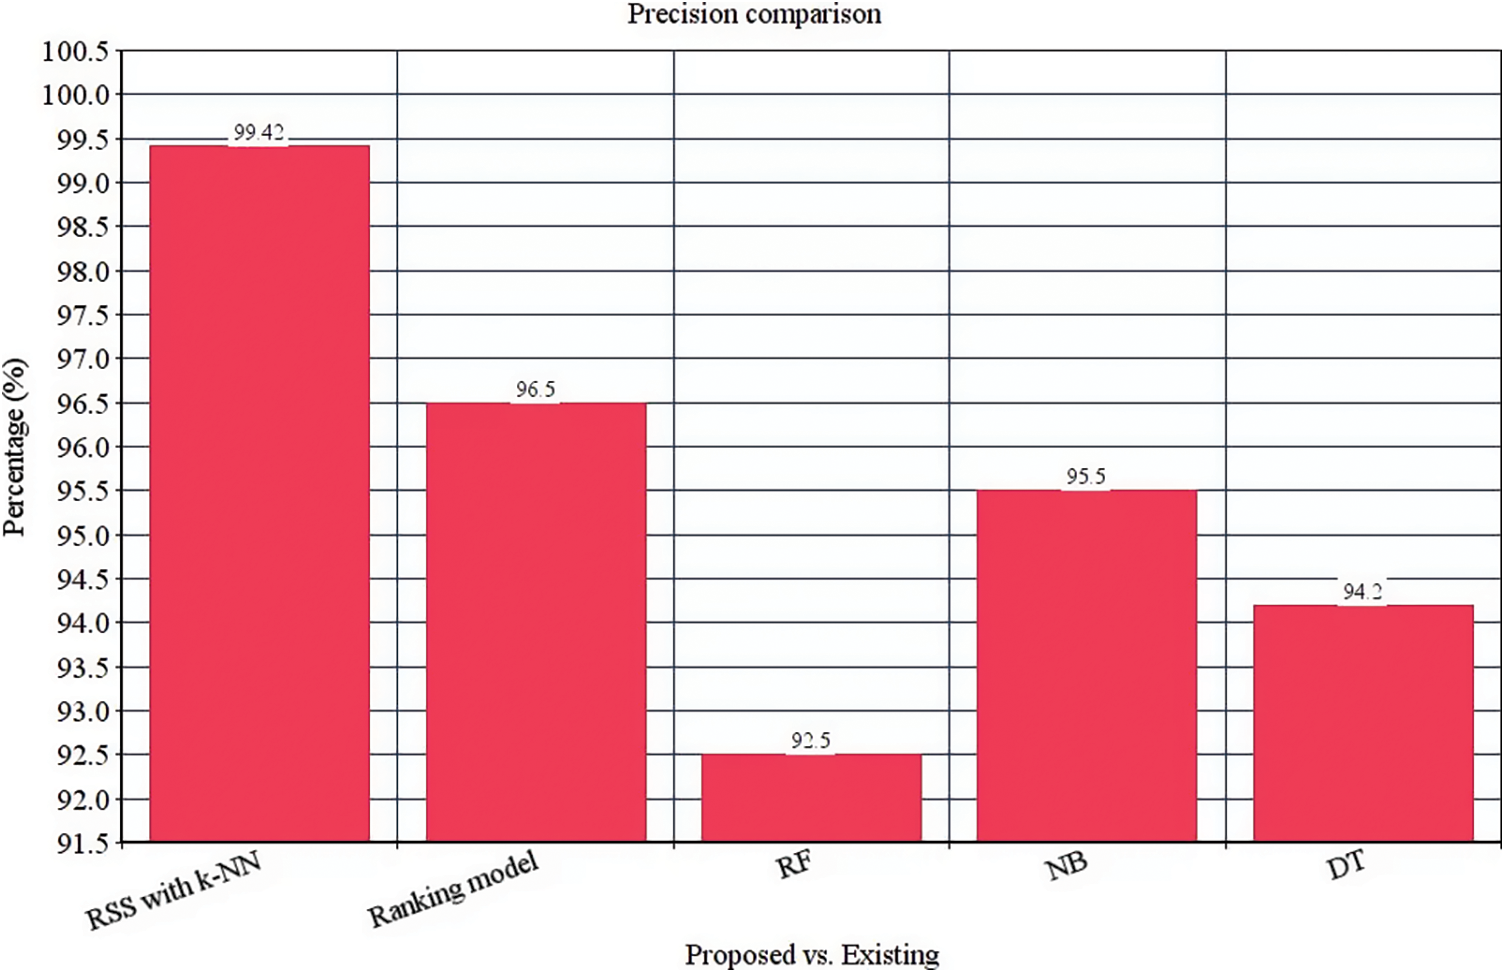
Figure 5: Precision computation
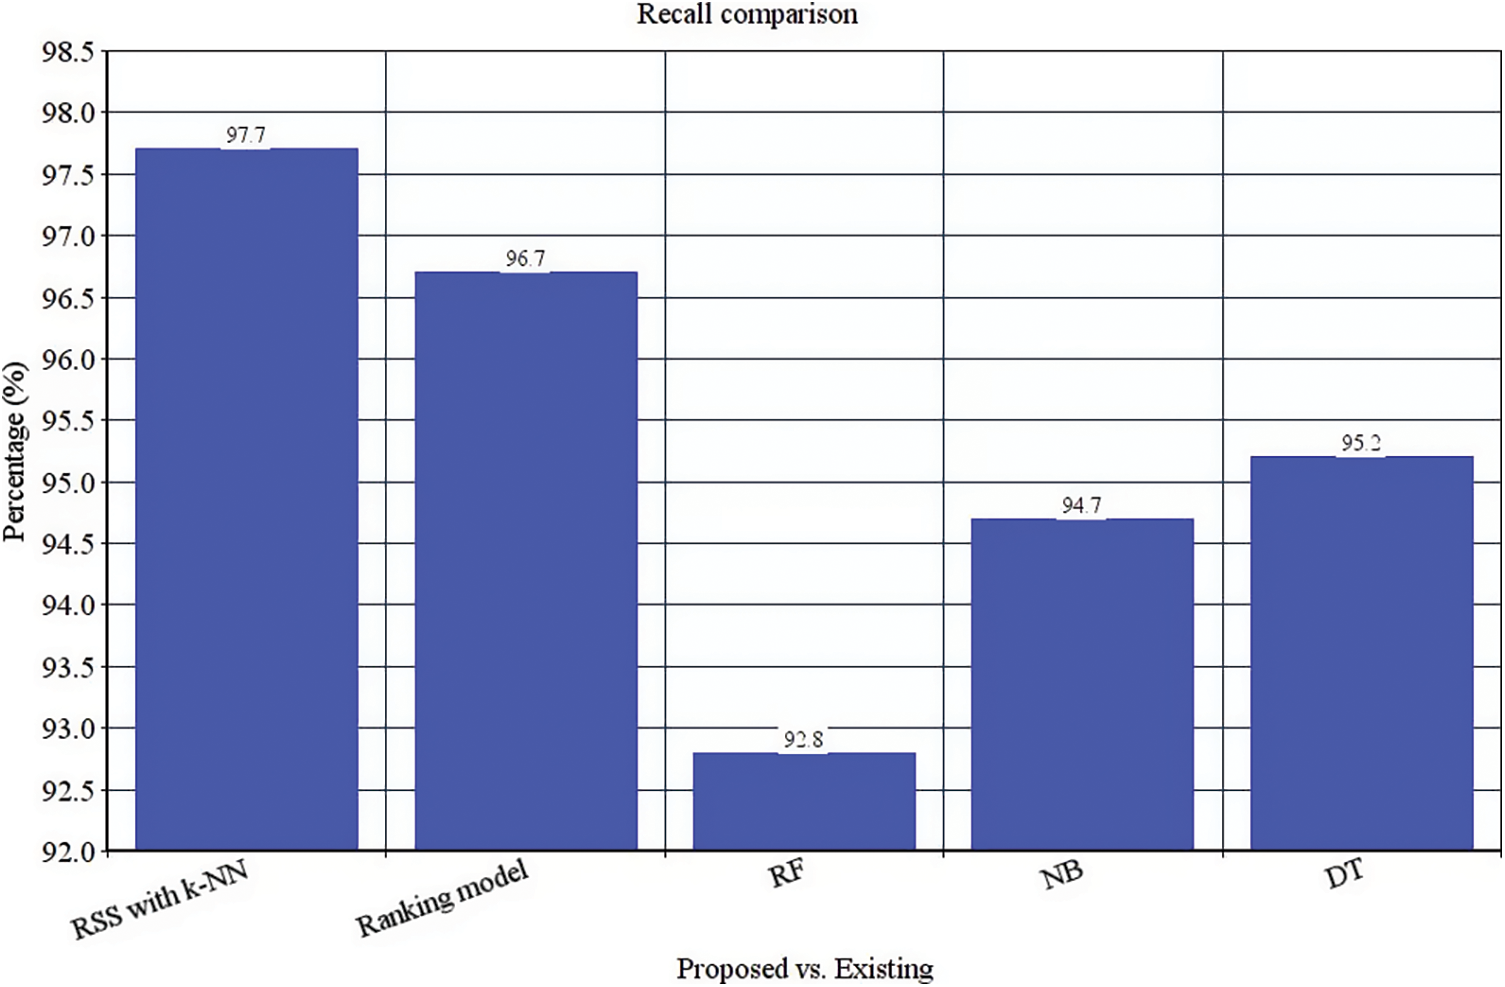
Figure 6: Recall comparison
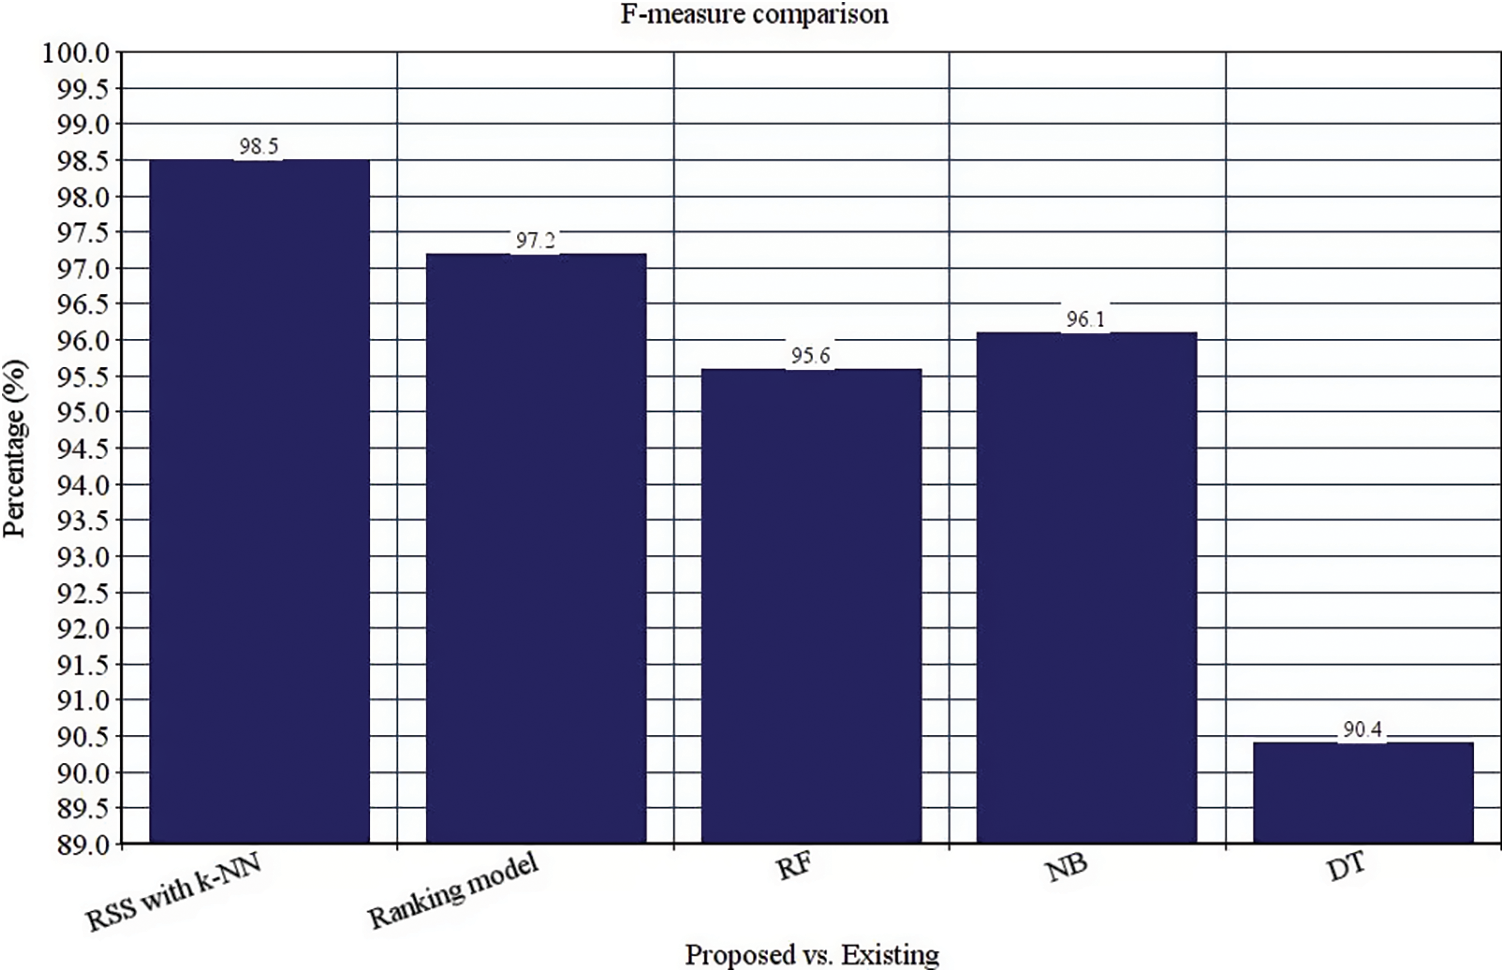
Figure 7: F-measure comparison
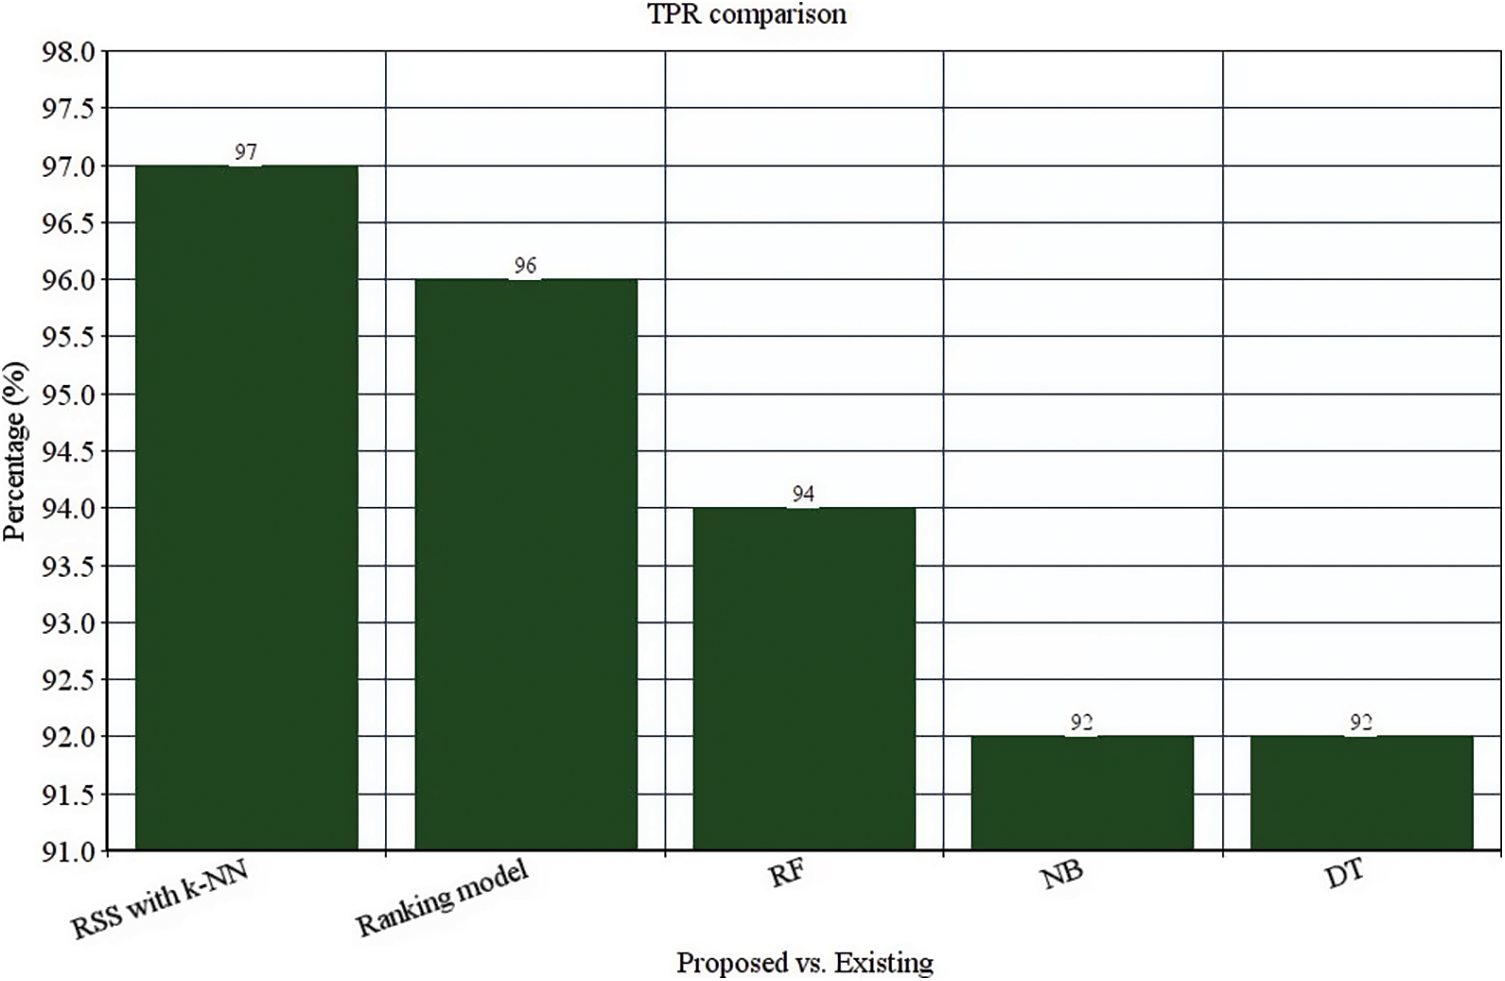
Figure 8: TPR comparison
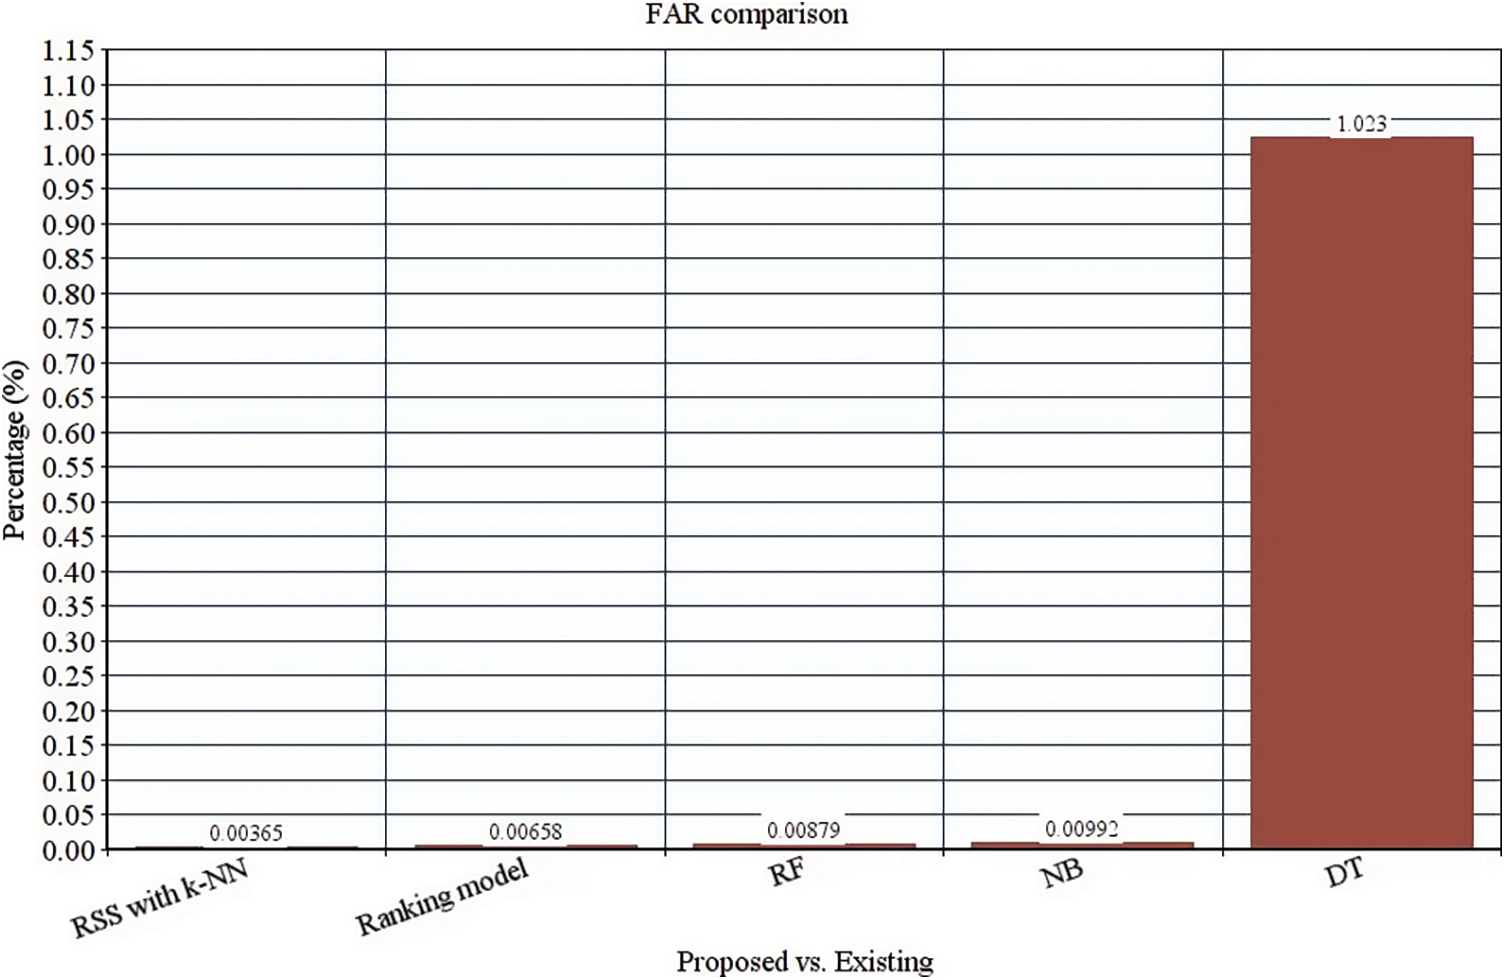
Figure 9: FAR comparison
Here, the performance of the anticipated model is compared in various scenarios. It specifically concentrates on the victim influenced by the attack over the OSN. The attacker establishes attack edges with the targeted users in the OSN users. Here, the initial scenario refers to the targeted attacks. In the successive method, regardless of whether the targeted users and the attackers have the same familiar friends, the attackers establish the attacking edge randomly over the targeted users. This work chooses to use the ROC curve to examine the efficiency of the detection approach. ROC is utilized frequently to project the graphical way of connectivity among the specificity and sensitivity for probable cut-off for various tests. A pivot point moves from the bottom with the sorted list. Else, the OSN thinks of it as a regular user. The work measures TPR and FPR and uses ROC to quantify the attack probability lower than usual. To examine the performance of the ensemble model, two attack scenarios are tested successively. Initially, an attacking edge needs to be set up, and the edge needs to increase gradually till the maximum amount of conditions is provided to replicate the experimentation. Here, ROC is measured for all the provided methods at every run. Here, more users are considered, and the order of
After successive experimentation, the work retrieves the outcome, and the experimental results prove that the model is superior to the testing environment, specifically when the number of attack edges increases. However, AUC is down trended; but generally higher than 0.93. Also, the proposed model demonstrates a downward trend, and the values are usually higher than or equal to 0.98. In an attack scenario, the regions are partitioned when the users are connected to the attacks like Sybil sparsely. Subsequently, all the provided methods work well when the number of attack edges is lesser. Similarly, when the number of attacks increases gradually, the AUC is decreased significantly. The anticipated model preserves the performance while the number of attacks increases and AUC decreases by 0.06.
In the preliminary victim scenario, with the increase in the total number of attacks, AUC remains around 0.96. However, the proposed model’s AUC decreases finally to 0.98. It is observed that the proposed model is superior to the existing detection approaches. In the following scenario, the anticipated model performance is excellent for the various systems like ranking, RF, NB, and DT. The proposed ensemble model maintains a higher performance, and the AUC is generally higher than 0.98. Therefore, it is concluded that the detection approach shows superior performance under the attack scenario.
Similarly, it is essential to consider an attack scenario experimentally to identify which users operate on OSN trusts. Thus, those attackers are established directly by the attack edges with the trusted environment and users, enhancing the ranking model. This sort of attack environment is termed a seed-targeting attack. This work intends to consider the other two attack environment where
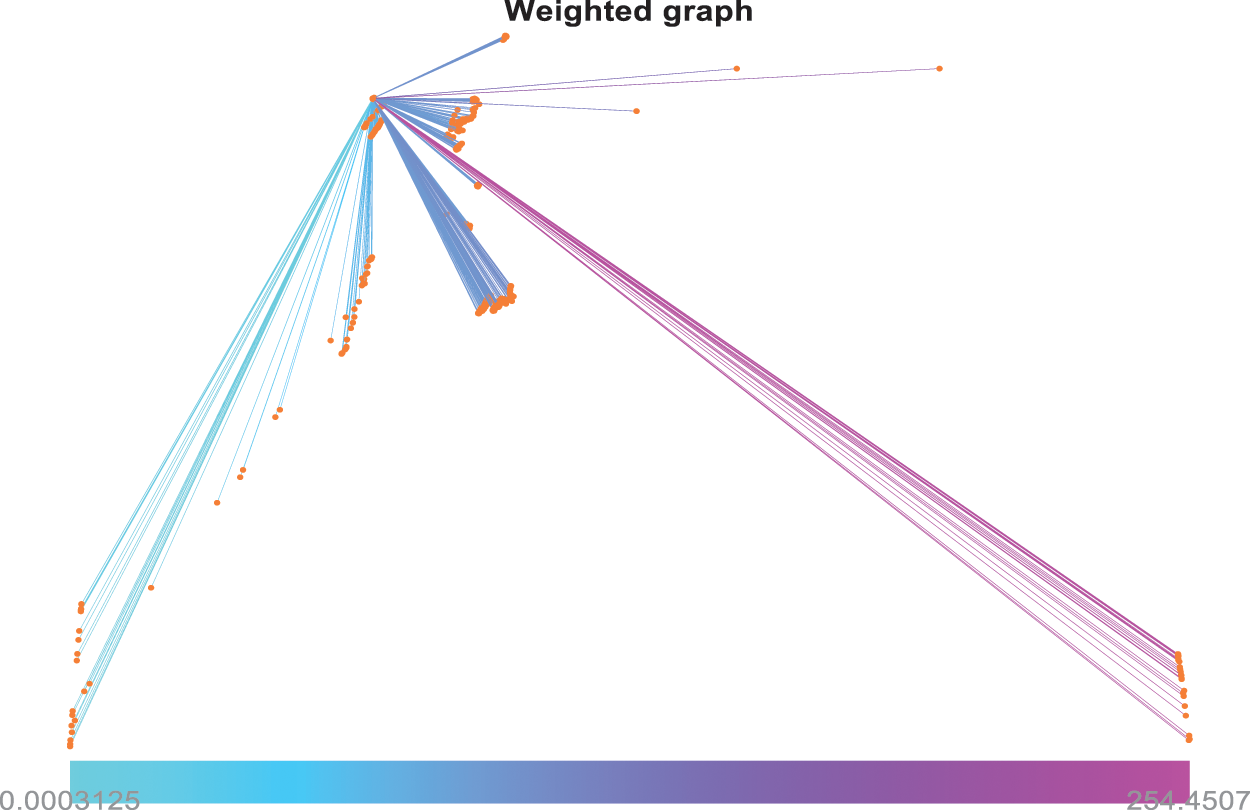
Figure 10: Weighted graph computation
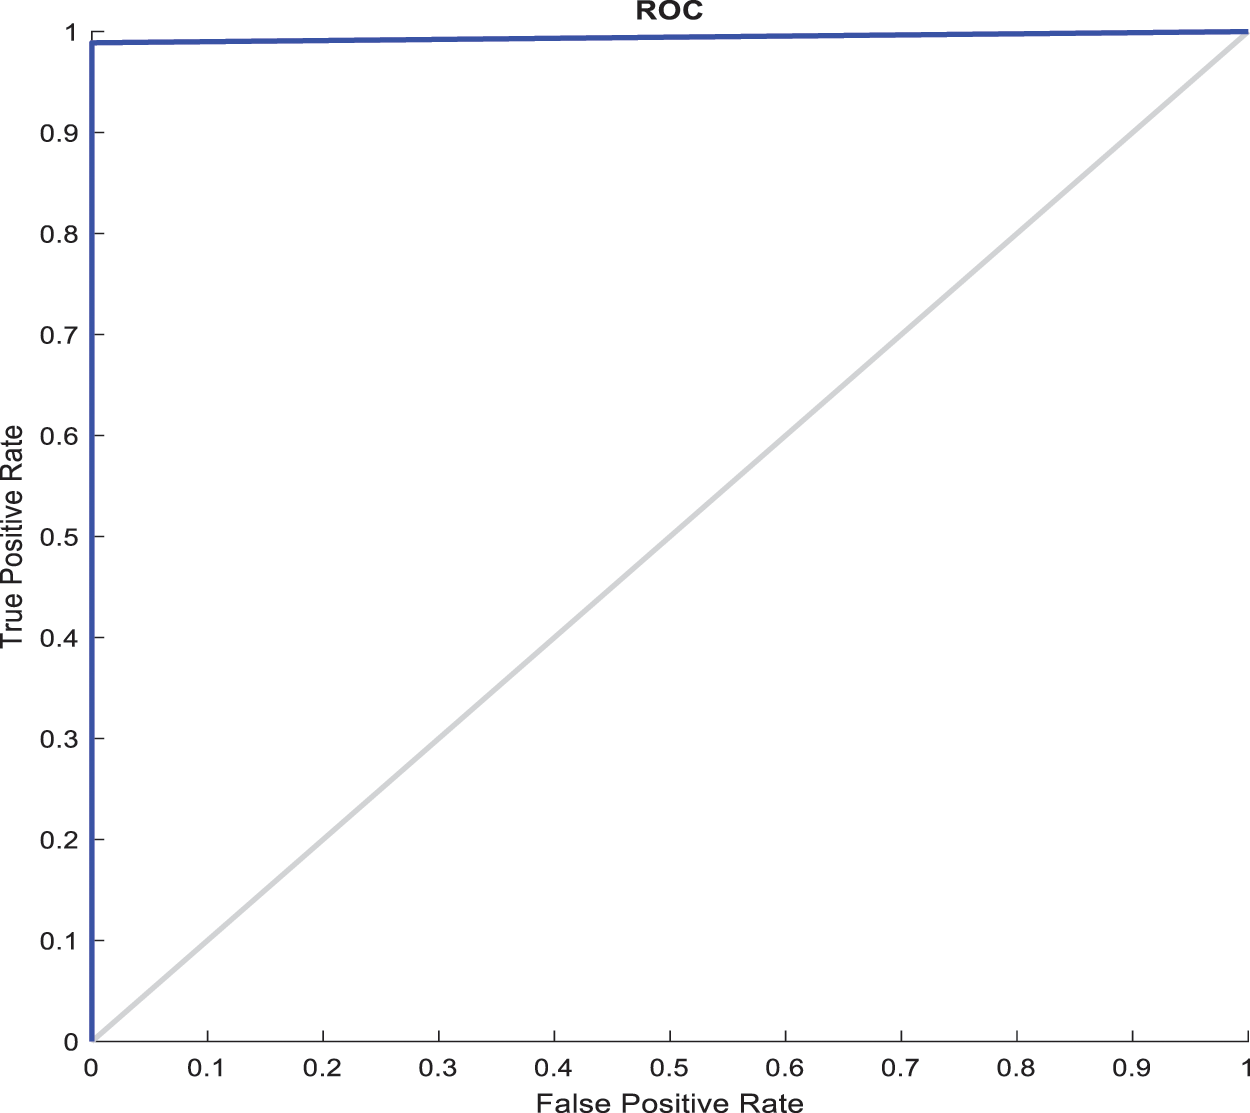
Figure 11: ROC computation
Based on the various analyses, it is known that attacks on OSN are common by some explosive growth which seriously influences the users’ security or privacy over the OSN. The nature of the attackers makes the normal OSN users behave themselves in a rude manner, which makes detecting these attacks over the OSN challenging tasks. To address these issues, this work concentrates on modeling an efficient classifier model to predict the flow of the provided dataset samples to enhance the efficiency of the detection process. Initially, this work examines the features set to attain better classification outcomes and predicts the victim or unaware users over the OSN. Here, a classifier model known as RSS is adopted with k-NN as a base classifier model to boost the performance of the weak classifier model. The classification outcome with the proposed ensemble model is superior to various existing approaches like NB, DT, RF, and ranking model. The attack traces are separated from the normal users based on the results. The anticipated model assists in the operation of OSN to efficiently predict the attack. The evaluation is done in the MATLAB 2020a simulation environment, and the numerical outcomes are compared with various prevailing approaches. Based on the experimentation, the performance of the anticipated model is superior to the other approach. Additionally, the anticipated ensemble model is measured as the best available scheme. Moreover, the running time of the ensemble model is
Funding Statement: The authors received no specific funding for this study.
Conflicts of Interest: The authors declare that they have no conflicts of interest to report regarding the present study.
References
1. Y. Wang, Q. Li, Z. Chen, P. Zhang and G. Zhang, “A survey of exploitation techniques and defenses for program data attacks,” Journal of Network and Computer Applications, vol. 154, pp. 102534, 2020. [Google Scholar]
2. S. Singh, P. K. Sharma, S. Y. Moon, D. Moon and J. H. Park, “A comprehensive study on APT attacks and countermeasures for future networks and communications: Challenges and solutions,” The Journal of Supercomputing, vol. 75, no. 8, pp. 4543–4574, 2019. [Google Scholar]
3. I. Ghafir, M. Hammoudeh, V. Prenosil, L. Han, R. Hegarty et al., “Detection of advanced persistent threat using machine-learning correlation analysis,” Future Generation Computer Systems, vol. 89, pp. 349–359, 2018. [Google Scholar]
4. I. Ghafir, K. G. Kyriakopoulos, S. Lambotharan, F. J. A. Navarro, B. Assadhan et al., “Hidden markov models and alert correlations for the prediction of advanced persistent threats,” IEEE Access, vol. 7, pp. 99508–99520, 2019. [Google Scholar]
5. M. G. R. Raman, N. Somu, K. Kirthivasan, R. Liscano and V. S. S. Sriram, “An efficient intrusion detection system based on a hypergraph-genetic algorithm for parameter optimization and feature selection in support vector machine,” Knowledge-Based Systems, vol. 134, pp. 1–12, 2017. [Google Scholar]
6. M. Hasan, M. M. Islam, M. I. I. Zarif and M. M. A. Hashem, “Attack and anomaly detection in IoT sensors in IoT sites using machine learning approaches,” Internet of Things, vol. 7, pp. 100059, 2019. [Google Scholar]
7. J. H. Joloudari, E. H. Joloudari, H. Saadatfar, M. Ghasemigol, S. M. Razavi et al., “Coronary artery disease diagnosis; ranking the significant features using random trees model,” International Journal of Environmental Research and Public Health, vol. 17, no. 3, pp. 731, 2020. [Google Scholar]
8. Q. Zhu, X. Jiang, Q. Zhu, M. Pan and T. He, “Graph embedding deep learning guide microbial biomarkers’ identification,” Frontiers in Genetics, vol. 10, pp. 1182, 2019. [Google Scholar]
9. G. Suarez-Tangil, J. E. Tapiador, P. Peris-Lopez and A. Ribagorda, “Evolution, detection, and analysis of malware for smart devices,” IEEE Communications Surveys & Tutorials, vol. 16, no. 2, pp. 961–987, 2014. [Google Scholar]
10. L. Onwuzurike, M. Almeida, E. Mariconti, J. Blackburn, G. Stringhini et al., “A family of droids-android malware detection via behavioral modeling: Static vs dynamic analysis,” in Proc. 16th Annual Conf. on Privacy, Security and Trust (PST), Belfast, Ireland, pp. 1–10, 2018. [Google Scholar]
11. A. Firdaus, N. B. Anuar, A. Karim and M. F. A. Razak, “Discovering optimal features using static analysis and a genetic search-based method for android malware detection,” Frontiers of Information Technology & Electronic Engineering, vol. 19, no. 6, pp. 712–736, 2018. [Google Scholar]
12. L. Cen, C. S. Gates, L. Si and N. Li, “A probabilistic discriminative model for android malware detection with decompiled source code,” IEEE Transactions on Dependable Secure Computing, vol. 12, no. 4, pp. 400–412, 2015. [Google Scholar]
13. E. M. B. Karbab, M. Debbabi, A. Derhab and D. Mouheb, “MalDozer: Automatic framework for android malware detection using deep learning,” Digital Investigation, vol. 24, pp. S48–S59, 2018. [Google Scholar]
14. L. Taheri, A. F. A. Kadir and A. H. Lashkari, “Extensible android malware detection and family classification using network-flows and APIcalls,” in Proc. of Int. Carnahan Conf. on Security Technology (ICCST), Chennai, India, pp. 1–8, 2019. [Google Scholar]
15. P. S. Chen, S. C. Lin and C. H. Sun, “Simple and effective method for detecting abnormal internet behaviors of mobile devices,” Information Sciences, vol. 321, pp. 193–204, 2015. [Google Scholar]
16. P. Wang and Y. S. Wang, “Malware behavioural detection and vaccine development by using a support vector model classifier,” Journal of Computer and System Sciences, vol. 81, no. 6, pp. 1012–1026, 2015. [Google Scholar]
17. N. Moustafa, J. Hu and J. Slay, “A holistic review of network anomaly detection systems: A comprehensive survey,” Journal of Network and Computer Applications, vol. 128, pp. 33–55, 2019. [Google Scholar]
18. S. Peng, S. Yu and A. Yang, “Smartphone malware and its propagation modeling: A survey,” IEEE Communications Surveys & Tutorials, vol. 16, no. 2, pp. 925–941, 2013. [Google Scholar]
19. J. Gardiner and S. Nagaraja, “On the security of machine learning in malware C&C detection: A survey,” ACM Computing Surveys, vol. 49, no. 3, pp. 1–39, 2016. [Google Scholar]
20. G. Vormayr, T. Zseby and J. Fabini, “Botnet communication patterns,” IEEE Communications Surveys & Tutorials, vol. 19, no. 4, pp. 2768–2796, 2017. [Google Scholar]
21. S. M. Erfani, S. Rajasegarar, S. Karunasekera and C. Leckie, “Highdimensional and large-scale anomaly detection using a linear one-class SVM with deep learning,” Pattern Recognition, vol. 58, pp. 121–134, 2016. [Google Scholar]
22. M. G. Prez, A. H. Celdran, F. Ippoliti, P. G. Giardnia, G. Bernini et al., “Dynamic reconfiguration in 5G mobile networks to proactively detect and mitigate botnets,” IEEE Internet Computing, vol. 21, no. 5, pp. 28–36, 2017. [Google Scholar]
23. Z. Zhang and K. Wang, “A trust model for multimedia social networks,” Social Network Analysis and Mining, vol. 3, no. 4, pp. 969–979, 2013. [Google Scholar]
24. V. Natarajan, S. Sheen and R. Anitha, “Detection of StegoBot: A covert social network botnet,” in Proc. of the First Int. Conf. on Security of Internet of Things, Kollam, India, NY, USA, pp. 36–41, 2012. [Google Scholar]
25. B. Li, Y. Wang, A. Singh and Y. Vorobeychik, “Data poisoning attacks on factorization-based collaborative filtering,” Advances in Neural Information Processing Systems (NIPS), vol. 29, pp. 1885–1893, 2016. [Google Scholar]
26. Y. Dong, N. V. Chawla, J. Tang and Y. Yang, “User modeling on demographic attributes in big mobile social networks,” ACM Transactions on Information Systems (TOIS), vol. 35, no. 4, pp. 1–33, 2017. [Google Scholar]
27. D. C. Wilson and C. E. Seminario, “Evil twins: Modeling power users in attacks on recommender systems,” User Modeling, Adaptation, and Personalization, User Modeling, Adaptation, and Personalization, Lecture Notes in Computer Science, vol. 8538, pp. 231–242, 2014. https://doi.org/10.1007/978-3-319-08786-3_20. [Google Scholar]
28. Y. Zhang, Y. Tan, M. Zhang, Y. Liu, T. Chua et al., “Catch the black sheep: Unified framework for shilling attack detection based on fraudulent action propagation,” in Proc. of the Twenty-Fourth Int. Joint Conf. on Artificial Intelligence (IJCAI), Buenos Aires, Argentina, pp. 2408–2414, 2015. [Google Scholar]
29. Z. Yang, Z. Cai and Y. Yang, “Spotting anomalous ratings for rating systems by analyzing target users and items,” Neurocomputing, vol. 240, pp. 25–46, 2017. [Google Scholar]
30. B. Wang, J. Jia and N. Z. Gong, “Graph-based security and privacy analytics via collective classification with joint weight learning and propagation,” in Network and Distributed Systems Security (NDSS) Symposium, San Diego, CA, USA, pp. 1–15, 2019. [Google Scholar]
31. W. Sun, G. Z. Dai, X. R. Zhang, X. Z. He and X. Chen, “TBE-Net: A three-branch embedding network with part-aware ability and feature complementary learning for vehicle re-identification,” IEEE Transactions on Intelligent Transportation Systems, pp. 1–13, 2021. [Online]. Available: https://doi.org/10.1109/TITS.2021.3130403. [Google Scholar]
32. W. Sun, L. Dai, X. R. Zhang, P. S. Chang and X. Z. He, “RSOD: Real-time small object detection algorithm in UAV-based traffic monitoring,” Applied Intelligence, vol. 52, no. 1, pp. 8448–8463, 2021. https://doi.org/10.1007/s10489-021-02893-3. [Google Scholar]
33. V. C. Vani, “Performance analysis of emotion classification using multimodal fusion technique,” Journal of Computational Science and Intelligent Technologies, vol. 2, no. 1, pp. 14–20, 2021. [Google Scholar]
34. S. P. Sasirekha, A. Priya, T. Anitha, P. Sherubha, “Data processing and management in IoT and wireless sensor network,” Journal of Physics: Conference Series, vol. 1712, no. 1, pp. 012002, 2020. [Google Scholar]
35. R. Khilar, K. Mariyappan,M. S. Christo, J. Amutharaj, T. Anitha et al., “Artificial intelligence-based security protocols to resist attacks in Internet of Things,” Wireless Communications and Mobile Computing, vol. 2022, no. 1440538, pp. 1–10, 2022. [Google Scholar]
Cite This Article
 Copyright © 2023 The Author(s). Published by Tech Science Press.
This work is licensed under a Creative Commons Attribution 4.0 International License , which permits unrestricted use, distribution, and reproduction in any medium, provided the original work is properly cited.
 Downloads
 Citation Tools