DOI:10.32604/iasc.2023.028423
| Intelligent Automation & Soft Computing DOI:10.32604/iasc.2023.028423 | |
| Article |
Qualitative Abnormalities of Peripheral Blood Smear Images Using Deep Learning Techniques
1Anna University, Tamil Nadu, India
2Department of CSE, National Institute of Technology, SilcharCachar, Assam, India
3Department of CSE, Government College of Engineering, Salem, Tamilnadu, India
4Department of Physics, National Institute of Technology, SilcharCachar, Assam, India
*Corresponding Author: G. Arutperumjothi. Email: arutperumjothi21phd@gmail.com
Received: 09 February 2022; Accepted: 15 March 2022
Abstract: In recent years, Peripheral blood smear is a generic analysis to assess the person’s health status. Manual testing of Peripheral blood smear images are difficult, time-consuming and is subject to human intervention and visual error. This method encouraged for researchers to present algorithms and techniques to perform the peripheral blood smear analysis with the help of computer-assisted and decision-making techniques. Existing CAD based methods are lacks in attaining the accurate detection of abnormalities present in the images. In order to mitigate this issue Deep Convolution Neural Network (DCNN) based automatic classification technique is introduced with the classification of eight groups of peripheral blood cells such as basophil, eosinophil, lymphocyte, monocyte, neutrophil, erythroblast, platelet, myocyte, promyocyte and metamyocyte. The proposed DCNN model employs transfer learning approach and additionally it carries three stages such as pre-processing, feature extraction and classification. Initially the pre-processing steps are incorporated to eliminate noisy contents present in the image by using Histogram Equalization (HE). It is enclosed to improve an image contrast. In order to distinguish the dissimilar class and segmentation approach is carried out with the help of Fuzzy C-Means (FCM) model whereas its centroid point optimality method with Slap Swarm based optimization strategy. Moreover some specific set of Gray Level Co-occurrence Matrix (GLCM) features of the segmented images are extracted to augment the performance of proposed detection algorithm. Finally the extracted features are recorded by DCNN and the proposed classifier has the capability to extract their own features. Based on this the diverse set of classes are classified and distinguished from qualitative abnormalities found in the image.
Keywords: Peripheral blood smear; DCNN classifier; pre-processing; segmentation; feature extraction; salp swarm optimization; classification
Peripheral blood smear (PBS) [1] is a standard laboratory procedure performed to assess a person’s health. Microscopic examination is utilized to determine the cause of the disease and thus offers a appropriate treatment to the affected person. Analysis begins from blood sample collection, peripheral blood smear analysis and blood cell examination under the microscope. Typically peripheral blood consists of three cells namely, red blood cells (RBCs), whiteblood cells (WBCs) and platelets [2]. WBCs can be of five diverse categories namely eosinophil, neutrophil, lymphocyte, basophil and monocyte. Each cell possess different shape, size, texture and color. The diversity of these factors and the number of cell occurrences are recognized and documented in laboratories [3]. Manually the physicians observes the size and distribution of RBCs followed by the maturation of WBCs, their cytoplasmic changes and nucleus strength and platelets by their count and appearance. Manual microscopic testing comprises of two types of quantitative analysis and qualitative analysis [4]. The analysis of Quantitative measure is calculated for blood cells. This includes two forms of calculation or counting methods namely complete blood count (CBC) and differential count (DC). CBC offers the total number of WBCs, where as in RBCs and platelets, the DC provides counts for each type of WBC in the boundary blood [5]. Automatic cell counters can be utilized by CBC to calculate the number of cells based on secondary parameters such as density or cell impedance, but morphological analysis is mostly done manually.
Both quantitative and qualitative analysis play an important role in diagnosing many diseases. Moreover, incorrect counting or the appearance of blood cells indicates an abnormal condition [6]. Malaria, Sickle cell anemia, Anemia, polycythemiaandhemolytic syndrome are some of the diseases instigated by RBC complications. WBC abnormalities are detected in the event of neutrophila, neutropenia, basophilia, eosinophilia, lymphoma, leukemia, fungal infections and HIV, parasitic. Leukemia is the only disease commonly diagnosed with PBS analysis [7]. Platelet-related disorders are myeloproliferative complications and thrombocytopenia [8]. Kidney disease, hypothyroidism and Liver disease have also been identified using blood smear analysis. Throughout a manual examination, pathologists place a slide with a blood smear under a microscope and store all blood components [9]. They look different at the structure, color, size, texture and calculation of WBC, platelets and RBCs. Any unusual appearance or deviations from the normal appearance of each blood component are considered abnormal and additional appropriate tests are performed to reach a diagnostic conclusion. Therefore, an automated system of diagnostic objectives should be intended to comply with the screening process in demand to detect unusual cases properly. Test results may vary between labs [10]. It rest on the expertise and skill of the specialist, the equipment and methods used to analyze the blood sample. Manual microscopic testing is time consuming and results show no duplication.
Many academics have attempted to fetch automated decision making method to the test of blood cells by means of image processing. In this circumstances image processing has become one of the most common diagnostic and therapeutic models in the previous few decades [11]. An automated system for diagnostic purposes is designed to match with human evaluation process in order to identify abnormal cases appropriately and eliminate the need for manual evaluation by a pathologist [12]. The automated system of diagnostic objectives is designed to be in line with the screening process in order to detect abnormal cases and eliminate the need for a personal examination by a pathologist. These automated processes have the ability to handle brightness and shade variation in an input blood smear images and limit manual testing in those regions making it highly feasible for telemedicine use [13]. The state-of-the-art techniques utilized a variety of classifiers for the principle of PBS image analysis. Majority of research groups used support vector machine classifier and artificial neural network classification model. These Machine learning models lacks in extracting relevant features present in an image [14]. In the recent years use of deep learning approach can be observed as an effective source for decision making process. It has the capacity to autromatically extract the relevant set of features, additionally it follows the handcrafted features for an effective detection rate.
The manuscript is organized as follows: Section 2 details about the literature survey. In Section 3, research gap are elaborated. Further Section 4 discusses research methodologies. Section 5 demonstrates experimental results and discussions. Conclusion and future scope are provided in the final section.
The convential practice of blood tests with a Peripheral smear is done by hand by a pathologist under a bright microscope. However, manual observation testing is a difficult task and relies on submissive testing that leads to changes in the RBC identification and calculation. Therefore, the automated system of diagnostic principles should be designed to contest the screening process in order to detect abnormal cases appropriately. Some of the recent Peripheral blood smear analysis is reviewed as follows.
In the earlier year 2012, Hegde et al. [15], introduced an automated leukocyte hunting program to assist biologists in examining the process. With the textural based co-occurrence matrix, features related to leukocyte were extracted in terms of categorizing anailment. But it does not have a valid detection rate. Lately in 2016, Manikandan et al. [16], explored a multilevel thresholding based image segmentation process for grey level image and its threshold value was optimally seleted by means of Cat Swarm Optimization (CSO). Furthermore in 2018, Vogado et al. [17] exhibited a method for peripheral blood smear analysis to check the health status of patients. The presented model includes WBC investigation, RBC investigation and platelet investigation. It was needed for studies on mechanization of peripheral blood smudge exploration to emphasis on expansion of healthy technique to manage light and color shade differences. In the same year 2018, Ansar et al. [18] anticipated computer-aided systems to reduce the probability of recommending unsuitable actions and help experts in the analysis of this illness. There was a mounting usage of Convolutional Neural Networks (CNNs) in the cataloguing and analysis of medical image difficulties. The suggested procedure goals to properly categorise images with diverse features resulting from diverse image databanks and do not necessitate a division procedure.
Similarly in 2019, Huang et al. [19] had demonstrated cataloguing of white blood cells into six kinds viz. lymphocytes, monocytes, neutrophils, eosinophils, basophils and abnormal cells. They offer the assessment of outmoded image processing method and profound learning approaches for cataloguing white blood cells. They appraised neural network classifier outcomes for hand-crafted structures. As recently as 2021, Paul et al. [20] showed a way to differentiate and identify different RBCs in smear input images. In this presented method, the central pallor and all cell information are used, after which the color processing was applied followed by a double block of blood smear images. The shape and size of the cells included the identification of abnormalities in permeheral smear images. Singh et al. [21] investigated the separation methods for the purpose of the WBC calculation based on the color band capturing process. Color space adjustment was based on the color space L∗a∗ b ∗was used to create the intensity of the image color intensity. The separation process was then carried out to cut the WBC region back by combining color analysis of RGB, CMYK and HSV with Otsu thresholding. Connected Component Labelling (CCL) [22] was developed to separate small particles that were still in the image. Finally, the Circle Hough Transform (CHT) [23] was used to identify and calculate the WBC including the one in the clump region.
The state of the art technique has used a variety of automatic and non-automated methods to identify the abnormalities present in the Peripheral blood smear. Major problems are identified after critical analysis of the literature review, some of which are described below for their intended purpose.
• Microscopic images are affected by varying illumination factor and shade for each input. This variation occurs due to a conflicting staining process, light source and imaging variability leading to invariations [24]. For that reason image analysis based on pre-processing and feature representation measures is essential to overcome those issues.
• Acquisition of images under a controlled environment may overcome the issues listed above but it does not always work to follow such principles. It is therefore desirable in automatic studies of peripheral blood smear analysis to focus on the development of a robust approach to managing this variability [25].
• Another major issue confined to automatic Peripheral blood smear testing is that it wont found in accurate diagnosis. Therefore the main purpose of Peripheral blood smear analysis is gather information to diagnose and detect the disease effectively [26].
Due to the aforementioned research gaps identified from the existing techniques with respect to PBS analysis motivated to do research in this field by proposing a novel automatic classification system [27,28]. Thus, it is necessary to develop a new methodology to overcome the afore-mentioned difficulties in an effective manner.
Generally, PBS is tested to diagnose problems related to blood and, in some cases, to detect parasites in the bloodstream. Many disorders such as malaria, anemia, leukemia, thrombocytopenia, sickle cell anemiaetc., can be detected by examining blood cells. Many groups have reported ways to perform automatic smear analysis to detect the presence of specific diseases for diagnostic purposes. The automated process based on photographs is fast and accurate in the analysis of blood cells morphology that saves the time of both patients and those of patients. In this manner, qualitative abnormality based deep learning model is proposed for PBS classification. The layout of the proposed methology is depicted in Fig. 1.
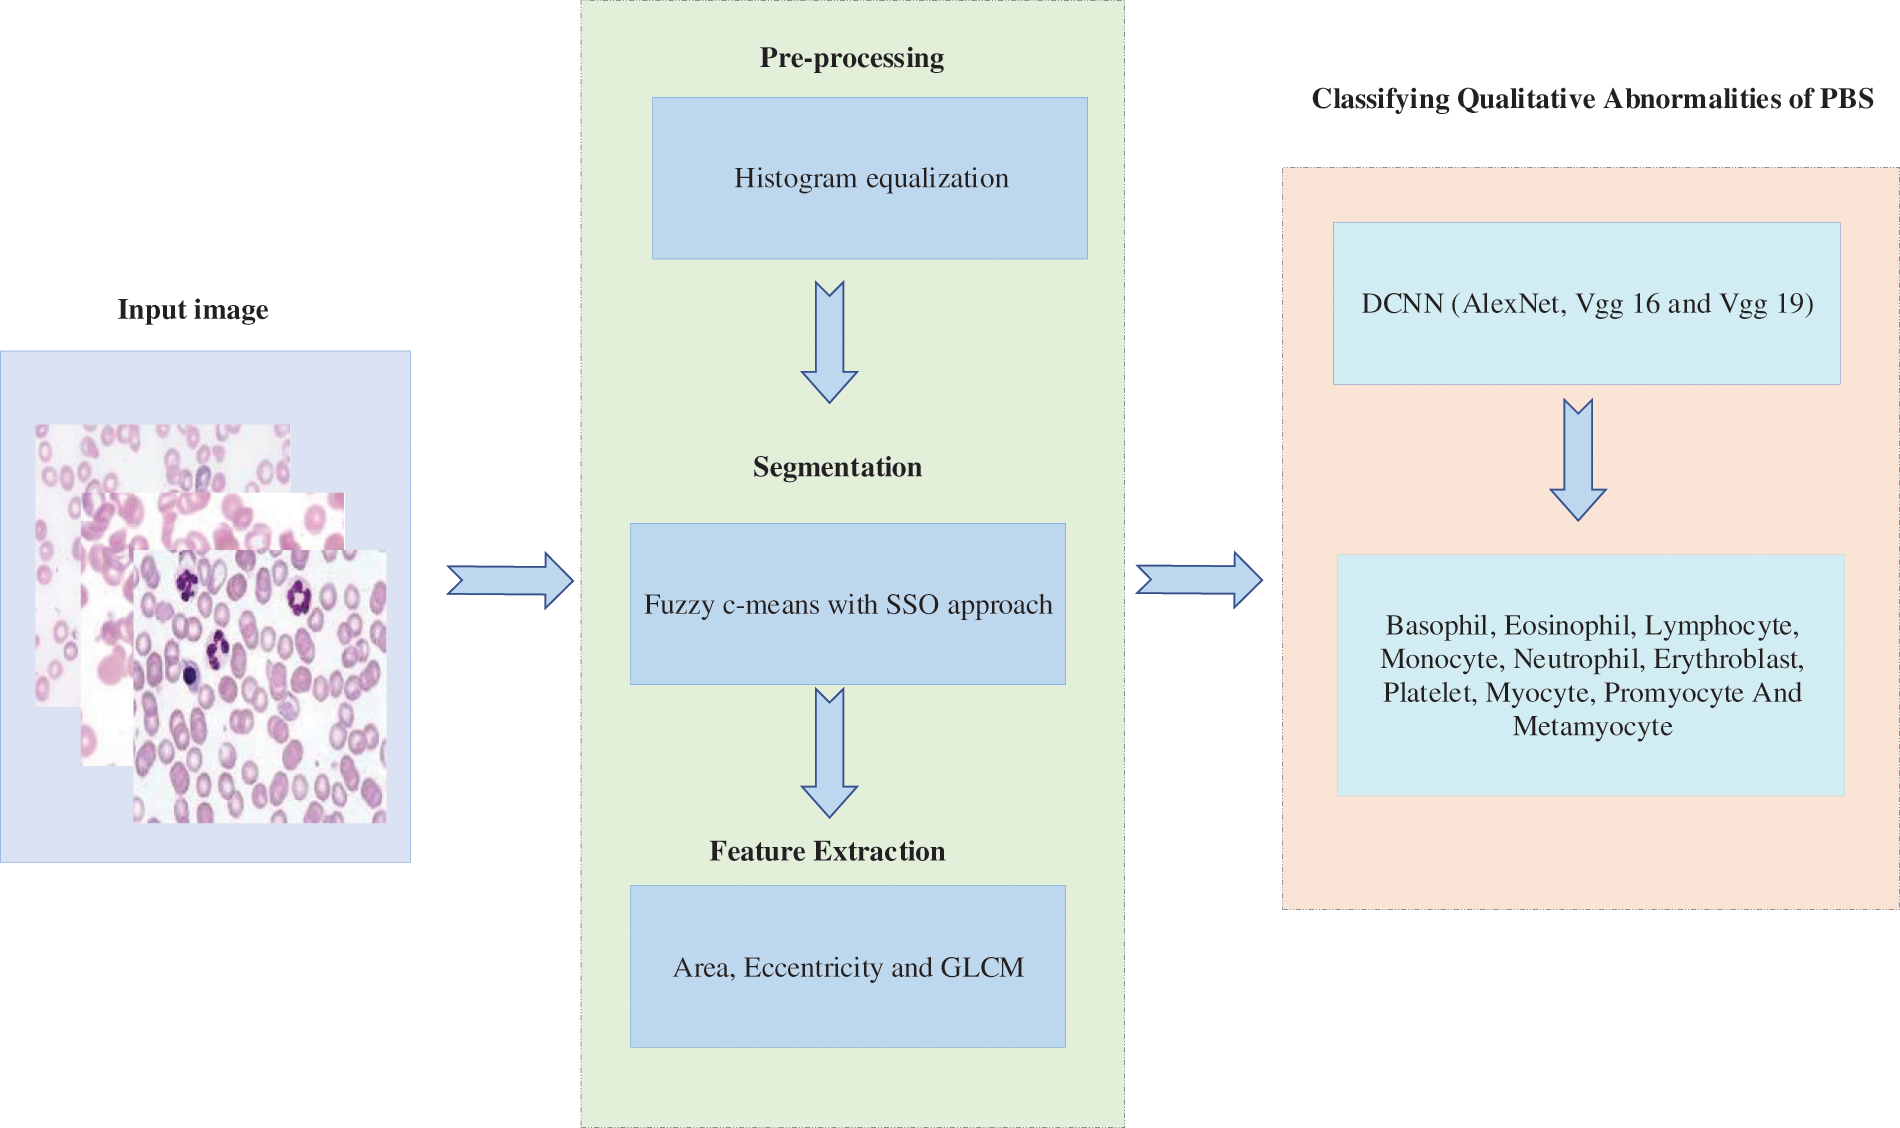
Figure 1: Block diagram of research methodology
Initially, input PBS image is subjected to the pre-processing procedure whereas histogram equalization is done to enhance the corresponding image. To segment similar images, fuzzy c-means based segmentation is incorporated along with slap swarm optimization procedure. Afterwards feature extraction module is performed on the basis of geometrical funaction and GLCM method. Finally DCNN is proposed to train these features as well as to extract the in-dept features automatically. The output of the proposed classification model involves eight set of probabilities in terms of basophil, eosinophil, lymphocyte, monocyte, neutrophil, erythroblast, platelet, myocyte, promyocyte and metamyocyte. The proposed method is implemented in the Mathematical Laboratory (MATLAB) platform and it is compared with the existing methods of Convolution Neural Network (CNN), Deep Neural Network (DNN) and Artificial Neural Network (ANN) respectively. Our hypothesis is that if the results of the classification are good with the approach one, they may improve when implementing the DCNN approach. In any case, the system’s output is a set of eight probabilities (one per class).
4.1 Pre-Processing Using Histogram Equalization
The ultimate of pre-processing procedure is to eliminate noisy contents present in an input PBS image. Additionally, this procedure aims to equalize dissimilar characteristics image carried for further steps. In this paper, histogram equalization is introduced to remove the noise and illumination from the input blood smear images. Before performing histogram equalization, input PBS image with RGB color space can be converted in to the gray scale image. The grey scale image have the single value output bit whereas RGB image have the three different types of values and is represented as follows.
Eq. (1) offers the outcome of gray scale image and lies in the range of [0, L − 1]. After obtaining greay scale image, its histogram equalization of the particular image is determined based on the following expression,
where, RK can be represented as kth grey level and MK can be represented as number of pixels having a grey level RK. Generally, a normalized histogram is presented below,
where M is the total number of pixels and k = 0, 1, …, L − 1. When the histogram is forced to be uniform, the transformation process is termed as histogram equalization, as shown below,
where R indicates the limit of colour space, its transformation function is denoted as t(R) and it might be (a) single valued (b) monotonically rising from 0 to 1 and (c) and lies in between 0 ≤ t(R) ≤ 1 for 0 ≤ R ≤ 1:if the transformation operation doesn’t increasing monotonically, then it is probable to change the gray levels in the outcome image. The inverse function of transformation ranges from s to r and is mathematically formulated as,
With the utilization of the HE, the images is done with pre-processing procedure by following the above equations. The pre-processed outcome image is subjected to proposed segmentation technique.
4.2 Optimization Based Fuzzy C-Means Segmentation Approach
In automatic blood cells examination, segmentation plays a vital role for locating individual cell type and grouping similar cell found in PBS analysis. The segmentation of blood smear images are attained with the consumption of the Optimization based Fuzzy c-means segmentation approach. The proposed segmentation approach assists the system to assign membership function with every data point corresponding to each center of cluster in an image and the distance based to the center cluster. Furthermore, the neighbouring data to center cluster of an PBS pre-processed image is performed through the specified center of cluster. The iterations are proceeded with centres cluster and is rationalized according on the equations,
While, the number of data points are represented as,N, Vj stands for jth center cluster m be index of fuzziness
Therefore, the Euclidean detachment ||xi − vj|| involving ith data and jth in middle cluster. Assume the group of information point X = {x1, x2, x3 …, xn} and V = {v1, v2, v3 …, vc} is the center set. The step wise step procedure is followed as below, Tab. 1 presents the steps of Fuzzy-C means segmentation method.
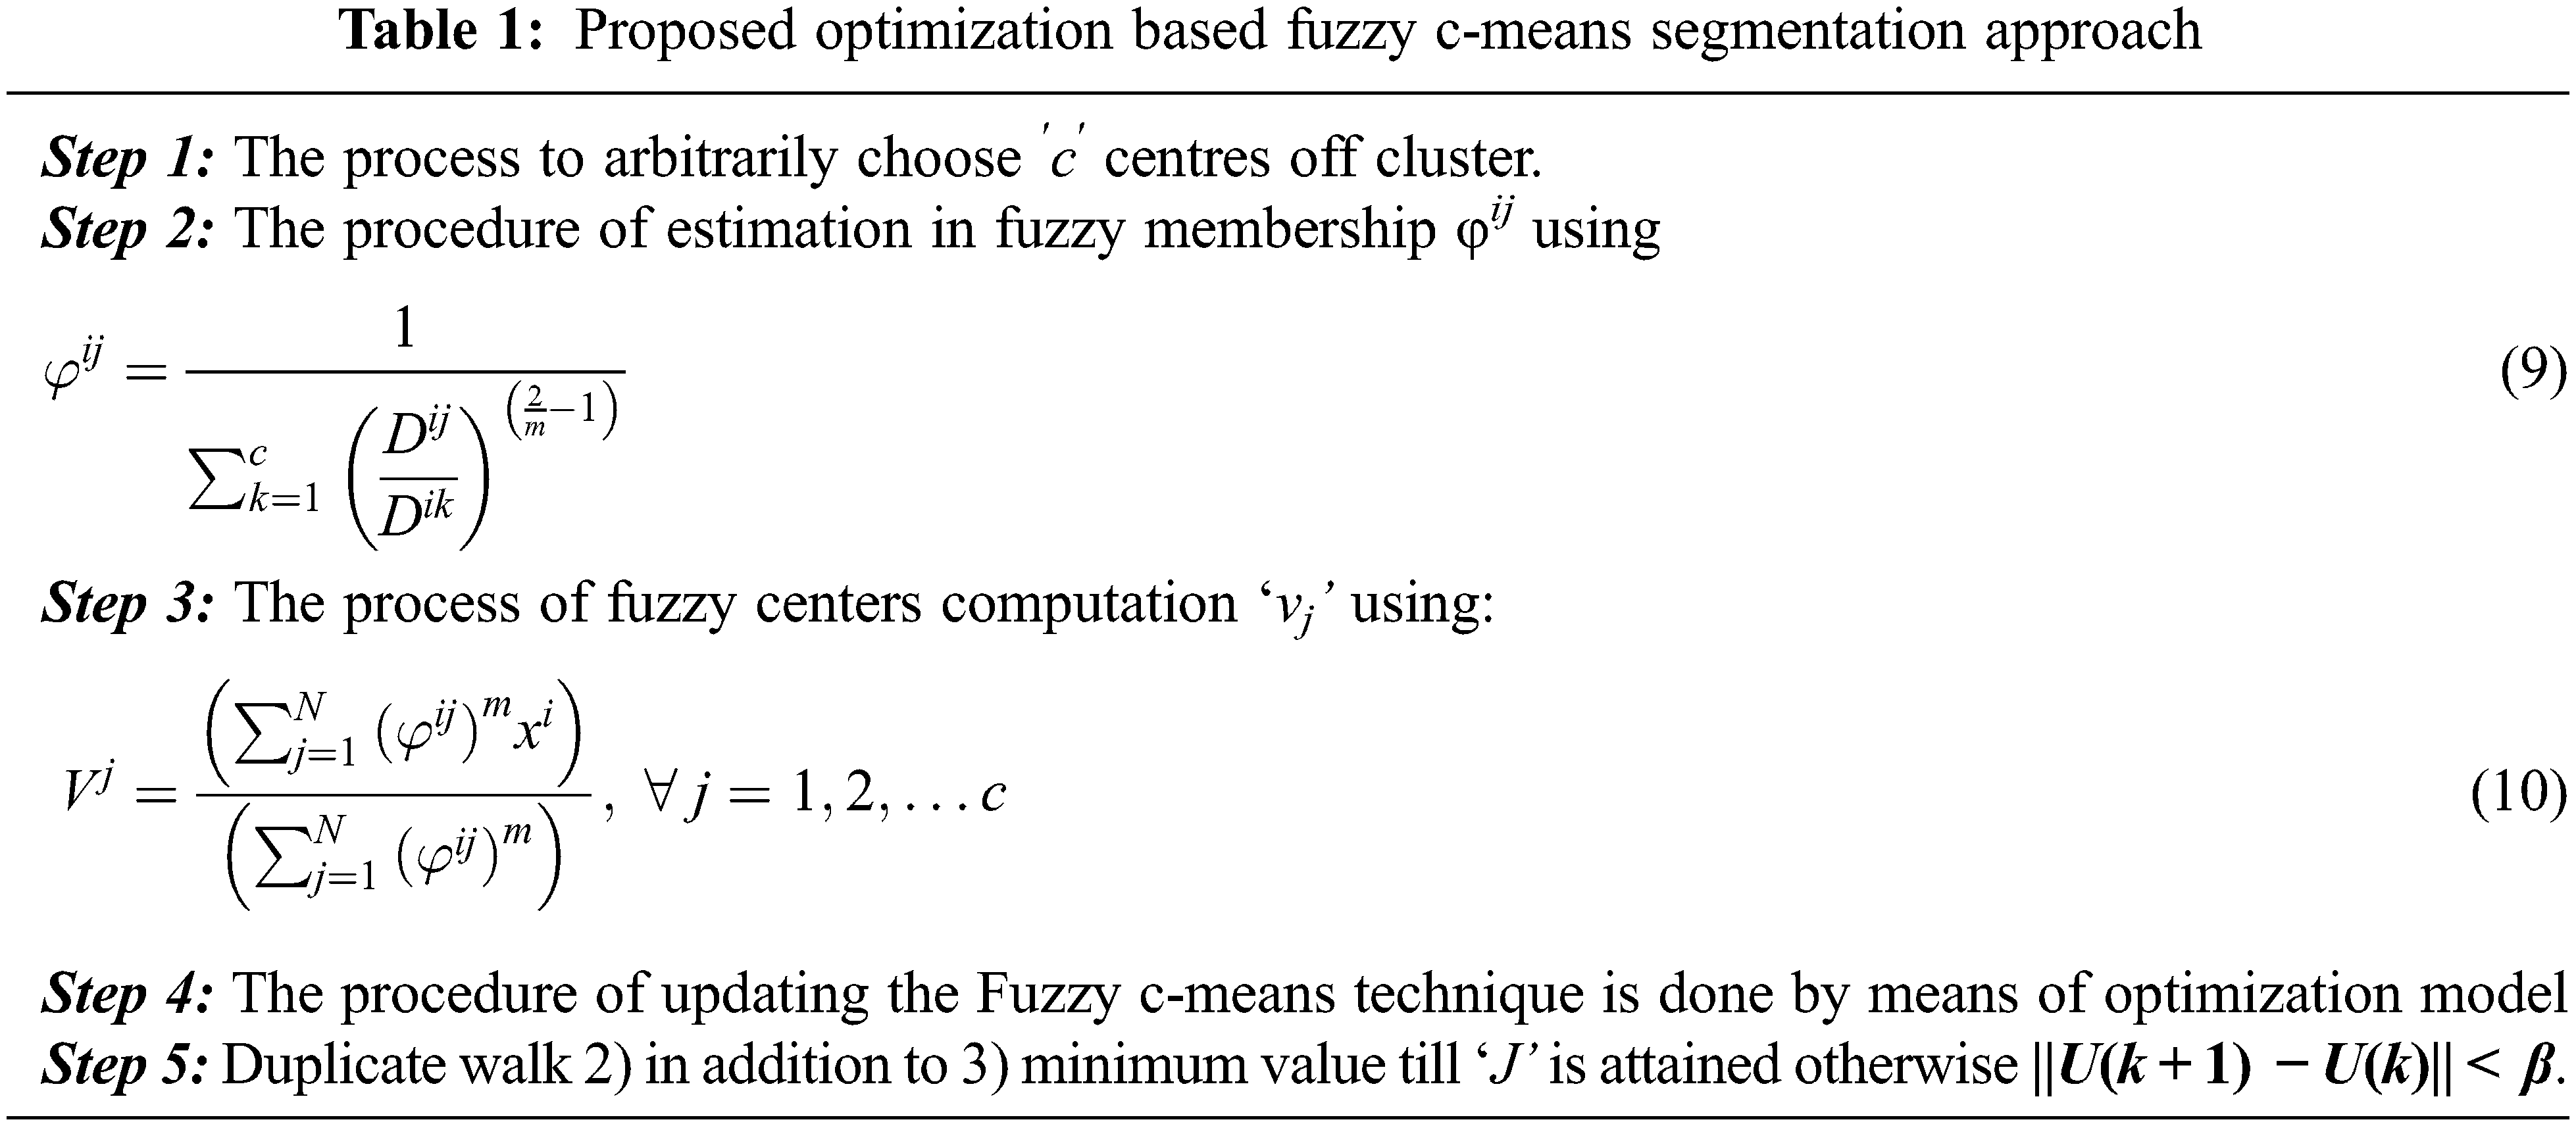
Where, ′k′ is iteration stages,′β′ is the termination criterion linking [0, 1],′U = (φij) n*c’ is the matrix membership fuzzy and‘J’ is the function objective. The infinite means are obtained from the infinite variance. Here the steps are essentially used for the formation of random walk development through a step-length distribution of power law by means of a serious end. Few of the novel solutions are generated with around the best solution obtained so far. The local search process with the speed is increased. Nonetheless, a significant part by novel solutions are created with outlying in randomization field in addition to the position are distant sufficient as of the current finest explanation; the procedure produce certain the classification and never attentive in an optimum local. The centroid of the fuzzy c means are finding with the utilization of the proposed Single Sign ON (SSO) algorithm. The Eq. (10) centroid optimization is achieved with the help of the SSO.
Typically, the SSO model works depending on the swarming behaviour of salp and the swarm involved can build interaction chains. It is done by the foraging actions of the corresponding swarm available in the deep sea. For acquiring more kinetic energy, the salps are interconnected through each other in search of food sources. The SSO is inspired through the swarming behaviour of salps by constructing the salp chain. The chain formation of each salp directs SSO to escape the local optima problem in practice. Therefore, SSO maintain stablility among exploitation and exploration procedures. In real world situation, not all the optimization strategy is supposed to accomplish well in obtaining high quality optimal solution. But the proposed optimization algorithm has the capacity to produce the appropriate centroid of fuzzy c means methods. In SSO algorithms, salp has two salps classes based on leaders and followers. The leader’s salp is found on the head of the chain and the followers obey the leader and are called as members of the chains. The leader’s salp helps guide and exterminate the crowd that followers have applied to other peers. The overall process of the proposed algorithm is illustrated in the Fig. 2.
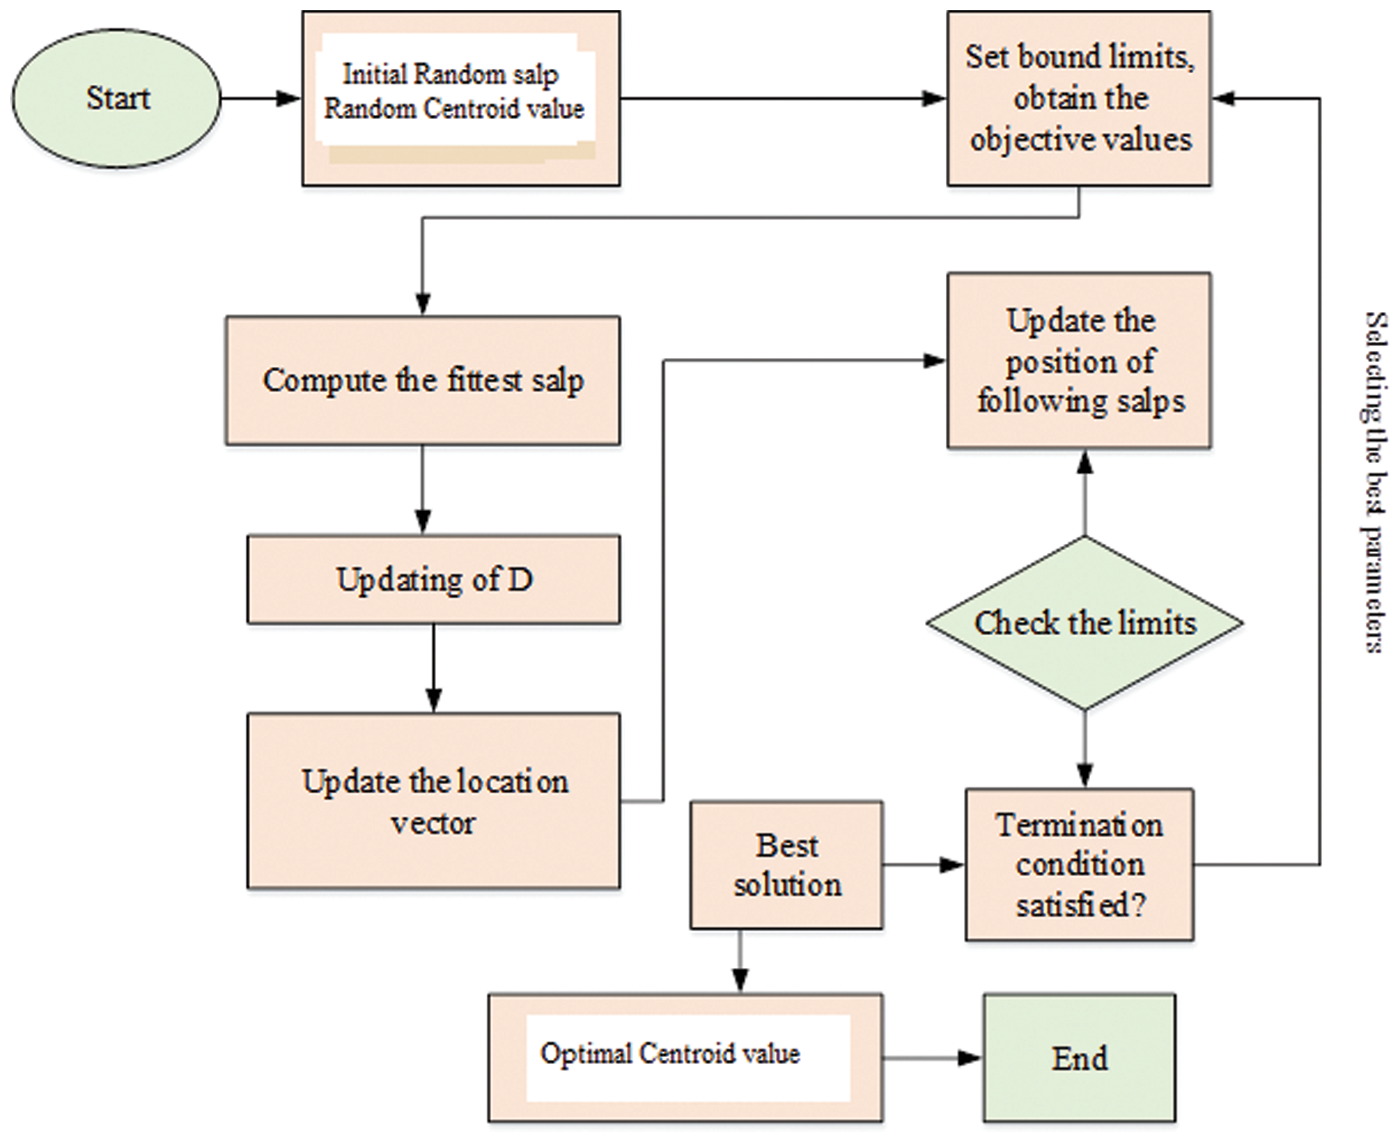
Figure 2: Flowchart of the proposed optimization strategy
In n dimensional space, the position vector of each salp is intended for searching its food source i. Here n term describes the total count of decision variables. At initial population of SSO is consists of N salp and d dimensions. The position vector Y of the salps are represented by N × d dimensional matrix which is represented by the below equation,
In SSO algorithm, all the salps in the population has its target in term of food source location. Moreover, the leader position is described as the below equation,
where, D2 and D3 can be described as the random vectors generating values which mentioned as the limit [0, 1], LBj indicates the lower limit of jth size, UBj defines the upper limit of jth size, Ej symbolizes the food source position,
where, D1 can be represented as the exploitation and exploration propensities of SSO algorithm in balanced state, t can be represented as the iteration and Tmax indicates the highest count of iteration. Additionally, the follower salp position is represented using the following mathematical expression,
where,
where, centroid value to be estimated with the use of SSO algorithm and after iteration the value of R can be revised and examined if it has coverage to the correct value. The iteration stops once the highest iteration rate is completed. The performance of the SSO method is used to solve the objective function OB is introduced. The fitness function defined in the proposed algorithm is presented in the below equation,
Hence, the SSO optimization algorithm is used for the minimization of objective function with related to the parameters limits. The SSO is used to optimize the centroid value of the fuzzy c means algorithm. A smaller value of OB implies a least deviation among the data and one optimized by the SSO algorithm. The pseudo code of the proposed SSO algorithm is presented in the Tab. 2.
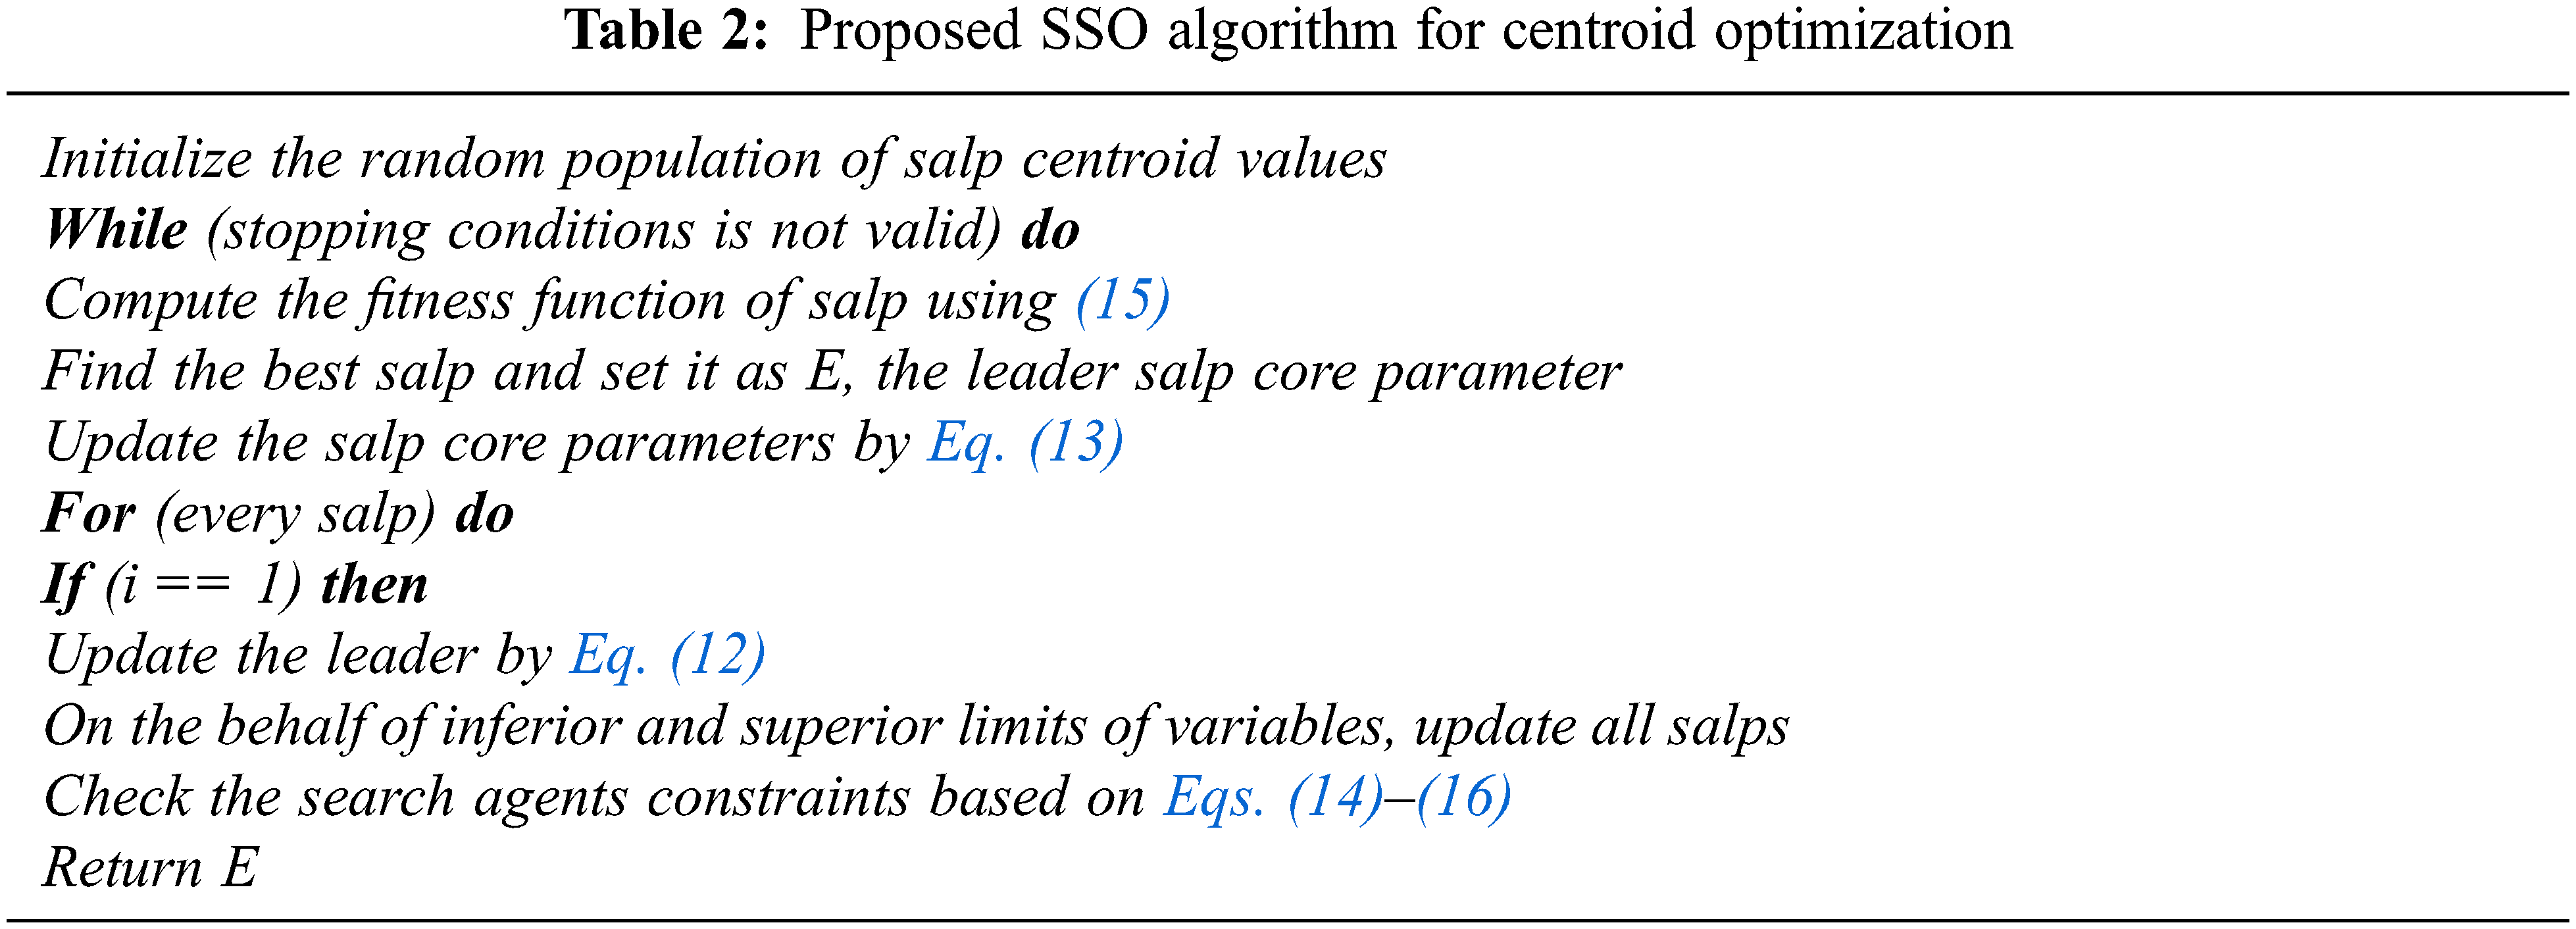
Based on the Algorithm 1, the SSO algorithm arbitrarily dispenses each and every search agents under the solution space. After that, it evaluates the present salp population to find the leading salp. The updating process and rules are attained with the help of the different equations. The salps position present in the population is updated with the help of Eq. (12). Until the termination condition is satisfied, repeat all the steps as much as possible except the initial phase for enhacing the quality of the slaps. With the utilization of the proposed algorithm, the optimal value of centroid can be optimized. The blood smear image based diagnosis is achieved with the help of the proposed controller. The fuzzy c means and centroid optimization is achieved with the utilization of the SSO algorithm. The segmentation of blood smear images is attained with consumption of the fuzzy c means and SSO algorithm. The segmented images are used to extract the features with the consumption of the different feature extraction methods.
4.3 Geometrical and Intensity Feature Extraction
The most prominent steps to be performed in the proposed automated blood cell analysis are feature extrcation and classification. From the collected input blood samples, the features are extracted and it represents the discrimination characteristic that contains both healthy and infected blood cells termed as feature set. These feature are subjected as an input to classifier for the recognition purpose. The features present in the collcted image comprises overlapping objects, similar shapes, and complex structures. In our work we have geometrical and intensity features along with intensity and GLCM based textural features.
• Geometrical structures play a substantial part in identification of multifaceted forms. Many investigators utilised geometrical structures for automatic blood cell examination. We have utilised diverse geometrical structures that are invariant under diverse situations and equivalent to those subjugated by haematologists [23]. These features including nucleus variance, nucleus mean, nucleus area, nucleus perimeter, nucleus roundness, and nucleus relative roundness, cytoplasm mean, cytoplasm variance, cytoplasm area and perimeter, ration of cytoplasm to nucleus and number of objects existing in nucleus. To minimize the effects of scaling on White Blood cells recognition, we have extracted relative based features like relative roundness, area and perimeter.
Relative parameter can be presented by below equation,
• After extracting geometrical features, its intensity related GLCM features are extracted to create the image texture in unique way by inserting the frequency of the two pixels appearing in the specific relationship. Based on this insight, symmetric matrix is generated by constructing gray level of an image along with angles and distance. Dissimilar co-occurence feature matrices are formed by distance and angle variations. Since different kinds of nucleus represent different structures, that is why; texture features are applied to cell division. For all the image, the co-occurenace matrix dimension is computed and it is N × N for a specific image M with gray level N. Consider the segmented region of the leukocyte nuclei is symbolized as I and the GLCM is calculated by summarizing all the texture details in the image I including the intermediate space relationship between neighboring greytones. Based on this, 28 set of GLCM texture features are extracted with the help of co-occurence matrix. Some of the extracted features are listed and its mathematical derivation is formulated as follows,
Entropy can be computed based on the below equation,
Energy can be computed based on the below equation,
Correlation can be computed based on the below equation,
Sum entropy can be computed based on the below equation,
The analysis of the vibrant structure is defined by the gray level run length matrix. Here, WBC Image I is utilized with harmonizes a and b. The run length matrix is defined as R(I, j), whereas the length is specified as j for a specific gray value i. The extracted features are used to training the classifier for prediction of the different eight classes.
4.3.1 Training DCNN Model for PBS Analysis
The conventional CNN is a deep learning framework, and it is inspired by biological neural networks. CNNs consist of convolution and pooling operations. Typically, the convolutional layers are interspersed with pooling layers to reduce computation time, and build up further spatial and configuration invariance; the last few layers will be fully connected 1-dimensional layers. The design architecture of the CNN network is illustrated in the Fig. 3.
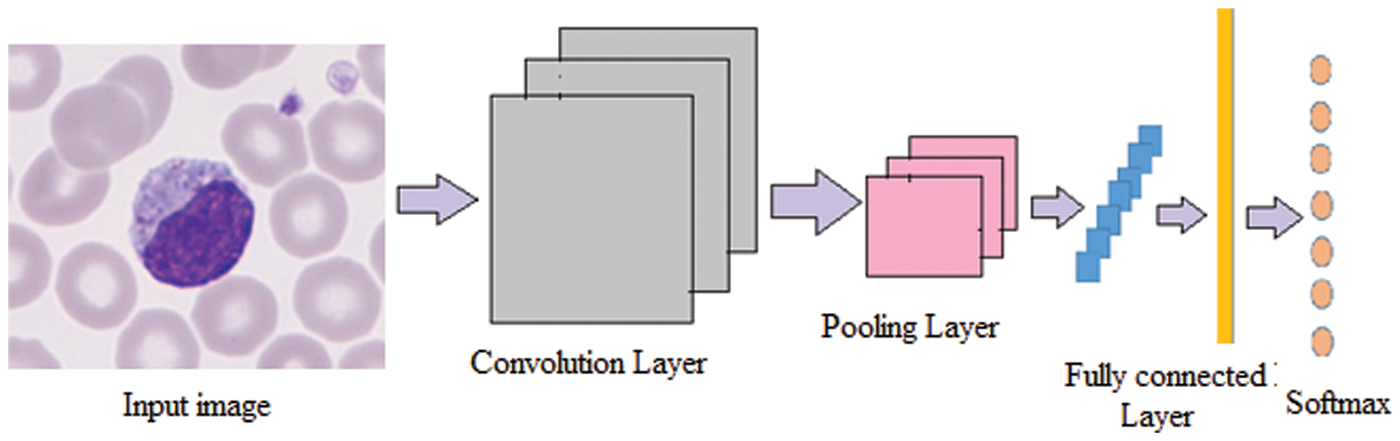
Figure 3: Architecture of the DCNN network
In detail, the feed-forward neural network is considered as a function f of mapping data.
Each function FL in the above Eq. (24) acquires X1 as input with a vector of learnable parameter WL. In the neural network architecture the depth is indicated as L. Even if the sequence and kind of functions are regularly handcrafted, the parameters can be learned discriminatively from resulting function F that works as a mapping model. Typically, in the proposed CNN, every X1 is considered as an M × N × C array. As our classification problem, we can define the loss function of the DCNN as
where N is the number of samples, for the sample I its true label is denoted as ZI. In the training phase, the classification model is trained with the optimization procedure for attaining minimal loss function L. For that purpose, optimization carried out in the proposed model is stochastic gradient descent and back propagation algorithms. With these optimization approaches transfer learning and hyper parameter tuning is achieved on the proposed deep learning techniques like Alexnet, vgg16 and vgg19. These models are well trained to classify the blood smear images. The parameters of hyper parameter-tuning method are not initialized by the network itself, it is necessary to tune and optimize these parameters according to the results of training the blood smear image in enhancing the performance.
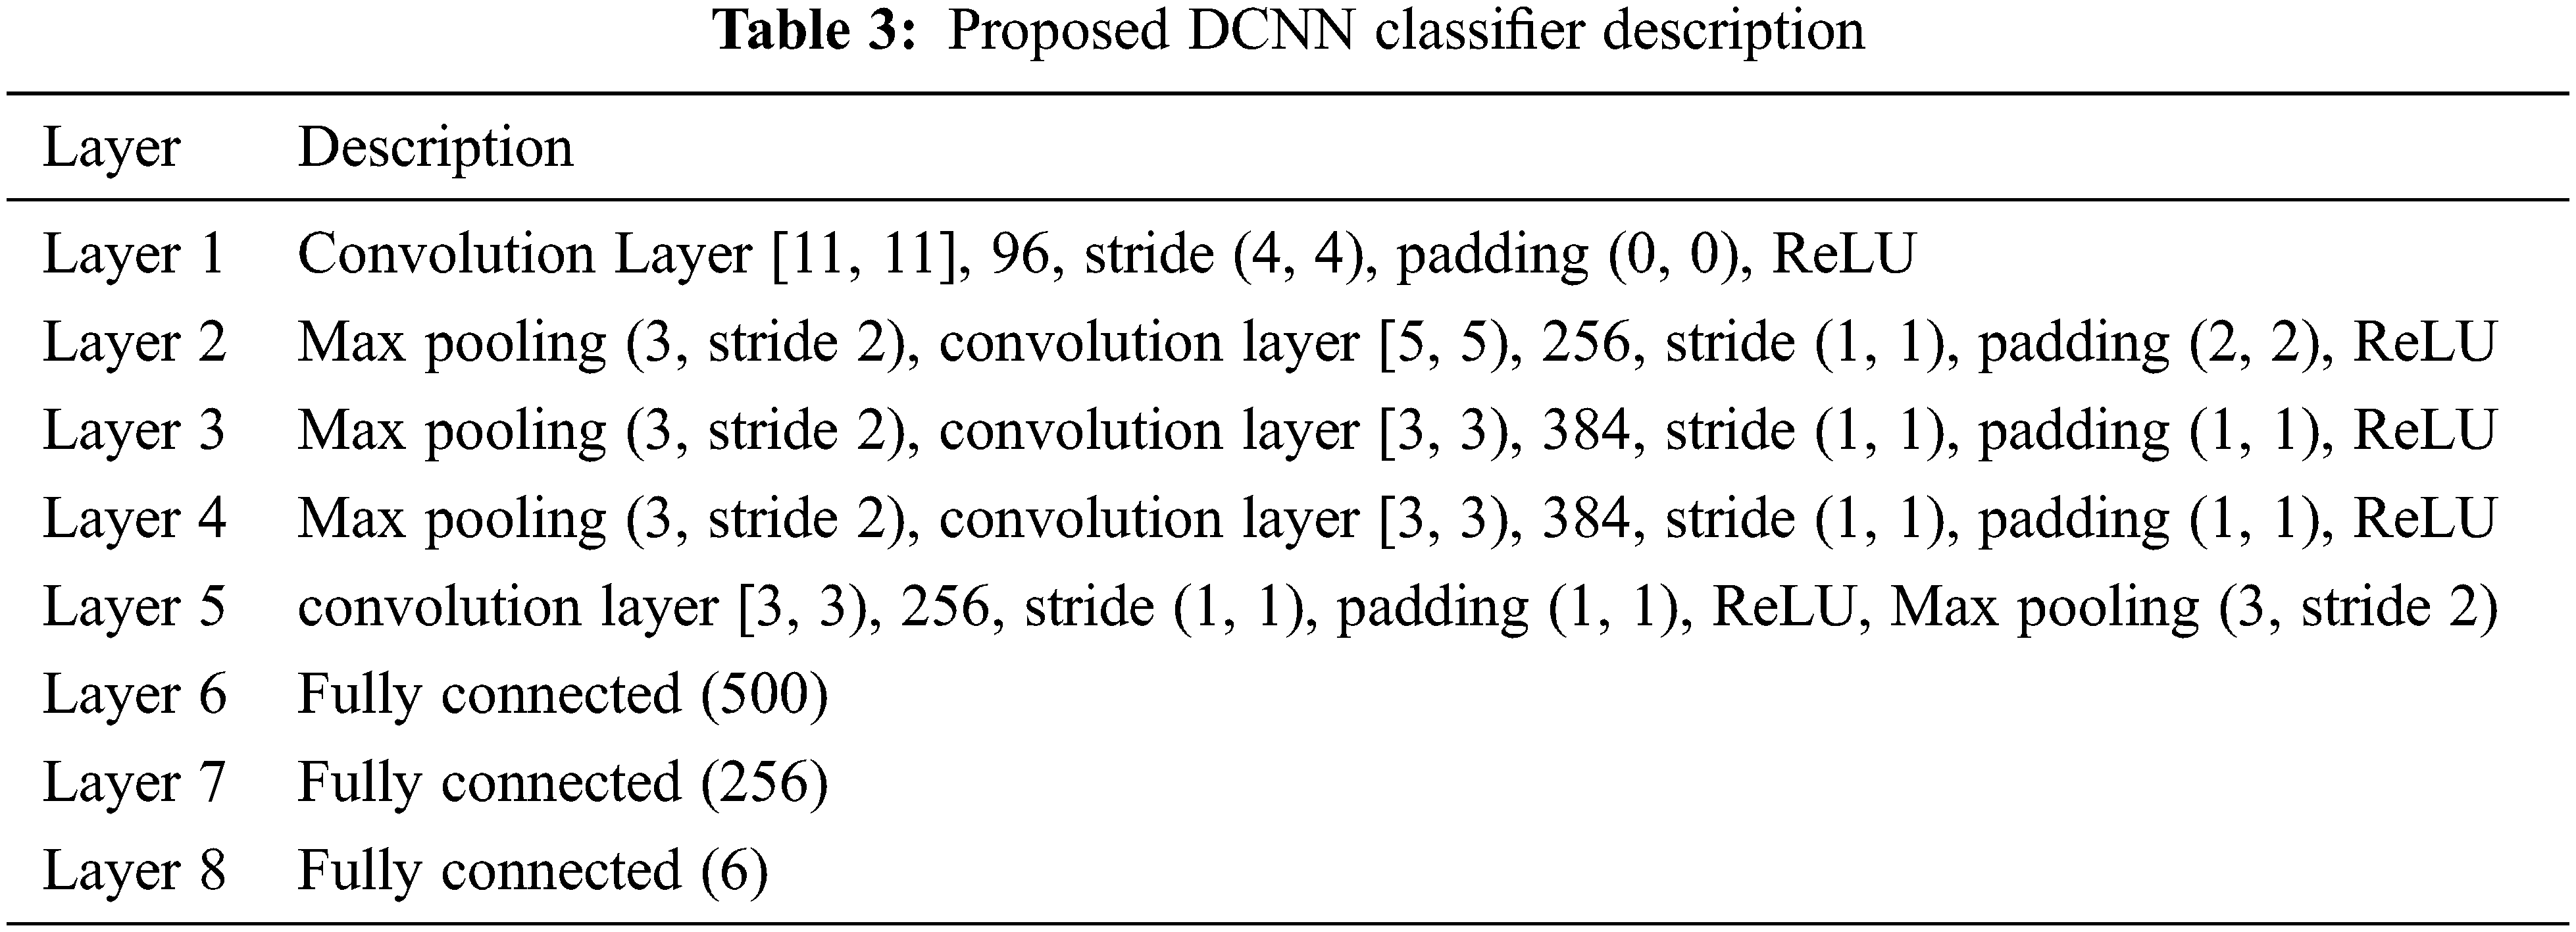
The proposed blood smear images detection is achieved with the help of the DCNN classifier. The performance of the proposed method is analysed in the below section. The details of the full training approach are as listed in Tab. 3.
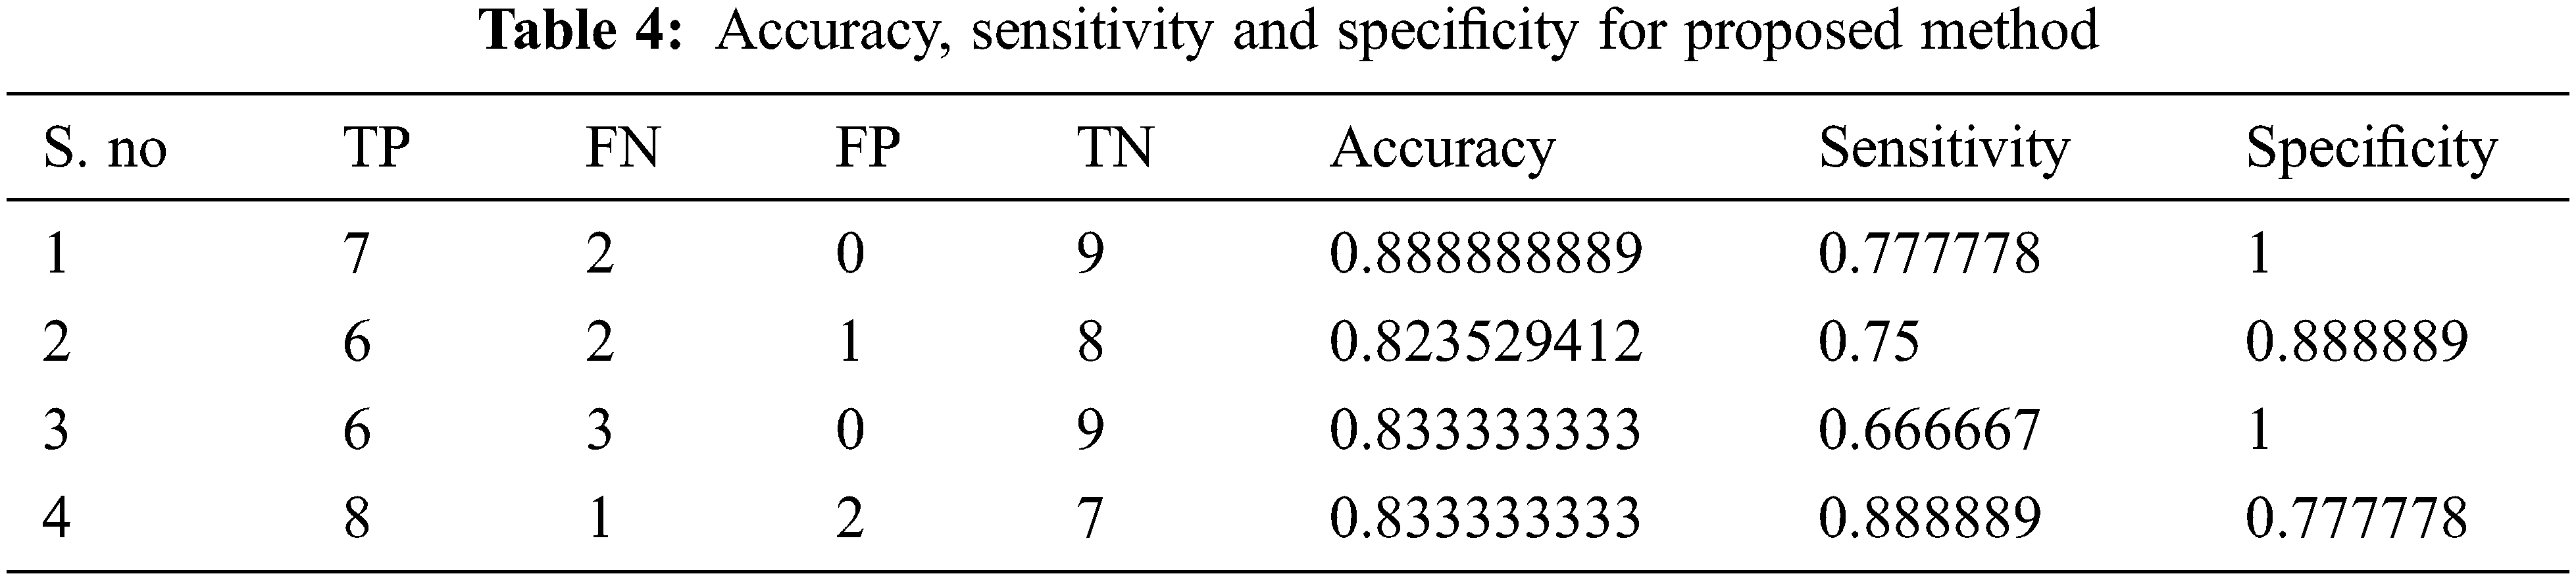
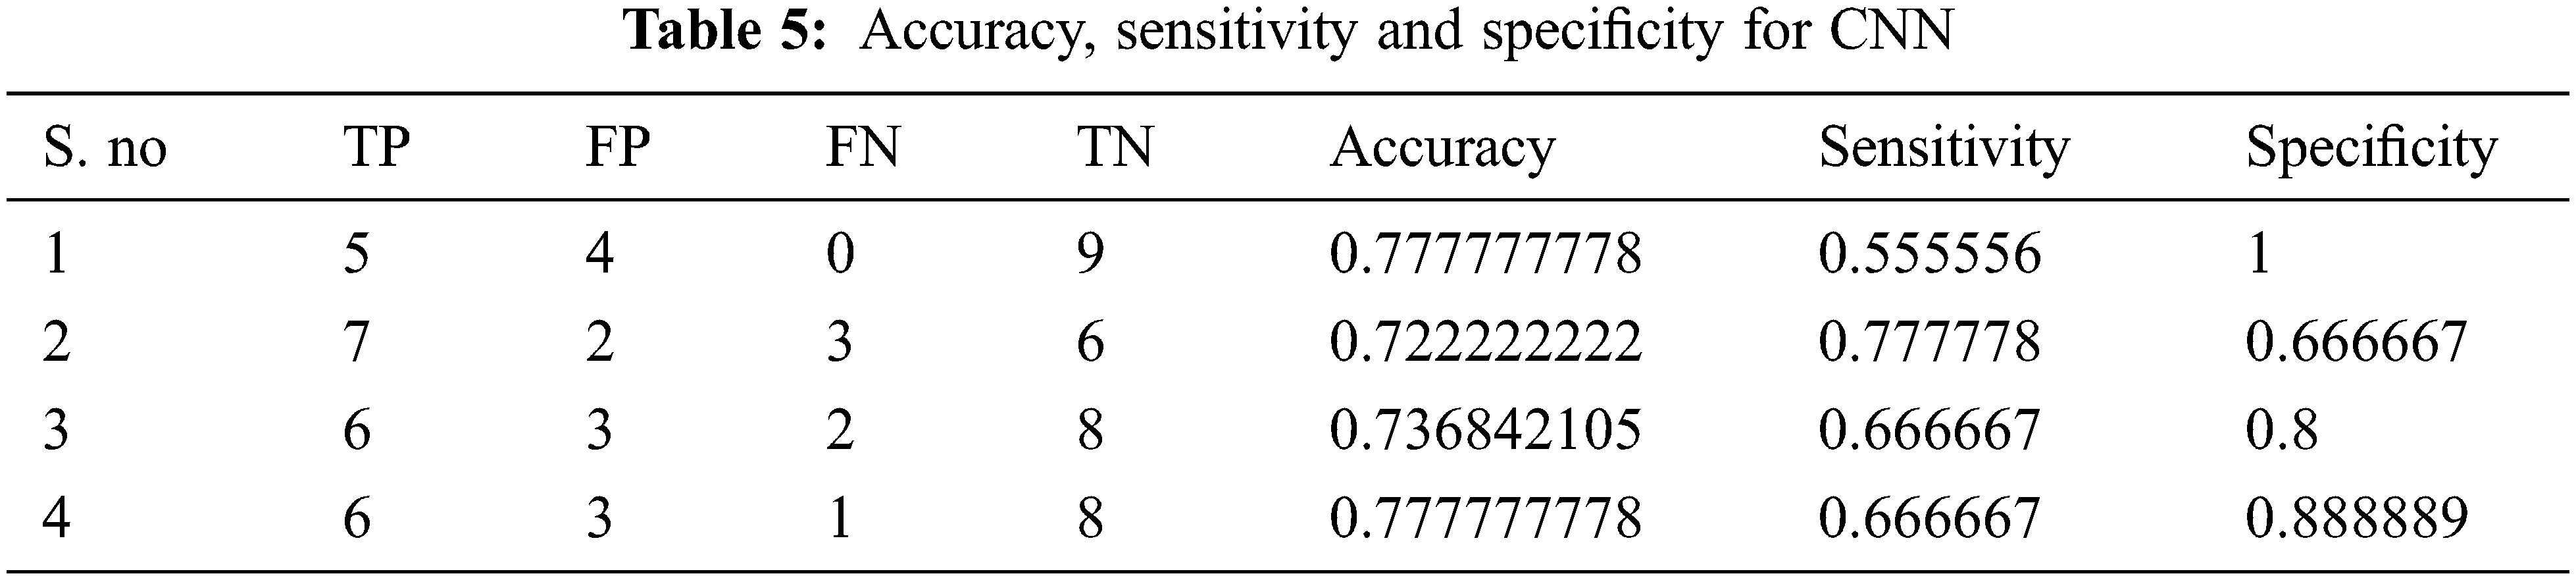
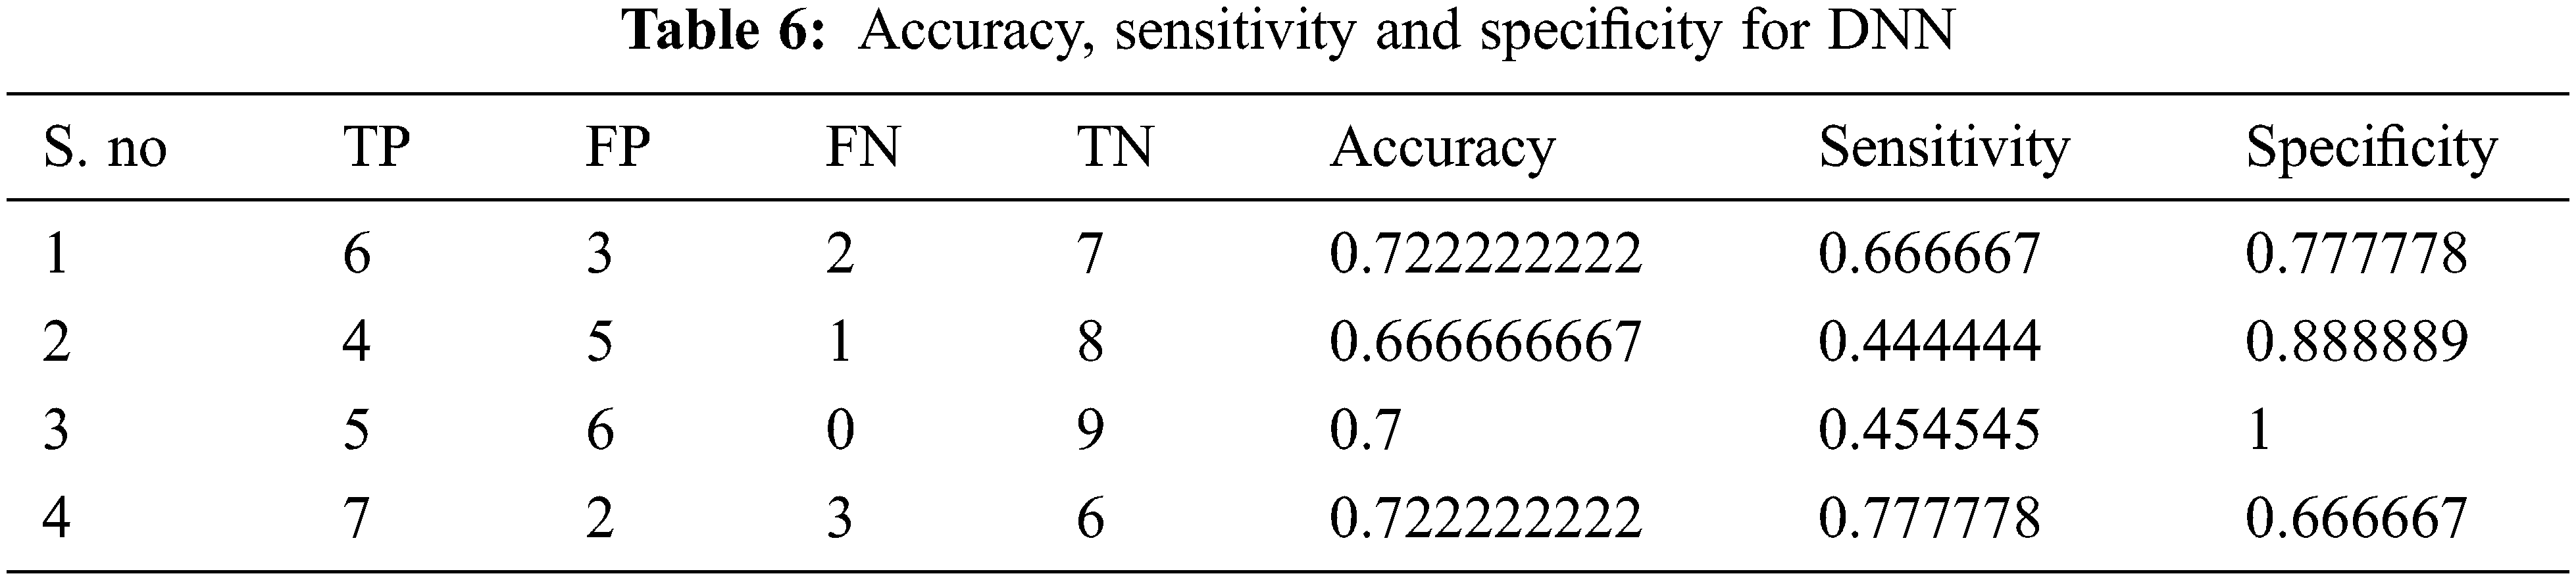
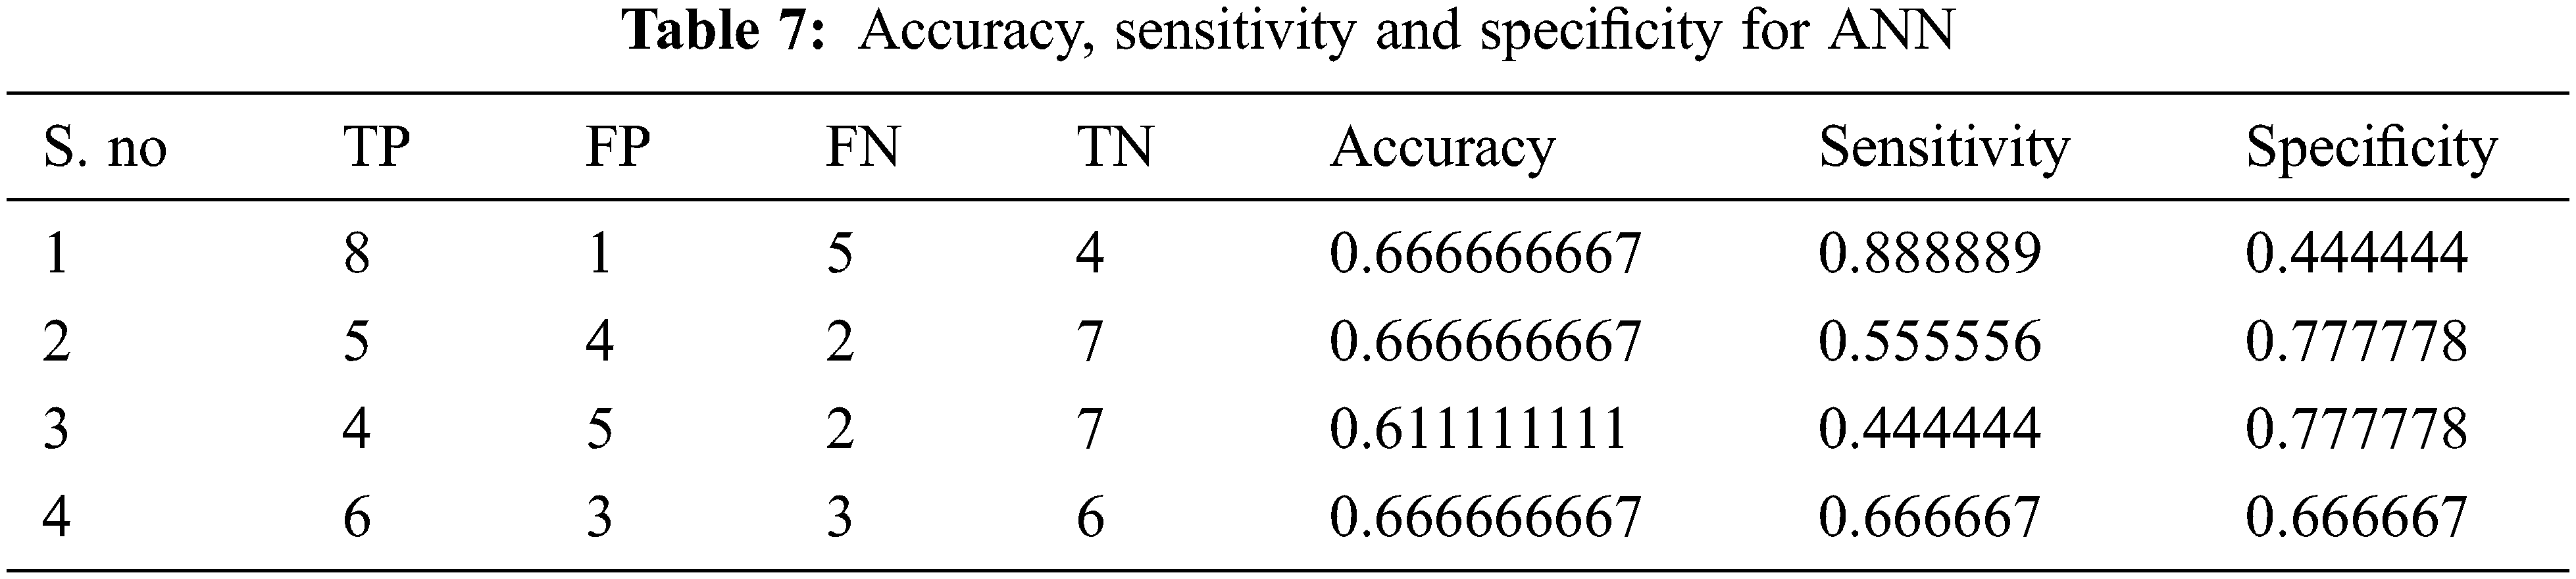
Tabs. 4–7 show the performance results of proposed,CNN, DNN and ANN classifiers
In the proposed model, the deep learning algorithm consists of 8 set of layers and is pre-trained for both training and testing evaluation. In the network model, one convolutional and three fully connected layers are established for layer 6 and 7. The parameters involved in the proposed classifier are optimally selected with the help of stochastic gradient descent (SGD) approach. While training, the learning rate achieved is 0.001;likewise batch size defined is 20 and the number of iterations(epoch) is set to be 1000. For enhancing the performance of proposed classifier, AlexNet is employed along with the input layer to pre-train the images. After each convolution layer, ReLU and max pooling layers are included. The proposed architecture totally carries eight set of layers that contains five convolution layers and three fully connected layers.
In this proposed methodology, the blood smear images are taken as the input images. From the input smear images, the pre-processing is used to remove the noise by the utilization of the HE. The pre-processing is used to unwanted and noises are removed. After that, the segmentation purposes, the fuzzy c means clustering is introduced, the segmentation procedures centroid optimization of the segmentation process is enhanced with the help of the SSO algorithm. After that segmentation process, the feature extraction techniques are introduced such as GLCM, area and eccentricity methods. The extracted features are used to train the DCNN for prediction of the different conditions such as basophil, eosinophil, lymphocyte, monocyte, neutrophil, erythroblast, platelet, myocyte, promyocyte and metamyocyte.
The proposed method is implemented in the MATLAB platform and it’s compared with the existing methods of CNN, CNN and ANN classifier. The input samples are collected from the peripheral blood to validate the proposed methodology which includes100 microscope slides by carrying of 8 standard subjects with 400 samples. Microscopic slides were painted and polished by the Gismo Right process and the images were obtained with a simple microscope (Microscope-Axioskope 40) spotted peripheral blood using an achromatic lens for 100 magnification. These input images were framed with the help of digital camera (Sony Model No. SSCDC50AP) and stored in BMP format. The images is in the pixel of 720 × 576. All are colored images and collected at Hematology-Oncology and BMT Research Center of Imam Khomeini Hospital in Tehran, Iran.
The feature extraction of the images are illustrated in the Fig. 4. The images were classified by a hematologist into normal leukocytes: basophil, eosinophil, lymphocyte, monocyte, neutrophil, erythroblast, platelet, myocyte, promyocyte and metamyocyte. Also, the areas related to the nucleus and cytoplasm were manually segmented by an expert. In this way the dataset was divided into two phases namely testing and training phase. Here from the dataset1,919 (12%) images of the test set and 15,173 (88%) images of the training set is slected. The training set was enhanced using random geometric transformation that get a new training set with 4,608 pictures per class. To bring out the appropriate set of features, Vgg-16, Vgg-19 and Alexnet were utilized with their initial weight functions of the Imagenet contest. From Vgg-16, the fully integrated layer and output layer has been removed to extract 4,096 features per image. From Alexnet, fully integrated and outgoing layers have been removed to extract 2,048 features per image.
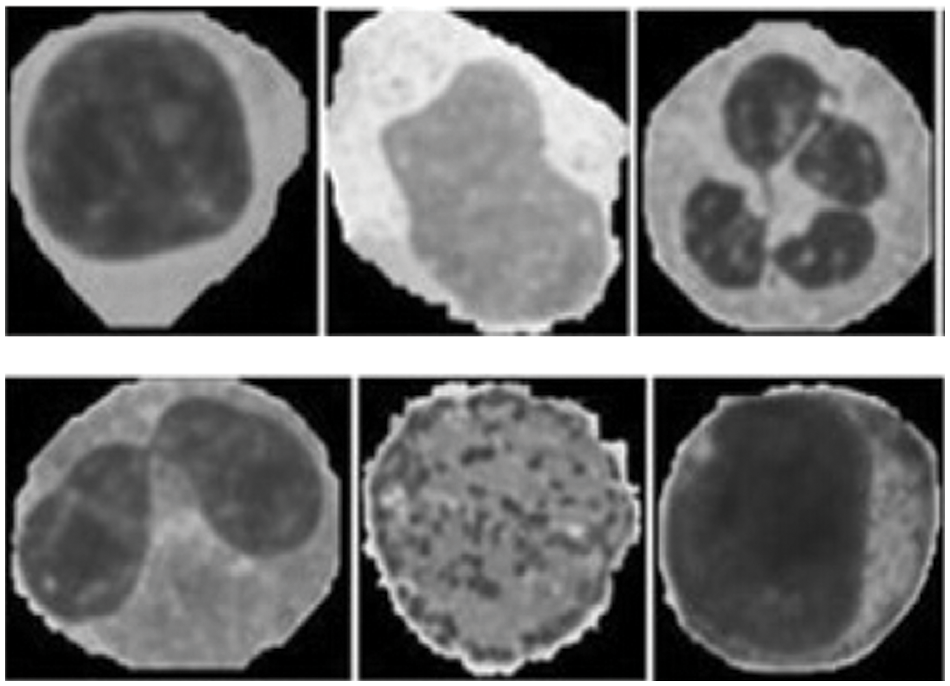
Figure 4: Feature images of gray scale representation
The different leukocytes: basophil, eosinophil, lymphocyte, monocyte, neutrophil, erythroblast, platelet, myocyte, promyocyte and metamyocyte conditions are classified with the utilization of the DCNN classifier. The classification results of the cell conditions are illustrated in the Fig. 5. The classification is tested with the statistical measurements of sensitivity, specificity and accuracy are verified. The proposed methodology is implemented in the working platform of MATLAB on a Pentium-4 PC, operating at 3.2 GHz, with 1 GB of RAM.
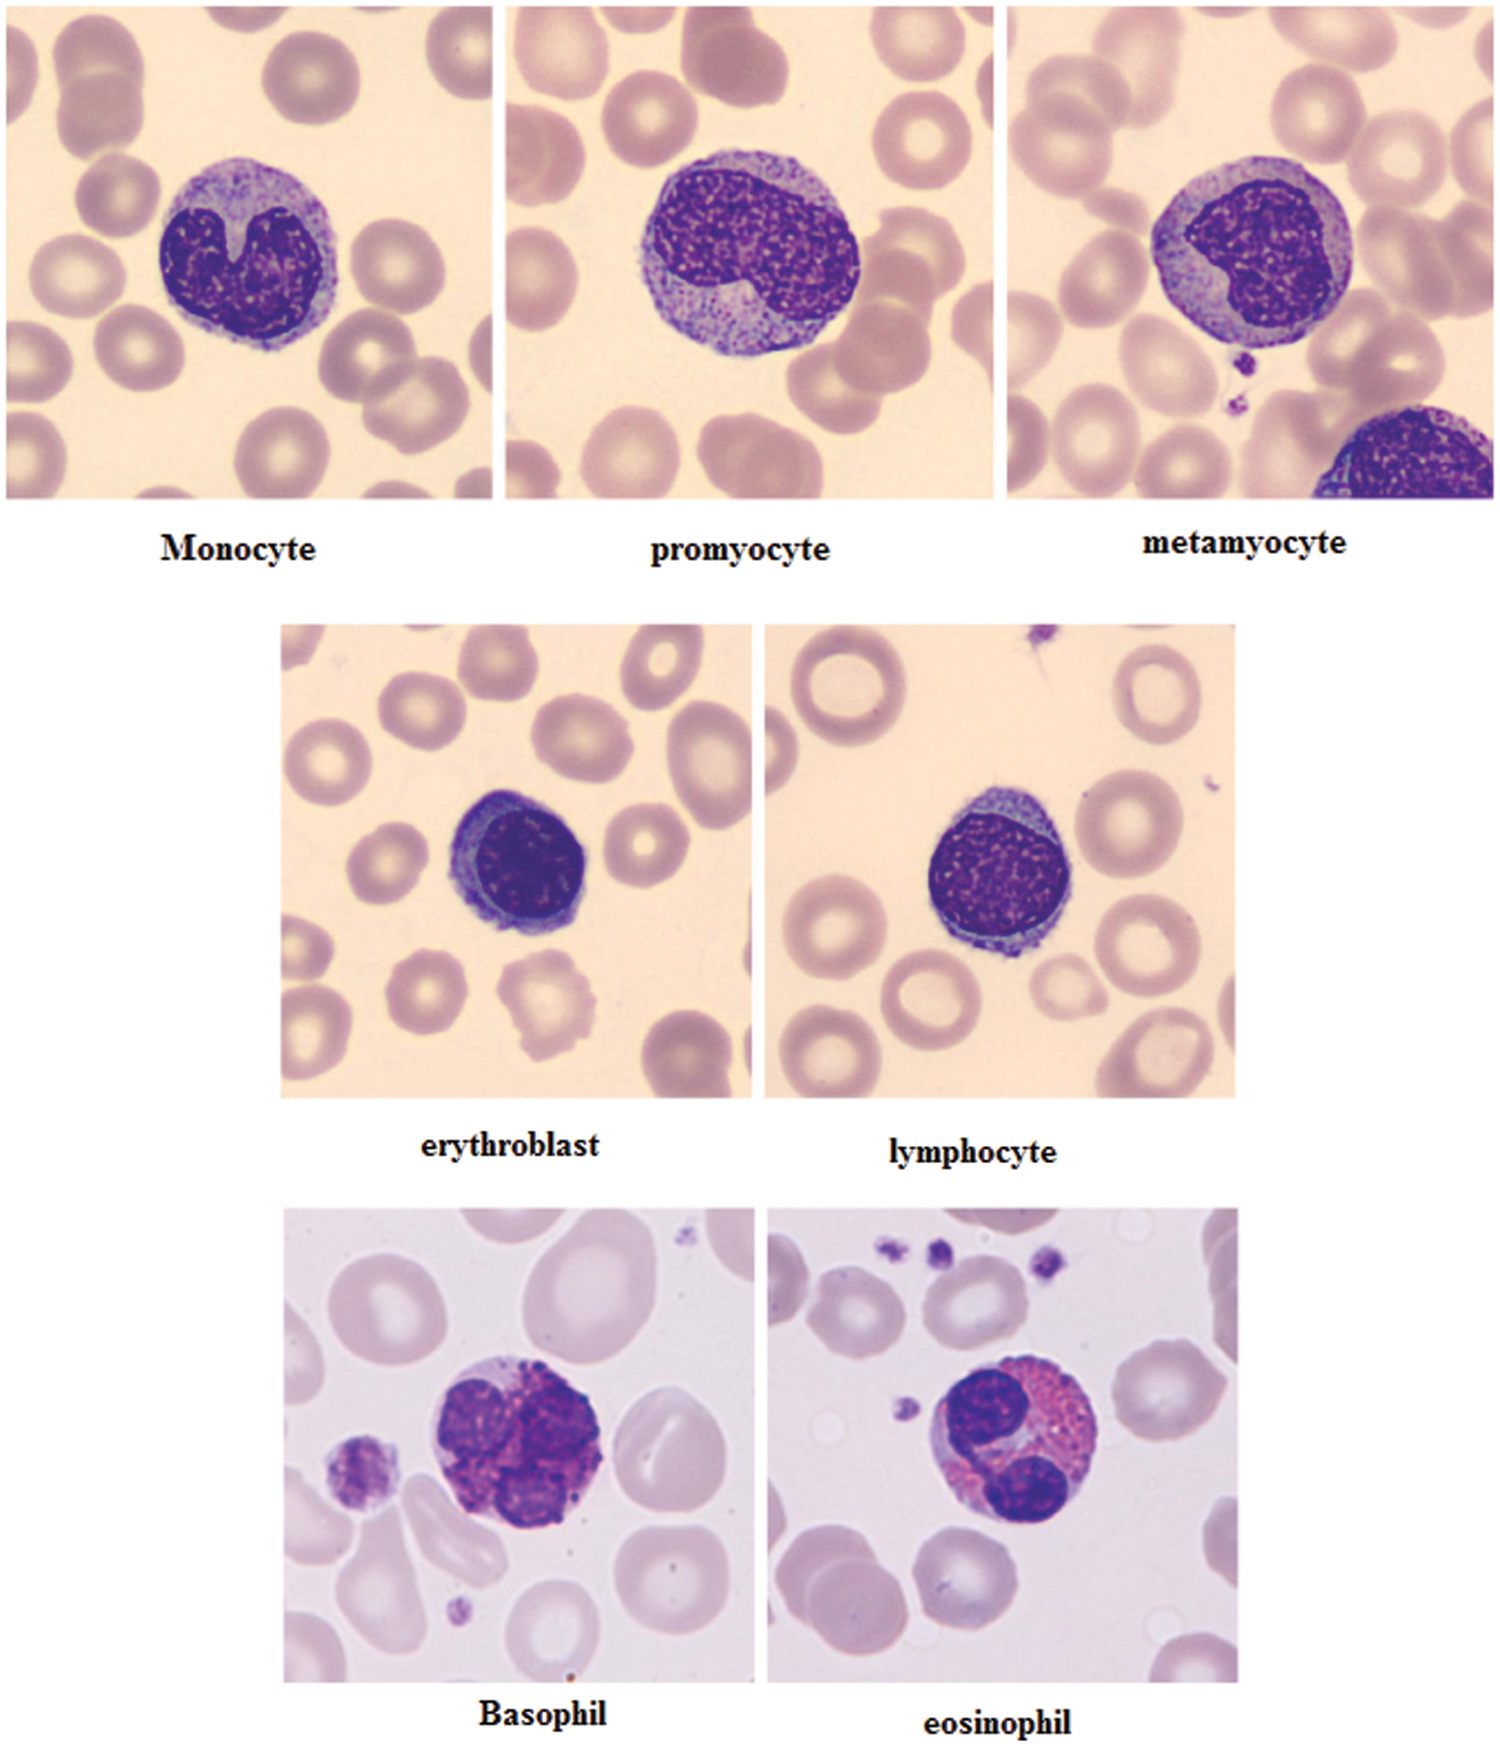
Figure 5: Examples of cell types of the proposed method
5.1 Performance of Statistical Measurements
The performance of the proposed method is analysed with the help of the statistical measurements. The statistical measures taken for the analysis of proposed model are accuracy, sensitivity, and specificity. The statistical measures of the proposed methods works on the basis of characterized True Positive (TP), False Positive (FP), True Negative (TN) and False Negative (FN) values. With the help of the statistical measurements, the proposed method is analysed the performance by performance metrics of accuracy, specificity and sensitivity. The statistical measurements values are calculated by using formulas these formulas are described in given below section.
• Accuracy
Accuracy is defined as the ratio of a number of true patterns to the sum of all patterns. The given formula is described for accuracy in Eq. (1),
• Sensitivity
The two basic measures of quantifying the diagnostic accuracy of a test are the sensitivity and specificity. The sensitivity of a diagnostic test quantifies its ability to correctly identify subjects with the human activity. It is the proportion of true positives that are correctly identified by the test, given by the Eq. (2),
• Specificity
The specificity is the ability of a test to correctly identify subjects without the condition. It is the proportion of true negatives that are correctly identified by the test. The specificity value is calculated by the human activity recognition. It is defined as the ratio of true negative to adding of false positive and true negative. The formula for sensitivity is described in Eq. (28)
The evaluated output of proposed technique is tabulated in Tab. 2. The Tabs. 2–5 represents the classification results are analysed in the starting period.
The accuracy, sensitivity and specificity of the proposed technique are analysed from the TP, FP, TN and FN values. The classification results are analysed at different scenario such as initial contours, pre-processing, and feature extraction. Then, the locations and their types are correctly classified and evaluated by using the proposed method. After that, evaluate the performance of the proposed method and compared with the existing methods. The outcome of the proposed model is graphically shown as follows.
The training phase of proposed CNN in terms of accuracy, specificity and sensitivity in layer-wise manner is shown in Fig. 6. It seems that the overall accuracy achieved by the proposed four convolutional layers (layer 1 to layer 4) and two fully connected layers (layer 7 and layer 8) is around 99%. Henceforth, the proposed classifier performs well in categorizing different classes.
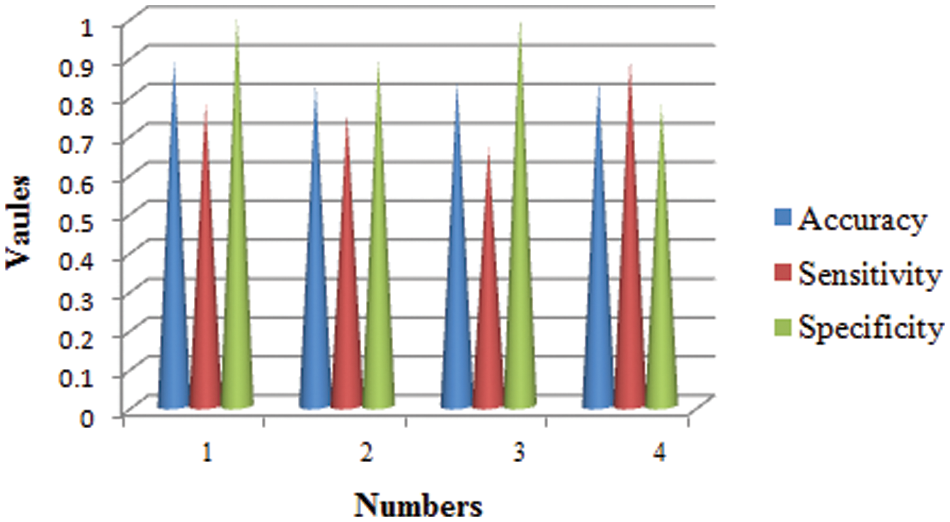
Figure 6: Statistical measures analysis of proposed method
The proposed model is compared with the CNN, DNN and ANN performances and are determined in the above graph. The performance of accuracy, sensitivity and specificity are determined and computed. From the comparative analysis, the accuracy, sensitivity and specificity are analysed at different input. Fig. 7 show that the proposed technique is better than that compared to existing methods.
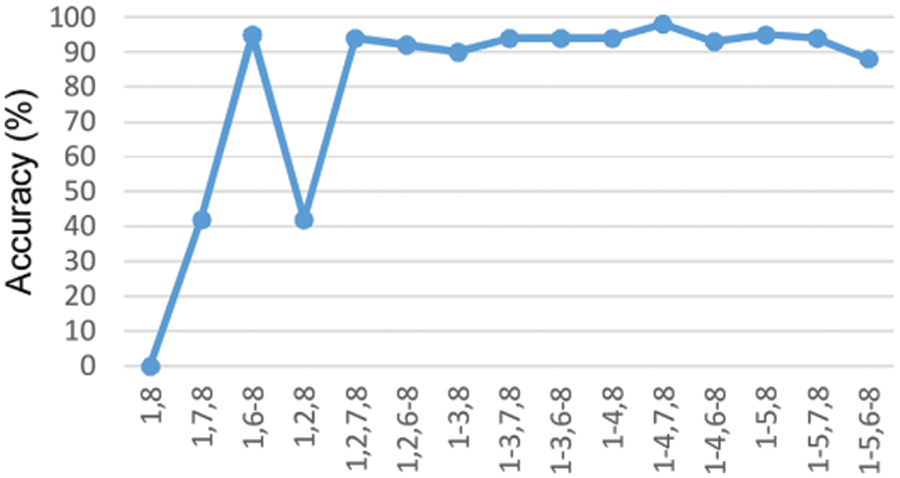
Figure 7: Accuracy under the training stage in the DCNN classifier
Fig. 8 shows the comparison results of the performance measures such as accuracy, sensitivity and specificity for the proposed technique and other techniques namely CNN, DNN and ANN. While seeing the accuracy value of the three techniques, the proposed technique yielded higher accuracy than the other techniques and it is about 9.11%–19.19% higher. When compared these sensitivity values with the sensitivity value of the proposed technique, it is about 10.41%–18.49% higher for our proposed technique. The specificity value also higher for the proposed technique is 7.77%–25% higher which in turn shows the effectiveness of the proposed technique while classifying the abnormalities.
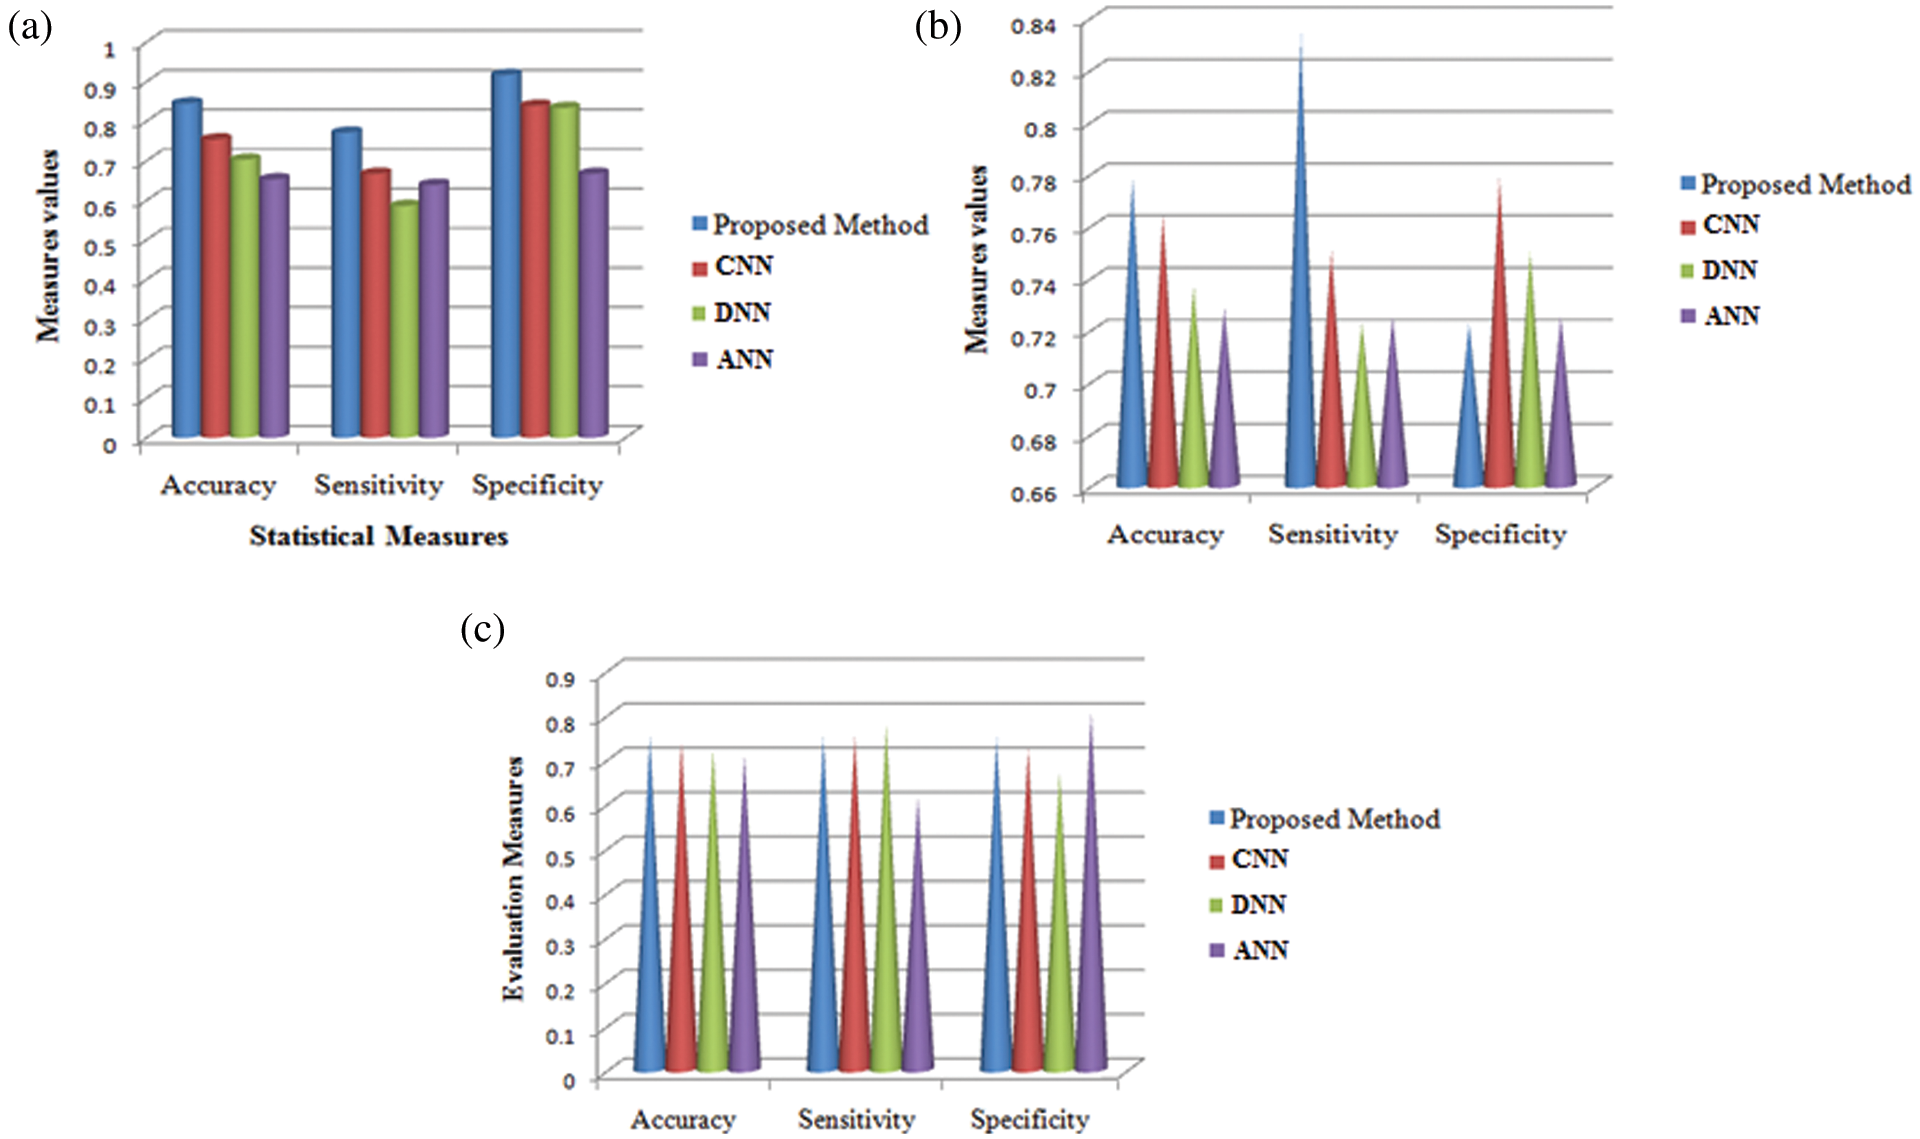
Figure 8: Comparison analysis of average values in accuracy, sensitivity and specificity at (a) Initial contours (b) pre-processing and (c) feature extraction
The main contribution of this paper is a classification scheme involving a convolutional neural network trained to discriminate among eight classes of cells circulating in peripheral blood. Starting from a state-of-the art general architecture, we have established a fine tuning procedure to develop an end-to-end classifier trained using a dataset with over cell images obtained from clinical practice. The proposed method is compared with the existing methods of CNN, DNN and ANN. The proposed method obtains an effective results rather than the existing techniques compared. Based on the insight of the proposed model, the selection of features of the haematological system appears to be beneficial. In addition, comparisons between CNN, DNN and ANN classifiers proved that the proposed DCNN model has the superiority in attaining an effective accuracy level. The proposed method has a reasonable processing time and is accurate. The entire work is executed in 10 s of processing time for blood cell analysis and the difference made by 100 white blood cells lasts about 16 min. By comparison, a specialist needs 15 min to perform this procedure. Therefore, this system can be utilized in hematology laboratories. Other results of this framework, in addition to differential counting, could be statistical tests in measuring its shape, size, and the ratio between the nucleus and the cytoplasm of enumerated cells that provide hereditary data to haematologists in diagnosing and disease progression.
Funding Statement: The authors received no specific funding for this study
Conflicts of Interest: The authors declare that they have no conflicts of interest to report regarding the present study.
1. A. Adewoyin and B. Nwogoh, “Peripheral blood film-a review,” Annal Page Medicine, vol. 12, no. 2, pp. 71–79, 2014. [Google Scholar]
2. J. Shagana, “Diagnostic cells in the peripheral blood smear,” Journal of Pharmaceutical Science and Research, vol. 6, no. 4, pp. 213–216, 2014. [Google Scholar]
3. A. Mohammed, M. Mohamed, H. Far and G. Christopher Naugler, “Peripheral blood smear image analysis: A comprehensive review,” Journal of Pathology Informatics, vol. 5, no. 9, pp. 1–10, 2014. [Google Scholar]
4. E. Mohammed, A. Mostafa, G. Christopher Naugler and B. Far, “Chronic lymphocytic leukemia cell segmentation from microscopic blood images using watershed algorithm and optimal thresholding,” in IEEE Canadian Conf. of Electrical and Computer Engineering (CCECE), Canada, pp. 1–5, 2013. [Google Scholar]
5. W. Sun, G. Z. Dai, X. R. Zhang, X. Z. He and X. Chen, “TBE-Net: A three-branch embedding network with part-aware ability and feature complementary learning for vehicle re-identification,”IEEE Transactions on Intelligent Transportation Systems, vol. 118, pp. 1–13, 2021. [Google Scholar]
6. L. Qingli, W. Yiting, L. Hongying, J. Wang and F. Guo, “A combined spatial-spectral method for automated white blood cells segmentation,” Optics& Laser Technology, vol. 54, pp. 225–231, 2013. [Google Scholar]
7. F. Xing and L. Yang, “Robust nucleus/cell detection and segmentation in digital pathology and microscopy images: A comprehensive review,” IEEE Review Biomedical Engineering, vol. 9, pp. 234–263, 2016. [Google Scholar]
8. W. Sun, L. Dai, X. R. Zhang, P. S. Chang and X. Z. He, “RSOD: Real-time small object detection algorithm in UAV-based traffic monitoring,” Applied Intelligence, vol. 15, pp. 1–16, 2021. [Google Scholar]
9. P. Tiwari, J. Qian, Q. Li, B. Wang, D. Gupta et al., “Detection of subtype blood cells using deep learning,” Cognitive Systems Research, vol. 52, pp. 1036–1044, 2018. [Google Scholar]
10. . M. Karakoyun, N. AkhanBaykan and M. Hacibeyoglu, “Multilevel thresholding for image segmentation with swarm optimization algorithms,” International Research Journal of Electronics & Computer Engineering, vol. 3, no. 3, pp. 1–7, 2017. [Google Scholar]
11. T. RaoBenala, S. Satapathy, S. Surya Vamsi and R. Panchumarthy, “Cat swarm optimisation for optimizing hybridized smoothening filter in image edge enhancement, ” in Int. Conf. on Systemics, Cybernetics and Informatics, Hyderabad, vol. 10, pp. 247–252, 2011. [Google Scholar]
12. K. Kalaivani and G. Gandhimathi, “An efficient Bayes classification algorithm for analysis of breast cancer dataset using cross validation parameter,” Journal of Advanced Research in Computer Science and Software Engineering, vol. 5, pp. 512–515, 2015. [Google Scholar]
13. R. Ganesan, “Application of neural networks in diagnosing cancer disease using demographic data,” International Journal of Computer Applications, vol. 1, no. 26, pp. 76–85, 2010. [Google Scholar]
14. M. Othman, S. Thabit, M. Mohammed and A. Ali, “Neural network classification of white blood cell using microscopic images,” International Journal of Advanced Computer Science and Applications, vol. 8, vo.5, pp. 99–104, 2017. [Google Scholar]
15. B. Hegde, K. Prasad, H. Hebbar and B. Singh, “Comparison of traditional image processing and deep learning approaches for classification of white blood cells in peripheral blood smear images,” Biocybernetics and Biomedical Engineering, vol. 39, no. 2, pp. 382–392, 2019. [Google Scholar]
16. S. Manikandan and M. Chinnadurai, “Virtualized load balancer for hybrid cloud using genetic algorithm,” Intelligent Automation and Soft Computing, vol. 32, no. 3, pp. 1459–1466, 2021. [Google Scholar]
17. F. Vogado, M. Rodrigo, H. Flavio, R. Romuere and R. Kelson, “Leukemia diagnosis in blood slides using transfer learning in CNNs and SVM for classification,” Engineering Applications of Artificial Intelligence, vol. 72, pp. 415–422, 2018. [Google Scholar]
18. W. Ansar and T. Battacharya, “A new gray image segmentation algorithm using cat swarm optimization,” in Int. Conf. on Communication and Signal Processing, Mumbai, pp. 1004–1008, 2016. [Google Scholar]
19. D. Huang and Y. Chan, “A computer assisted method for leukocyte nucleus segmentation and recognition in blood smear images,” The Journal of Systems and Software, vol. 85, pp. 2104–2118, 2012. [Google Scholar]
20. D. Paul, N. Daw, N. Roy and A. Biswas. “An automated dual threshold band-based approach for malaria parasite segmentation from thick blood smear,” in Emerging Technology in Modelling and Graphics, Singapore: Springer, pp. 485–500, 2020. [Google Scholar]
21. N. Singh, and B. Tripathy, “Leukemia cell segmentation from microscopic blood smear image using c-mode,” in Soft Computing for Problem Solving, Singapore: Springer, pp. 225–238, 2020. [Google Scholar]
22. N. Neha, R. Gauthama Raman, R. Nivethithasomu, R. Senthilnathan and V. Shankar Sriram, “An improved feed forward neural network using salp swarm optimization technique for the design of intrusion detection system for computer network,” in Computational Intelligence in Pattern Recognition, Singapore: Springer, pp. 867–875, 2020. [Google Scholar]
23. S. Nag, N. Basu and S. Bandyopadhyay, “Application of machine intelligence in digital pathology: Identification of falciparum malaria in thin blood smear image,” in Advancement of Machine Intelligence in Interactive Medical Image Analysis, Singapore: Springer, pp. 65–97, 2020. [Google Scholar]
24. H. Kutlu, E. Avci and F. Özyurt. “White blood cells detection and classification based on regional convolutional neural networks,” Medical Hypotheses, vol. 135, pp. 109–117, 2020. [Google Scholar]
25. A. Arjmand, T. Angelis, V. Christou, T. Tzallas, G. Tsipouras et al., “Training of deep convolutional neural networks to identify critical liver alterations in histopathology image samples,” Applied Sciences, vol. 10, no. 1, pp. 42–53, 2020. [Google Scholar]
26. Y. Chai, H. Liu and J. Xu, “A new convolutional neural network model for peripapillary atrophy area segmentation from retinal fundus images,” Applied Soft Computing, vol. 86, no. 1, pp. 189–205, 2020. 105890. [Google Scholar]
27. S. Rahman, B. Azam, S. Khan, M. Awais and I. Ali, “Automatic identification of abnormal blood smear images using color and morphology variation of RBCS and central pallor,” Computerized Medical Imaging and Graphics, vol. 87, pp. 101–108, 2021. [Google Scholar]
28. S. Safuan, K. Tomari and W. Zakaria, “White blood cell (WBC) counting analysis in blood smear images using various color segmentation methods,” IEEE Materials and Measurement, vol. 116, pp. 543–555, 2018. [Google Scholar]
 | This work is licensed under a Creative Commons Attribution 4.0 International License, which permits unrestricted use, distribution, and reproduction in any medium, provided the original work is properly cited. |